


 , Jian-Mei Zhou 1,†, Yu-Hua Sun 1, Hai-Yan Yang 1, Chun-Mei Yu 1,*
 , Ke Xu 1,*
1 Department of Reproductive Medicine Center, The Affiliated Changzhou Maternal and Child Health Care Hospital of Nanjing Medical University, 213000 Changzhou, Jiangsu, China
†These authors contributed equally.
Abstract
Progesterone elevation (PE), defined as ≥0.9 ng/mL on the day of human chorionic gonadotropin (hCG) administration, is associated with significantly lower clinical pregnancy rates following fresh embryo transfer. To mitigate the risk of PE, this study aimed to develop and validate a nomogram for predict its occurrence prior to in vitro fertilization (IVF) or intracytoplasmic sperm injection (ICSI) cycles, based on baseline patient characteristics.
This retrospective study analyzed data from patients who underwent controlled ovarian stimulation using either a gonadotropin-releasing hormone (GnRH) antagonist or agonist protocol at the Reproductive Center of Changzhou Maternal and Child Health Care Hospital between January 1, 2017, and December 31, 2019. Patients were excluded for reasons such as advanced maternal age, male factor infertility, or known chromosomal abnormalities. The cohort was randomly divided into a training set (n = 1882) and a validation set (n = 807) at a 7:3 ratio to develop and validate the nomogram, respectively.
Multivariate logistic regression analysis identified the ovulation induction protocol, basal progesterone level, and body mass index (BMI) as independent predictors of PE. The resulting nomogram demonstrated good calibration and discrimination, with an area under the curve (AUC) of 0.734 (95% confidence interval [CI]: 0.713–0.754) in the training cohort and 0.732 (95% CI: 0.700–0.763) in the validation cohort. Furthermore, decision curve analysis confirmed the model’s strong clinical utility.
We developed a user-friendly nomogram incorporating the ovulation induction protocol, basal progesterone, and BMI to predict the risk of PE on the day of hCG administration. This tool provides clinicians a simple, evidence-based method to identify high-risk patients before starting their IVF/ICSI cycles, potentially enabling proactive interventions to improve pregnancy outcomes.
Keywords
- progesterone elevation (PE)
- basal progesterone
- body mass index (BMI)
- nomogram
- predictive model
Premature progesterone elevation (PE) on the day of human chorionic gonadotropin (hCG) administration has garnered significant attention due to its association with a substantial decrease—approximately 10%—in clinical pregnancy rates following fresh embryo transfer [1]. The pathophysiology of this effect remains controversial, with debate centered on whether PE primarily compromises the endometrium or the embryo. A prevailing view, supported by recent microarray studies, is that PE’s detrimental impact is mainly on endometrial receptivity rather than embryo quality, as evidenced by PE-induced changes in endometrial gene expression [2, 3, 4].
Given the significant clinical impact of PE, several preventive strategies have been proposed. The most prevalent approach is a “freeze-all” policy, with embryos cryopreserved for subsequent frozen-thawed transfer cycles [5, 6]. However, fresh embryo transfer remains the preferred option for many clinicians and patients, as it shortens the time to pregnancy and live birth. Consequently, an attractive alternative is to prevent PE from occurring during the ovulation induction process itself. To this end, some investigators have sought to identify reliable predictors of PE. While multivariable models have linked factors such as gonadotropin (Gn) dose, estradiol (E2) on hCG day, patient age and certain other factors to PE risk [7, 8], and one study identified basal progesterone as a predictor in Gonadotropin-releasing hormone (GnRH) antagonist cycles [9], a controversy remains. To date, no study has comprehensively investigated whether different ovulation induction regimens themselves are independently associated with the occurrence of PE.
Our preliminary, unpublished data revealed that P levels on the day of hCG administration differed significantly in the same patients when they underwent different ovulation induction regimens for controlled ovarian stimulation (COS). This led us to hypothesize that the choice of regimen is an independent risk factor for PE. Furthermore, the definition of PE itself is evolving; early studies have adopted a lower threshold of 0.9 ng/mL [10, 11, 12], observing detrimental effects on pregnancy rates at this level, in contrast to the traditional 1.5 ng/mL cut-off [13]. Therefore, this study aimed to develop a predictive nomogram for PE occurrence on the hCG trigger day, using this contemporary 0.9 ng/mL threshold. The model incorporates baseline indexes, including the ovulation induction regimen, to identify at-risk patients prior to in vitro fertilization (IVF) or intracytoplasmic sperm injection (ICSI) treatment.
This study was approved by the Ethics Committee of Changzhou Maternal and Child Health Care Hospital (approval no. 2025-k161-01). All data used in this study were collected from patients who underwent standard IVF treatments.
This study retrospectively included IVF/ICSI cycles performed at the Reproductive Center of Changzhou Maternal and Child Health Hospital from January 1, 2017, to December 31, 2019. The patient selection process was as follows:
Initial cohort: A total of 3618 IVF/ICSI cycles were identified.
Exclusion criteria:
(1) Cycles with failed oocyte retrieval or no oocytes obtained, missing data (n = 75).
(2) Cycles using non-standard protocols, such as minimal stimulation or natural cycles (n = 387).
(3) Cycles excluded due to advanced maternal age (n = 22), male factor infertility (n = 440), or chromosomal abnormalities (n = 5).
Final sample: After sequential exclusions, 2689 cycles were included in the final analysis.
Fresh embryo transfer was canceled if progesterone (P) was
The nomogram was built using a training cohort (n = 1882) and validated by a validation cohort (n = 807), split randomly at a ratio of 7 to 3.
The choice of ovarian stimulation protocol was individualized based on patient
age, anti-Müllerian hormone (AMH) level, antral follicle count (AFC), and
previous ovarian response. Patients with a favorable ovarian reserve (generally
defined as age
All patients received daily gonadotropins, either recombinant Follicle Stimulating Hormone (FSH) (Gonal-F; Merck Serono, Geneva, Switzerland) or human menopausal gonadotropin (hMG; 75 IU; Livzon Pharmaceutical, Zhuhai, Guangdong, China), at doses ranging from 150 to 300 IU. In the GnRHa long protocol group, pituitary downregulation was achieved with 0.1 mg of triptorelin (Decapeptyl; Ipsen, Paris, France) administered daily from cycle day 3. In the ultra-long protocol group, patients received a single 3.75 mg dose of a long-acting GnRHa (leuprorelin acetate; Lizhu Pharmaceutical Trading Co., Zhuhai, Guangdong, China) on cycle day 3. In the antagonist protocol group, gonadotropins were initiated on cycle day 3, and 0.25 mg of cetrorelix (Cetrotide®; Merck Serono, Geneva, Switzerland) was added subcutaneously from stimulation day 6 until the day of trigger.
The gonadotropin dose was adjusted based on ovarian response, as monitored by
transvaginal ultrasonography and serum estrogen (E2) levels. Final oocyte maturation was
triggered with either 5000 IU of urinary hCG or 250 µg of
recombinant hCG when at least three follicles reached a mean diameter of
Fertilization of retrieved oocytes was performed via either conventional IVF or ICSI, based on semen parameters. On day 3, cleavage-stage embryos were graded according to the number and regularity of blastomeres and the degree of fragmentation, using previously established criteria [14]; embryos of Grades I and II were defined as top-quality. Blastocysts were evaluated on day 5 using the Gardner scoring system [15], which assesses the degree of expansion and the quality of the inner cell mass and trophectoderm (Supplementary Fig. 1).
A single high-quality day 5 blastocyst was transferred for patients with a favorable uterine environment.
Serum samples were obtained on the morning of cycle day 3 and on the day of hCG trigger. Levels of FSH, luteinizing hormone (LH), E2, testosterone (T), and P were measured using a chemiluminescent immunoassay with commercially available kits (Abbott Biologicals B.V., Weesp, Netherlands). The assay performance characteristics were as follows: FSH = 0.06 mIU/mL; LH = 0.09 mIU/mL; E2 = 10 pg/mL; P = 0.1 ng/mL. Intra- and inter-assay precision rates at the relevant concentrations, expressed as coefficients of variance, were, respectively, 3.8 and 6.4% for LH, 21.0 and 12.0% for E2, and 9.6 and 11.2% for P.
Serum PE on the day of hCG administration is known to impair ongoing pregnancy
rates. While a cut-off of 1.5 ng/mL is widely used, a prior study of several
hundred fresh in vitro fertilization embryo transfer (IVF-ET) cycles
reported that even lower progesterone levels (
All statistical analyses were performed using IBM SPSS Statistics (Version 26.0;
IBM Corp., Armonk, NY, USA), Stata (Version 15.0; StataCorp, College Station, TX,
USA), and R software (version 3.6.0; http://www.r-project.org/, University of
Auckland, Auckland, New Zealand). Graphics were generated using GraphPad Prism (Version
8.0; GraphPad Software, San Diego, CA, USA). A two-sided p-value of
The normality of continuous variables was assessed using the Kolmogorov-Smirnov
test, and the homogeneity of variances was evaluated using Levene’s test.
Normally distributed data are presented as mean
A nomogram was constructed based on the multivariable logistic regression model for visual representation. The entire cohort was randomly divided into a training set (n = 1882) and a validation set (n = 807) at a 7:3 ratio. The model’s discrimination was assessed using the receiver operating characteristic (ROC) curve and the area under the curve (AUC), with values reported for both the training and validation sets. The model’s calibration was evaluated by comparing predicted probabilities with observed outcomes. The C-index was also calculated to quantify the model’s predictive accuracy. Finally, a decision curve analysis (DCA) was conducted to evaluate the clinical net benefit and utility of the model.
In this study of 2689 IVF/ICSI cycles, we performed variable selection using
univariate analysis followed by Lasso regression with ten-fold cross-validation.
From seven initially significant factors, we identified six key predictors
(number of cycles, BMI, Ovulation induction protocol (OIP), baseline P, AMH, Gn
days) and excluded AFC as a confounding variable (Table 1). The cycles were
randomly split into balanced training and validation sets at a 7:3 ratio
(p
| Variables | NPE group (n = 1316) | PE group (n = 566) | p value | |
| Age (years) | 30.36 |
30.40 |
0.835 | |
| No. of cycles | 1.13 (0.95, 1.25) | 1.24 (1.05, 1.43) | 0.038* | |
| BMI (kg/m2) | 23.21 |
22.15 |
||
| Duration of infertility (years) | 3.21 (3.05, 5.62) | 3.29 (3.08, 5.73) | 0.848 | |
| OIP, n (%) | ||||
| GnRHa long protocol | 921 (69.98) | 295 (52.12) | ||
| Ultra-long protocol | 197 (14.97) | 68 (12.01) | ||
| Antagonist protocol | 198 (15.05) | 203 (35.87) | ||
| ART, n (%) | 0.442 | |||
| ICSI | 131 (9.95) | 63 (11.13) | ||
| IVF | 1185 (90.05) | 503 (88.87) | ||
| Primary infertility, n (%) | 737 (56.00) | 329 (58.12) | 0.394 | |
| Baseline FSH (mIU/L) | 6.33 (5.41, 7.43) | 6.23 (5.40, 7.38) | 0.460 | |
| Baseline LH (mIU/L) | 5.43 (3.43, 8.22) | 5.51 (3.13, 8.37) | 0.117 | |
| Baseline E2 (pg/mL) | 31.01 (22.47, 41.48) | 32.38 (23.01, 42.85) | 0.047 | |
| Baseline P (nmol/L) | 0.53 (0.23, 1.73) | 0.82 (0.46, 1.94) | ||
| Baseline T (ng/dL) | 23.66 (16.55, 31.92) | 23.97 (15.72, 32.41) | 0.778 | |
| Baseline PRL (ng/mL) | 16.53 (12.44, 22.25) | 17.26 (12.77, 22.56) | 0.192 | |
| AMH (ng/mL) | 3.97 (2.47, 6.04) | 3.38 (2.08, 5.38) | ||
| AFC | 11.00 (8.00, 15.00) | 9.00 (7.00, 12.00) | ||
| Gn dose (IU) | 1500 (1125, 2075) | 1605 (1225, 2088) | 0.866 | |
| Gn days (days) | 9.05 |
9.45 |
||
Significance is noted at *.
OIP, ovulation induction protocol; ART, assisted reproductive treatment; PE, progesterone elevation; hCG, human chorionic gonadotrophin; P, progesterone; BMI, body mass index; GnRH, gonadotropin-releasing hormone; GnRHa, gonadotropin-releasing hormone agonist; ICSI, intracytoplasmic sperm injection; IVF, in vitro fertilization; FSH, follicle-stimulating hormone; LH, luteinizing hormone; E2, estradiol; AMH, anti-Müllerian hormone; AFC, antral follicles; Gn, gonadotropin; NPE, no progesterone elevation; No., number; T, testosterone; PRL, prolactin.
| Variable | Training set (n = 1882) | Validation set (n = 807) | p | |
| Age (years) | 30.44 |
30.66 |
0.176 | |
| Cycles (n) | 1.13 (0.52, 2.03) | 1.20 (0.48, 2.12) | 0.616 | |
| BMI (kg/m2) | 23.21 |
23.58 |
0.161 | |
| Infertility duration (years) | 3.37 (1.63, 6.23) | 3.40 (1.57, 6.73) | 0.711 | |
| OIP, n (%) | 0.980 | |||
| GnRHa long protocol | 1223 (64.98) | 524 (64.93) | ||
| GnRHa ultra-long protocol | 375 (19.93) | 163 (20.20) | ||
| GnRH antagonist protocol | 284 (15.09) | 120 (14.87) | ||
| ART, n (%) | 0.701 | |||
| ICSI | 241 (12.81) | 99 (12.27) | ||
| IVF | 1641 (87.19) | 708 (88.73) | ||
| Primary infertility, n (%) | 1035 (55.00) | 442 (54.77) | 0.915 | |
| Baseline FSH (mIU/L) | 6.30 (5.42, 7.41) | 6.29 (5.43, 7.43) | 0.513 | |
| Baseline LH (mIU/L) | 5.52 (2.93, 9.71) | 5.51 (3.03, 9.88) | 0.865 | |
| Baseline E2 (pg/mL) | 31.76 (22.07, 42.87) | 30.83 (22.06, 43.11) | 0.706 | |
| Baseline P (nmol/L) | 0.54 (0.37, 1.43) | 0.51 (0.41, 1.58) | 0.642 | |
| Baseline T (ng/dL) | 24.38 (16.45, 32.92) | 24.43 (16.38, 32.79) | 0.950 | |
| Baseline PRL (ng/mL) | 16.55 (12.44, 21.65) | 16.49 (12.34, 21.74) | 0.876 | |
| AMH (ng/mL) | 3.67 (2.44, 5.64) | 3.57 (2.42, 5.58) | 0.377 | |
| AFC | 11.00 (8.00, 15.00) | 11.00 (8.00, 14.00) | 0.764 | |
| Gn dose (IU) | 1525 (1155, 2085) | 1538 (1162, 2103) | 0.453 | |
| Gn days (days) | 9.05 |
9.03 |
0.806 | |
A total of 2689 IVF/ICSI cycles from 2332 patients were included in this study. PE was observed in 30% of these cycles. The entire cohort was then randomly divided at a 7:3 ratio into a training set (n = 1882) for model development and a validation set (n = 807) for model testing. The baseline demographic and clinical characteristics of the two sets were comparable, as detailed in Table 2.
Univariate analysis in the training set identified several factors significantly
associated with PE, including the number of previous cycles, BMI, baseline P,
AMH, AFC, Gn days, and the type of ovulation induction protocol (all p
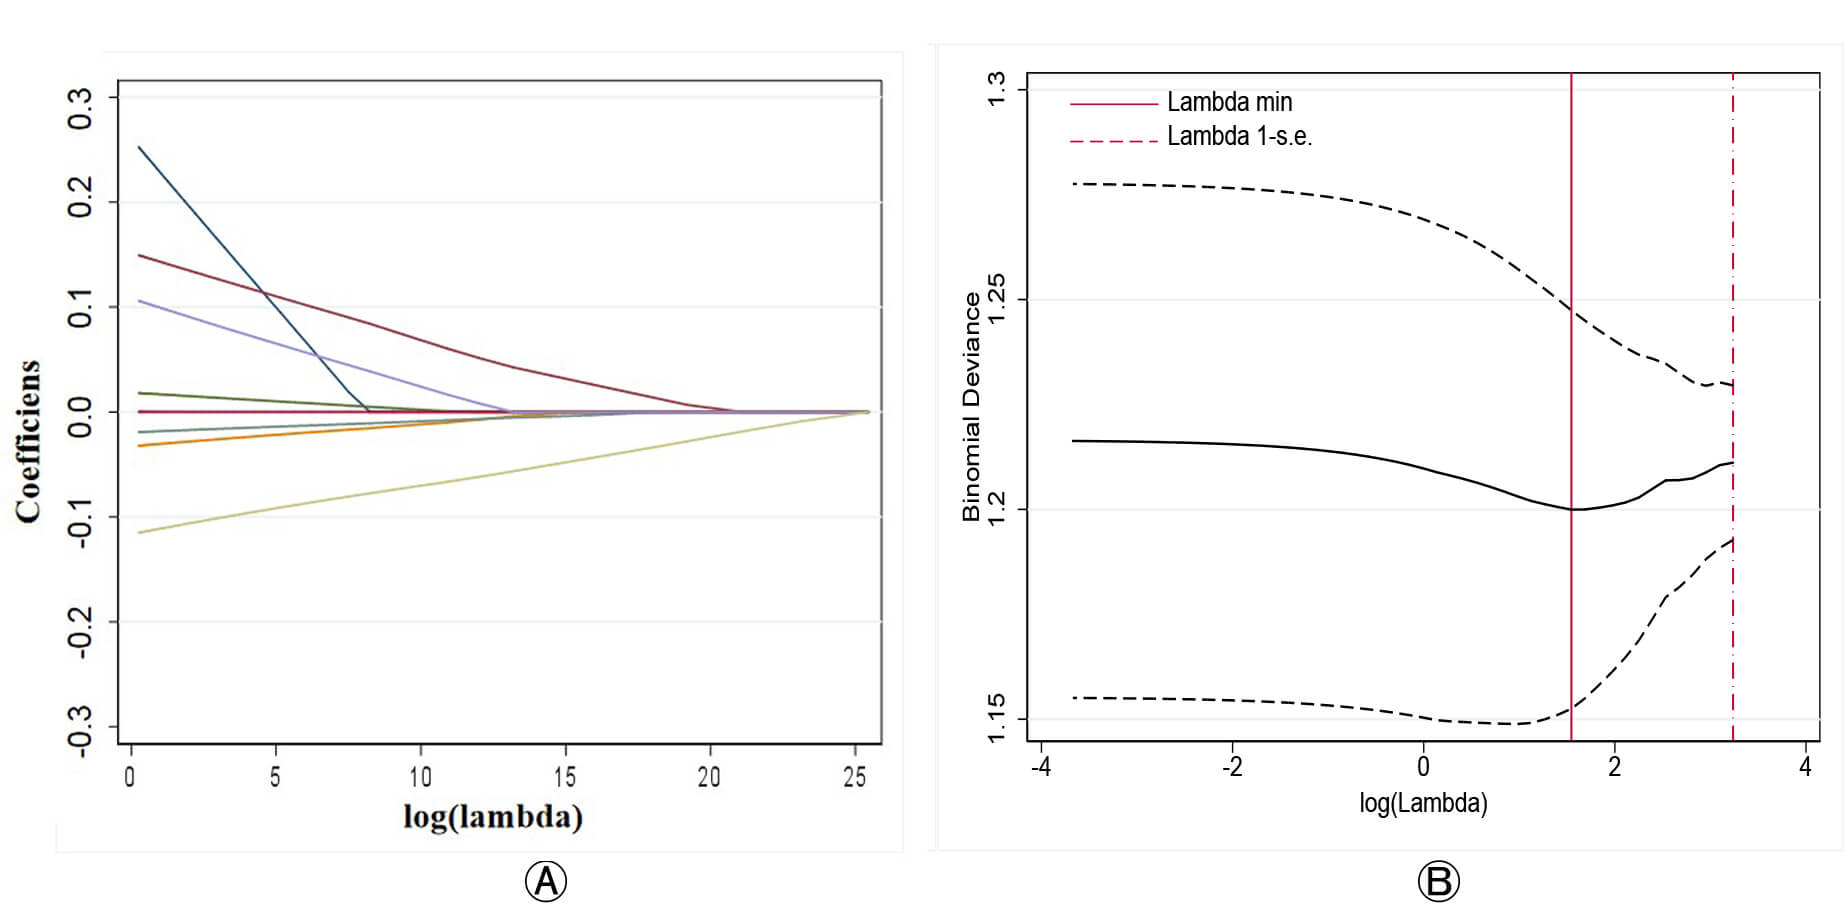 Fig. 1.
Lasso regression for variable selection in predicting PE. (A) Coefficient path plot showing the shrinkage of regression coefficients for each variable as log (lambda) increases. (B) Binomial deviance plot used to identify the optimal lambda value (lambda.min), which minimizes the cross-validated deviance.
Subsequently, a multivariable logistic regression analysis incorporating these three factors confirmed that the ovulation induction protocol, BMI, and baseline P were independent predictors of PE (Fig. 2). The regression coefficients, odds ratios (OR), 95% confidence intervals (CI), and p-values for the final model are presented in Fig. 2.
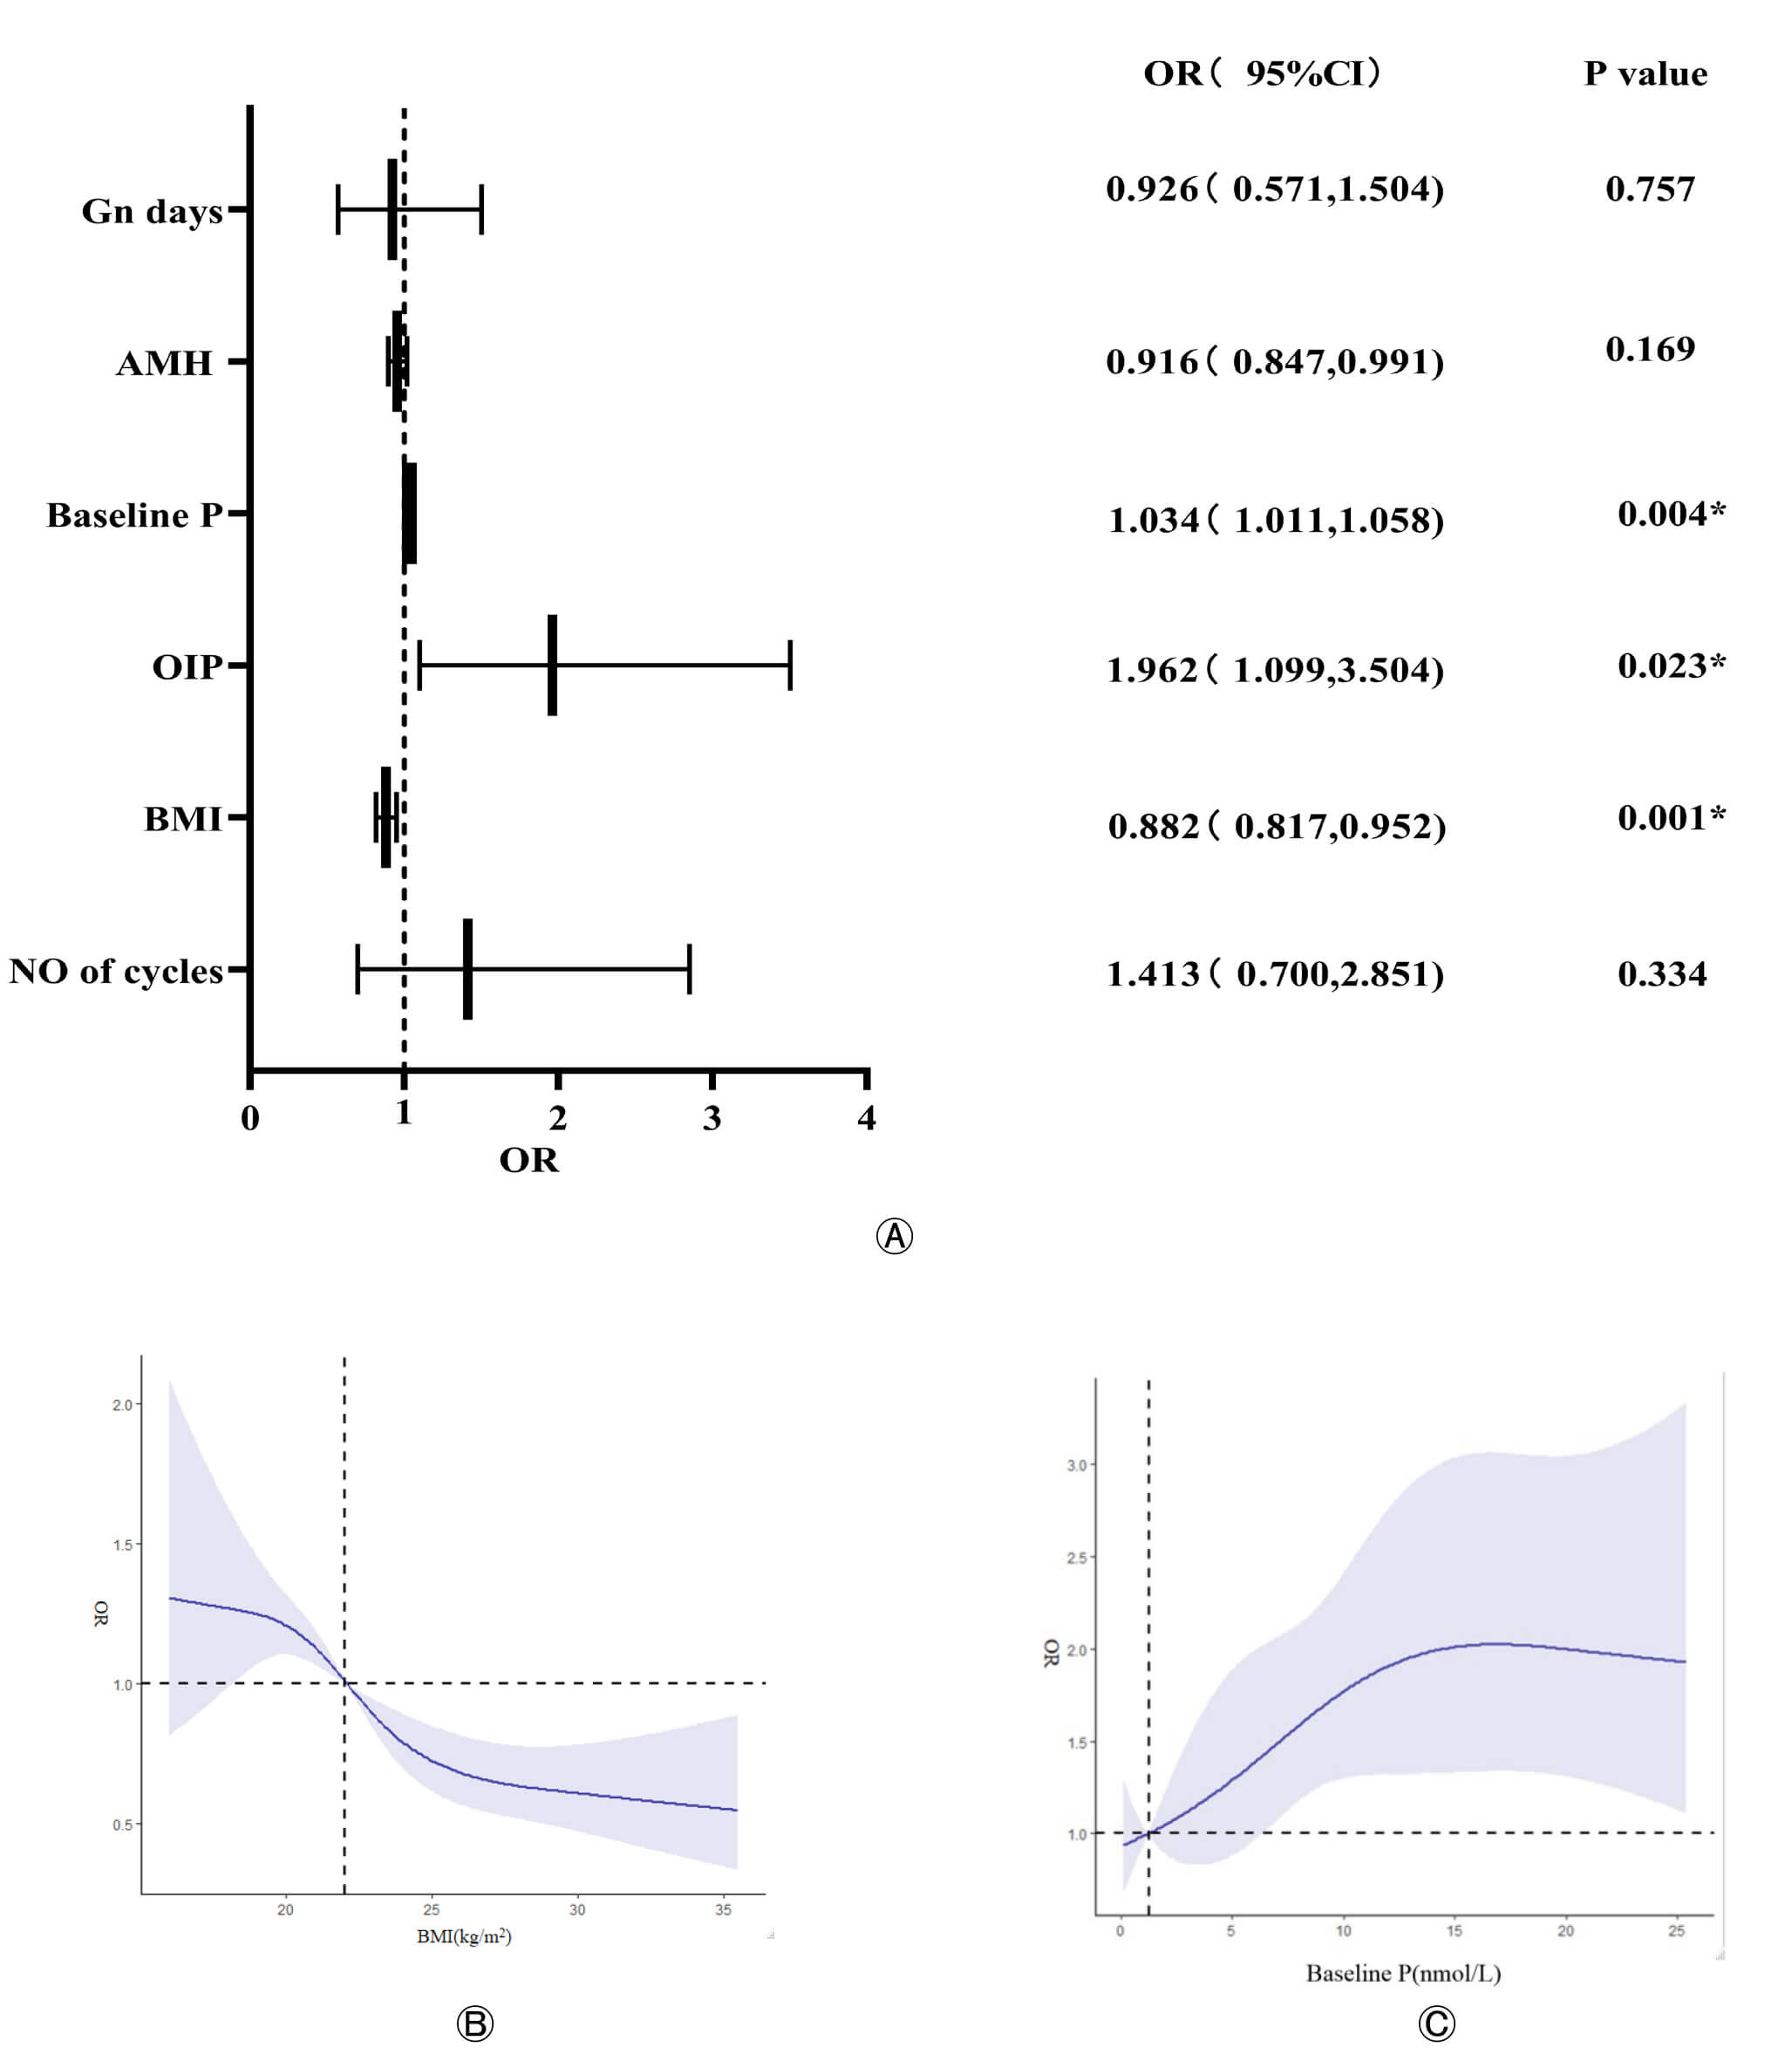 Fig. 2.
Independent predictors of PE and their dose-response
relationships. (A) Forest plot of the multivariable logistic regression analysis
showing the adjusted odds ratios (ORs) and 95% confidence intervals (CIs) for
the final predictors of PE. Univariable and Multivariable regression analyses of
the association between baseline variables and the occurrence of PE (
Dose-Response Analysis: RCS analysis was performed to visualize the relationship
between continuous variables and PE risk. The analysis revealed a non-linear
relationship between BMI and PE risk; the risk of PE significantly increased when
BMI was
A predictive nomogram was constructed based on the independent predictors identified in the multivariable logistic regression analysis (OIP, BMI, and baseline P) to estimate the individual probability of PE on the day of hCG administration (Fig. 3). Each predictor was assigned a weighted score based on its contribution to the model. By summing the scores from all three variables and locating the total on the corresponding axis, a clinician can easily determine the predicted risk of PE for an individual patient.
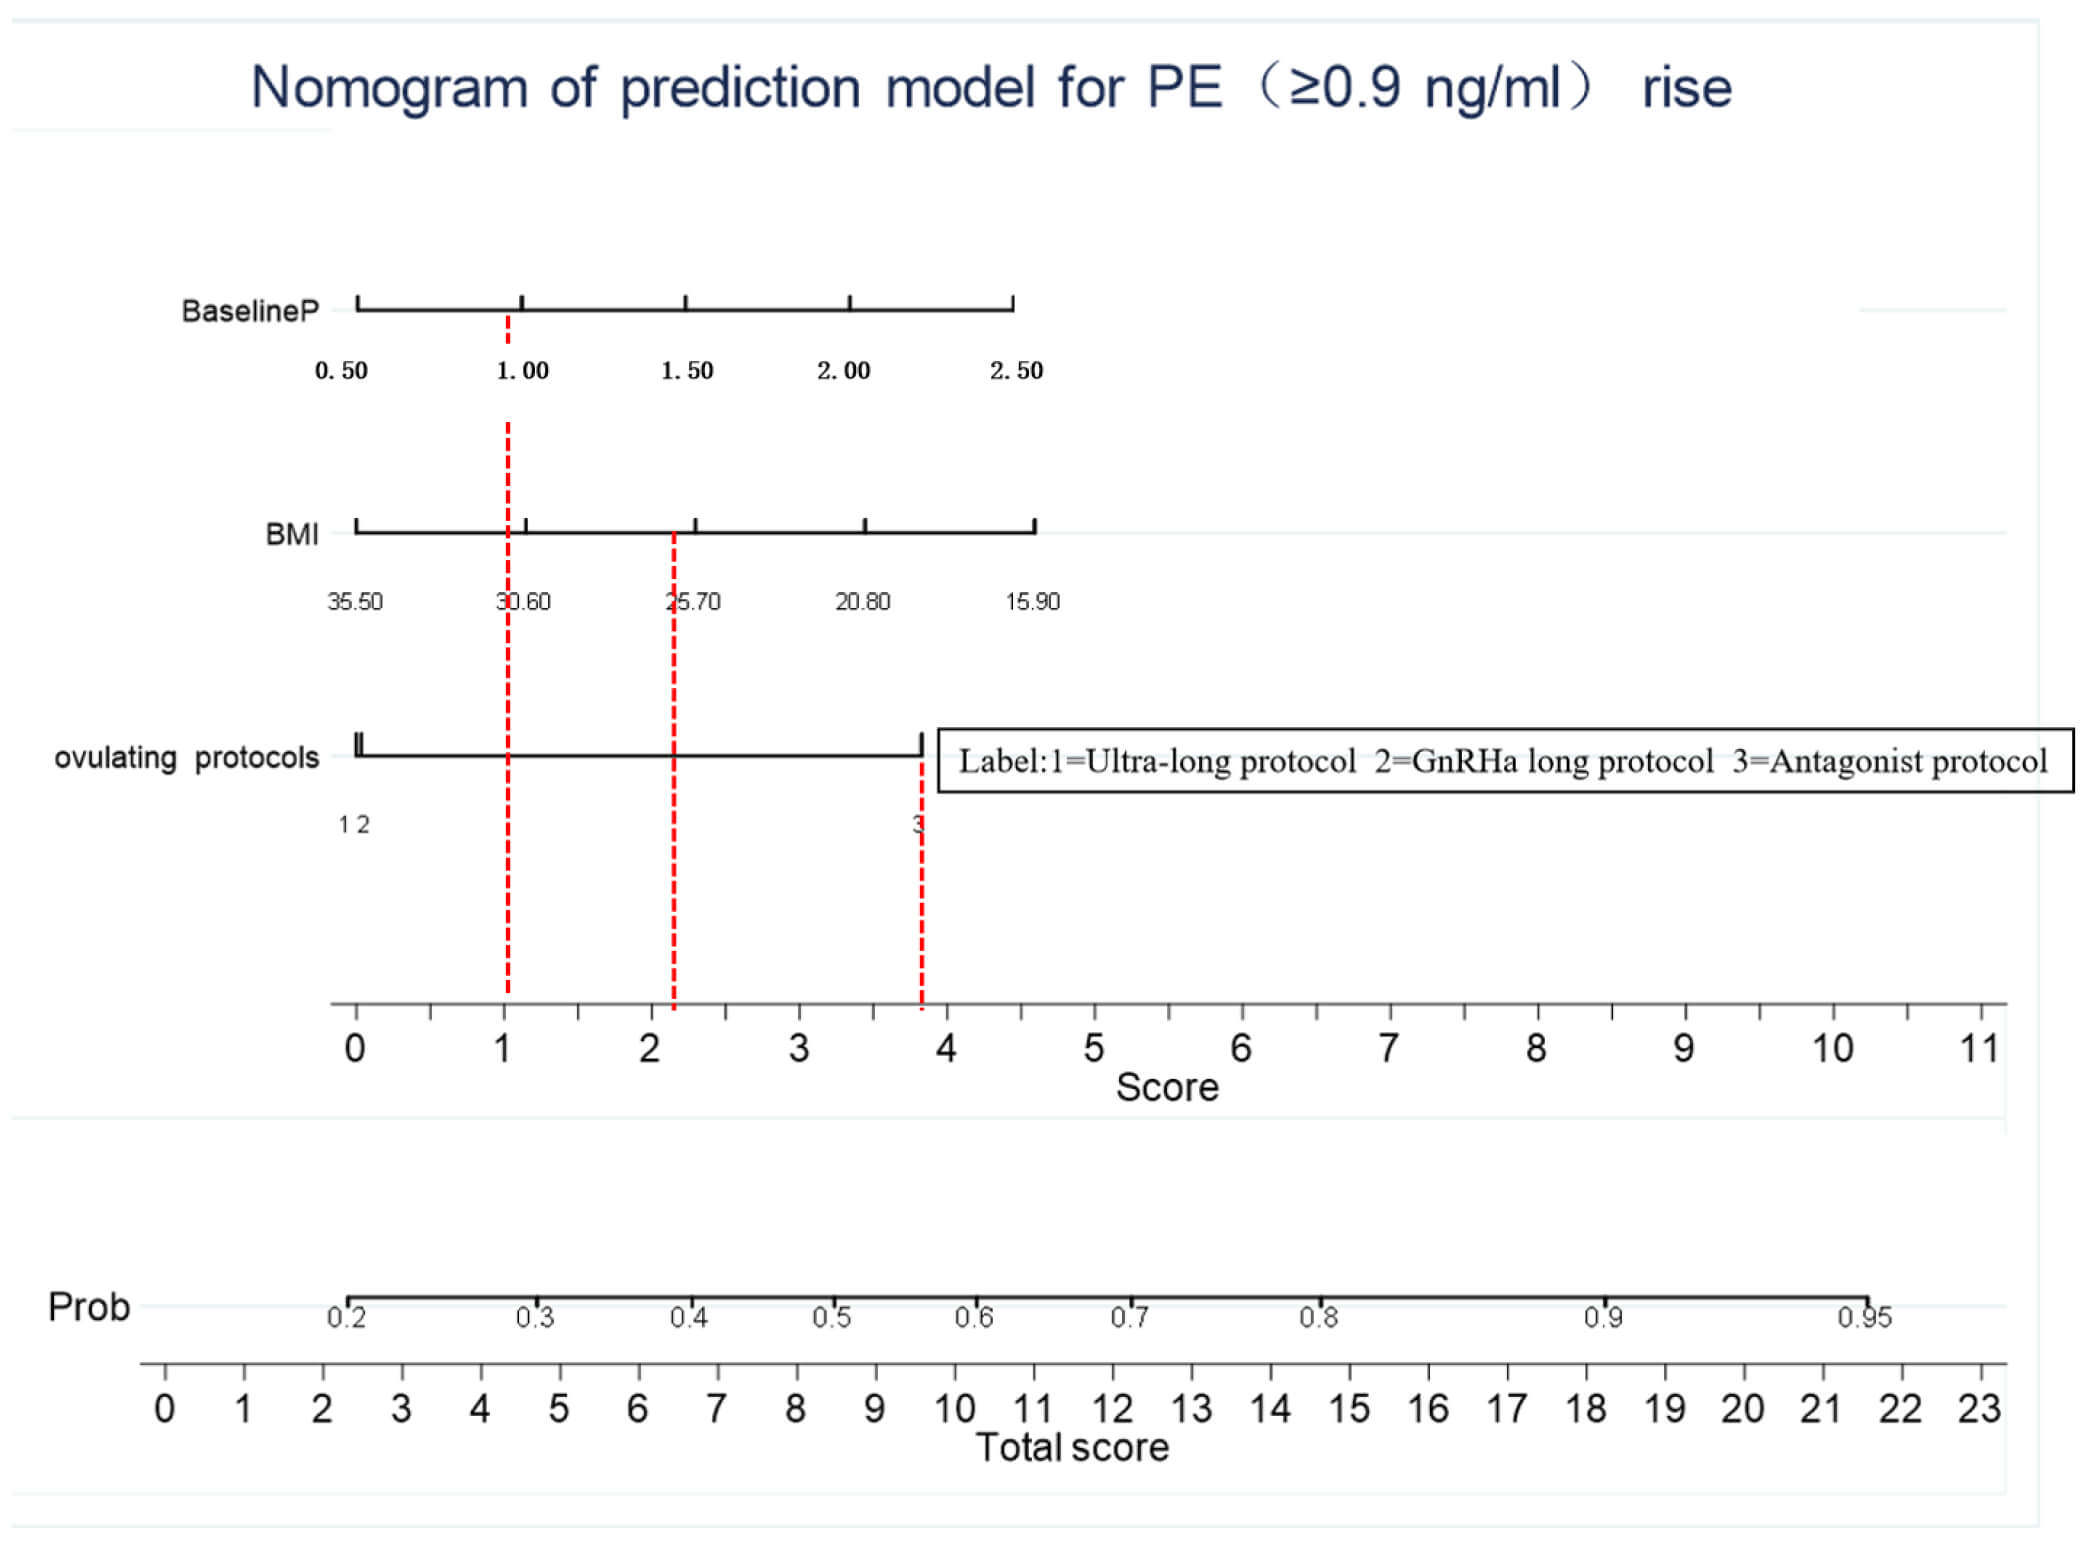 Fig. 3.
Nomogram for predicting the probability of PE on the day of hCG administration. To use the nomogram, draw a vertical line from each predictor variable (OIP, BMI, and baseline P) to the Points axis to determine the score for each variable. Sum the scores from all variables and draw a vertical line from the Total Points axis down to the Risk of PE axis to obtain the individual’s predicted probability.
The predictive performance of the nomogram was evaluated in both the training and validation cohorts. The model’s discrimination, or its ability to distinguish between patients who would develop PE and those who would not, was assessed using the ROC curve. The AUC was 0.734 (95% CI, 0.713–0.754) for the training set and 0.732 (95% CI, 0.700–0.763) for the validation set, indicating good discriminative ability (Fig. 4A,B). The model’s calibration, which reflects the agreement between predicted and observed risks, was evaluated using calibration curves, which demonstrated a satisfactory fit in both cohorts (Fig. 4C,D).
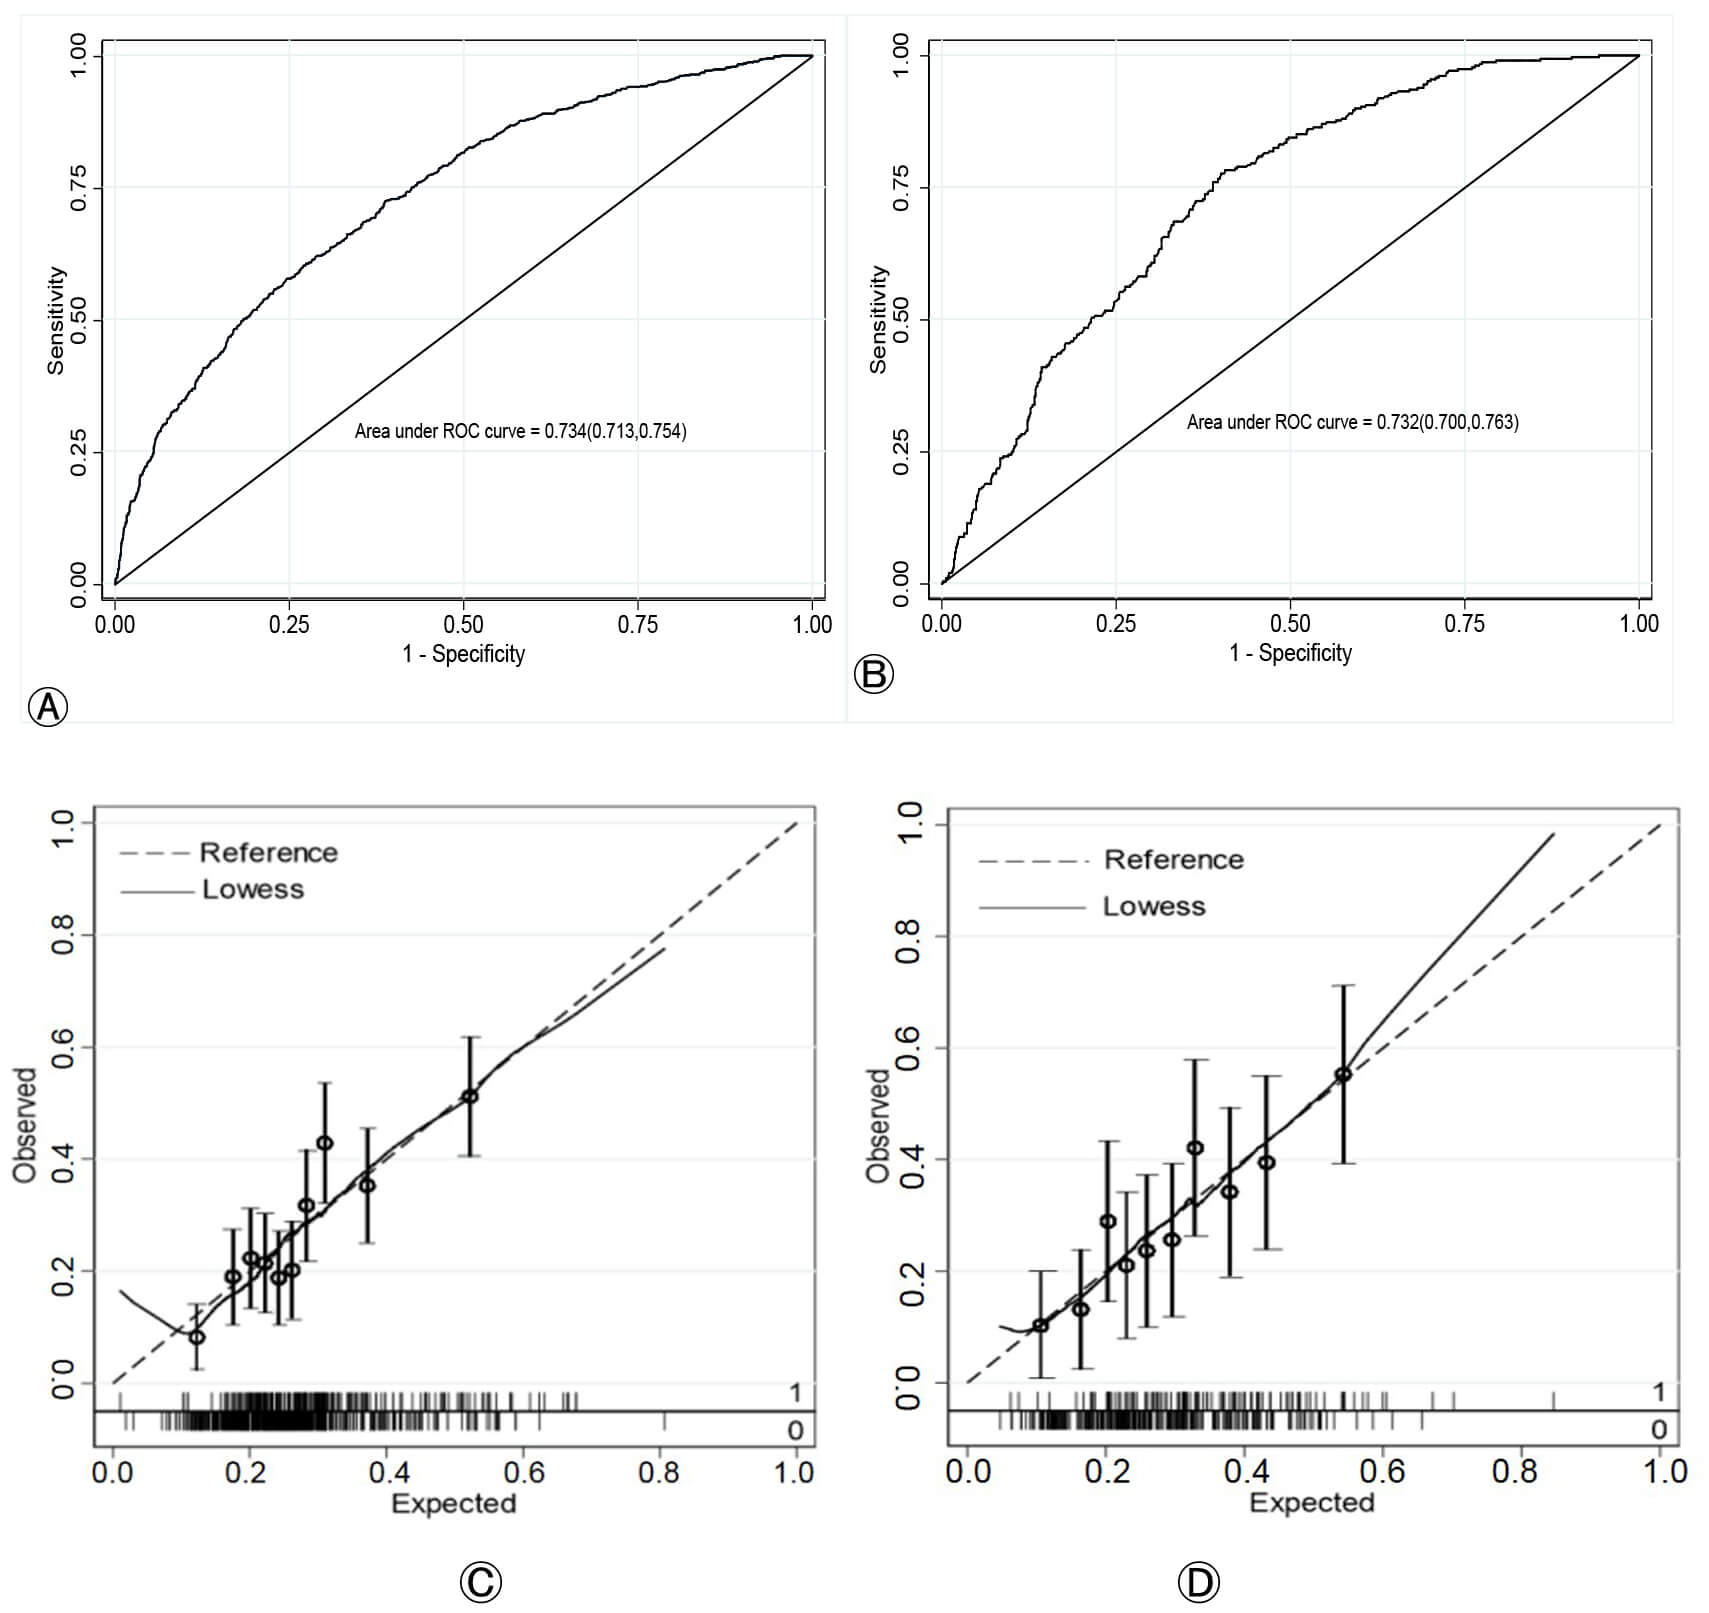 Fig. 4.
Performance evaluation of the nomogram for predicting PE. (A,B) ROC curves for the training and validation cohorts, respectively. The AUC values indicate the model’s discriminative ability. (C,D) Calibration curves for the training and validation cohorts, respectively. The dotted line represents the ideal perfect calibration, and the solid line represents the nomogram’s performance. ROC, receiver operating characteristic; AUC, area under the curve.
To evaluate the clinical utility of the nomogram, a DCA was performed. The DCA estimates the net benefit of the model across a range of threshold probabilities. In the training cohort, the nomogram provided a higher net benefit than the “treat-all” or “treat-none” strategies within a threshold probability range of 0.14 to 0.71 (Fig. 5A). This favorable net benefit was confirmed in the validation cohort across a threshold range of 0.18 to 0.68 (Fig. 5B). These results indicate that applying this prediction model in clinical practice could provide a net clinical benefit and lead to better decision-making (Fig. 5C,D).
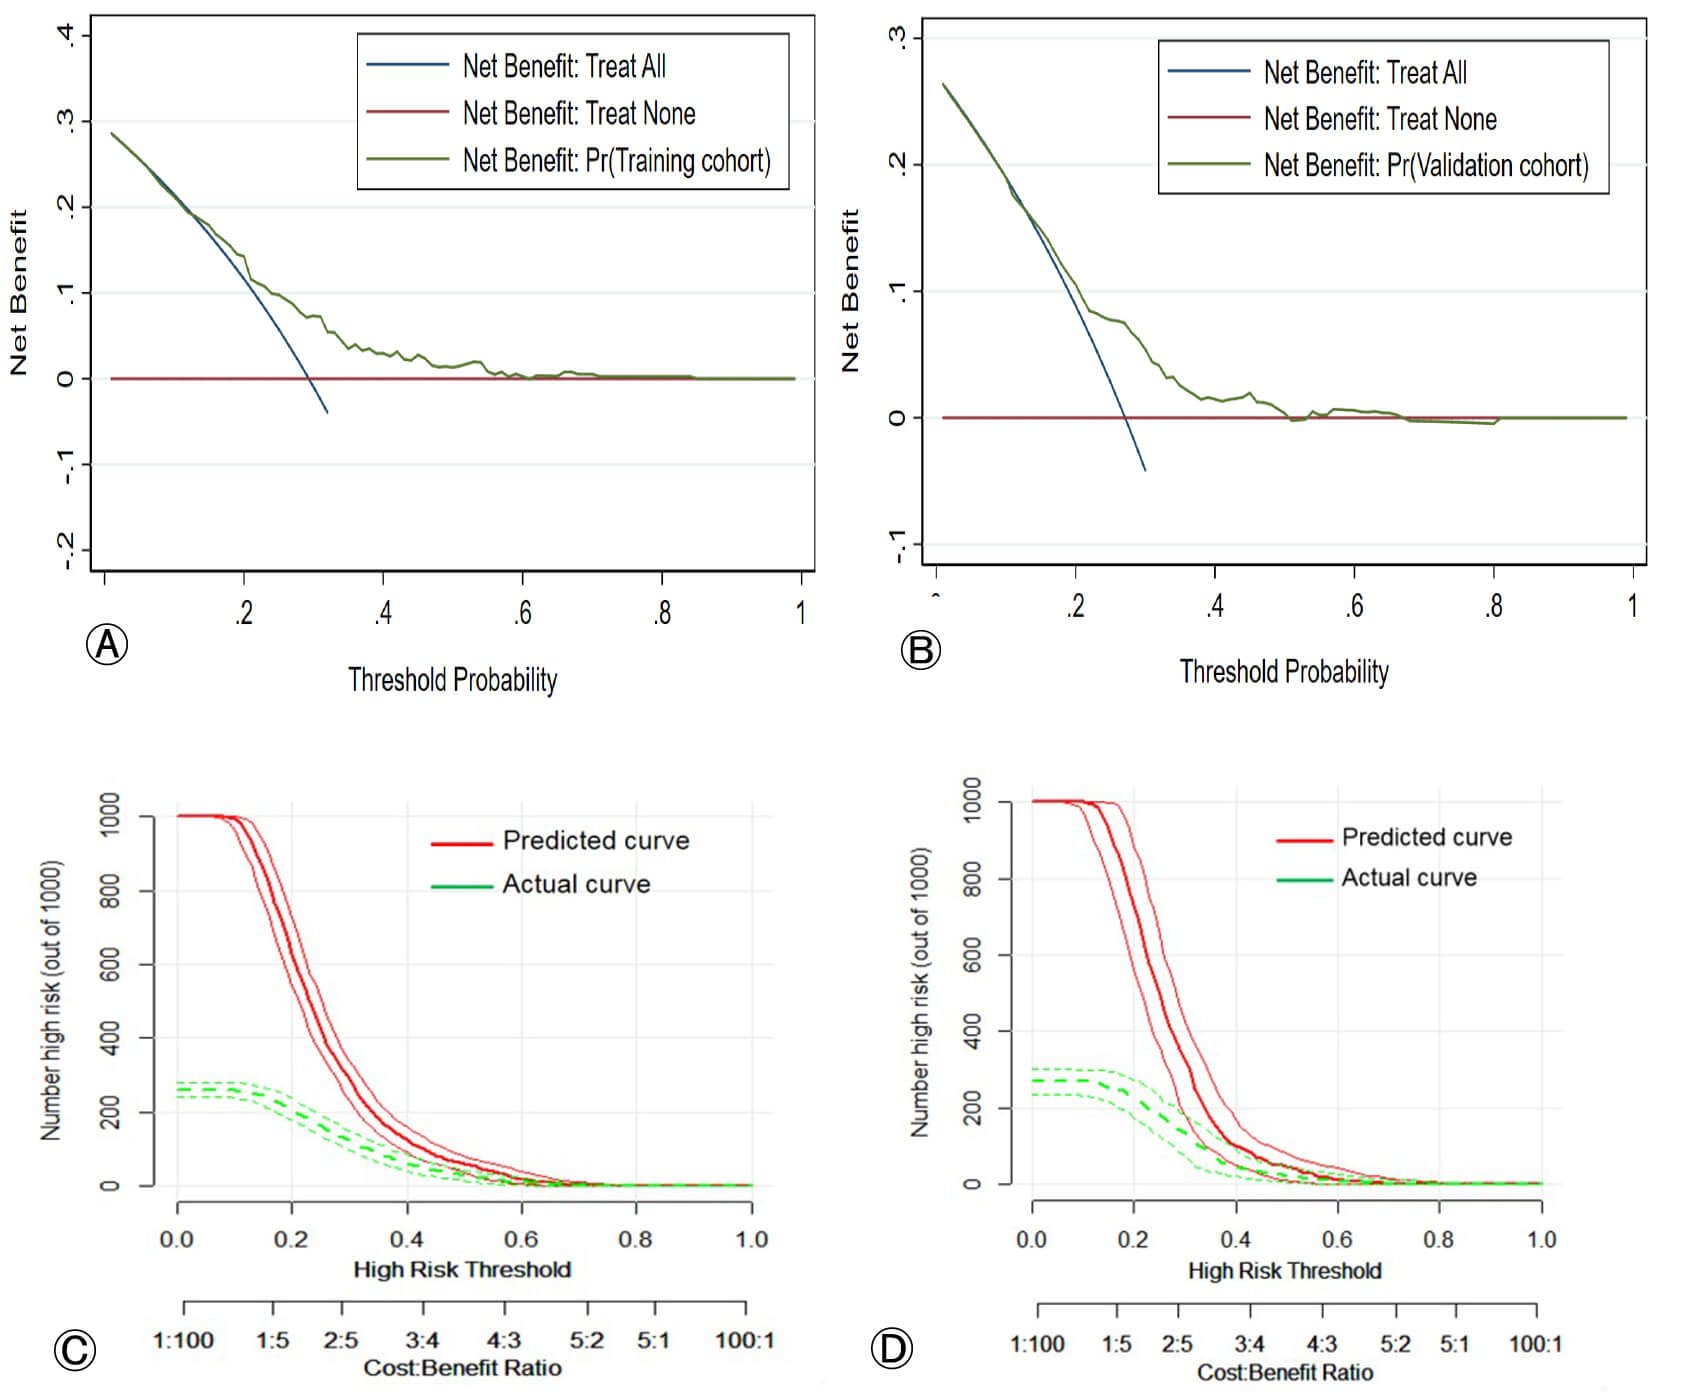 Fig. 5.
Decision curve analysis (DCA) and clinical impact curves (CIC) for the nomogram. (A,B) DCA for the training and validation cohorts, respectively. The y-axis represents the net benefit. The green line represents the nomogram. The blue line represents the intervention for all patients (Treat-All). The red line represents the intervention for no patients (Treat-None). The net benefit of the nomogram is higher than that of the Treat-All or Treat-None strategies within the indicated threshold probability range. (C,D) Clinical impact curves for the training and validation cohorts, respectively. The red curve shows the number of high-risk patients who would experience the event (PE) if the intervention were based on the nomogram’s predictions. The green curve shows the number of high-risk patients who would actually experience the event at each threshold probability.
We developed and validated a predictive model for PE on the day of hCG
administration, incorporating three key variables: the ovulation induction
regimen, BMI, and basal P level. The model demonstrated strong performance in
both calibration and discrimination. To facilitate its clinical application, we
translated the model into a user-friendly nomogram, which was confirmed to have
good clinical validity. This tool enables clinicians to easily assess a patient’s
risk of PE based on basic characteristics, allowing for proactive intervention.
For example, if a patient preparing for a fresh embryo transfer with a low BMI
(
The reported incidence of PE on the day of hCG administration in controlled ovarian hyperstimulation (COS) cycles ranges from 6% to 30% [16]. The high incidence observed in our study (30%) may be attributed to the low progesterone cut-off value used (0.9 ng/mL). To our knowledge, this is the first retrospective cohort study to investigate the association between the ovulation induction regimen and PE occurrence. We found that PE rates varied significantly between regimens, with the antagonist protocol exhibiting a markedly higher rate than the agonist protocol (51.4% vs. 24.4%). This finding is consistent with numerous studies [17, 18, 19] that have reported higher progesterone levels in antagonist protocols compared to GnRHa long protocols. One potential explanation relates to patient selection: GnRHa protocols are typically reserved for patients with high or poor ovarian response (e.g., Polycystic ovarian syndrome (PCOS)), whereas antagonist protocols are primarily used for normal responders. It has been suggested that high responders develop more dominant follicles and higher E2 levels on the hCG trigger day, which aligns with previous observations [19]. Another compelling mechanism involves endogenous LH activity. During COS, the extended downregulation of pituitary GnRH receptors by GnRHa suppresses endogenous LH. In contrast, the antagonist protocol, which omits this downregulation, allows for higher endogenous LH levels. This uninhibited LH environment promotes progesterone production [19] and is concurrent with the growth of numerous small follicles, leading to a significant rise in serum estrogen and progesterone levels.
We identified a significant association between basal P and the occurrence of premature ovulation PE on the day of hCG administration. While this predictive capacity of basal P was previously established in a study limited to the GnRH antagonist protocol (n = 1702) [9], our research confirms this finding across three different GnRH regimens in a larger dataset (n = 2689 cycles), thereby providing substantially greater statistical power. The underlying reason for this association, however, remains unclear. One initial hypothesis is that basal P primarily reflects adrenal production. In this scenario, a high baseline level, when combined with the P secreted by follicular granulosa cells during ovulation induction, would lead to a higher total serum P concentration. However, research by Fanchin et al. [20] challenges this simple additive model. They demonstrated that while adrenal suppression lowered baseline P, the net increase in P during COS remained unchanged. This finding confirms that the adrenal gland contributes to baseline levels but suggests that the subsequent rise in P and thus the occurrence of PE is driven almost exclusively by the ovarian response to exogenous gonadotropins [2]. In line with this conclusion, our study also confirmed that the total Gn dose administered and the number of mature follicles achieved were significantly associated with PE (see Supplementary Fig. 2).
BMI was another significant factor influencing the occurrence of PE. Our data revealed that patients with a low BMI were more susceptible to PE than those with a high BMI, a finding likely linked to differences in ovarian response. To understand this, it is important to consider the effects of BMI across the spectrum. Previous report indicate that patients with obesity typically require higher doses of Gn but ultimately achieve higher serum E2 levels and yield more retrieved oocytes compared to normal-BMI patients [21]. Since elevated E2 and a greater number of oocytes are associated with higher progesterone concentrations, this suggests a complex relationship. The reason why obese patients require more Gn remains unclear, but one hypothesis involves leptin. Higher BMI is associated with increased adipose tissue and, consequently, higher leptin levels. While leptin stimulates the GnRH pulse, chronically high levels may induce a state of leptin resistance, which could have an anti-gonadotropic effect, reducing the efficacy of exogenous Gn and thereby increasing the dose required for optimal follicular development [22]. Considering the sensitivity of the ovaries to Gn, patients with a lower BMI may have higher ovarian sensitivity and stronger reactivity, resulting in a greater number of follicles developing, ultimately leading to an increase in serum P levels.
It is well-established that P levels exceeding a certain threshold can reduce
the clinical pregnancy rate [1]. However, the precise target of this negative
effect, whether the embryo or the endometriumremains controversial. Our findings
help to clarify this issue: we observed that PE on the day of hCG administration
had no detrimental impact on embryo quality, but it was significantly associated
with reduced endometrial thickness (12.02
This study has several limitations. Its retrospective, single-center design and three-year data collection period introduce inherent limitations. Although we controlled for critical confounders using multivariable regression, the possibility of unknown residual confounders and associated bias cannot be entirely excluded. Furthermore, the predictive model was built on a limited set of pre-treatment variables, whereas PE is a dynamic and complex endocrine process likely influenced by additional factors. Therefore, future prospective, large-scale, multicenter trials are warranted to validate and refine our findings.
Despite these limitations, our results suggest that the nomogram we developed is
a valuable tool for predicting PE on the day of hCG administration. It can assist
clinicians and patients in making informed decisions to mitigate PE risk prior to
IVF/ICSI treatment. We have demonstrated that the key predictors of PE are a high
basal progesterone level (P
Firstly, this is a retrospective study. Although many statistical methods were employed, it is difficult to completely avoid confounding factors. Secondly, this is a single-center data spanning over three years. Although the sample size is over 2000, it is still relatively limited. Finally, PE is a complex endocrine process, and there may be key influencing factors that we have not yet discovered. Further research is needed to uncover these factors.
In this study, we developed an objective and accurate nomogram to predict the risk of PE on the day of hCG administration. This tool offers a novel and user-friendly method for clinicians to assess patient risk by evaluating key factors such as basal P and BMI. By identifying high-risk patients, the nomogram can guide the selection of appropriate ovulation induction regimens and inform adjustments to the Gn dose, with the ultimate goal of preventing PE. However, large-scale, multicenter clinical trials are warranted to provide more robust evidence to support our findings.
hCG, human chorionic gonadotrophin; PE, progesterone elevation; CI, confidence interval; Gn, gonadotropin; E2, estradiol; IVF, in vitro fertilization; ICSI, intracytoplasmic sperm injection; COS, controlled ovulation stimulation; BMI, body mass index; AMH, anti-müllerian hormone; AFC, antral follicle count; LH, luteinizing hormone; T, testosterone; DCA, decision curve analysis; CIC, clinical impact curve.
The datasets generated and analyzed during the current study are not publicly available due to institutional and patient confidentiality policies, but are available from the corresponding author upon reasonable request.
KX, L-RZ and C-MY contributed in the conception and design; J-MZ, Y-HS and H-YY contributed in statistical analysis. All authors contributed to editorial changes in the manuscript. All authors read and approved the final manuscript. All authors have participated sufficiently in the work and agreed to be accountable for all aspects of the work.
The study and the protocols used were approved by the Ethics Committee of the Changzhou Maternal and Child Health Care Hospital (2025-k161-01). All patients sighed informed consent forms. All data used in this study were collected from patients that underwent standard IVF treatments. The study was carried out in accordance with the guidelines of the Declaration of Helsinki.
This study was supported by the Affiliated Changzhou Maternal and Child Health Care Hospital. We thank the members of the IVF Unit of the Affiliated Changzhou Maternal and Child Health Care Hospital.
This work was supported by the Basic & Applied Research Project of Changzhou, China (grant number CJ20179049) and the Special Fund for Clinical Research of Chinese Medical Association (grant number CMCC202206).
The authors declare no conflict of interest.
Supplementary material associated with this article can be found, in the online version, at https://doi.org/10.31083/CEOG46145.
References
Publisher’s Note: IMR Press stays neutral with regard to jurisdictional claims in published maps and institutional affiliations.