


 , Xiaoyi Bai 2, Yulu Lin 3, Zhaoyi Guo 1, Youdan Hu 4, Jun Xiong 1, Jianli Li 1, Sifan Zeng 1, Yuchen Chen 1, Zhuohuan Cai 1, Li Zhou 1, Peng Sun 1,*
1 Department of Laboratory Medicine, Maternity and Child Healthcare Hospital of Nanshan District, 518000 Shenzhen, Guangdong, China
2 Department of Gynaecology, Guangdong Provincial People’s Hospital (Guangdong Academy of Medical Sciences), Southern Medical University, 510080 Guangzhou, Guangdong, China
3 Faculty of Chinese Medicine Science, Guangxi University of Chinese Medicine, 530222 Nanning, Guangxi, China
4 School of Public Health, Sun Yat-sen University, 510000 Guangzhou, Guangdong, China
Abstract
Fetal growth restriction (FGR) is a common pregnancy complication and a major contributor to increased perinatal morbidity and mortality. Our previous studies have shown that the mannose-6-phosphate receptor (M6PR) is significantly upregulated in the placenta of cases of selective FGR (sFGR). This study aimed to evaluate the M6PR levels in maternal serum during pregnancy as a novel biomarker for predicting FGR and its subtypes.
From an established prospective pregnancy cohort, we selected 256 singleton pregnancies with FGR and 233 matched controls for analysis. Serum samples collected during gestation were analyzed for M6PR levels using MILLIPLEX® human cytokine magnetic bead panels. Receiver operating characteristic (ROC) analysis assessed the predictive value of M6PR.
The log10 multiples of the median (MoM) of M6PR were significantly lower in the FGR group than in the control group during the third trimester, with an area under the ROC curve (AUC) of 0.736. When FGR was divided into early-onset and late-onset groups in the third trimester, the log10 MoM of M6PR was significantly lower in the early-onset FGR group compared to the control group, with an AUC of 0.723. Similarly, the log10 MoM of M6PR was significantly lower in the late-onset FGR group than in the control group, with an AUC of 0.645.
M6PR concentrations declined significantly during the third trimester, suggesting that M6PR may serve as a novel biomarker for predicting FGR. Integrating M6PR with existing biomarkers has been shown to enhance overall predictive accuracy, supporting timely clinical interventions.
Keywords
- M6PR
- serum biomarker
- fetal growth restriction
- prediction
Fetal growth restriction (FGR) represents a significant obstetric challenge, affecting approximately 5–10% of pregnancies worldwide [1, 2]. It is diagnosed when a fetus fails to reach its inherent growth potential, most commonly defined as an estimated fetal weight below the 10th percentile for gestational age (GA) [3]. FGR is associated with a range of adverse perinatal outcomes, including higher risks of perinatal mortality, neonatal intensive care unit (NICU) admission, and long-term neurodevelopmental impairment (NDI).
The etiology of FGR is multifactorial, characterized by a complex interplay of maternal, fetal, and placental factors [1, 2, 4]. Maternal conditions such as hypertension, preeclampsia, malnutrition, and chronic underlying diseases can compromise placental function, leading to insufficient nutrient and oxygen delivery to the fetus. Fetal factors, including chromosomal abnormalities and congenital anomalies, also contribute to the development of FGR. Placental insufficiency, which disrupts the exchange of nutrients and gases, is widely recognized as the primary mechanism underlying FGR [2].
Current clinical practices for predicting FGR predominantly rely on routine fetal ultrasonography, including measurements of fetal biometry and Doppler assessments of uterine and umbilical arteries [5]. However, the accuracy of this method is influenced by factors such as maternal obesity, inaccurate estimation of GA, and operator subjectivity, which can lead to significant diagnostic errors. As a result, 75% of cases of idiopathic FGRs (IFGRs) go undetected until delivery, and the detection rate among low-risk pregnant women is only 15%. Limitations of ultrasound in predicting FGR also include operator dependency, limited sensitivity in low-risk populations, and relatively high false-positive rates. In recent years, several studies have shown that maternal serum biomarkers, such as pregnancy-associated plasma protein A (PAPP-A) and placental growth factor (PIGF), may also serve as predictors of FGR [6, 7, 8, 9]. Although these biomarkers provide some predictive value, their use alone in clinical settings remains constrained by insufficient sensitivity and specificity, and none of these measures can accurately predict FGR in the first trimester.
Recently, interest has increased in identifying novel biomarkers that allow timely interventions for mitigating adverse outcomes. In this context, the mannose-6-phosphate receptor (M6PR) has emerged as a promising candidate. M6PR is a multifunctional protein involved in several physiological processes, including lysosomal enzyme trafficking, insulin-like growth factor II (IGF-II)-mediated growth regulation, and modulation of signaling pathways critical for cellular function [10]. Emerging evidence suggests that M6PR plays a pivotal role in placental development and function, potentially influencing fetal growth trajectories [6, 11]. Zygmunt et al. [12] suggested that IGF-II/M6PR promotes the invasion of trophoblast cells into the uterus.
In a previous study, we performed RNA sequencing (RNA-seq) on five pairs of monochorionic diamniotic twins with selective FGR (sFGR) and three pairs of monochorionic diamniotic twins with normally grown fetuses (controls). The analysis revealed a significant upregulation of M6PR in the placental tissue of the sFGR group, suggesting a potential association between M6PR and sFGR. Since M6PR in the placenta can be released into the maternal blood, it may become a potential biomarker for the diagnosis of FGR and fetal monitoring [11]. Based on the role of M6PR in regulating placental function and our previous findings, the present study aimed to evaluate maternal serum M6PR levels during pregnancy as a potential predictive biomarker for FGR.
This study was a prospective cohort study. We identified and followed pregnant women who underwent first-trimester pregnancy screening for Down syndrome at the Maternity and Child Healthcare Hospital of Nanshan District in Shenzhen, Guangdong Province, China, from November 2021 to November 2022, until delivery. Within this established prospective pregnancy cohort, 256 cases of FGR were identified, and 233 controls were randomly selected from cohort members without the condition. In first trimester (from 8+0 to 13+6 weeks), the study included a total of 131 FGR cases and 126 control. In the second trimester (from 15+0 to 20+6 weeks), it included 93 FGR cases and 85 control cases, and in the third trimester (from 28+0 weeks to delivery), it included 32 FGR cases and 22 control cases.
According to the American College of Obstetricians and Gynecologists (ACOG)
guidelines [13], FGR was defined as estimated fetal weight (EFW) or
abdominal circumference (AC) below the tenth percentile for gestational
age (GA) reference standards [14]. Subsequently, we followed the consensus
definition of the International Society of Ultrasound in Obstetrics and
Gynecology (ISUOG), and classified FGR as early-onset FGR (
| FGR parameters | ||
| Early-onset FGR ( |
Any of the following: | |
| AC | ||
| EFW | ||
| UtA Doppler velocimetry with absent end-diastolic flow | ||
| Or | ||
| AC or EFW | ||
| Combined with either of the following: | ||
| UtA-PI | ||
| UA-PI | ||
| Late-onset FGR ( |
Any of the following: | |
| AC | ||
| EFW | ||
| Or 2 of the following: | ||
| AC or EFW | ||
| AC or EFW crossing centile | ||
| UA-PI | ||
| CPR | ||
AC, abdominal circumference; EFW, estimated fetal weight; ISUOG, International Society of Ultrasound in Obstetrics and Gynecology; UA, umbilical artery; UtA, uterine artery; CPR, cerebroplacental ratio; PI, pulsatility index; FGR, fetal growth restriction.
The research involving human participants strictly adhered to the ethical guidelines established by the institutional and national research committees, as well as the 1964 Helsinki Declaration and its subsequent revisions. The study was approved by the Institutional Research Review Board of the Maternity and Child Healthcare Hospital of Nanshan District. All participants provided written informed consent. Patient confidentiality was rigorously maintained throughout the study. This study fully complies with established journal policies and procedures, ensuring that all aspects of the research and publication process were conducted appropriately.
The clinical data collected included maternal age, weight, height, gravida, parity, GA at blood collection, GA at birth, mode of conception, mode of delivery, Apgar score, neonatal sex and weight, and admission to the NICU. Body mass index (BMI) was calculated as weight (in kilograms) divided by height2.
Blood samples were collected by venipuncture into serum separator tubes, allowed to clot at room temperature for 30 minutes, and then centrifuged at 3000 × g for 10 minutes. Serum was aliquoted and stored at –80 ℃ until analysis. Maternal serum M6PR levels were quantified using the MILLIPLEX® MAP Human Cytokine Magnetic Bead Panel (MilliporeSigma, Burlington, MA, USA) according to the manufacturer’s instructions. Briefly, each serum sample was appropriately diluted and incubated with a pre-mixed panel of fluorescently labeled magnetic beads conjugated to specific antibodies against M6PR. After washing to remove unbound proteins, a detection antibody was added, followed by streptavidin-phycoerythrin (SAPE) conjugate for signal amplification. Then, the bead-bound complexes were analyzed using a Luminex® 200 system (Luminex Corporation, Austin, TX, USA), and data were acquired using MILLIPLEX® Analyst software. To account for gestational age-related variations, M6PR concentrations were expressed as log10 multiples of the median (MoM). This normalization allows for the comparison of biomarker levels across different gestational ages and mitigates potential confounding effects.
Statistical analyses were performed with the use of R, version 4.2.2 (R Foundation for Statistical Computing, Vienna, Austria). The normality of continuous variables was assessed with the Shapiro-Wilk test. Measurement data followed a normal distribution. A t-test was used for comparisons between two groups, while analysis of variance (ANOVA) was employed for comparisons among multiple groups. Non-normally distributed measurement data were represented as median (interquartile range), and the Kruskal-Wallis test was used for group comparisons, with subsequent pairwise comparisons conducted using the Mann-Whitney U test (with Bonferroni correction). Categorical variables were expressed as frequencies and percentages and compared using the chi-square test or Fisher’s exact test, as appropriate.
Receiver operating characteristic (ROC) curve analysis was used to evaluate the ability
of M6PR to discriminate between early-onset and late-onset FGR.
The area under the ROC curve (AUC) was calculated, and optimal cutoff values were
determined based on the Youden index. Logistic regression models were constructed to assess the
independent predictive value of M6PR, adjusting for potential confounders such as maternal age, BMI,
and GA at sample collection. p-value of
The study included 233 control pregnant women. FGR consisted of 131 cases in the first trimester,
93 cases in the second trimester, and 32 cases in the third trimester. M6PR concentrations were
log10-transformed for subsequent analyses to approximate a normal distribution. We then
examined whether M6PR concentration was affected by maternal characteristics such as GA, maternal BMI,
and maternal age. We compared maternal age, maternal BMI, GA at sampling, and NICU admission in the control group.
All p-values of the four groups exceeded 0.05, indicating no statistically significant
differences among the groups. No differences in maternal age, maternal BMI, GA, or NICU admission
were observed among the four groups. However, among these four groups, maternal height (median 159.5, 157.5, 158, 157.8
cm, p
| Control (n = 233) | The first trimester FGR (n = 131) | The second trimester FGR (n = 93) | The third trimester FGR (n = 32) | p-valuea | ||
| Maternal age (years) | 31 (27.0–34.0) | 30 (27.0–33.0) | 30 (27.0–33.0) | 30 (25.8–32.3) | 0.601 | |
| Maternal BMI (kg/m2) | ||||||
| At the first trimester | 21.1 (19.4–23.0) | 20.7 (19.2–22.4) | 21.0 (19.1–22.6) | 20.9 (18.5–23.3) | 0.364 | |
| At the second trimester | 21.5 (19.8–23.6) | 21.1 (19.6–23.0) | 21.2 (19.6–23.1) | 21.5 (19.7–23.9) | 0.736 | |
| At the third trimester | 26.0 (24.5–27.9) | 25.7 (24.0–27.9) | 25.6 (24.0–27.3) | 26.6 (25.2–28.7) | 0.311 | |
| Maternal height (cm) | 159.5bc (156.0–163.5) | 157.5 (153.00–160.25) | 158 (154.0–160.5) | 157.8 (155.0–160.0) | ||
| Gestational age (weeks) | ||||||
| At the first trimester | 12.5 (12.3–12.7) | 12.4 (12.3–12.7) | 12.5 (12.3–12.7) | 12.4 (12.1–12.8) | 0.961 | |
| At the second trimester | 16.4 (16.1–17.0) | 16.6 (16.3–17.0) | 16.6 (16.1–17.0) | 16.6 (16.2–16.8) | 0.734 | |
| At the third trimester | 39.8 (39.0–40.3) | 39.0 (38.1–39.9) | 39.4 (38.9–39.9) | 39.4 (38.9–39.9) | 0.390 | |
| Parity | ||||||
| Nulliparous | 112 (48.07%) | 87 (66.41%) | 69 (74.19%) | 20 (62.50%) | ||
| Multiparous | 121 (51.93%) | 44 (33.59%) | 24 (25.81%) | 12 (37.50%) | ||
| Method of conception | ||||||
| Spontaneous | 161 (69.10%) | 125 (95.42%) | 90 (96.77%) | 32 (100.00%) | ||
| IVF | 72 (30.90%) | 6 (4.58%) | 3 (3.23%) | 0 | ||
| Mode of delivery | ||||||
| NSD | 149 (63.94%) | 99 (75.57%) | 70 (75.27%) | 24 (75.00%) | ||
| CS | 78 (33.48%) | 27 (20.61%) | 21 (22.58%) | 8 (25.00%) | ||
| AVD | 6 (2.58%) | 5 (3.82%) | 2 (2.15%) | 0 | ||
| Neonatal gender | ||||||
| Female | 106 (45.49%) | 43 (32.82%) | 51 (54.84%) | 16 (50.00%) | ||
| Male | 127 (54.51%) | 88 (67.18%) | 42 (45.16%) | 16 (50.00%) | ||
| Birthweight (g) | 3280 (3050.0–3540.0)bcd | 2660 (2495.0–2785.0) | 2610 (2400.0–2700.0) | 2575 (2500.0–2697.5) | ||
| Birthweight Z score | 0.62 (–0.25 to 1.46)bcd | –1.89 (–2.28 to –1.315)b | –2.22 (–2.66 to –1.82)c | –2.18 (–2.46 to –1.94)c | ||
| NICU admission | 6 (2.6%) | 1 (0.8%) | 1 (1.1%) | 0 | 0.736 | |
a p value of the Kruskal-Wallis test for overall comparison. b,c,d Post hoc Mann-Whitney U test with Bonferroni correction (p
In the control group, M6PR levels increased slightly during the first trimester, remained stable during the second trimester, and decreased significantly during the third trimester. These patterns indicated that M6PR expression was significantly affected by GA, with a marked decline observed in the late pregnancy (Fig. 1).
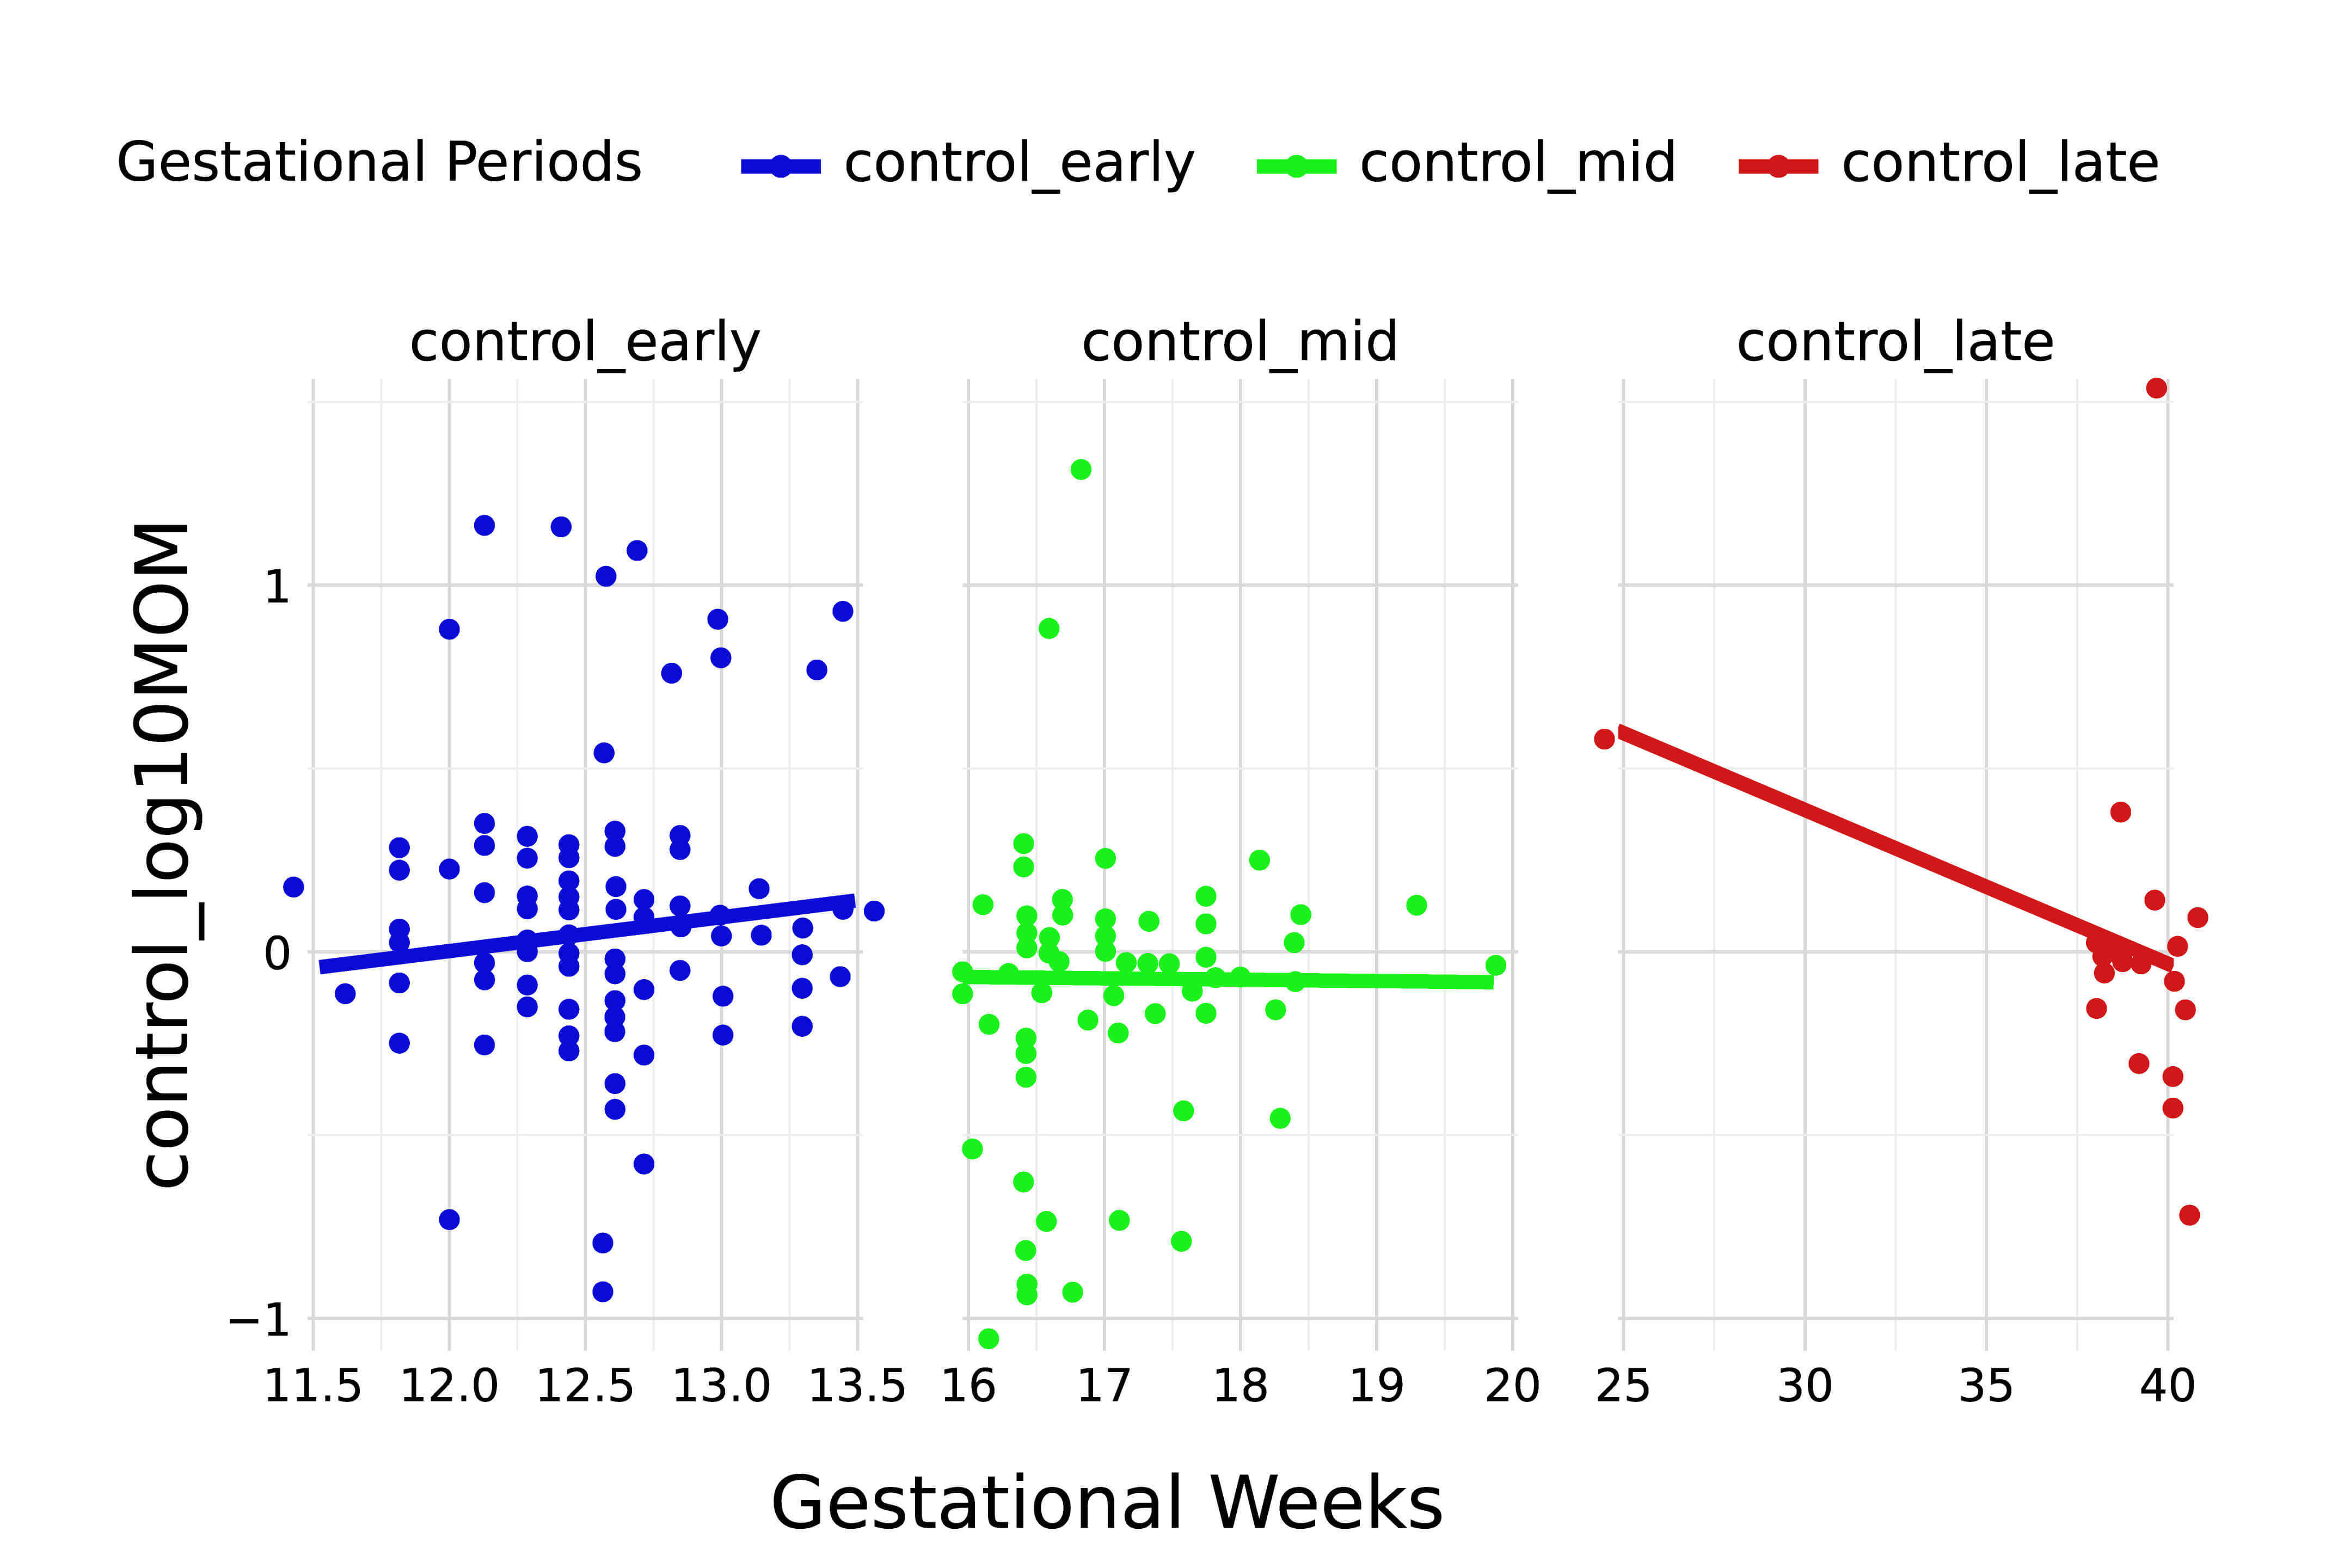 Fig. 1.
Trend of M6PR log𝟏𝟎 MoM values across GA in the control group. Blue circles represent samples from the first trimester (1+0 to 13+6 weeks), green circles indicate samples from the second trimester (15+0 to 20+0 weeks), and red circles represent samples from the third trimester (22+0 weeks to delivery). MoM, multiples of the median; M6PR, mannose-6-phosphate receptor; GA, gestational age.
M6PR levels were compared across the four groups (control and FGR in the
first, second, and third trimesters) using the Kruskal-Wallis test, which
revealed a statistically significant difference among the groups. These
results indicate that at least one group differed significantly from the others.
To further clarify which groups were significantly different,
pairwise comparisons were performed with Bonferroni correction. The results
showed significant differences between the third trimester FGR group
and the control group (p
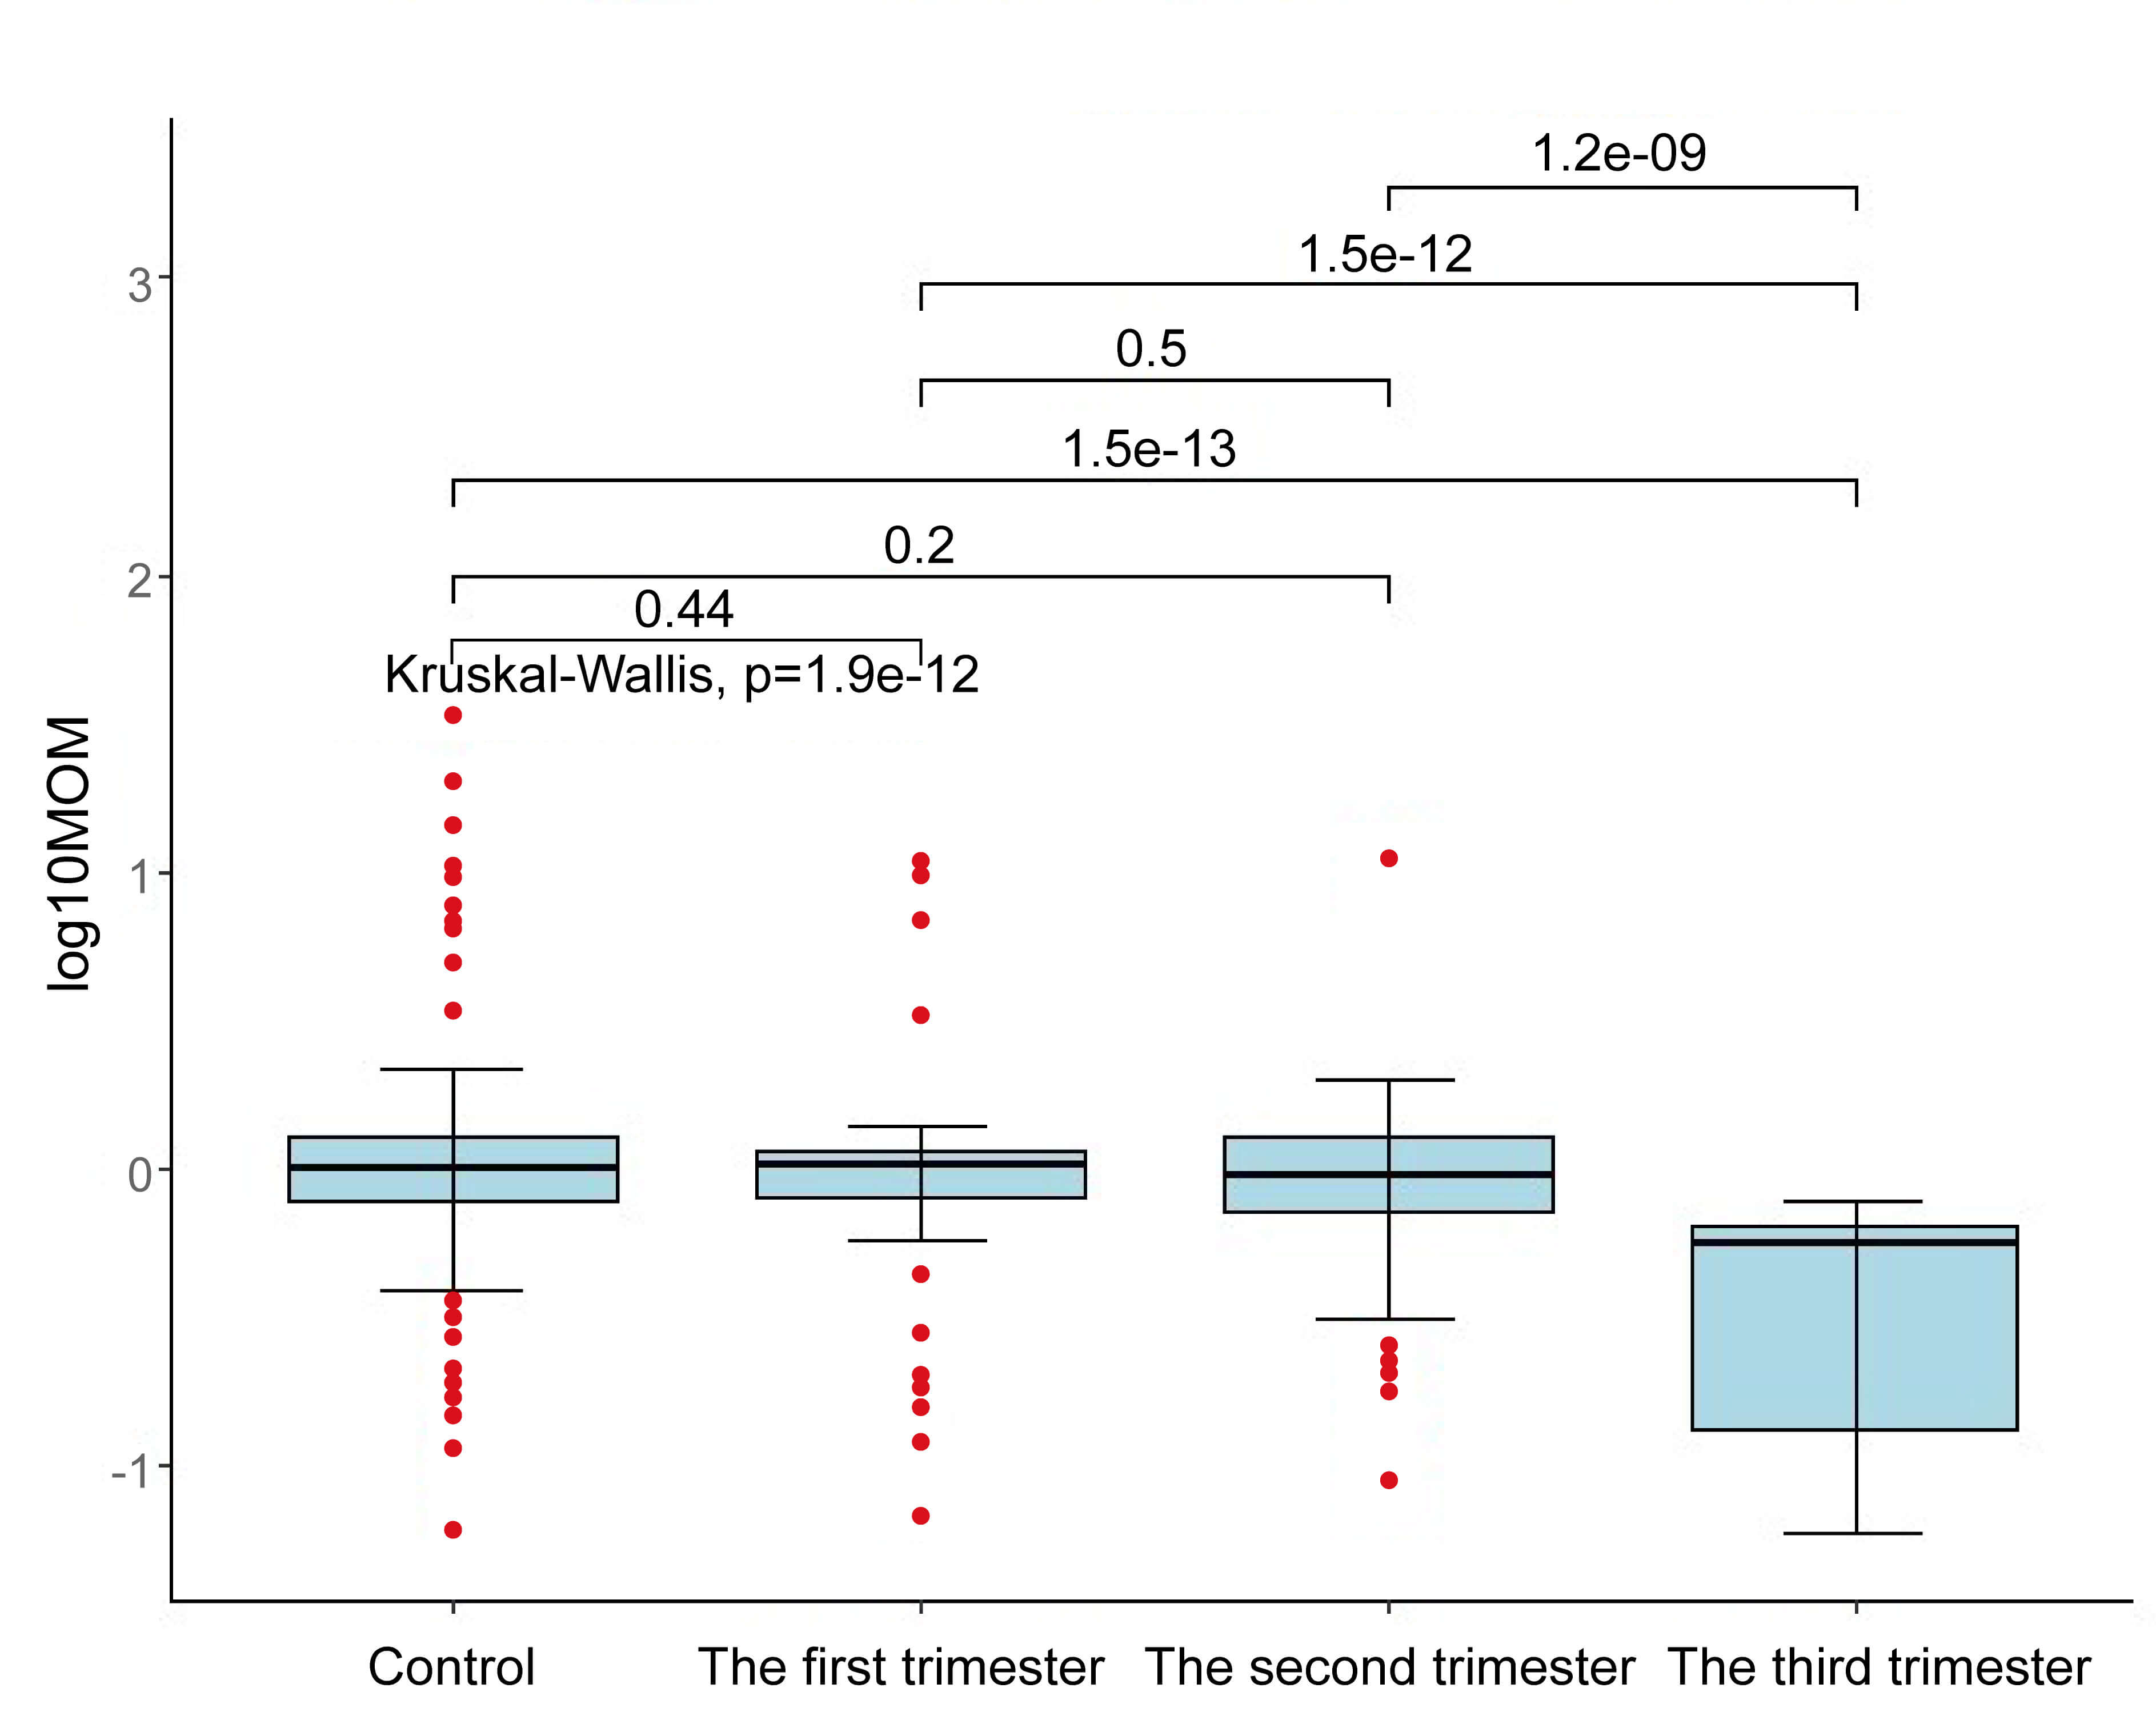 Fig. 2.
Comparison of M6PR concentrations at different stages of pregnancy.
Based on the observed difference in M6PR levels between the third trimester group and
the control group, we further compared the third trimester FGR group with the third
trimester control group. Data from three groups of controls, early-onset FGR, and
late-onset FGR were compared by Kruskal-Wallis test. The test results showed that
there were statistical differences among the three groups, suggesting that the overall
distribution of the three groups of data was significantly different (p
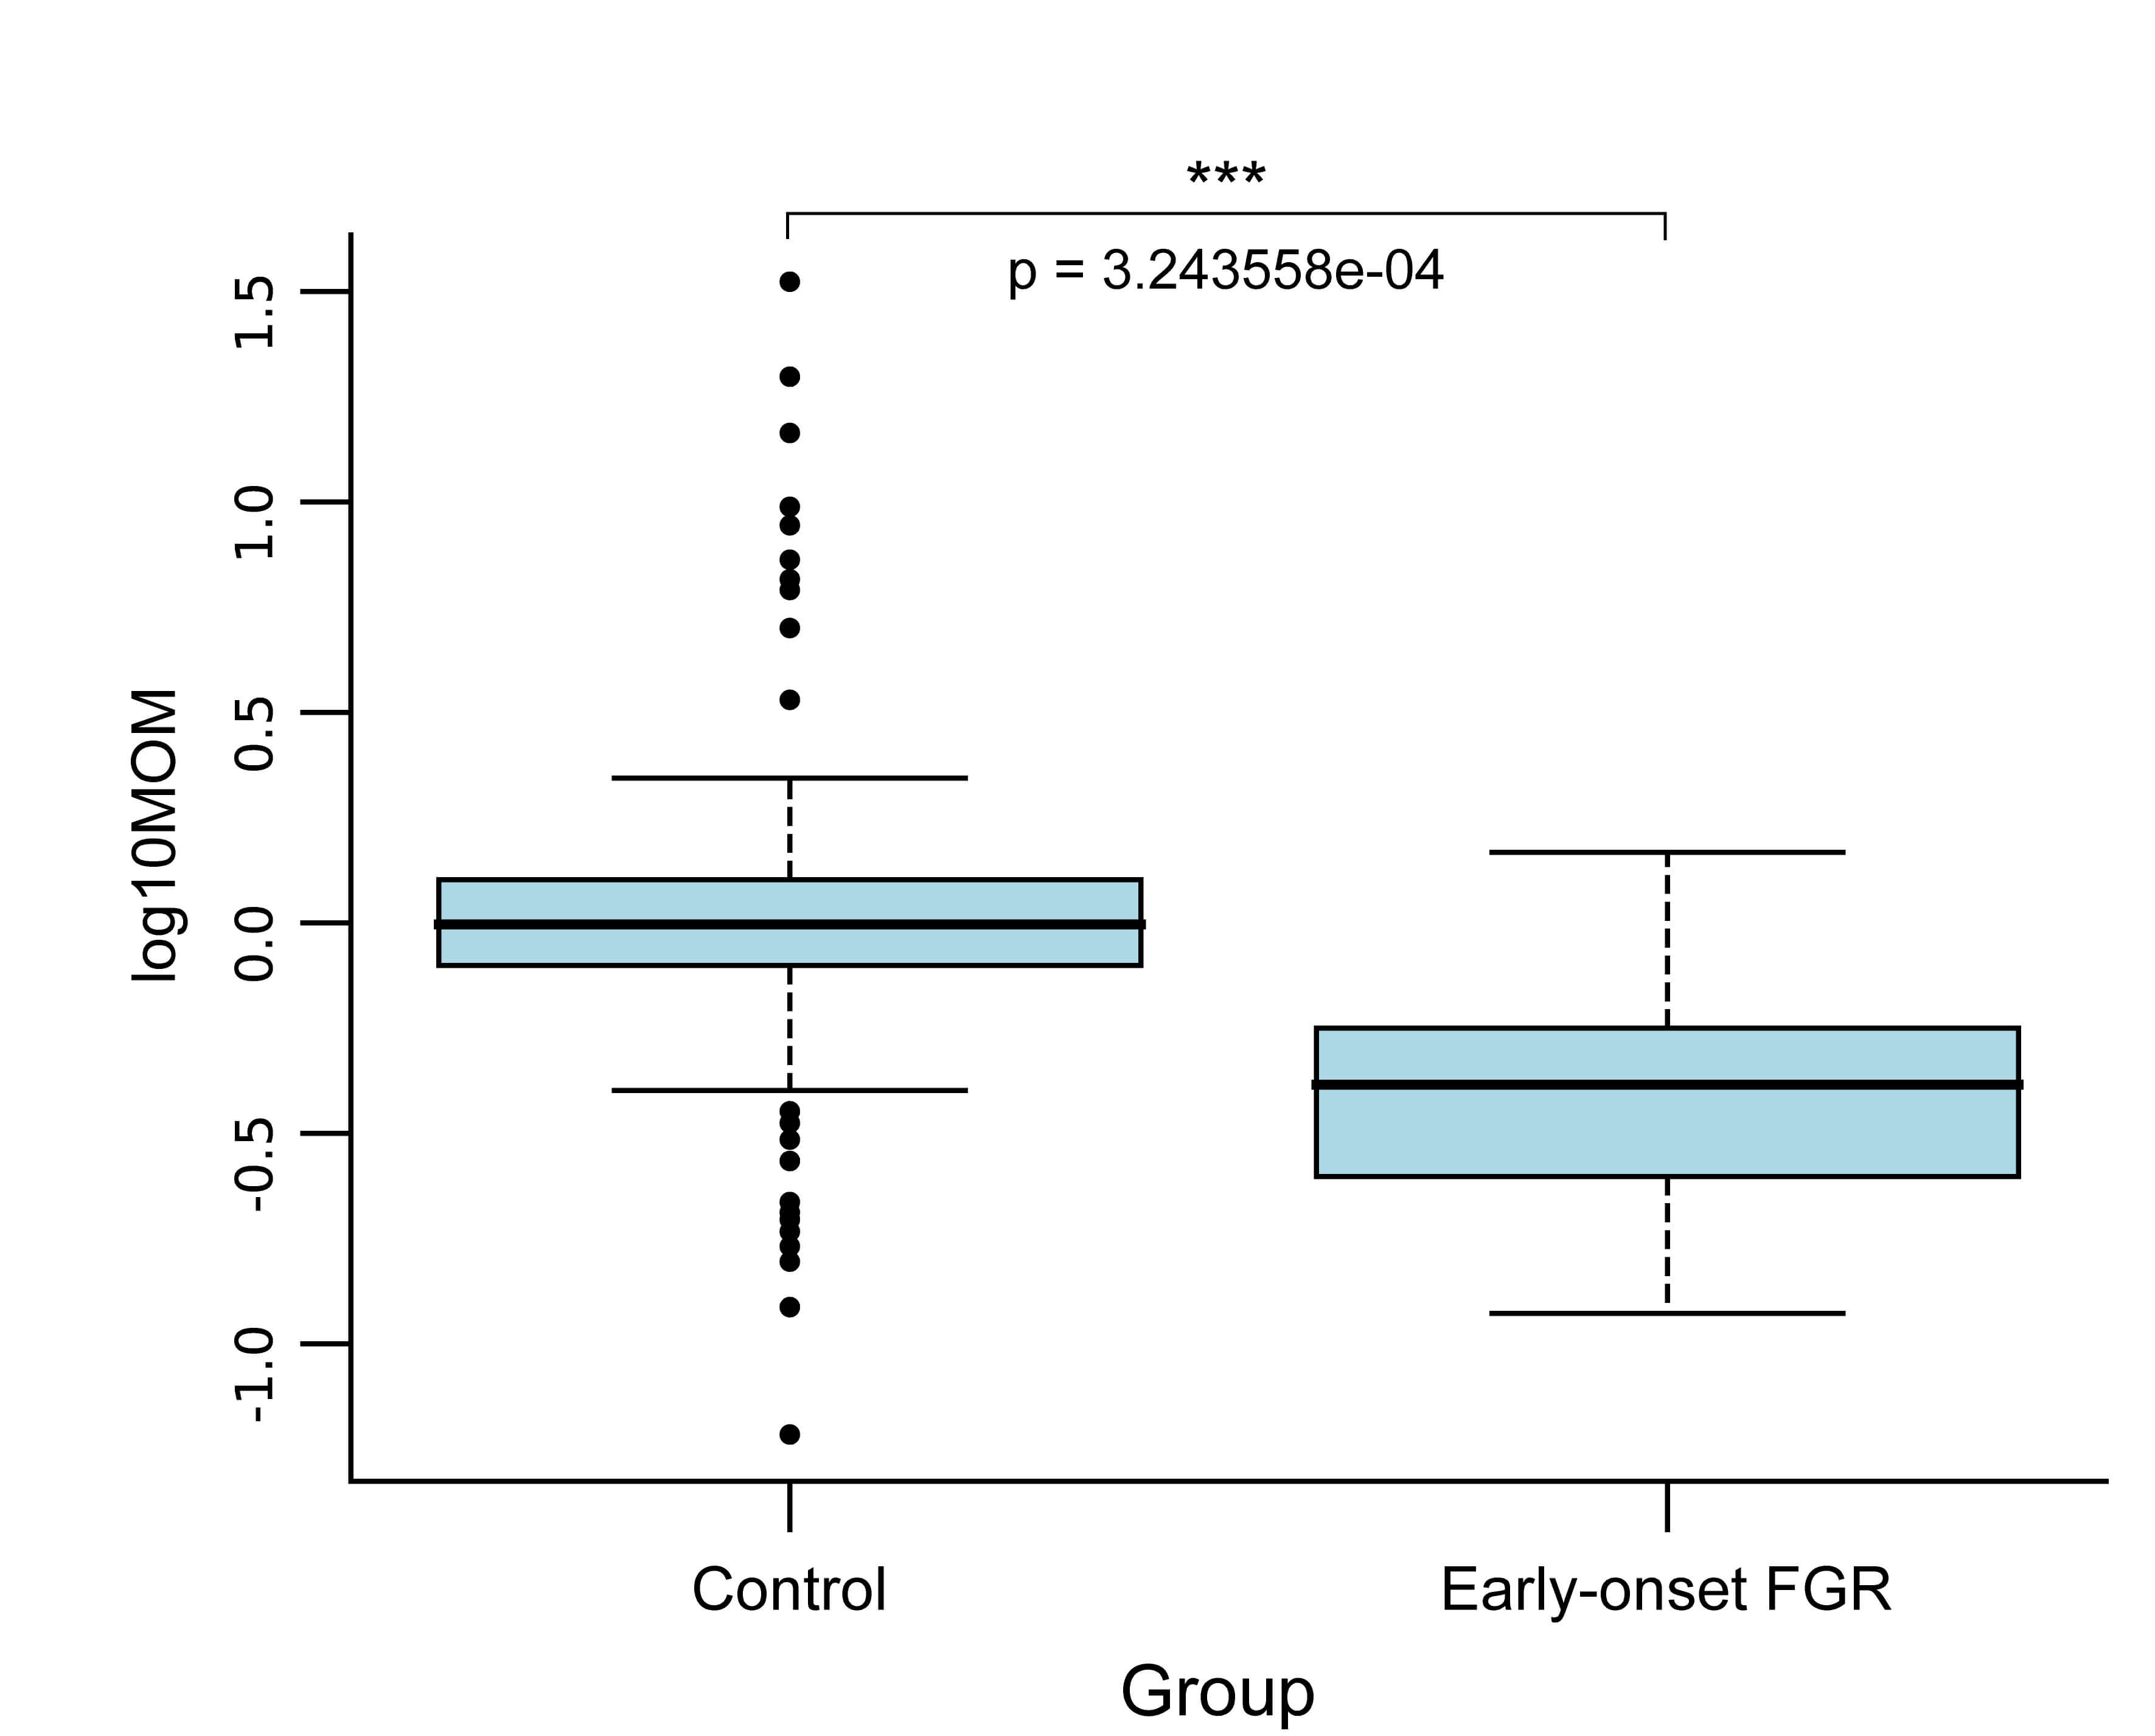 Fig. 3.
Comparison of M6PR concentration between the control group and the early-onset FGR. ***p < 0.001.
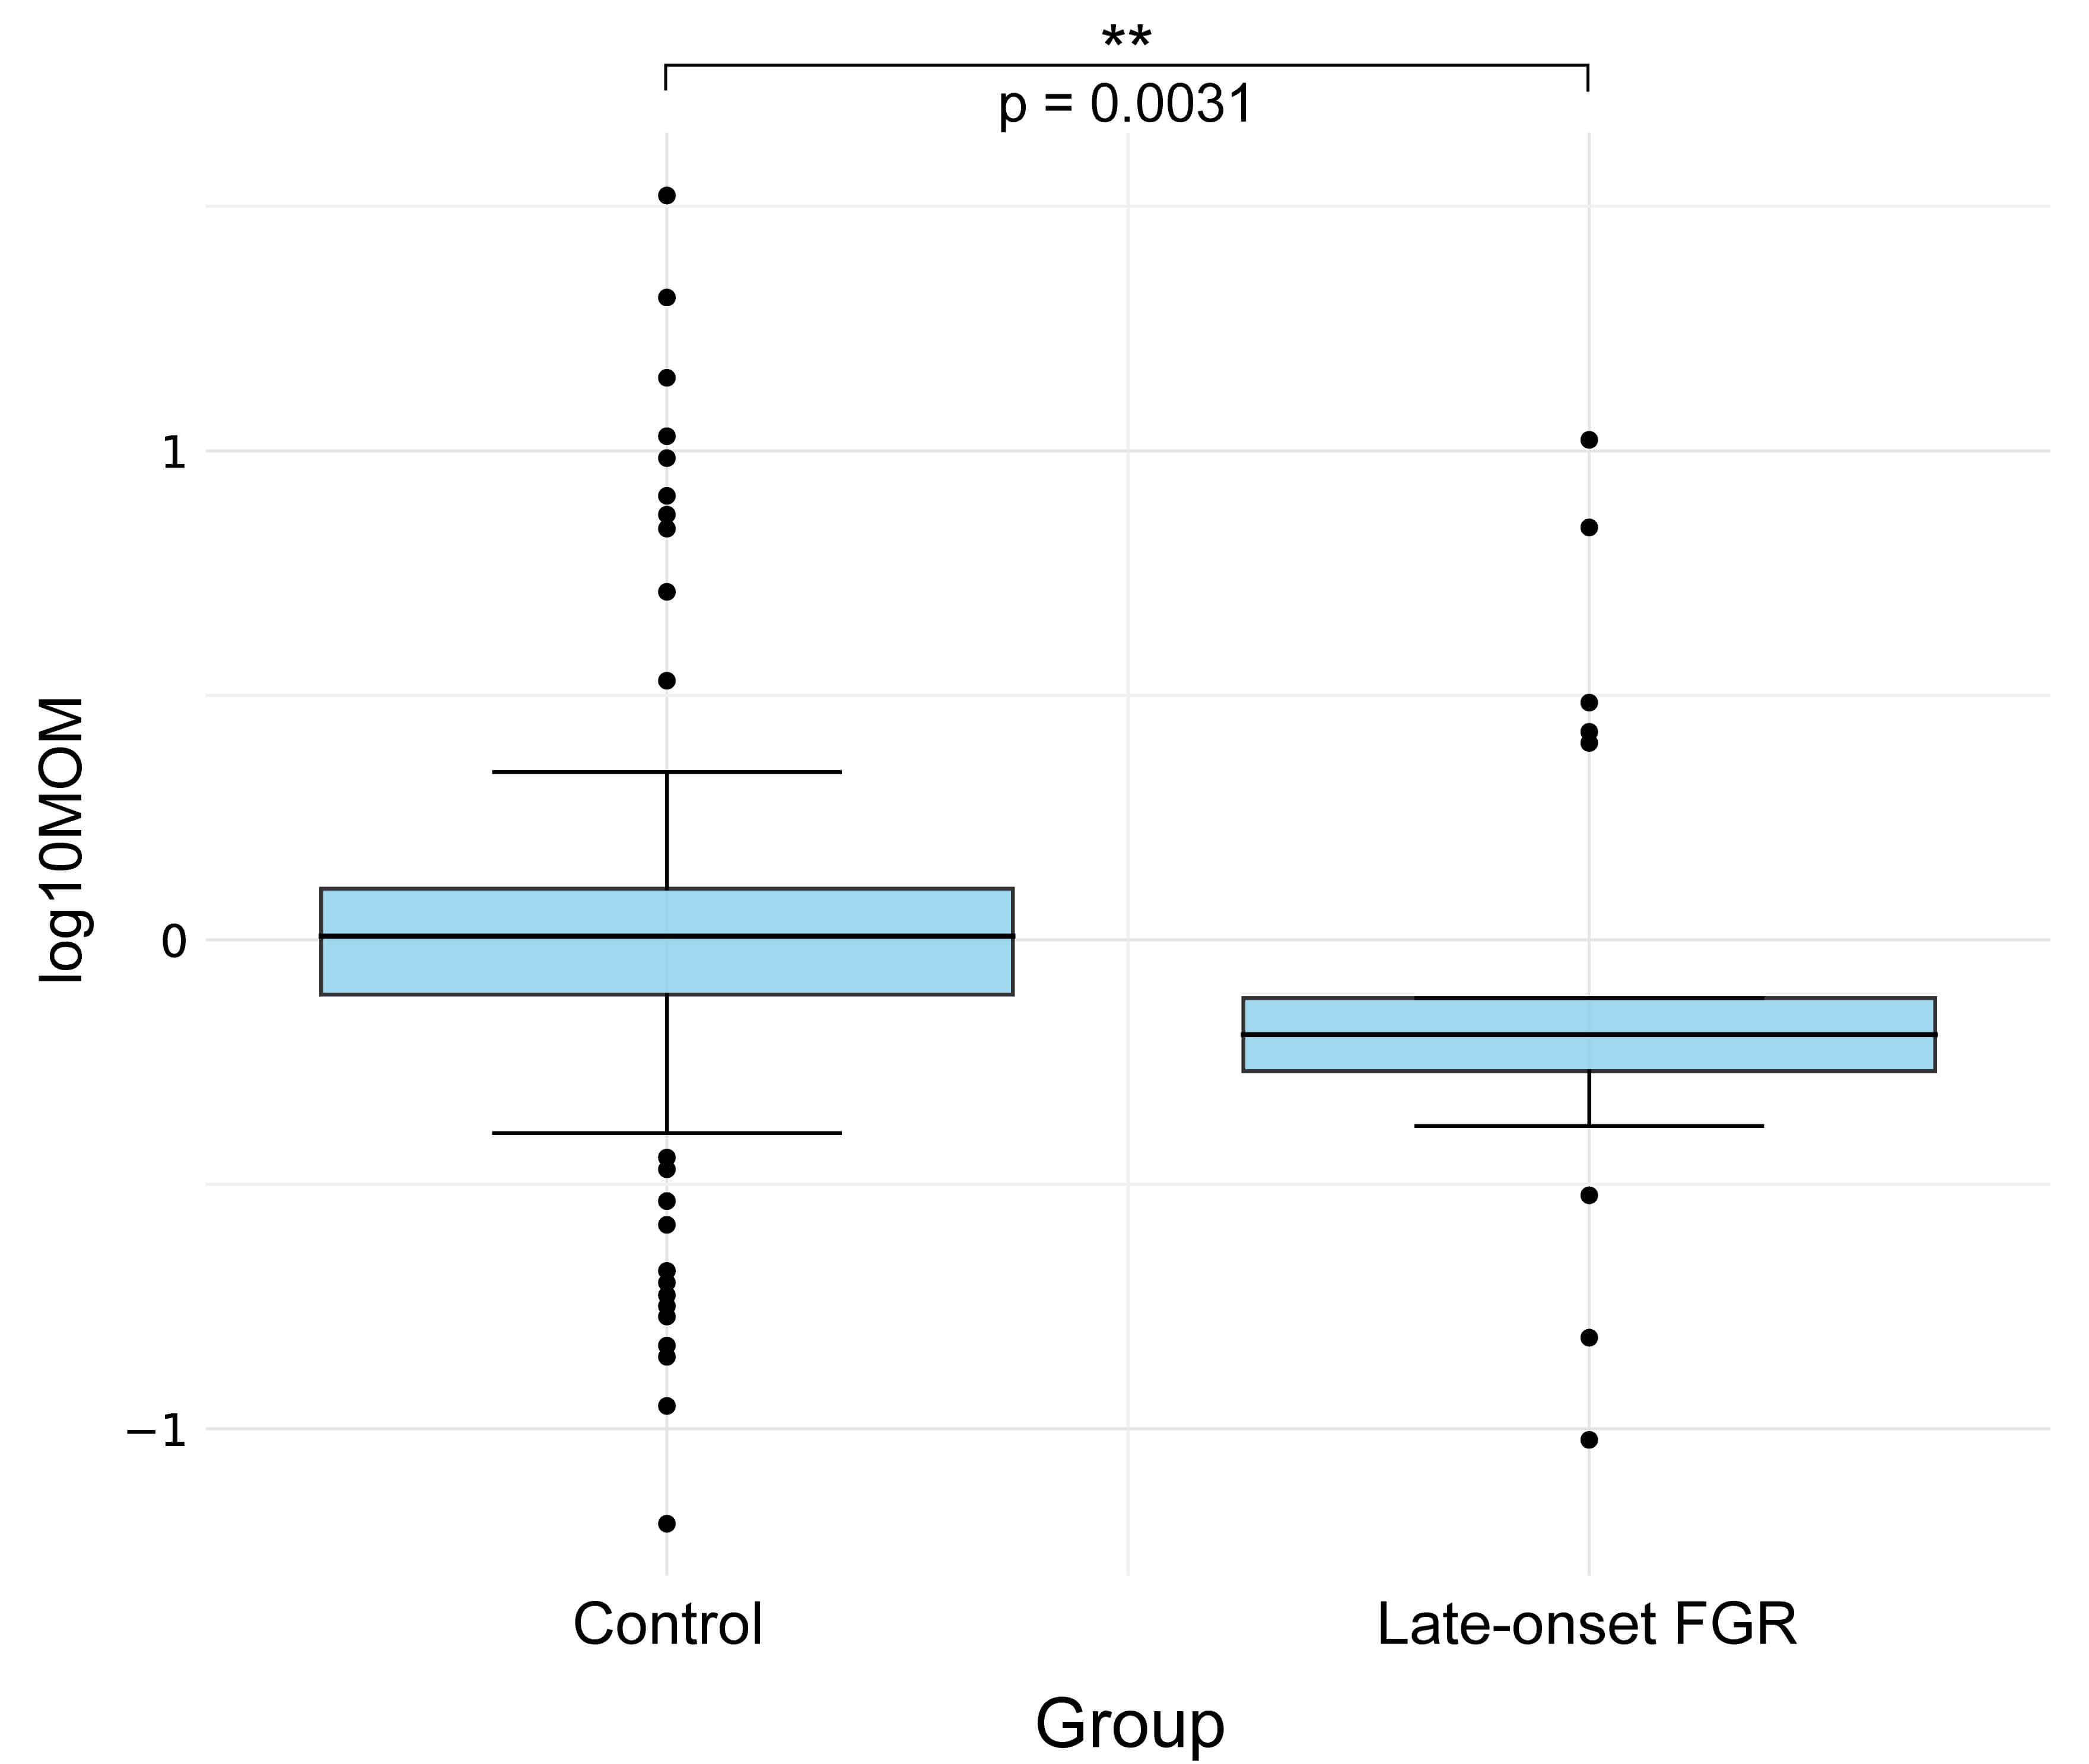 Fig. 4.
Comparison of M6PR concentration between the control group and
the late-onset FGR. **p
This ROC curve and associated metrics demonstrated the performance of the model in distinguishing the control group from the FGR group in the third trimester. The model achieved an AUC of 0.736, indicating moderate discriminatory ability in distinguishing the control group from the FGR group in the third trimester, with a sensitivity of 0.812 and a specificity of 0.785. These results suggest that the model effectively identifies FGR cases while correctly classifying control cases in the third trimester (Fig. 5).
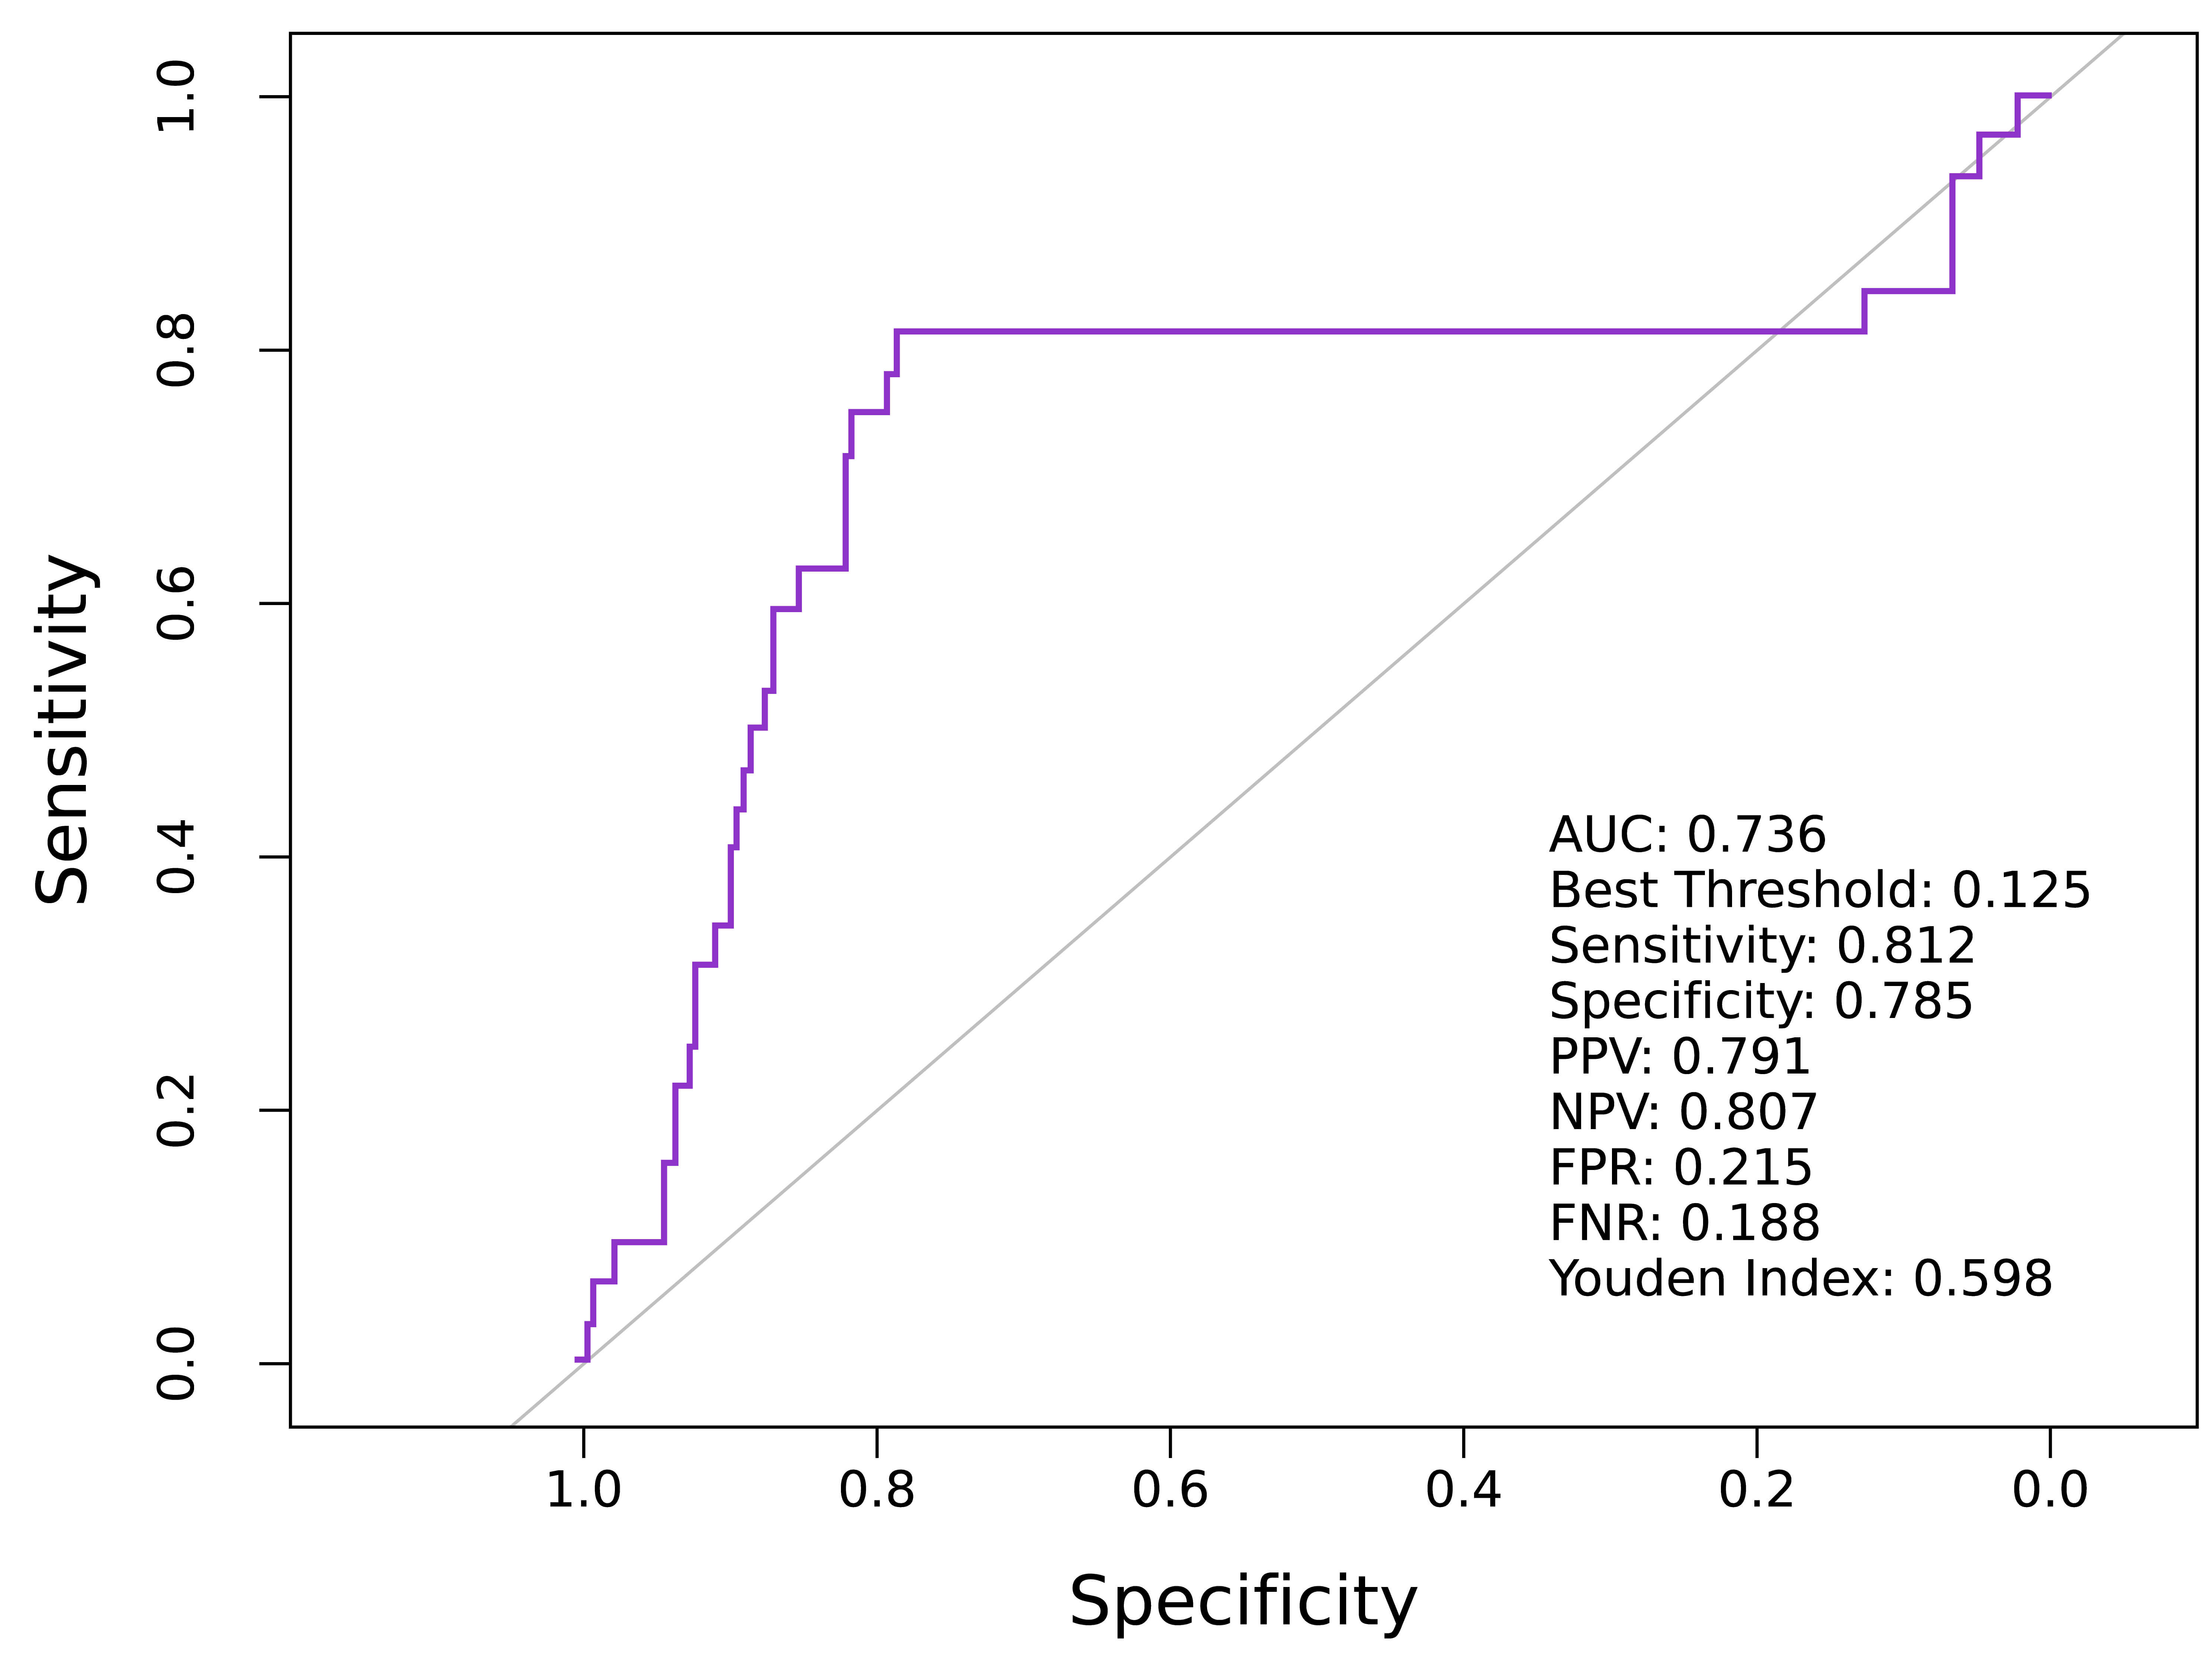 Fig. 5.
Predictive value of M6PR for FGR in the third trimester. AUC, area under the curve; PPV, positive predictive value; NPV, negative predictive value; FPR, false positive rate; FNR, false negative rate; ROC, receiver operating characteristic.
The ROC curve for early-onset FGR prediction demonstrated an AUC of 0.723, indicating a model with moderate discriminatory power (Fig. 6). At the optimal threshold of 0.319, the model achieved a sensitivity of 0.7 and a specificity 0.773, indicating effective identification of early-onset FGR cases with a low misclassification rate. In addition, the positive predictive value (PPV) was 0.773 and the negative predictive value (NPV) was 0.75, which indicated that the model had high reliability in predicting both positive and negative samples. The Youden index of 0.473 further substantiated the overall good performance of the model. Therefore, the ROC curve showed that the model exhibited good classification performance in the early-onset prediction task and could be used for clinical screening and early identification.
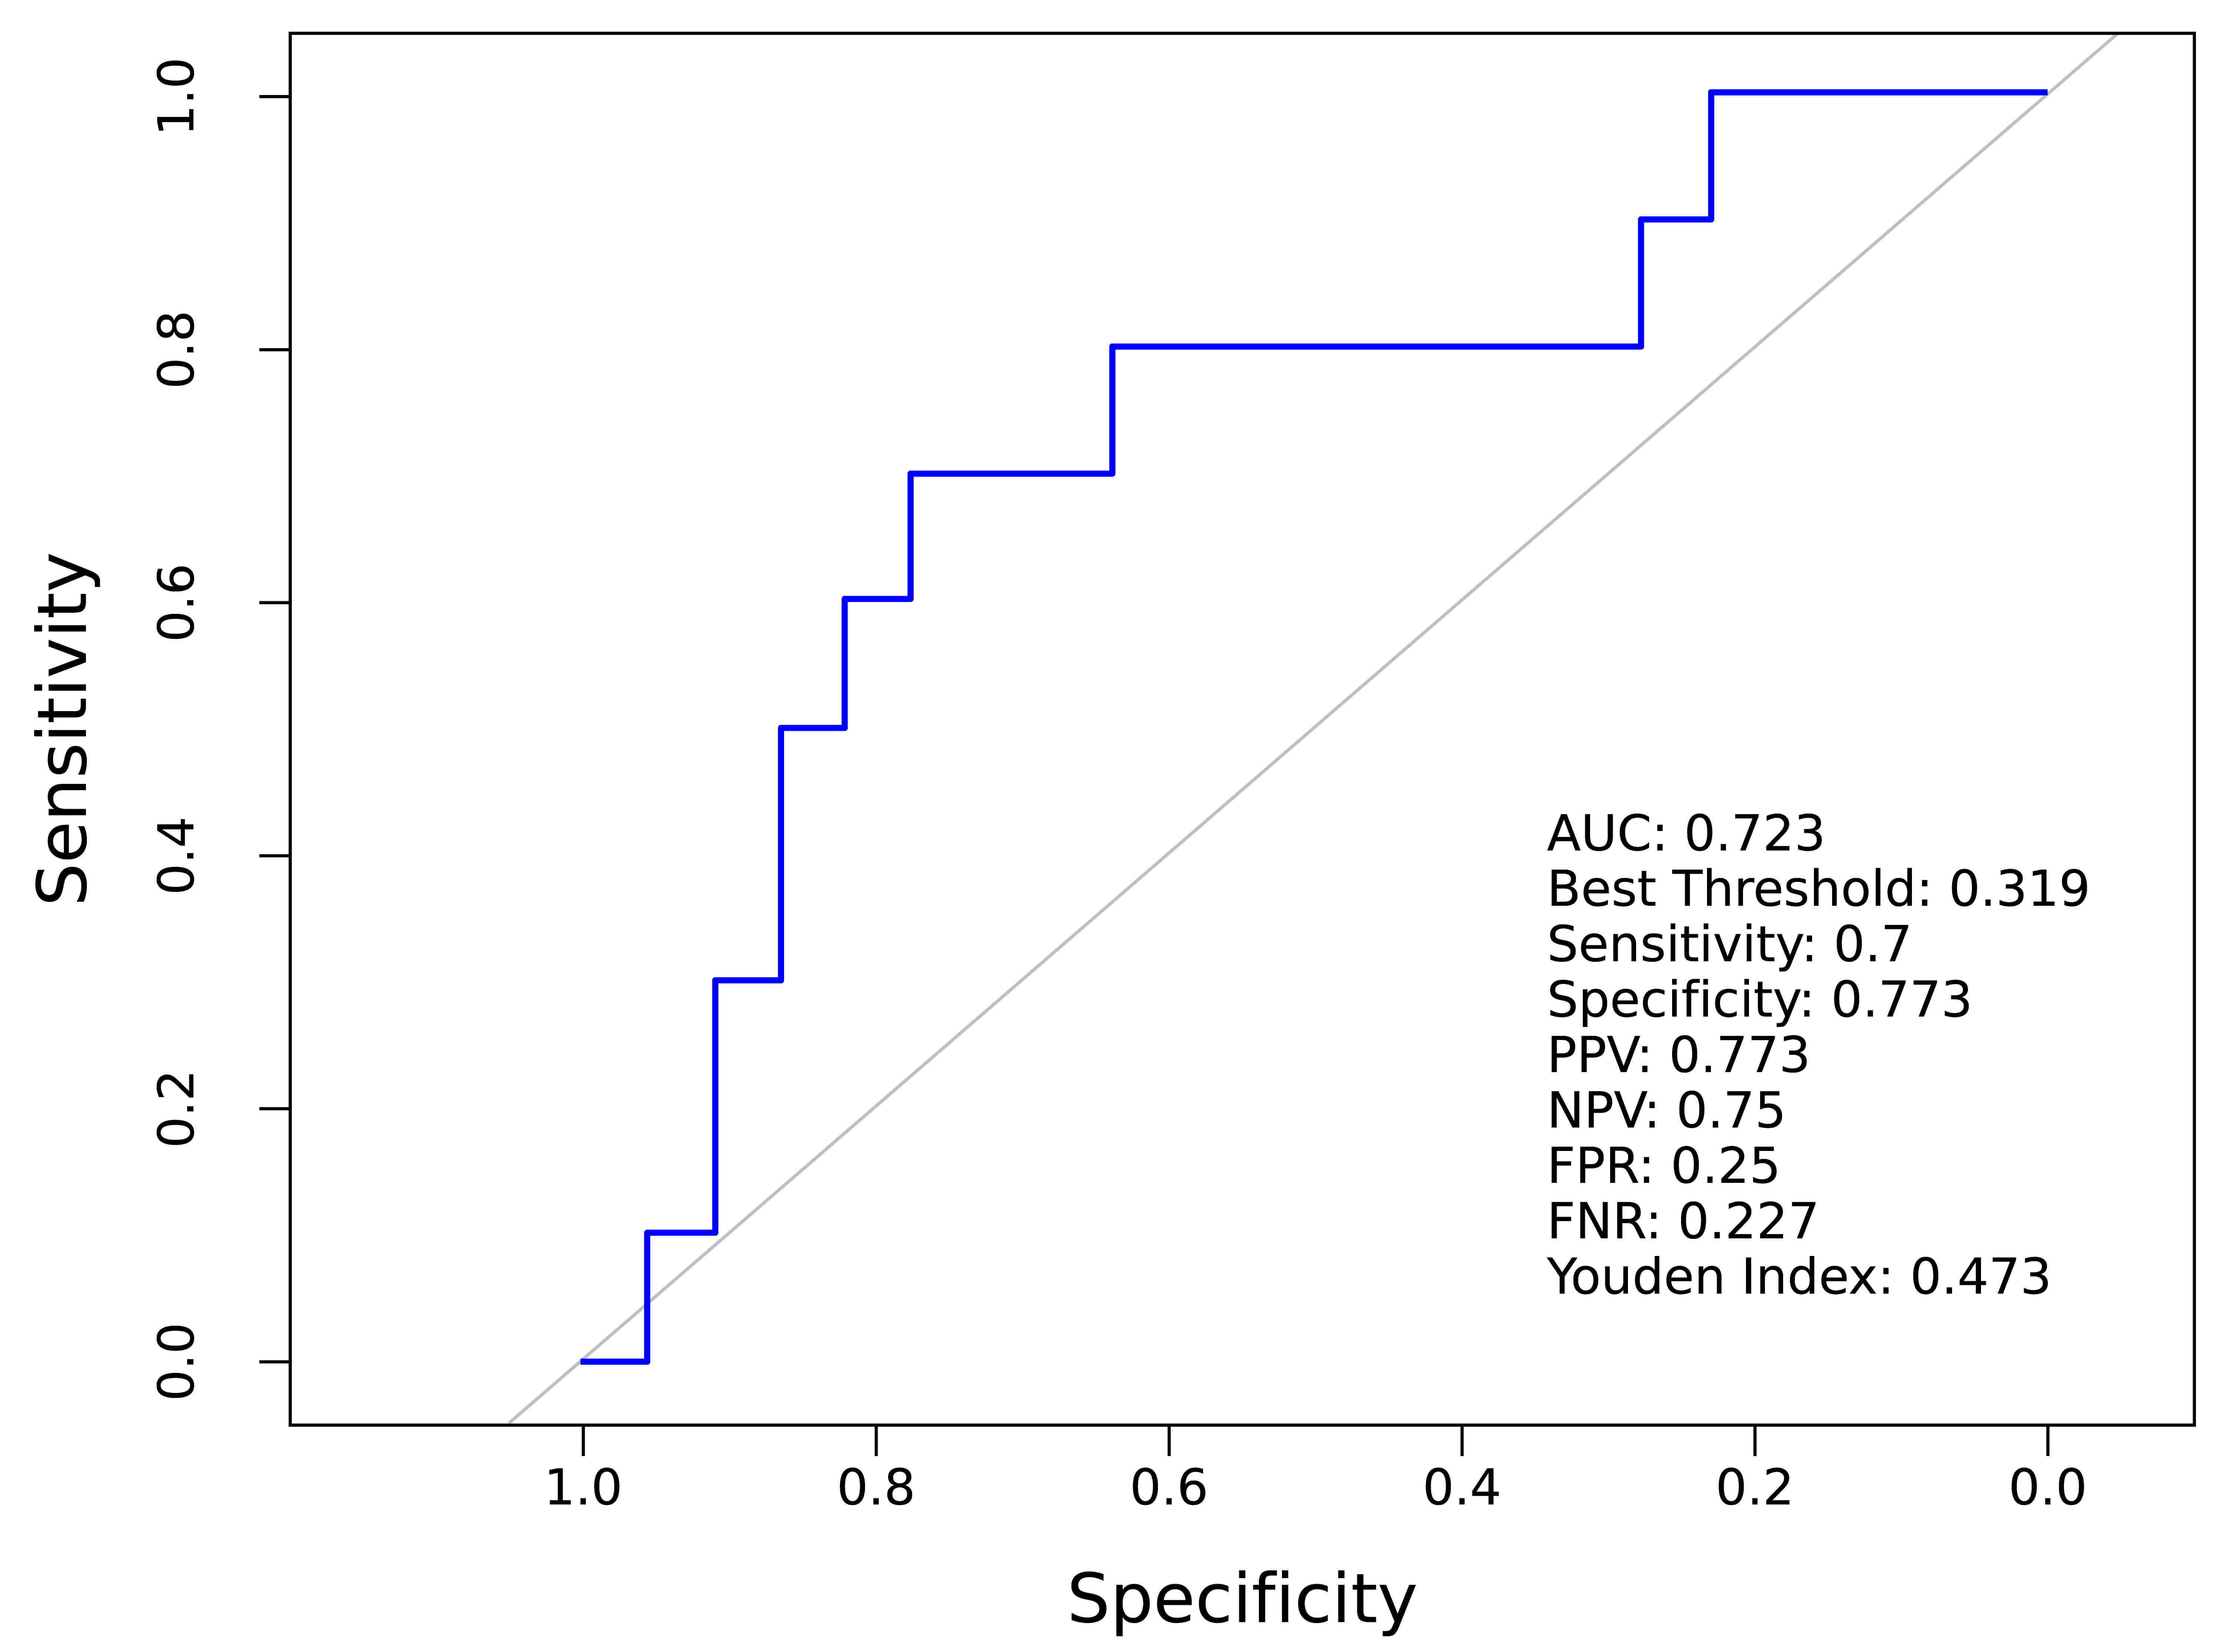 Fig. 6.
Predictive value of M6PR for early-onset FGR.
The ROC curve for predicting late-onset FGR yielded an AUC of 0.645, indicating fair discriminatory ability (Fig. 7). At the optimal cut-off value of 0.697, the model demonstrated a sensitivity of 0.591 and a specificity of 0.900, indicating effective identification of late-onset FGR cases. The PPV was 0.855, and the NPV was 0.688, further illustrating the reliability of the model in predicting both positive and negative samples. The Youden index was 0.491, indicating good overall model performance. Therefore, the ROC curve demonstrates the model potential clinical application in predicting outcomes for late-onset FGR, supporting its use for screening and early intervention in these patients.
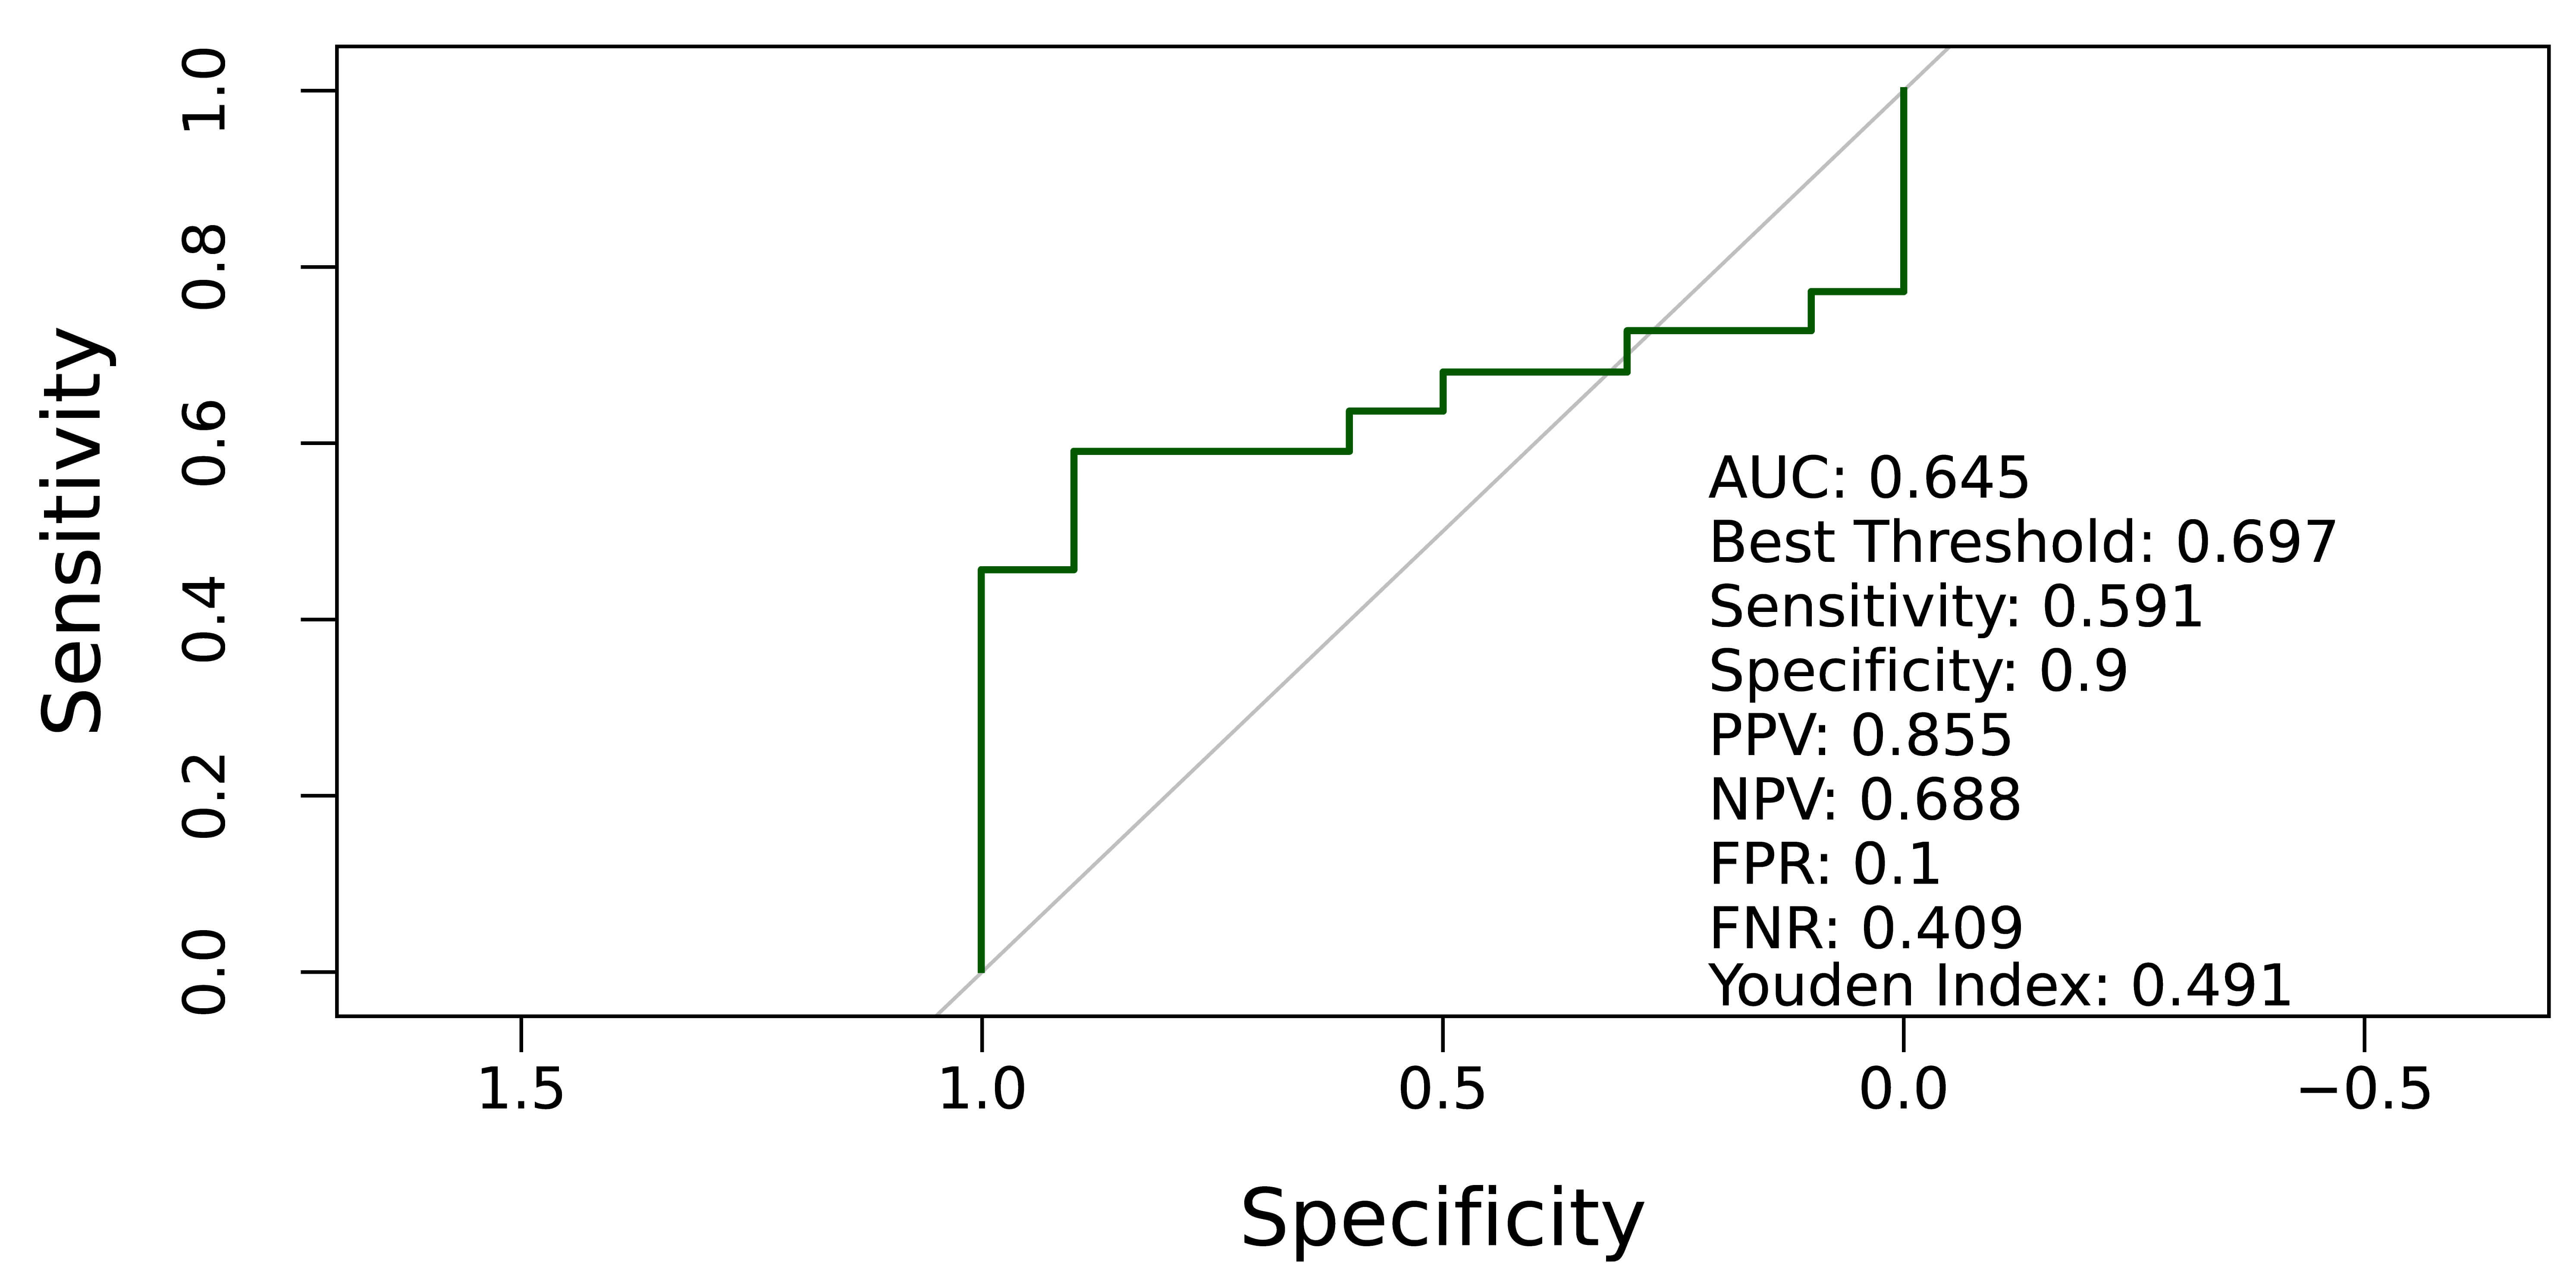 Fig. 7.
Predictive value of M6PR for late-onset FGR.
The present study evaluated maternal serum M6PR levels in late pregnancy as a novel biomarker to predict FGR. The results demonstrated a significant association between decreased M6PR levels and FGR in the third trimester, indicating its strong predictive value. However, serum M6PR concentrations during the first and second trimesters showed no significant alterations compared with the control group. In addition, reduced M6PR levels were significantly associated with both early-onset and late-onset FGR and idemonstrated significant predictive value. These results advance our understanding of the pathophysiology of FGR and support the development of early detection strategies.
M6PR is an important cell membrane receptor that mainly recognizes and transports enzymes labeled with mannose-6-phosphate (M6P). These enzymes are synthesized in the endoplasmic reticulum and then transported to lysosomes to perform their functions. M6PR ensures normal cell metabolism and function through its role in enzyme binding and transport from the Golgi apparatus to the lysosome [17]. Two types of M6PRs have been reported. The mannose-6-phosphate/insulin-like growth factor II receptor (M6P/IGFII receptor, M6P/IGF2-R) binds the M6P ligand and the IGF2 receptor. Cation-dependent mannose-6-phosphate receptor (CD-M6PR) requires a bivalent cation to bind the M6P ligand but not bind IGF2-R [18, 19]. M6P/IGF2-R is also known as a cation-independent M6P receptor (CI-M6PR) because it binds its ligand without require ions [20, 21, 22]. The molecular weight of CD-M6PR is 46 kDa, and the molecular weight of CI-M6PR is 250 kDa [22, 23]. M6PR mediates the transport of M6P-labeled enzymes from the Golgi to the lysosome, a key process in its biological function. This process is key for cellular metabolism and the clearance of intracellular substances. M6PR internalizes bound enzymes into the cell through endocytosis and subsequently delivers them to the endoplasmic reticulum or lysosome, where they perform their functions [24]. M6PR also plays a role in cell signaling, affecting cell growth, differentiation, and metabolism. Dysfunction of M6PR is associated with a various diseases, including lysosomal storage disorders (e.g., Gaucher disease and Fabry disease), as well as certain types of cancer [25, 26, 27, 28].
A decrease in M6PR may impact fetal growth by disrupting intracellular transport, particularly in the delivery of enzymes and nutrients essential for cell growth. Reduced expression of M6PR can impair the transport of nutrients and enzymes, thereby affecting normal fetal growth and development. In addition to its in substance transport, M6PR may also play a role in cell signaling. Decreased M6PR expression may affect cellular responses to growth factors and other signaling molecules, which in turn affect fetal growth regulation. M6PR dysfunction can impair lysosomal function, increasing the risk of apoptosis. Such cell death may compromise fetal tissue development and organ formation. M6PR is associated with cellular antioxidant capacity, and a decrease in M6PR levels may lower cellular resistance to oxidative stress, thereby increasing the risk of fetal damage. The placenta is the main structure supporting fetal growth, and a decrease in M6PR may impair placental cell function, thereby disrupting nutrient and gas exchange between mother and fetus. Reduced M6PR may also affect the expression of growth-related genes, potentially leading to FGR.
The decrease in M6PR may impair cellular nutrient uptake and utilization, thereby adversely affecting fetal growth. The mammalian target of rapamycin (mTOR) pathway is a key regulator of cell growth and metabolism, controlling cell growth, proliferation, protein synthesis, and autophagy [29, 30]. During embryonic development, precise regulation of the mTOR pathway is essential, as its abnormal activation or inhibition can result in FGR [31, 32, 33, 34]. When M6PR is reduced, it may impair lysosomal function and disrupt cellular nutrient processing and utilization. Under these conditions, cells may fail to maintain normal mTOR pathway activity. Inhibition of mTOR results in reduced expression of cyclin D and cyclin-dependent kinase 4 (CDK4), restricting cell growth and proliferation and affecting normal fetal development [35, 36, 37]. Combined with the alterations in the mTOR pathway, we speculated that the reduction in M6PR may form a feedback loop, thereby further exacerbating FGR. This potential mechanism may involve complex cellular signaling, leading to impaired placental function and compromised maternal nutrient supply to the fetus. In summary, our findings suggest a potential link between decreased M6PR, mTOR pathway dysregulation, and the pathogenesis of FGR. Investigating these mechanisms could enhance our understanding of the pathophysiological processes underlying FGR and provide novel insights for its prevention and treatment.
Although current serological biomarkers provide some utility in predicting FGR, their clinical application remains limited due to suboptimal performance. In contrast, M6PR represents an emerging biomarker that may offer improved specificity and sensitivity, as well as directly reflect the underlying pathophysiology of FGR, warranting further investigation and validation. The AUC, which ranges from 0.5 (no discrimination) to 1.0 (perfect discrimination), is an important metric to evaluate the classification performance of the model. In this study, the model predicted third trimester FGR with an AUC of 0.736, showing good ability to distinguish the control group from the non-control group. The sensitivity was 0.812, indicating that the model had a high accuracy in identifying the non-control group, such as third trimester FGR patients, while the specificity was 0.785. This also indicates that the accuracy of the model is relatively high when excluding controls, such as healthy individuals. Such performance metrics are promising for clinical applications, especially for screening and early intervention of patients in third trimester patients. In the detailed analysis of model performance, we examined not only the AUC value of the model but also the positive and negative prediction rates, which are critical to evaluate the potential of the model in clinical diagnosis. The positive prediction rate was 0.791, which meant that when the model predicted a non-control group, it was correct 79.1% of the time, which provided strong decision support for clinicians. At the same time, the negative prediction rate of 0.807 indicated that when the model predicts a control group, it was accurate 80.7% of the time, further enhancing its reliability in ruling out the disease. The false positive and false negative rates revealed the types of errors that may occur in the prediction process of the model. The false positive rate was 0.215, indicating a 21.5% chance that the model would misclassify a control case as non-control, which could lead to unnecessary further testing or treatment. The false negative rate was 0.188, which meant that there was 18.8% chance that the model would miss non-control group cases, which needed special attention in clinical practice. The Youden index was 0.598, reflecting the combined sensitivity and specificity of the model. It reflected the ability of the model to distinguish between different disease states and provided a quantitative measure of its overall performance.
Previous studies have evaluated other biomarkers for FGR prediction. For instance, elevated levels of soluble fms-like tyrosine kinase-1 (sFlt1, also known as VEGFR1) in maternal blood were reported to be associated with FGR [38, 39]. The sensitivities were 0.64 and 0.89, and the specificities were 0.54 and 0.62, respectively. The AUC of ROC was 0.777, and the NPV was 0.98. However, the PPV was only 0.17. Maternal plasma soluble intercellular adhesion molecule-1 (sICAM-1) and soluble vascular cell adhesion molecule-1 (sVCAM-1) were both increased between the 22 and 29 weeks of gestation. The sensitivity and specificity of sICAM-1 were 0.42 and 0.16, respectively, and those of sVCAM-1 were 0.16 and 0.03, respectively [40, 41]. In conclusion, M6PR is a superior marker to predict the occurrence and progression of FGR in the third trimester. Compared with other markers, it offers irreplaceable advantages and is more suitable for clinical diagnosis.
Currently, the role of M6PR in the pathological mechanisms of FGR remains unclear. Future research should focus on the pathways through which M6PR influences placental function and fetal growth. Exploring the interplay between M6PR and other growth factors, inflammatory markers, and placental morphogenesis may provide a more comprehensive understanding of its role in FGR. Moreover, combining M6PR with a panel of emerging biomarkers and applying advanced statistical models, such as machine learning algorithms, may further enhance predictive accuracy and facilitate personalized approaches to FGR management. M6PR emerges as a promising novel biomarker for the prediction of early- and late-onset FGR in maternal serum during the third trimester. However, its efficacy in predicting FGR in the first and second trimesters remains limited. Continued investigation into M6PR and its integration with comprehensive biomarker panels could pave the way for more effective strategies in the prevention and management of FGR, ultimately improving perinatal outcomes.
Our study was based on a prospective cohort with a well-defined population. However, there were some limitations to our research. Notably, M6PR expression was not assessed in the placenta. Moreover, the sample size, particularly in the third trimester, was limited, highlighting the need to validate M6PR’s predictive value in different populations through large-scale, multi-center cohorts. Finally, we excluded high-risk populations, such as those with preeclampsia or fetal abnormalities, in the preliminary phase, which may limit the generalizability of our conclusions to broader clinical settings.
This study demonstrated that maternal serum M6PR levels were significantly lower during the third trimester in patients with FGR. M6PR alone demonstrated superior predictive performance for early-onset FGR, with an AUC of 0.723, whereas the AUC for late-onset FGR was 0.645. These findings highlight the potential of M6PR as a biomarker for predicting FGR and its subtypes, suggesting that it could be incorporated into serological screening strategies for FGR.
The datasets used and analyzed during the current study are available from the corresponding author on reasonable request.
WL, PS designed the research study. XB and YC performed the research. WL, ZG and YH analyzed the data. YL and YH participated in data collection and processing. YL, SZ and LZ contributed to the study design and to revision of the manuscript. JX, JL and ZC contributed to data collection. All authors contributed to editorial changes in the manuscript. All authors read and approved the final manuscript. All authors have participated sufficiently in the work and agreed to be accountable for all aspects of the work.
Research ethics approvals were granted at the Medical Ethics Committee of Maternity and Child Healthcare Hospital of Nanshan District (approval reference number NSFYEC-KY-2021047) and conducted in accordance with the Declaration of Helsinki. All participants provided informed consent prior to inclusion in the study.
We thank the peer reviewers for their constructive comments and the clinical records team for assistance with data retrieval.
This project was funded by Nanshan district health system science and technology major project (NSZD2023067), Supported by Sanming Project of Medicine in Shenzhen Nanshan (No.202407).
The authors declare no conflict of interest.
Supplementary material associated with this article can be found, in the online version, at https://doi.org/10.31083/CEOG45923.
References
Publisher’s Note: IMR Press stays neutral with regard to jurisdictional claims in published maps and institutional affiliations.