


 , Eun Young Kim 2, Kwang Gi Kim 3, Seungho Lee 1,*
1 Department of Obstetrics and Gynecology, Gil Medical Center, Gachon University College of Medicine, 21565 Incheon, Republic of Korea
2 Department of Radiology, Gil Medical Center, Gachon University College of Medicine, 21565 Incheon, Republic of Korea
3 Department of Biomedical Engineering, Gachon University College of Medicine, 21565 Incheon, Republic of Korea
Abstract
Previous studies have reported that loss of muscle mass and quality (sarcopenia) is related to disability, poor quality of life, and decreased survival across various cancer types. This retrospective study aimed to evaluate the influence of preoperative skeletal muscle quantification on prognosis in epithelial ovarian cancer (EOC) patients undergoing primary debulking surgery (PDS).
The medical records of 222 EOC patients treated from June 2002 and December 2017 were reviewed. Preoperative computed tomography (CT) scans at the level of the third lumbar vertebra were used to identify and classify skeletal muscle based on radiodensity. The proportion of low-attenuation muscle within the total skeletal muscle area was calculated. Healthy muscle was defined as containing 23.5% or less low attenuation muscle, determined using a maximal chi-square test.
Based on these criteria, 84 patients were classified into the healthy muscle group, while the remaining 138 patients were categorized into the unhealthy muscle group. Patients with healthy muscle demonstrated improved overall survival (OS) and progression-free survival compared with those in the unhealthy muscle group. Multivariate analysis identified unhealthy muscle as a significant predictor of decreased survival, alongside with advanced stage, high-grade histology, and suboptimal surgery.
Preoperative skeletal muscle quantification was identified as an independent prognostic factor in EOC patients. EOC patients with healthy muscle demonstrated a better prognosis than patients with unhealthy muscle.
Keywords
- ovarian cancer
- prognosis
- sarcopenia
- skeletal muscle
- survival
Epithelial ovarian cancer (EOC) is one of the most lethal gynecologic cancers, despite advances in treatment modalities. The standard treatment for EOC is primary debulking surgery (PDS), followed by adjuvant or neoadjuvant chemotherapy, followed by interval debulking surgery. The extent of residual disease after surgery is one of the most crucial factors affecting survival rates, along with International Federation of Gynecology and Obstetrics (FIGO) stage, tumor grade, and performance status (PS). Patients with a worse PS and restricted functional capacity often struggle to tolerate aggressive cancer treatments. Consequently, these patients typically experience less favorable outcomes compared to more physically fit patients.
Sarcopenia, characterized by a decrease in muscle mass, function, and quality, was found to be related to low Eastern Cooperative Oncology Group PS in cancer patients [1]. Sarcopenia appears to be related to disability, poor quality of life, higher rates of postoperative complications, and decreased survival rates in various cancers [2, 3, 4]. Previous studies conducted in gynecologic cancer patients also showed that sarcopenia is associated with poor oncologic outcomes [5, 6]. Additionally, patients with sarcopenia are at a higher risk of chemotoxicity, possibly resulting in treatment delays, interruptions, or discontinuation [7, 8].
However, studies reported conflicting results about the prognostic significance of sarcopenia in patients with EOC. A retrospective study of 323 patients demonstrated that low muscle attenuation (MA); in housefield units (HU) is predictive of poor survival after PDS [9]. Nevertheless, another study of EOC patients found that sarcopenia is not related to overall survival (OS) [10]. Accordingly, we aimed to evaluate the influence of preoperative skeletal muscle quantification using computed tomography (CT) scan on prognosis in patients with EOC treated with PDS.
We retrospectively analyzed the medical records of patients diagnosed with EOC who underwent PDS as initial treatment at Gil Medical Center, a tertiary referral institution, between June 2002 and December 2017. The study protocol was approved by Institutional Review Board of Gil Medical Center (GDIRB2021-276) and the requirement of informed consent was waived because of the retrospective design.
The following items were collected from the medical record of included patients:
age; FIGO stage; residual disease after PDS; histologic type and grade;
preoperative level of cancer antigen 125 (CA125); and date of operation,
recurrence, death, and last visit. We considered optimal surgery as residual
disease
Diagnostic CT scans were obtained within four weeks before PDS and retrospectively analyzed using Gachon_DeepBody, an in-house software developed by Gachon University Gil Medical Center (Incheon, Republic of Korea). Details of the use of Gachon_DeepBody are described previously [3, 11]. Gachon_DeepBody utilizes a trained deep learning model to extract muscle, subcutaneous fat, and visceral fat, and measures the cross-sectional area to determine body composition. The transverse section of L3 was chosen as the standard landmark and skeletal muscle was identified based on the radiodensity ranging from –25 to 150 HU). Skeletal muscle was classified as very low attenuation muscle (–30 to 0 HU), low attenuation muscle (0 to 30 HU), and high attenuation muscle (30 to 150 HU). Since radiodensity of adipose tissue is distinctively lower than adjacent lean soft tissue, lower HU indicate a higher proportion of fatty components in skeletal muscle. Thus, we evaluated the percentage of low-attenuation muscle within the overall skeletal muscle area and established the criteria for patients with healthy or unhealthy muscle. Although this approach emphasizes muscle quality (radiodensity-based), it simultaneously accounts for the overall muscle quantity, as the proportion is calculated relative to the entire skeletal muscle cross-section. Hence, the use of the term ‘sarcopenia’ in this study is intended to encompass both mass and quality dimensions. Because no consensus exists on the best cut-off point to determine healthy muscle, we defined our cut-off value using a maximal chi-squared method in the open-source statistical software R (R Development Core Team, Vienna, Austria, http://www.R-project.org), and patients were divided into healthy and unhealthy muscle group based on our cut-off value of 23.5%.
Data are expressed as mean
We analyzed 222 patients, and based on our predefined criteria, the healthy
muscle group comprised of 84 patients and the remaining 138 patients were
included in the unhealthy muscle group. Baseline characteristics of the two
groups were compared (Table 1). The mean age of patients with healthy muscle was
lower than that of patients with unhealthy muscle (p
| Variables | Healthy muscle (n = 84) | Unhealthy muscle (n = 138) | p value | |
| Age (years) | 45.1 |
57.3 |
||
| FIGO stage | ||||
| I | 35 (41.7%) | 28 (20.3%) | ||
| II | 13 (15.4%) | 9 (6.5%) | ||
| III | 29 (34.6%) | 81 (58.7%) | ||
| IV | 7 (8.3%) | 20 (14.5%) | ||
| Histology | 0.032 | |||
| Serous | 39 (46.4%) | 89 (64.5%) | ||
| Mucinous | 16 (19.0%) | 10 (7.2%) | ||
| Endometrioid | 15 (17.9%) | 18 (13.0%) | ||
| Clear cell | 7 (8.3%) | 13 (9.4%) | ||
| Other | 7 (8.3%) | 8 (5.8%) | ||
| Grade | 0.051 | |||
| 1 | 20 (23.8%) | 17 (12.3%) | ||
| 2 | 26 (31.0%) | 40 (29.0%) | ||
| 3 | 38 (45.2%) | 81 (58.7%) | ||
| Residual disease after PDS | ||||
| No residual | 55 (65.5%) | 57 (41.3%) | ||
| 17 (20.2%) | 29 (21.0%) | |||
| 12 (14.3%) | 52 (37.7%) | |||
| CA125 (U/mL) | 182.9 (6.7–600.0) | 355.5 (8.3–600.0) | 0.049 | |
Values are presented as mean
FIGO, International Federation of Gynecology and Obstetrics; PDS, primary debulking surgery; CA125, cancer antigen 125.
During the median follow-up of 55.34 months, OS was significantly improved in
healthy muscle patients compared to unhealthy muscle patients (p =
0.005) (Fig. 1A). Similarly, a significant difference in PFS was found between
the healthy muscle and unhealthy muscle groups (not reached vs. 27.80 months,
respectively; p
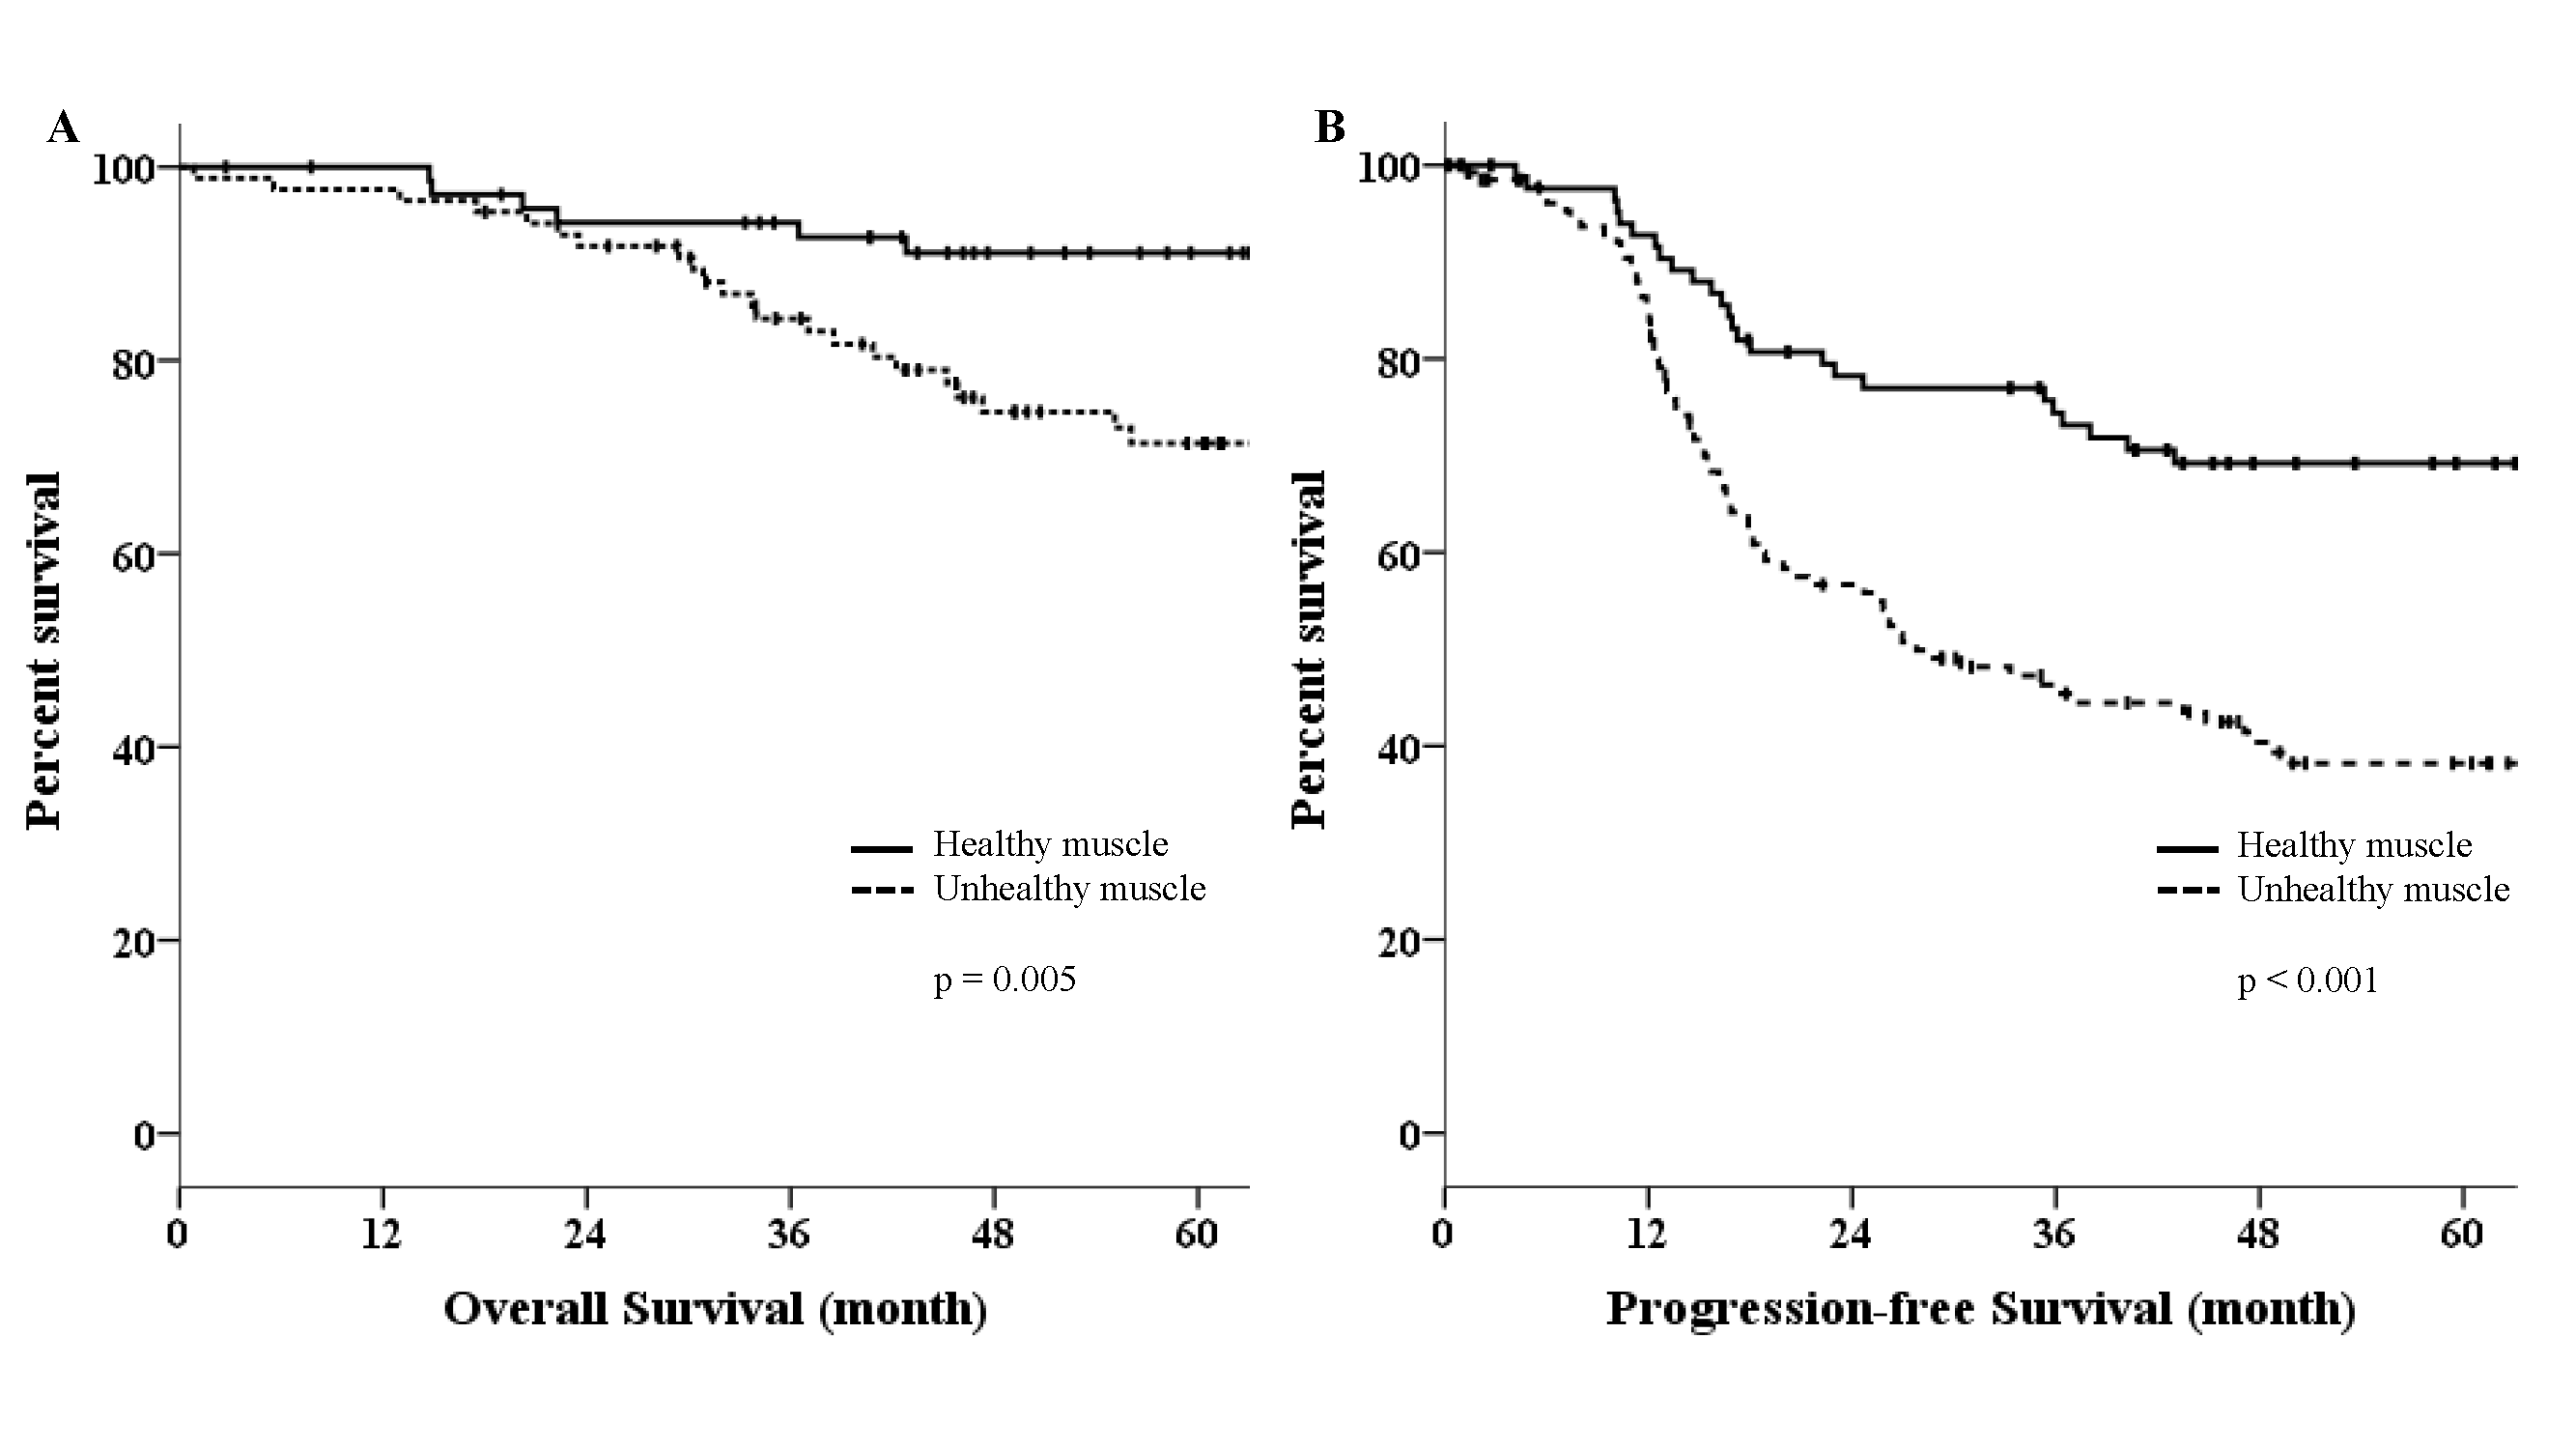 Fig. 1.
Kaplan-Meier curves in study populations. (A) Overall survival (OS) in patients with healthy and unhealthy muscles. (B) Progression-free survival (PFS) in patients with healthy and unhealthy muscle.
From univariate analysis, we found that the advanced stage, high-grade
histology, suboptimal surgery, and unhealthy muscle predicted poor OS. From
multivariate analysis, advanced stage (HR = 3.02, 95% CI: 1.28–7.14, p
= 0.012), high-grade histology (HR = 4.60, 95% CI: 1.11–19.14, p =
0.036), suboptimal surgery (HR = 3.74, 95% CI: 2.19–6.38, p
| Variables | Univariate analysis | Multivariate analysis | ||
| HR (95% CI) | p value | HR (95% CI) | p value | |
| Age | 1.45 (0.82–2.57) | 0.207 | - | - |
| CA125 | 1.16 (0.69–1.96) | 0.585 | - | - |
| Advanced stage | 2.97 (1.24–7.11) | 0.015 | 3.02 (1.28–7.14) | 0.012 |
| High-grade histology | 4.38 (1.05–18.27) | 0.042 | 4.60 (1.11–19.14) | 0.036 |
| Suboptimal surgerya | 3.31 (1.89–5.80) | 3.74 (2.19–6.38) | ||
| Unhealthy muscleb | 2.25 (1.11–4.57) | 0.025 | 2.58 (1.33–5.02) | 0.005 |
aSuboptimal surgery means residual disease greater than or equal to 1 cm after PDS.
bUnhealthy muscle is defined as the percentage of low-attenuation muscle within the overall skeletal muscle greater than 23.5%.
HR, hazard ratio; CI, confidence interval.
Univariate analysis showed that advanced stage, high-grade histology, and
suboptimal surgery were poor prognostic factors for PFS. Significant predictors
in multivariable analysis were advanced stage (HR = 3.24, 95% CI: 1.79–5.84,
p
| Variables | Univariate analysis | Multivariate analysis | ||
| HR (95% CI) | p value | HR (95% CI) | p value | |
| Age | 1.191 (0.75–1.89) | 0.460 | - | - |
| CA125 | 1.41 (0.90–2.20) | 0.134 | - | - |
| Advanced stage | 3.01 (1.64–5.52) | 3.24 (1.79–5.84) | ||
| High-grade histology | 3.23 (1.29–8.12) | 0.012 | 3.28 (1.31–8.23) | 0.011 |
| Suboptimal surgerya | 2.16 (1.36–3.42) | 0.001 | 2.35 (1.53–3.61) | |
| Unhealthy muscleb | 1.53 (0.92–2.54) | 0.101 | 1.60 (1.01–2.53) | 0.045 |
aSuboptimal surgery means residual disease greater than or equal to 1 cm after PDS.
bUnhealthy muscle is defined as the percentage of low-attenuation muscle within the overall skeletal muscle greater than 23.5%.
In this study, we analyzed prognostic significance of sarcopenia in patients with EOC who underwent PDS for primary treatment. We found that sarcopenia was strongly associated with poor PFS and OS. As is widely recognized, survival rates were also associated with advanced stage, high-grade histology, and residual disease after PDS. Although multivariate analysis adjusted for key confounders including stage, grade, and residual disease, poor muscle quality may also represent a marker of more advanced disease or systemic inflammatory state rather than a completely independent prognostic determinant. Increased muscle protein catabolism, mainly through the adenosine triphosphate (ATP)–ubiquitin proteolytic pathway, and cytokine-mediated suppression of myogenic factors contribute to cancer-associated muscle wasting [12].
Sarcopenia has been shown to result in poor clinical outcomes in several
studies. Recent research indicates that pre-therapeutic sarcopenia, defined as
low skeletal muscle index (SMI; adjustment of skeletal muscle area for height)
using CT scan-based assessment, was strongly associated with poor PFS and OS in
patients with various cancers, including gastric, colorectal, or breast cancer
[13]. Besides, gynecologic cancer patients with skeletal muscle loss were at
higher risk of treatment complications and decreased survival rates [5, 14, 15].
Tumor-derived inflammatory cytokines such as tumor necrosis factor-alpha
(TNF-
The present study identified sarcopenia, consistent with findings in other
cancers, as an important prognostic factor in EOC. Unfortunately, there is
controversy over the adverse effects of sarcopenia on patient survival. In a
retrospective study, EOC patients were assessed for SMI and MA preoperatively;
while several SMI cut-off levels were not associated with OS, low MA (
Skeletal muscle mass is measured using bioelectrical impedance, dual-energy
X-ray absorptiometry, and CT scan. Among these methods, CT is most commonly used
to analyze muscle composition at the cross-sectional area of the third lumbar
vertebra (L3) [17, 18, 19]. We employed CT scans to diagnose sarcopenia, as CT scan
is routinely performed for diagnostic purposes in cancer patients. Nevertheless,
CT-based assessment is limited in use because acceptable cut-off values for
sarcopenia have not been established. Sarcopenia, characterized by reduced muscle
quantity and quality, is assessed through skeletal mass and density,
respectively. Low radiodensity indicates excessive lipid accumulation within
skeletal muscle tissue. As fat content within muscle increases, the radiological
density of muscle decreases. Previous studies reported that skeletal muscle
density (SMD) rather than muscle mass better reflected frailty and physical
function [20, 21]. SMI was not found to be an indicator of frailty. Instead,
decreased SMD and skeletal muscle gauge, as determined by multiplying SMI
There is growing evidence supporting the importance of overcoming sarcopenia for patients with cancer. Management strategies such as physical activity, nutritional support, and pharmacological interventions have been proposed as key components in sarcopenia [22]. Exercise is the most important factor. Aerobic exercise aids in regulating metabolism, diminishing oxidative stress, and increasing athletic capabilities. Meanwhile, resistance training helps to enhance both muscle strength and mass [23]. Additionally, ensuring adequate energy intake and supplementation of specific nutrients are essential measures in the prevention and treatment of sarcopenia [24]. Still, several pharmacological agents have been investigated, but evidence is insufficient to establish them as a main treatment [25].
Future prospective studies are warranted to validate our findings in larger, multicenter cohorts. Moreover, interventional trials focusing on nutritional and exercise strategies to improve muscle quality may further clarify whether reversing sarcopenia can translate into better oncologic outcomes.
A major strength of this study lies in its use of a CT-based proportional parameter that integrates both muscle quality and quantity. Unlike prior studies that relied solely on absolute HU thresholds or SMI, this proportional approach provides a more comprehensive and individualized assessment of skeletal muscle status. Simultaneously accounting for both fat infiltration and overall muscle area, it better reflects the multifaceted nature of sarcopenia and may serve as a clinically relevant parameter for evaluating muscle health in patients with EOC.
This study has several limitations. First, its retrospective and single-center design may limit the generalizability of the findings and introduce potential selection bias. Second, the cut-off value of 23.5% for low-attenuation muscle was derived using the maximal chi-square method, which may be susceptible to type I error or overfitting. Internal validation such as bootstrap resampling was not performed due to analytical constraints; therefore, external validation in independent cohorts is warranted to confirm the robustness and generalizability of this threshold. Third, despite multivariate adjustment for age, stage, and residual disease, residual confounding cannot be fully excluded. Fourth, data on patients’ functional performance and nutritional interventions were unavailable, although these factors may influence muscle condition and survival outcomes. Finally, because this was a retrospective observational study, causal inference is limited, and prospective or interventional studies are warranted to evaluate whether improving skeletal muscle quality and quantity can lead to better oncologic outcomes. In light of these limitations, our findings should be interpreted with caution. Nevertheless, this study highlights the prognostic importance of preoperative skeletal muscle status and provides a basis for future research exploring interventions to improve patient outcomes.
In the present study, we examined the impact of sarcopenia measured by skeletal muscle quantification using CT on prognosis and found that sarcopenia negatively affects PFS and OS in patients who underwent PDS for EOC. Hence, there is a need for active screening and management for sarcopenia in conjunction with cancer treatment for ovarian cancer patients.
The data supporting this study’s findings are available from the corresponding author upon reasonable request.
SO contributed to data analysis and manuscript writing, EYK contributed to data acquisition and analysis, KGK contributed to study design and critical revision, SL contributed to study conception and critical revision. All authors contributed to editorial changes in the manuscript. All authors read and approved the final manuscript. All authors have participated sufficiently in the work and agreed to be accountable for all aspects of the work.
The study was conducted in accordance with the Declaration of Helsinki. The research protocol was approved by the Ethics Committee of the Gil Medical Center (GDIRB2021-276). The need for informed consent was waived due to the retrospective nature of this study.
Not applicable.
This work was supported by the Gachon University research fund of 2024 (GCU-202410680001).
The authors declare no conflict of interest.
References
Publisher’s Note: IMR Press stays neutral with regard to jurisdictional claims in published maps and institutional affiliations.