


 , Marta Murcia Esparza 2, María Murcia Esparza 3, Chryspin Harold Zeromski 2, Oscar Martínez Martínez 4, María Ángeles Martínez Calvo 5
1 Department of Restaurative Roproductive Medicine, Clinical Consulting G&E, 26002 Logroño, La Rioja, Spain
2 Department of English Student Division of University Collegium Medicum Nicolas Copernicus, 85-067 Bydgoszcz, Kuyavian-Pomeranian, Poland
3 Department of Alumni of Medicine, University of Navarra, 31008 Pamplona, Navarra, Spain
4 Department of Computer Science Engineering, University of La Rioja, 26006 Logroño, La Rioja, Spain
5 Department of Materials Science and Engineering, University of La Rioja, 26006 Logroño, La Rioja, Spain
Abstract
The assessment of the fertility window can be approached from the point of view of the analysis of biochemical and hormonal changes related to the ovarian physiology of the hypothalamic-pituitary-gonadal axis. These changes at the target organ level determine the biophysical characteristics of cervical secretion. The present study examined the Peak (P)-type crystallization pattern of cervical secretions in relation with to the clinical assessment of the fertile window.
A prospective study was conducted in 45 subfertile patients undergoing sterility evaluation following Natural Procreative Technology and Restorative Reproductive Medicine approaches. 18 of the 45 subfertile patients met the inclusion criteria and completed a sterility work-up, along with a multidisciplinary assessment of the fertile window. In this selected sample, the P-type crystallization pattern was analyzed during the fertile window by performing a liquid endocervical biopsy. Finally, a randomly selected subgroup of 6 patients was assessed for pregnancy outcomes.
The fertile window was assessed in all participants. 18 digital captures (40%) were true positives, with P-type crystallization observed and a sensitivity of 100%. 27 captures (60%) were true negatives, with 100% specificity. Zero false-negatives or false-positives were observed. Live-birth pregnancy was achieved in 83% (5/6) of patients with positive P-type crystallization results in the randomly selected subgroup. The most fertile-window days were identified in all cases between three days before the estimated day of ovulation (EDO) until peak-day P (-3 EDO until P-Day). P-type crystallization, characterized by maximal branching and a tricolor pattern in a hexagonal configuration, was observed in 100% of the study group.
This study supports the integration of cervical secretion elasticity and transparency assessment with crystallization analysis, within an objective reference framework. The triad of (a) high-quality cervical secretion, (b) accurate fertile window diagnosis, and (c) the hexagonal P-type crystallization pattern may collectively contribute to predicting positive pregnancy outcomes.
The study has been registered on https://www.isrctn.com/ (registration number: ISRCTN18705969; registration link: https://www.isrctn.com/ISRCTN18705969).
Keywords
- fertile window
- Natural Procreative Technology
- P-type crystallization
- Restorative Reproductive Medicine
- subfertility
The fertile window is defined by the first day with a threshold level of urinary
estrone-3-glucuronide (E3G) and ending with a second day above a threshold of
luteinizing hormone (LH), varies from
Changes in sex-steroid levels and elevated LH, both in blood and urine, often require another clinical biomarker to guide observation within the menstrual cycle. At the target-organ level, it is possible to assess changes in cervical secretion due to increased estrogen and biochemically derived changes in follicular dynamics [12]. Several assessment tools have been developed to score the quality of the cervical secretion and to identify the days of maximum fertility in the fertile window [4, 13, 14]. Mucus elasticity is known to be proportional to estrogen increase, and that it reaches its peak in the pre-ovulatory phase [3, 4, 5, 10]. Among the most established and easily accessible tools is the assessment of mucus quality and its progression within the fertile window that was developed in several landmark studies [2, 3, 4, 5]. These scales require training to be correctly used [2, 3, 4, 5, 13, 14]. The qualitative assessment of the cervical mucus, developed with this method, has allowed for the correlation of the days of maximum fertility with good perinatal outcome [15, 16, 17].
Crystallization of cervical secretion during the fertile window is a consequence
of the concentration of estrogen in the cervical mucus [18]. Odeblad typified
different types of crystallization by endocervical examination [18]. Several
patterns can coexist within the fertile window [19]. The characteristic Peak
(P)-type crystallization pattern described by Odeblad makes it possible to
associate certain types of cervical mucus with their corresponding cervical
crypts, which require specific specialized training for proper endocervical
collection and evaluation [18, 19, 20]. P and Loaf (L)-type crystallization are now
known to coincide with a high cervical-mucus-quality score according to currently
recognized cervical-secretion standards [13, 21]. These biophysical changes are
due to the response of the selected dominant follicle to a certain threshold
level of follicle-stimulating hormone (FSH) [22, 23]. This premise is basic for
the development of the study of crystallization branching; there is a
well-documented correlation between the days of the start of the follicular phase
of the menstrual cycle, when serum estradiol levels are approximately 291.25
A prospective study was conducted between February 2022 and February 2023 on 45 subfertile patients who had undergone an infertility study in which the NaProTechnology and the RRM approaches were considered [28, 29]. The implemented strategy, based on NaProTechnology protocols, was to specify the observation and coding of cervical mucus examination during the fertile window, and to use the definition of the peak day of the fertile window according to CrMS.
Sterility was defined as the inability of a couple to achieve pregnancy. Infertility was defined as the inability to achieve pregnancy with the birth of a newborn, and subfertility as any form of reduced fertility, broadly defined as the inability to have a pregnancy after regular unprotected sex for 12 months. In women aged 35 years or older, the definition of subfertility is typically 6 rather than 12 months of unprotected sex [30]. Table 1 summarizes the approach taken for the assessment of the fertile window. To ensure the accuracy of the test and the identification pattern, a statistical study was carried out to validate the identification pattern of the P-type crystallization. For this purpose, a computer analysis of the crystallization pattern of a P-type secretion was undertaken. Subsequently, this tool was used as a comparison method between two sets of digitized cervical-secretion-crystallization samples to validate its application. The comparison of the P-type crystallization patterns was performed by a single person with experience in fertility awareness. Finally, 6 patients were randomly selected from the study group to assess the final outcome of the pregnancy.
| Identification of the fertile window by using the estimated day of ovulation (EDO) considering the midpoint of the fertile window and EDO strategies. |
| Evaluation of the progression of cervical secretion during the fertile window, considering the elasticity and transparency of cervical secretion according to fertility awareness scales, considering the Billings Ovulation Method (BOM) and the Creighton Model of Fertility Care (CrMS). |
| Identification of follicular maturation by monitoring follicular development up to 18–20 mm of follicular diameter and diagnosis of follicular rupture by identifying follicular emptying. |
| Identification of endometrial receptivity using an endometrial line with a triple-layered endometrial pattern and a total endometrial thickness |
| Identification of P-type pattern crystallization by studying endocervical secretion. |
| Identification of indirect signs of progesterone’s action as the main chemotactic factor through a corpus luteum measuring 18–20 mm in diameter and a regularly secretory endometrium |
| Ovulatory checkpoints (POP) through identification of the urinary luteinizing hormone (LH) surge, luteal phase progesterone levels greater than 8 ng/mL, high-quality cervical mucus around the midpoint of the fertile window. Serum progesterone and estradiol levels to identify ovulatory quality around peak day +7. |
| Identification of sperm swimming potential in cervical secretion by postcoital test and sperm quality score (SQS) according to percentage of spermatozoa/mL/motile/normal forms. |
Only women who wished to be treated using NaProTechnology and a RRM approach were included. Patients trained in CrMS were not included. Functional gynecological pathologies that could affect follicular development were considered for treatment, such as, hypothyroidism, hirsutism, hyperandrogenemia, luteal-phase defects, delayed maturation of follicular development, polycystic ovary syndrome (PCOS) and other causes such as stress, hyperprolactinemia, or pre-obesity.
The following exclusion criteria were considered: (a) patients who required surgery to resolve an infertility problem; (b) any pathology that required more time to resolve such as premature ovarian failure, azoospermia, hyperprolactinemia secondary to pituitary microadenomas; and (c) patients with hyperthyroidism, obesity, or anorexia. Therefore, pathologies requiring further intervention, either surgical or prolonged medical intervention, were excluded from the study. No patients with myomatous uterus requiring surgical intervention or hyperplasia were considered during the diagnostic process.
Of the 45 subfertile patients, 18 met the inclusion criteria within the study
period who desired pregnancy and underwent fertility testing according to the RRM
approach, including fertile window study and endocervical biopsy. A detailed
clinical assessment was performed to make an appropriate diagnosis. The following
diagnostic tests were performed: clinical history, lower genital tract
examination, cervicovaginal cytology, colposcopy, and transvaginal ultrasound.
The presence of tubal patency was confirmed by standard hysterosalpingography,
when necessary. Follicular maturation was verified by ultrasound monitoring;
mature follicles were considered to have a mean follicular diameter
The fertile window was defined as 6 days before Peak Day (P-Day) according to CrMS. P-Day was the last day with fertile type mucus according to CrMS. The first day of the cycle was defined as the first day of menstruation, and the last day of the cycle was the day before the onset of the next menstruation.
In order to make the assessment of cervical mucus quality more understandable and accessible, it was necessary to provide instructions for assessing the development of cervical secretion in the fertile window. Each patient was given individualized facilities to learn how to recognize their fertility by a physician who was an expert in fertility recognition. We also performed follow-up ultrasound scans and endocervical biopsy in highest fertility days. The analysis of the cervical secretion was done by exploration of the vulvovaginal discharge and recording it according to the Vaginal Secretion Recording System of the CrMS. All patients in the study learned to recognize fertile discharge. Patients were trained to recognize changes in cervical secretion during the follicular phase, while it was changing from less fertile to more fertile days. They learned to identify a wet secretion and to observe it, using a method similar to the Billings procedure. When patients experienced a wet sensation, distinct from dryness or the absence of noticeable discharge, they were instructed to apply the Hilgers scale, which evaluates two parameters: elasticity and transparency of cervical secretion [2].
The transparency was identified by K (“clear”) as the maximum
transparency standard on the CrMS scale, which means a maximum egg white-like
transparency score is identified by the letter ‘K’. The elasticity score of the
cervical discharge was coded according to the following guidelines: A = sticky:
less than 0.65 cm, equivalent to ¼′′ for the CrMS system. B =
sticky or (8): equivalent to (1–2 cm); (1.27–1.905 cm, equivalent to
½–¾′′ for the CrMS system). C = Elastic or (10):
The endocervical liquid biopsy was collected from -3 EDO until P-Day. Endocervical sampling for the study was performed with a Novack curette after a speculum was placed in the patient. The cervix was visualized and a sample was obtained by aspiration biopsy without inserting the curette more than 0.5–1.0 cm into the endocervical canal. The secretion was aspirated from inside the cervical canal without curettage of the endocervix. The liquid sample was spread on a glass slide and allowed air dry. Endocervical samples were taken from the endocervical canal and not from inside the endocervical crypts to contrast the crystallization pattern.
Fig. 1 depicts the methods used for digital acquisition and the computational method for the crystallization study. The sample were evaluated with an Motic Pantera digital microscope (Motic BA41OE, Barcelona, Cataluña, Spain) in order to check the area of the image to be digitized. Once the digital image of the samples was obtained, it was transferred to a personal computer for processing with IMAGEJ/1.53h, free version from the National Institute of Health and Laboratory for Optical and Computational Instrumentation (University of Wisconsin, Madison, WI, USA). With this program, binarization, skeletonization, and directionality of the image were performed using the Fourier function (Fig. 1). In an attempt to facilitate the observation of this pattern, a frequency study of the branches was conducted.
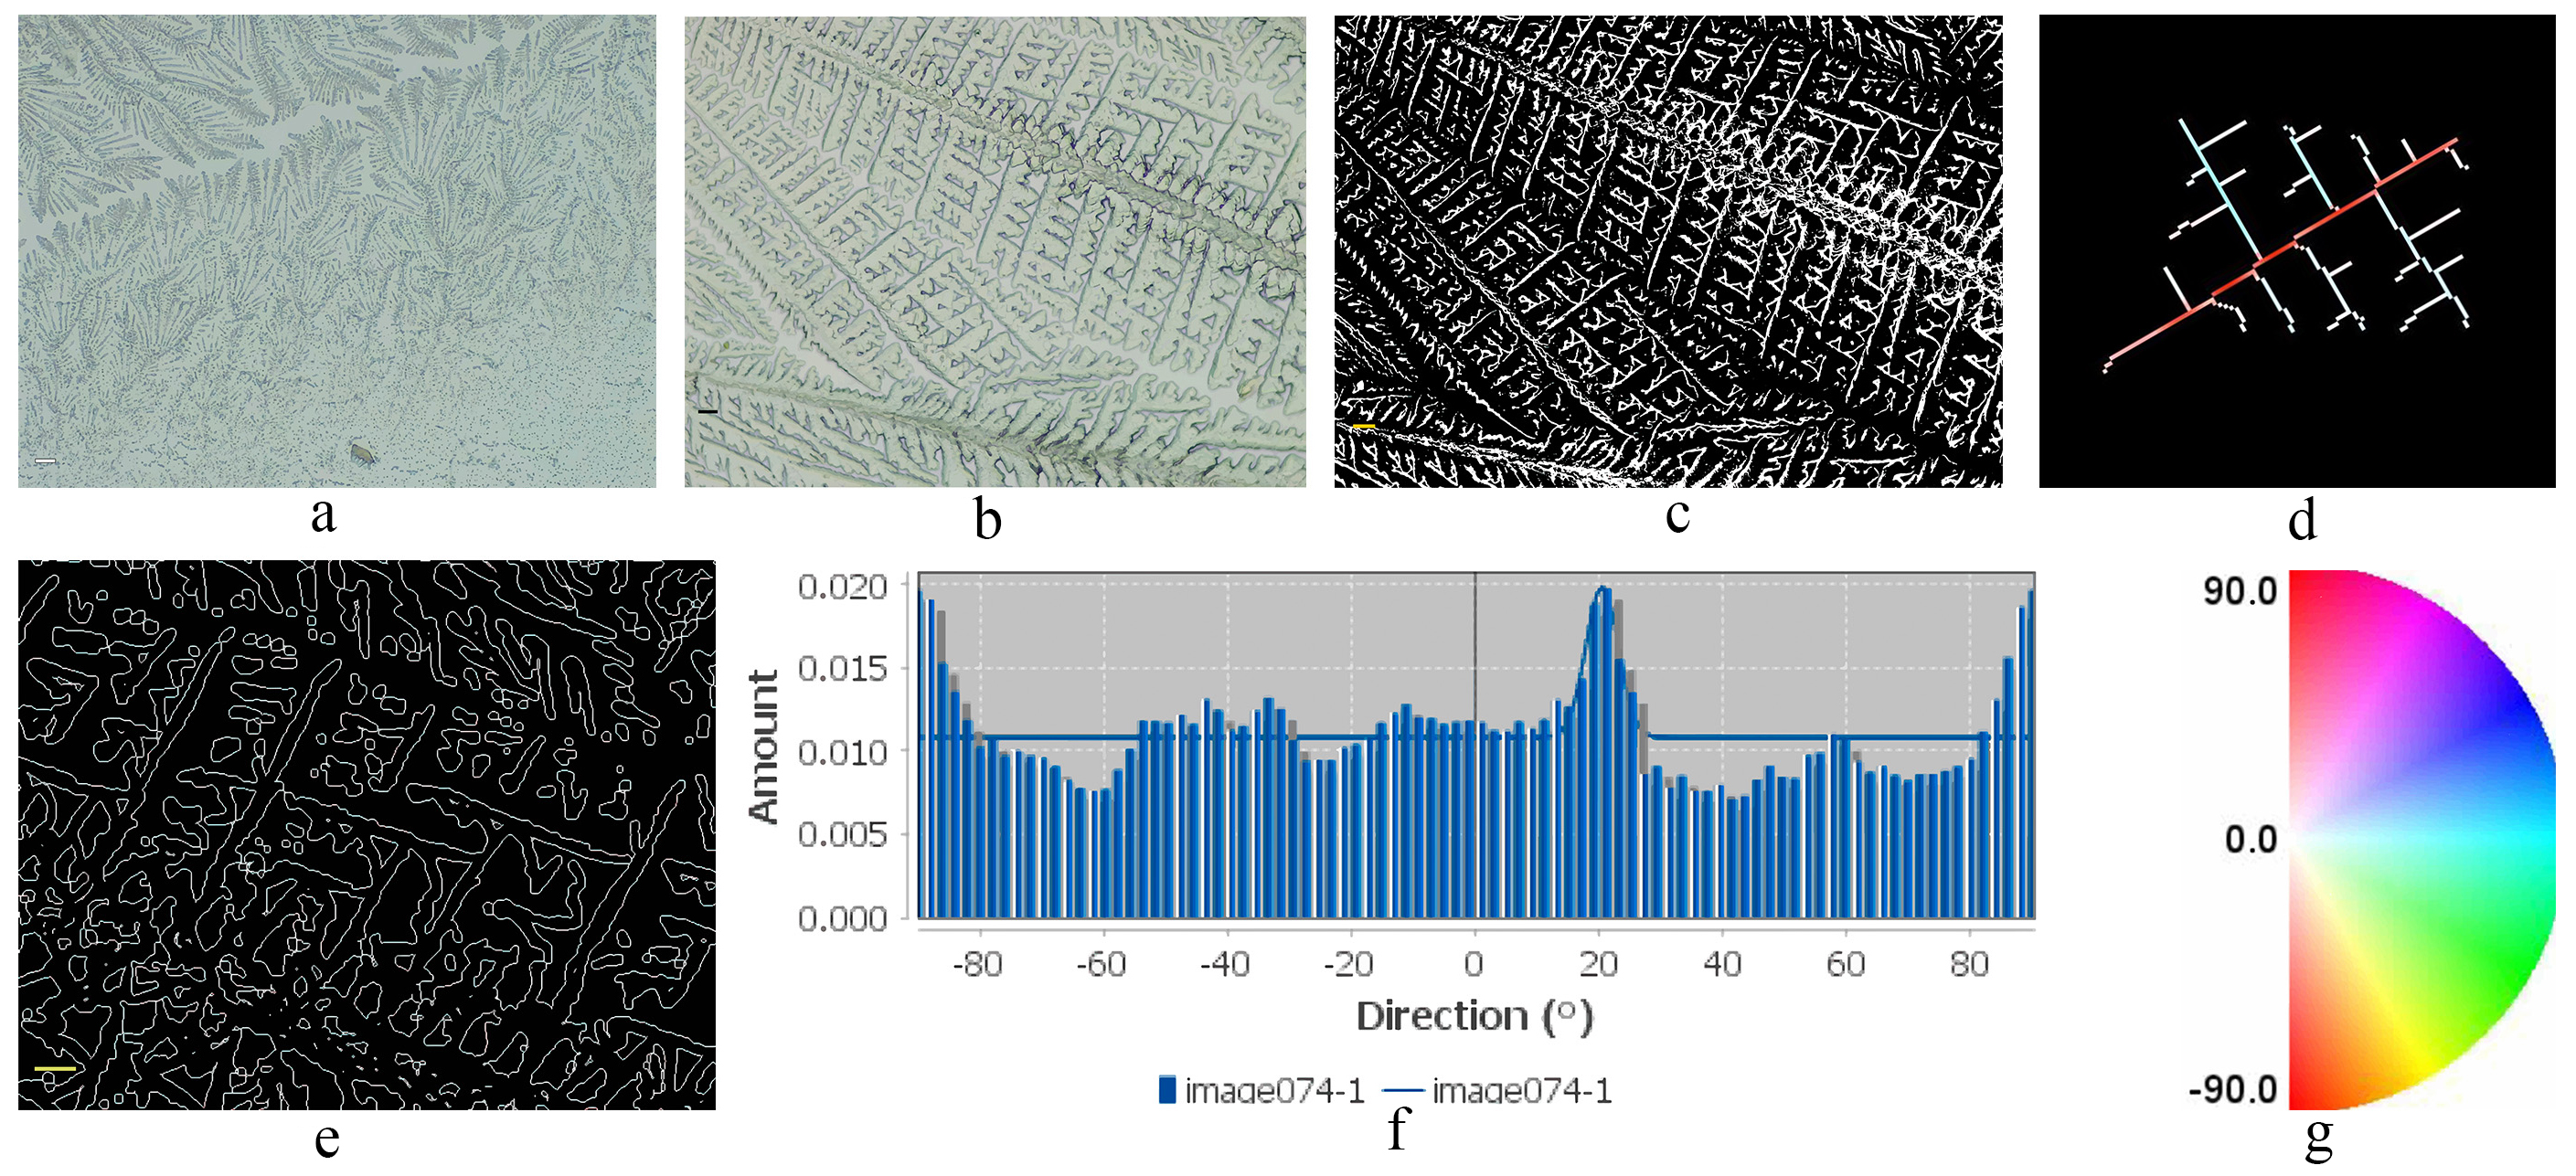 Fig. 1.
Methods of digitization, binarization, skeletonization, and
crystallization directionality of Peak (P)-type crystallization of endocervical
sampling. (a) Digitization. This capture shows in detail a maximum branching, to
study the digital image and captured zone on the microscopic that was performed
with a digital microscope at 200
The angles were studied using Fourier analysis, thus obtaining their frequencies. The frequencies repeated at 60° were observed. The statistical analysis described the frequencies of the angles found. They were then colored for easier observation, using a colored disc to visualize the 60°-angle characteristic of P-type crystallization. The gold standard for diagnosing a P-type crystallization pattern is the 60° branching according to Menárguez et al. [18]. The definition of the P-type hexagonal-branching matrix as the main measurement was characterized based on the study of the crystallization arborization of maximally branched endocervical secretion, as shown in Fig. 2. In this way, the hexagonal-branching matrix was defined as the main result of the measurement. Fig. 2a,b illustrate, in detail, the axes of the branches that originated at 60°. Fig. 2b shows, in detail, the axes of the branches at 60°. To be sure that they corresponded to a P-type crystallization, the angles were studied as shown in the frequency histogram of Fig. 2c. In the frequency histogram, several peaks of maximum frequency can be observed with a mean of preferential orientation at 60° and –60°. The preferred frequencies in the skeletonization in Fig. 2d are periodically repeated and represent in a mixture of colors, as can be seen in a tricolor pattern of the hexagonal configuration typical of a P-type crystallization. Fig. 2d contains a plot of an enlarged area of Fig. 2b and reflects a set of branches with maximum branching, displaying the coloring of the frequencies of various branching axes with preferred frequencies in four colors at 60°: in fuchsia, blue, red and yellow consistent with a P-type arborization as can be deduced from the color disc in Fig. 2e.
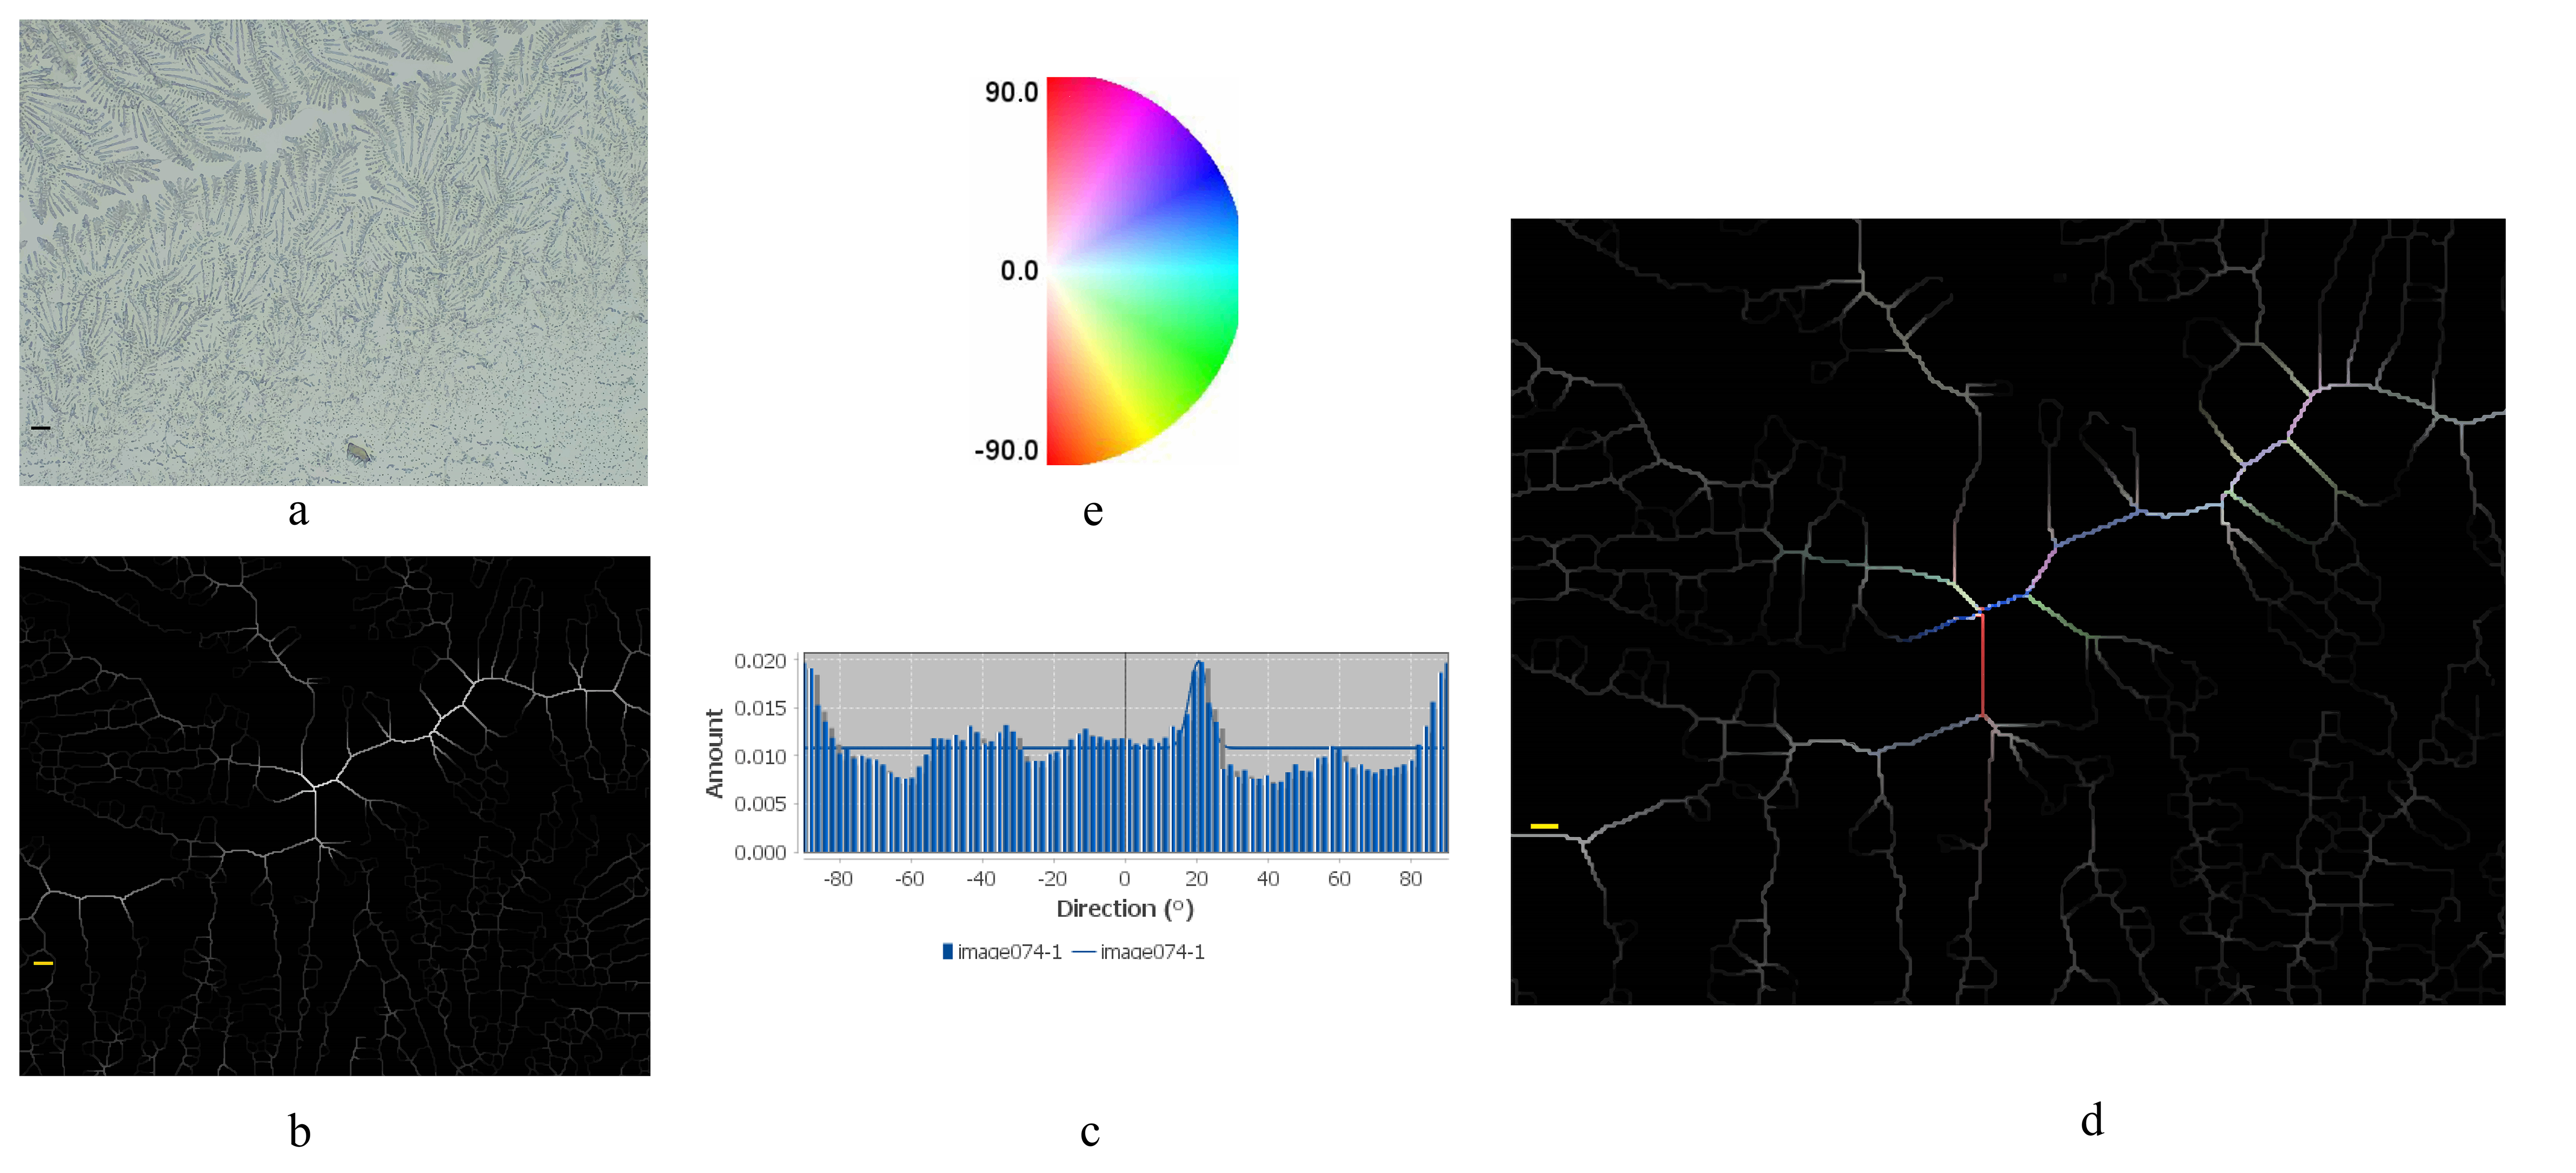 Fig. 2.
Definition of the main outcome measure: P-type crystallization with maximum branching and tricolor pattern in the hexagonal configuration. (a) Digitization of the maximum branching. Digitization of maximum branching in an endocervical crystallization sample (scale bar = 200 µm). (b) Binarization. The figure corresponds to the binarization of the digital image scan (scale bar = 100 µm). (c) Frequency histogram shows the distribution of the preferred frequencies. The average directionality in the absolute value of the branch connections was then plotted in a directionality histogram. (d) Skeletonization and coloration of crystallization frequencies. Repeated frequency complexes are observed in detail with maximum branching. Several repeated frequency complexes as seen in the histogram, which resemble a pattern of sequential frequency peaks consistent with a hexagonal shape as seen in the study. This type of pattern is characteristic of a P-type branching (scale bar = 50 µm). When coloring the preferred frequencies, a tricolor coloration of the frequencies of several 60° arborescence axes typical of a P-type hexagonal crystallization pattern were observed. (e) Color disc corresponds to the frequency angles on the chromatic disk to indicate the color relationship of the crystallization angles.
Finally, 6 patients were randomly selected from the study group to assess the final outcome of the pregnancy. The digital photographs in the six subgroup patients were performed using an iPhone SE, 13.7 version (model MP838Yr, Cupertino, CA, USA).
A chi-square analysis was performed between two groups of samples using SPSS 20.0 software (IBM Corp., Chicago, IL, USA), to assess the P-type crystallization selection pattern according to the directionality study performed in Fig. 1. A total of 18 samples corresponding (40%) were true positives, with the characteristic pattern type of the observed samples being the maximum branching in a P-type crystallization with a sensibility of 100%, 27 (60%) were correctly classified as true negatives with a specificity of 100%. No samples were classified as a false negative or false positive result.
All 18 of the 45 patients that were finally included in the study had a digital sample classified as positive, reflecting a set of chains with maximum branching. Fertile-window detection was successful in 100% of the cases, based on the study of the biophysical patterns of cervical secretion, elasticity, and transparency during the follicular and ovulatory phases. It was possible to recognize most fertile-window days between -3 EDO and P-Day in 100 % of the cases, in all cases the midpoint of the fertile window was included. This approach, based on the observation of elasticity and transparency in the follicular and ovulatory phases as described above, helped patients to recognize the days of highest fertility in the fertile window in 100% of the cases. The approach was also able to serve as a guide to performing endocervical liquid biopsy.
All samples were taken around the middle interval of the fertile window. In all patients it was possible to recognize P-type crystallization on the most fertile days of the fertile window (corresponding to an observation K type by CrMS of 10 and mucus score of 8). Sequential complexes of repetitive frequency at 60° in the crystallization pattern were observed as a coherent hexagonal shape and consistent with the main outcome-measure sample. The tricolor pattern of the hexagonal configuration typical of a P-type crystallization was positive in all 18 patients with endocervical samples in the highest fertile-window days.
Eighty-three percent (5/6) of the randomized subgroup of subfertile patients achieved a pregnancy with a final outcome with a healthy, term, live birth. The clinical characteristics of this subgroup can be seen in Table 2. The digital photographs in these 6 subgroup patients were performed using an iPhone SE,13.7 version (model MP838Yr, Cupertino, CA, USA).
| Clinical characteristics | Pregnancy outcomes |
| Final outcome pregnancy a | (5/6) 83% |
| Average age of the sample (years) | 35.1 (26–42) |
| Early pregnancy lost | (5/6) 83% |
| Recurrent pregnancy lost (RPL) b | (1/6) 16.6% |
| Prior IUI/IVF c | (2/6) 33.3% |
| Uterine factors/bicornuate uterus | (1/6) 16.6% |
| Submucosal myoma | (1/6) 16.6% |
| Thyroid disorders/hypothyroidism | (2/6) 33.3% |
| PCOS d | (1/6) 16.6% |
| Other endocrine disorders (Pre-obesity) e | (1/6) 16.6% |
| Primary infertility | (5/6) 83% |
| Poor semen analysis f | (2/6) 33.3% |
| Fertility awareness methods g | (6/6) 100% |
| LH/Pre Mom | (2/6) 33.3% |
| Symptom-Thermal-Method | (1/6) 16.6% |
| Ovulation stimulation/clomiphene citrate (CC) [100 mg. Orally. (1 |
(3/6) 50% |
| Ovulation Stimulation/letrozole [2.5 mg. Orally. (1 |
(1/6) 16.6% |
| Metformin 850 mg | (1/6) 16.6% |
| Luteal phase support/Seidigestan (200 mg) | (4/6) 66.6% |
| Aspirin (low doses 100 mg. Orally) | (2/6) 33.3% |
| Clexane (40 mg. Subcutaneous) | (2/6) 33.3% |
| Seidivid Ferty (Vit D3 10 ug, Folic Acid 400 µg, Myo-Inositol 4 gr); Melatonin (1.8 mg. Orally) | (3/6/) 50% |
a Final outcome: pregnancy and healthy term live birth.
b Two or more consecutive losses.
c 4 Artificial intrauterine inseminations (IUI) + 1 in vitro fertilization (IVF) attempt in one patient, and 1 IVF attempt in another patient.
d Polycystic ovary syndrome (PCOS).
e Body mass index (BMI):
f Low count: sperm quality score (SQS):
g Filancy and Transparency biomarker according to scale of the Creighton Model of Fertility Care (CrMS) and Billings Ovulation Method (BOM).
Among the subgroup of 6 subfertile patients with endocervical liquid biopsy and P-type crystallization patterns, it was possible to assess the quality of ovulatory response in the fertile window in all of the cases. All 6 patients had a 10K cervical secretion by CrMS with an endocervical liquid biopsy in the highest day of fertile window reflecting a set of branch chains with maximum ramification. Fig. 3 shows a sample from each patient showing characteristic branching arrangement in their maximum arborescent orientation with a 60°, hexagonal, P-type crystallization pattern. A restorative approach to fertile window was possible and allowed a good final outcome in this subgroup of patients. Table 2 shows the clinical characteristics and treatment administered to this subgroup of patients.
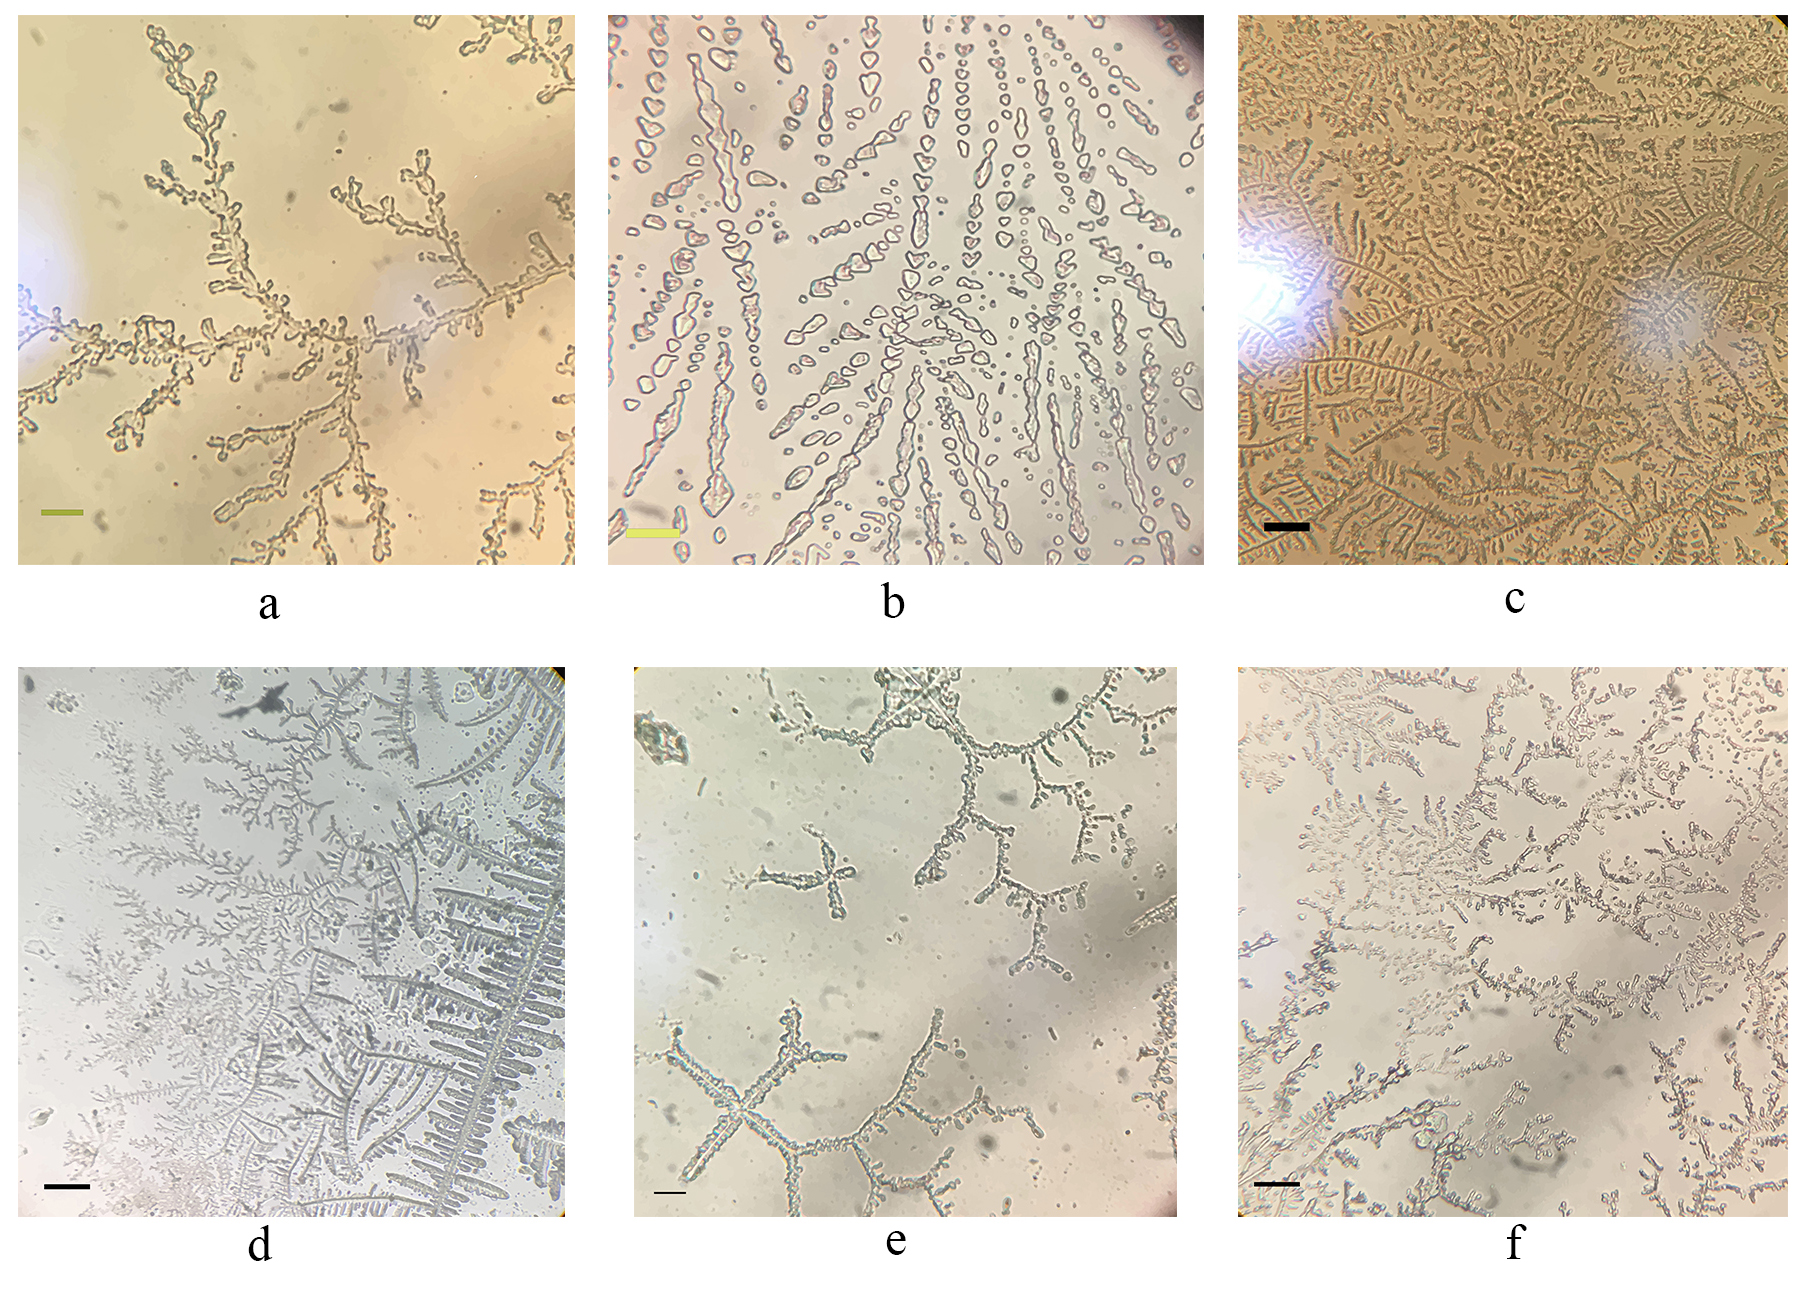 Fig. 3.
Digitization of the subgroup of the sample with P-type crystallization in the endocervical sample. This figure displays the digital images taken in this subgroup of patients. The digital captures taken in this case were performed using an iPhone SE, 13.7 version (model MP838Yr, Cupertino, CA, USA). Fig. 3 demonstrates in detail a maximum branching; several repetitive frequency complexes were observed that resembled a pattern of sequential frequency peaks consistent with a hexagonal shape. This type of pattern is characteristic of a P-type maximum-branching crystallization. By coloring the preferential frequencies, we saw a mixture of colors that did not correspond to a right-angled histogram as in the matching sample in a hexagonal direction. This type of pattern is characteristic of a P-type branching. As illustrated in Fig. 3a–f, a set of randomly selected patient samples with maximum branching is presented. This pattern corresponds to a sample within the fertile P-type window, as evidenced by the color coding of the directionality of the samples, demonstrating population peaks, as illustrated by the sequential order of the histogram in Fig. 2c. This capture illustrates the branching of the branch axes with frequencies compatible with P-type arborization. To observe the symmetry, an extension of this type of crystallization was performed, revealing an increase in the angles close to the 60° axis and in the maximum frequencies, as shown in Fig. 1f and Fig. 2c,d. This allows us to categorize the symmetrical pattern in the P-type crystallization sample perfectly in terms of its tendency to form arborised structures that keep the arborization at 60°. This pattern is consistent in all areas of the shots, as illustrated in the overview of all Fig. 3a–f. (a) (scale bar = 75 µm). (b) (scale bar = 25 µm). (c) (scale bar = 200 µm). (d) (scale bar = 100 µm). (e) (scale bar = 50 µm). (f) (scale bar = 100 µm).
In the present study, we identified the fertile window in ovulatory cycles of a random sample of subfertile patients. Currently most of the relevant studies performed on ovulatory cycles determined that the days of highest fertility start around 3 days before ovulation and last until 1 day after [3, 10, 14, 27]. Those findings coincide with the results of the present study in which elasticity and transparency of vaginal mucus, according to the CrMS model classification, was considered [4]. Other studies that detected the fertile window according to this method were those conducted by Hilgers [4] and Boyle et al. [29]. The CrMS-based fertility model requires a high level of understanding and training due to the complexity of the scale, as well as certification and follow-up by trained personnel. Nevertheless, this method allows for comparative results across different centers, as demonstrated in multicenter studies [6, 15, 29]. Other studies also apply a scale that recognizes the fertile window and takes into account a clinical approach in patients with both normal and sub-fertile cycles [16, 17, 30, 31]. The present study built upon the conclusions and advantages of that work, and also identified the highest fertility point within the fertile window while pinpointing the most fertile days in subfertile patients. It also verified the follow-up of EDO by tracking developmental changes in the transparency and stretchability of the cervical secretion. This method allows for an adequate assessment of sample quality through appropriate timing of the biopsy [32, 33, 34, 35].
The endocervical biopsy allowed us to typify the symmetric pattern of P-type crystallization almost perfectly in terms of its arborization, as seen in Figs. 2,3. In Odeblad’s diagram [19, 25], the characteristics of cervical secretion were well defined in conjunction with the different types of crystallization in the fertile window. Those studies allowed for the definition of P-type crystallization with branches at 60° and a hexagonal arrangement that coincides with the findings of the present study.
The P-type mucus pattern was originally described by Odeblad [19, 25]. That work
remains the reference, from a comparative perspective, due to the thoroughness of
the work. A mucolytic enzyme, probably originating from the cervical isthmus, was
associated with this mucus and facilitates the upward movement of spermatozoa.
This anatomical arrangement may be the reason why the collection of samples with
P-type characteristics is observed with some ease. In our case, it is possible
that the higher incidence of the P-type pattern in the cervical mucus studied by
a simple biopsy could have been due to the fact that the biopsy was performed at
the time of peak fertility, when the expression of the mucoprotein that produces
this crystallization pattern is highest. This type of approach could help in some
cases in which patients find it difficult to perform CrMS or other types of
point-of-care biomarkers. Currently, there are several strategies that allow for
the evaluation of follicular development. Among the most widely used is the one
that identifies the peak day by considering EDO using cervical secretion
examination or ultrasound, with its verification through follicular emptying. In
the present study it was possible to perform these evaluations in all cases,
allowing us to identify the fertile window by ultrasound, and to predict a good
window of implantation with a secretory endometrium greater than 6 mm in the
endometrial strip. The variability of the peak day, by cervical secretion, ranged
from
In all cases, we found a typical crystallization of maximum branching. The presence of this pattern does not necessarily mean the non-presence of pathology; therefore, a clinical assessment was necessary. It was possible to establish a good fertile window in all patients and therefore a P-type crystallization was found in the whole series (Fig. 3). However, clinical, echography study and hormonals determinations were taken into account to ensure a good clinical assessment of the fertile window (Table 1). The window of implantation and its anatomical features were also assessed. Indeed, any anatomical abnormality that would hinder embryo implantation, such as a myomatous pathology, uterine obstruction, or the presence of a septate uterus, would have been detected. If intramural and subserosal leiomyomas are not very large, in general, they may not produce problems with endometrial-line evaluation, and when small myomas are intramural, with or without contact with the endometrial line, they may not affect fertility and thus were included [36].
In the present study we did not perform routine blood testing in all cases, because it was an invasive test for the patients and some of the patients were intolerant of blood testing. The verification of the ovulatory cycle was by ultrasound of the fertile window, and checkpoint repair allowed the combination of known biomarkers to be used for the evaluation of ovulatory cycles. Other series of tests evaluated the post-peak estrogen and progesterone curves that had been proposed by Hilgers [4] to analyze luteal or follicular insufficiency. This strategy allowed us to assess whether the treatment being conducted, in order to achieve a mature follicle, was adequate and if not, to adjust the treatment.
In this series of tests, monitoring and eliminating follicular failure was one of the main challenges in establishing the optimal conditions for achieving pregnancy. The diagnosis and monitoring of follicular development is currently the tool that allows us to evaluate the quality of the ovulatory cycle, to obtain a mature oocyte that is released at the right time of the menstrual cycle and can be fertilized at the optimal moment of its maturation. Generally, with the presence of menstrual cycles without symptoms of follicular failure, early premature ovarian insufficiency is unlikely [37, 38].
In the present study, the assessment of the fertile window (Table 1) ensured an
adequate second phase in the absence of a short luteal phase, a delayed
follicular phase, the presence of an endometrial secretory line, and a corpus
luteum of
Therefore, we considered that it was possible to obtain a mature oocyte, and its eventual follicular rupture, using the checkpoints considered in Table 1. Currently there are no other means to document this finding in vivo, so verification of follicular emptying is still performed by ultrasound monitoring. However, the presence of peak cervical mucus, peak follicular diameter before rupture, or LH peak in urine, allows for the possibility of a mature follicle [35].
When follicular stimulation was necessary, adequate follicular development was achieved with the help of ultrasound follow-up and evaluation of biophysical changes in cervical secretion. In the randomized subgroup, two patients required additional studies to reestablish the fertile window by assessing estrogen and progesterone at peak day +7 (P+7), due to the difficulty in achieving a mature follicle.
Three patients were treated with clomiphene citrate 100 mg orally once daily (Cyndea Pharma, S.L. C.P: 42110, Ólvega, Soria, Spain) from days 5 to 9 of the cycle, one with letrozol (2.5 mg, orally, Cinfa S.A. C.P: 31620, Huarte, Navarra, Spain) for 5 days in the follicular phase, and two cases required metformin (850 mg/day, one day for the whole month by oral administration Sandoz, S.A. C.P: 28033, Madrid, Spain). One patient who required follicular stimulation was unable to achieve pregnancy (Table 2). In this patient, detection of the urinary LH surge was guided by developmental changes in cervical secretion and ultrasound to verify normal emptying of the ruptured follicular sac, and estrogen and progesterone levels were examined at P+7.
Follicular sac, and estrogen and progesterone levels were examined at P+7. In the remaining cases in which pregnancy was achieved, it was not necessary to determine the LH surge level, which would not have been decisive in determining the days of maximum fertility. In our experience, screening LH alone is sometimes confusing, and patients do not really know how to identify fertile days in cases in which there is no adequate regulation of ovulation, so it is more confusing than useful. Seidivid Ferty (10 µg Vit D3, 400 µg Folic Acid, 4 gr Myo-Inositol, 1.8 mg Melatonin; SEID, S.A. C.P: 08185 Llica Vall, Barcelona, Cataluña, Spain) were used to enhance follicular development in PCOS cases and in cases with delayed follicular growth. Two other patients received Seidigestan, 200 mg (SEID, S.A. C.P: 08185 Llica Vall, Barcelona, Spain) in the second phase of the cycle due to a previous miscarriage.
A recently published multicenter study was very cautious in its assessment of anti-Müllerian hormone (AMH, or Müllerian inhibiting hormone, MIH) and only allows for the determination of extreme groups of AMH values, such as when the patient is fertile at a young age or has failed to receive adequate follicular stimulation around menopause. That study did not assigning a cutoff value to AMH values, out of caution. Therefore, AMH levels were not considered in the present study in the absence of a general clinical evaluation [39].
An examination for chronic endometritis was not performed, nor were lymphocytic markers probed, because there was no clinical evidence to indicate or guide the performance of such an examination. In the present study, the males’ contribution was assessed by medical history, in which male infertility was ruled out in the anamnesis. In all cases the presence of male infertility was ruled out by clinical history. A cervical secretion sample was taken to assess sperm motility by means of a postcoital test. The postcoital test allowed us to integrate qualitative assessment of sperm motility in cervical mucus with fertile characteristics [4]. This triad (a good cervical mucus score, a P-type hexagonal crystallization pattern, and good sperm motility) was found to be positively correlated with a positive pregnancy outcome in 83% of subgroup cases. For this reason, no further karyotyping, immunological, or sperm-DNA-fragmentation studies were performed.
The main weaknesses of the present study are (a) the small sample size, (b) that it was not possible to follow up all selected patients, (c) stress and fatigue in some cases, because some cases needed longer follow-up and (d) in some cases, it was not possible to follow up postovulatory hormone curves.
Another important point is that recently developed software has been designed to allow the user to perform several tasks to help detect the fertile period. There has been a rapid growth of mobile computing software applied to women’s health in the menstrual cycle. In patients without fertility problems, the increasing use of these techniques is helping to detect the fertile period by 10–20%, with these types of apps providing information on when the closest time to ovulation occurs, but with no reference to anything other than the calendar [40, 41]. In general, this types of app does not integrate variables to determine the quality of a cycle. In subfertile patients, these apps have limited application due to the individual variability of each cycle, and because specific treatments sometimes change monthly to achieve a high-quality cycle.
In the present experiments, an invasive procedure was performed as a selective procedure for each patient, and we can say that the application of new techniques, in conjunction with a correct high-level clinical assessment, can provide a useful diagnostic tool and to improve the interpretation of cycles and clinical diagnosis of subfertile patients. Therefore, this biotechnology, applied appropriately, is likely to help, in conjunction with the clinic, to solve cases that have heretofore been unsolvable. Self-exploration, in fertility awareness, is a well-accepted learning model in clinical practice. The possibility of identifying the type of vaginal-discharge crystallization in the future, through self-exploration and simple techniques, could be an interesting resource to develop for patients with fertility problems who desire to become pregnant.
The present study also highlights the novelty of clinical assessment of the fertile window and its association with the P-type crystallization pattern. This technique does not replace markers or endometrial assessment, ultrasound, cervical-mucus assessment, or urinalysis to assess steroid and progesterone tracking; that was not the objective of the study. We explored a tool that, as a biomarker, that can help to recognize a high-quality fertile window, because behind this type of crystallization, in 100% of our cases there was high quality mucus with patterns that are known to be highly correlated with a high rate of successful pregnancies (e.g., 3,5,4). The procedure was investigated as an additional tool that can help in cases where comprehensive monitoring by serial blood tests is not available, or to simply be used in conjunction with the fertile window, menstrual cycle, cervical mucus, or other markers (e.g., basal body temperature, LH assay) to determine fertile days in the fertile window. However, the procedure must be supported by a clinical assessment, such as the one performed in the present study.
Finally, with this work we have tried to integrate with clinical evaluation an examination in which the elasticity and transparency of cervical secretion, along with crystallization, is evaluated using an objective reference. Other models can help recognize the integrity of the fertile window and assist in the evaluation of, and strategy for, infertile patients to try to achieve pregnancy with the help of crystallization patterns. Crystallization today is not subject to an objective practical application due to the complexity of the interpretation of data. However, using this method we have tried to get closer to applying these changes in the awareness of fertility in subfertile patients.
The present study attempted to integrate a test that assesses the elasticity and transparency of cervical mucus, and its crystallization pattern, using an objective reference point. The triad of (a) high-quality cervical mucus with (b) an adequate diagnosis of the fertile window and (c) a P-type crystallization pattern, apparently can predict a highly likely successful pregnancy.
The main advantage of this approach is its ability to identify the most fertile days within the fertile window, particularly in conjunction with liquid biopsy to assess cervical crystallization. This method and the identification of P-type mucus may provide an alternative strategy, in some cases, for patients who desire to assess the quality of the fertile window.
The data sets used and analyzed during the present study are available upon reasonable request and describing the reason to the corresponding author.
JMM developed the study concept, study design, methodology, project management, performed data acquisition and interpretation, and wrote the manuscript and draft. As well as preparation, creation, submission of the paper for publication, comments and review of the paper. Additionally, JMM revised the manuscript and addressed final issues to editing and wrote the original draft. ZHC and MartaME participated in data acquisition and style correction of the manuscript. MaríaME helps in interpretation and statistical validation of the study. OMM and MAMC both contributed to the development of the software for the statistical validation of the mean measure of the study and in the elaboration of graphs and figures. All authors read and approved the final manuscript. All authors contributed to editorial changes in the manuscript. All authors have participated sufficiently in the work and agreed to be accountable for all aspects of the work.
All the patients provide informed consent for inclusion before participating in the study, which was carried out in strict accordance with the Declaration of Helsinki. The study protocol was approved by the Ethics Committee of CEImLAR, Center for Biomedical Research of La Rioja (CIBIR) (approval number PI-548).
We would like to thank all the patients who participated in the study as everyone who contributes to making this work possible. We also thank the reviewers and those who contributed to the final editing of the manuscript for their contributions, and the journal’s steering committee for their kind attention and follow-up during the editing process.
This research received no external funding.
The authors declare no conflict of interest. José María Murcia Lora was serving as one of the Guest editors of this journal. We declare that José María Murcia Lora had no involvement in the peer review of this article and has no access to information regarding its peer review. Full responsibility for the editorial process for this article was delegated to Michael H. Dahan.
References
Publisher’s Note: IMR Press stays neutral with regard to jurisdictional claims in published maps and institutional affiliations.