


 , Xiao Shen 1, Yixiao Wang 1, Hong Yu 1,*
1 Department of Obstetrics and Gynecology, Zhongda Hospital, School of Medicine, Southeast University, 210000 Nanjing, Jiangsu, China
Abstract
The relationship between gut microbiota and red blood cell folate levels in preeclampsia remains unclear. This study aimed to assess the differences in red blood cell folate levels and gut microbiota between pregnant women diagnosed with preeclampsia and healthy pregnant women and to investigate the association between gut microbiota composition and red blood cell folate concentrations.
We employed a case-control study to investigate gut microbiota composition and red blood cell folate levels in preeclampsia, as well as the correlation between them. 10 pregnant women diagnosed with preeclampsia and 16 healthy pregnant women were recruited, and whole blood and stool samples were collected from all participants. For the blood samples, levels of total folate, 5-methyltetrahydrofolate, 5,10-methylenetetrahydrofolate, erythrocyte unmetabolized folate, and 5-formyltetrahydrofolate in red blood cells were measured utilizing high-performance liquid chromatography coupled with tandem mass spectrometry in Multiple Reaction Monitoring (MRM) mode. Microbial diversity in fecal samples was analyzed by 16S rRNA sequencing. The correlation between the microbiota α-diversity and red blood cell folate levels was calculated through Pearson correlation analysis.
There were no statistically significant differences in age, gestational age at the time of specimen collection, or body mass index between the preeclampsia group and the control group (all p > 0.05). Compared to the control group, the preeclampsia group showed significantly lower levels of total folate in red blood cells (p < 0.001), 5-methyltetrahydrofolate (p = 0.001), and 5,10-methylenetetrahydrofolate (p = 0.002). However, there were no differences in the levels of 5-acyltetrahydrofolate (p = 0.816) and unmetabolized folate (p = 0.241) in red blood cells between the two groups. Statistical analysis revealed significant differences between the two groups in several α-diversity indices of the gut microbiota, including the abundance-based coverage estimator (ACE) index (p = 0.011), Chao1 index (p = 0.010), PD_whole_tree index (p = 0.046), Shannon index (p = 0.015), and Simpson index (p = 0.043). These findings highlight notable differences in microbial diversity between the groups. The β-diversity analysis demonstrated significant compositional differences in the gut microbiota between samples, which were evident across multiple taxonomic ranks, including phyla, classes, orders, families, genera, and species. The Pearson correlation analysis revealed that levels of total folate, 5-methyltetrahydrofolate, and 5,10-methylenetetrahydrofolate in red blood cells were significantly associated with the α-diversity of gut microbiota.
Significant changes in erythrocyte folate level and intestinal microbiota diversity were observed in preeclampsia patients. Based on the limited data, the results of the Pearson correlation analysis indicate a significant association between red blood cell folate levels and gut microbiota diversity. However, this association should be interpreted with caution.
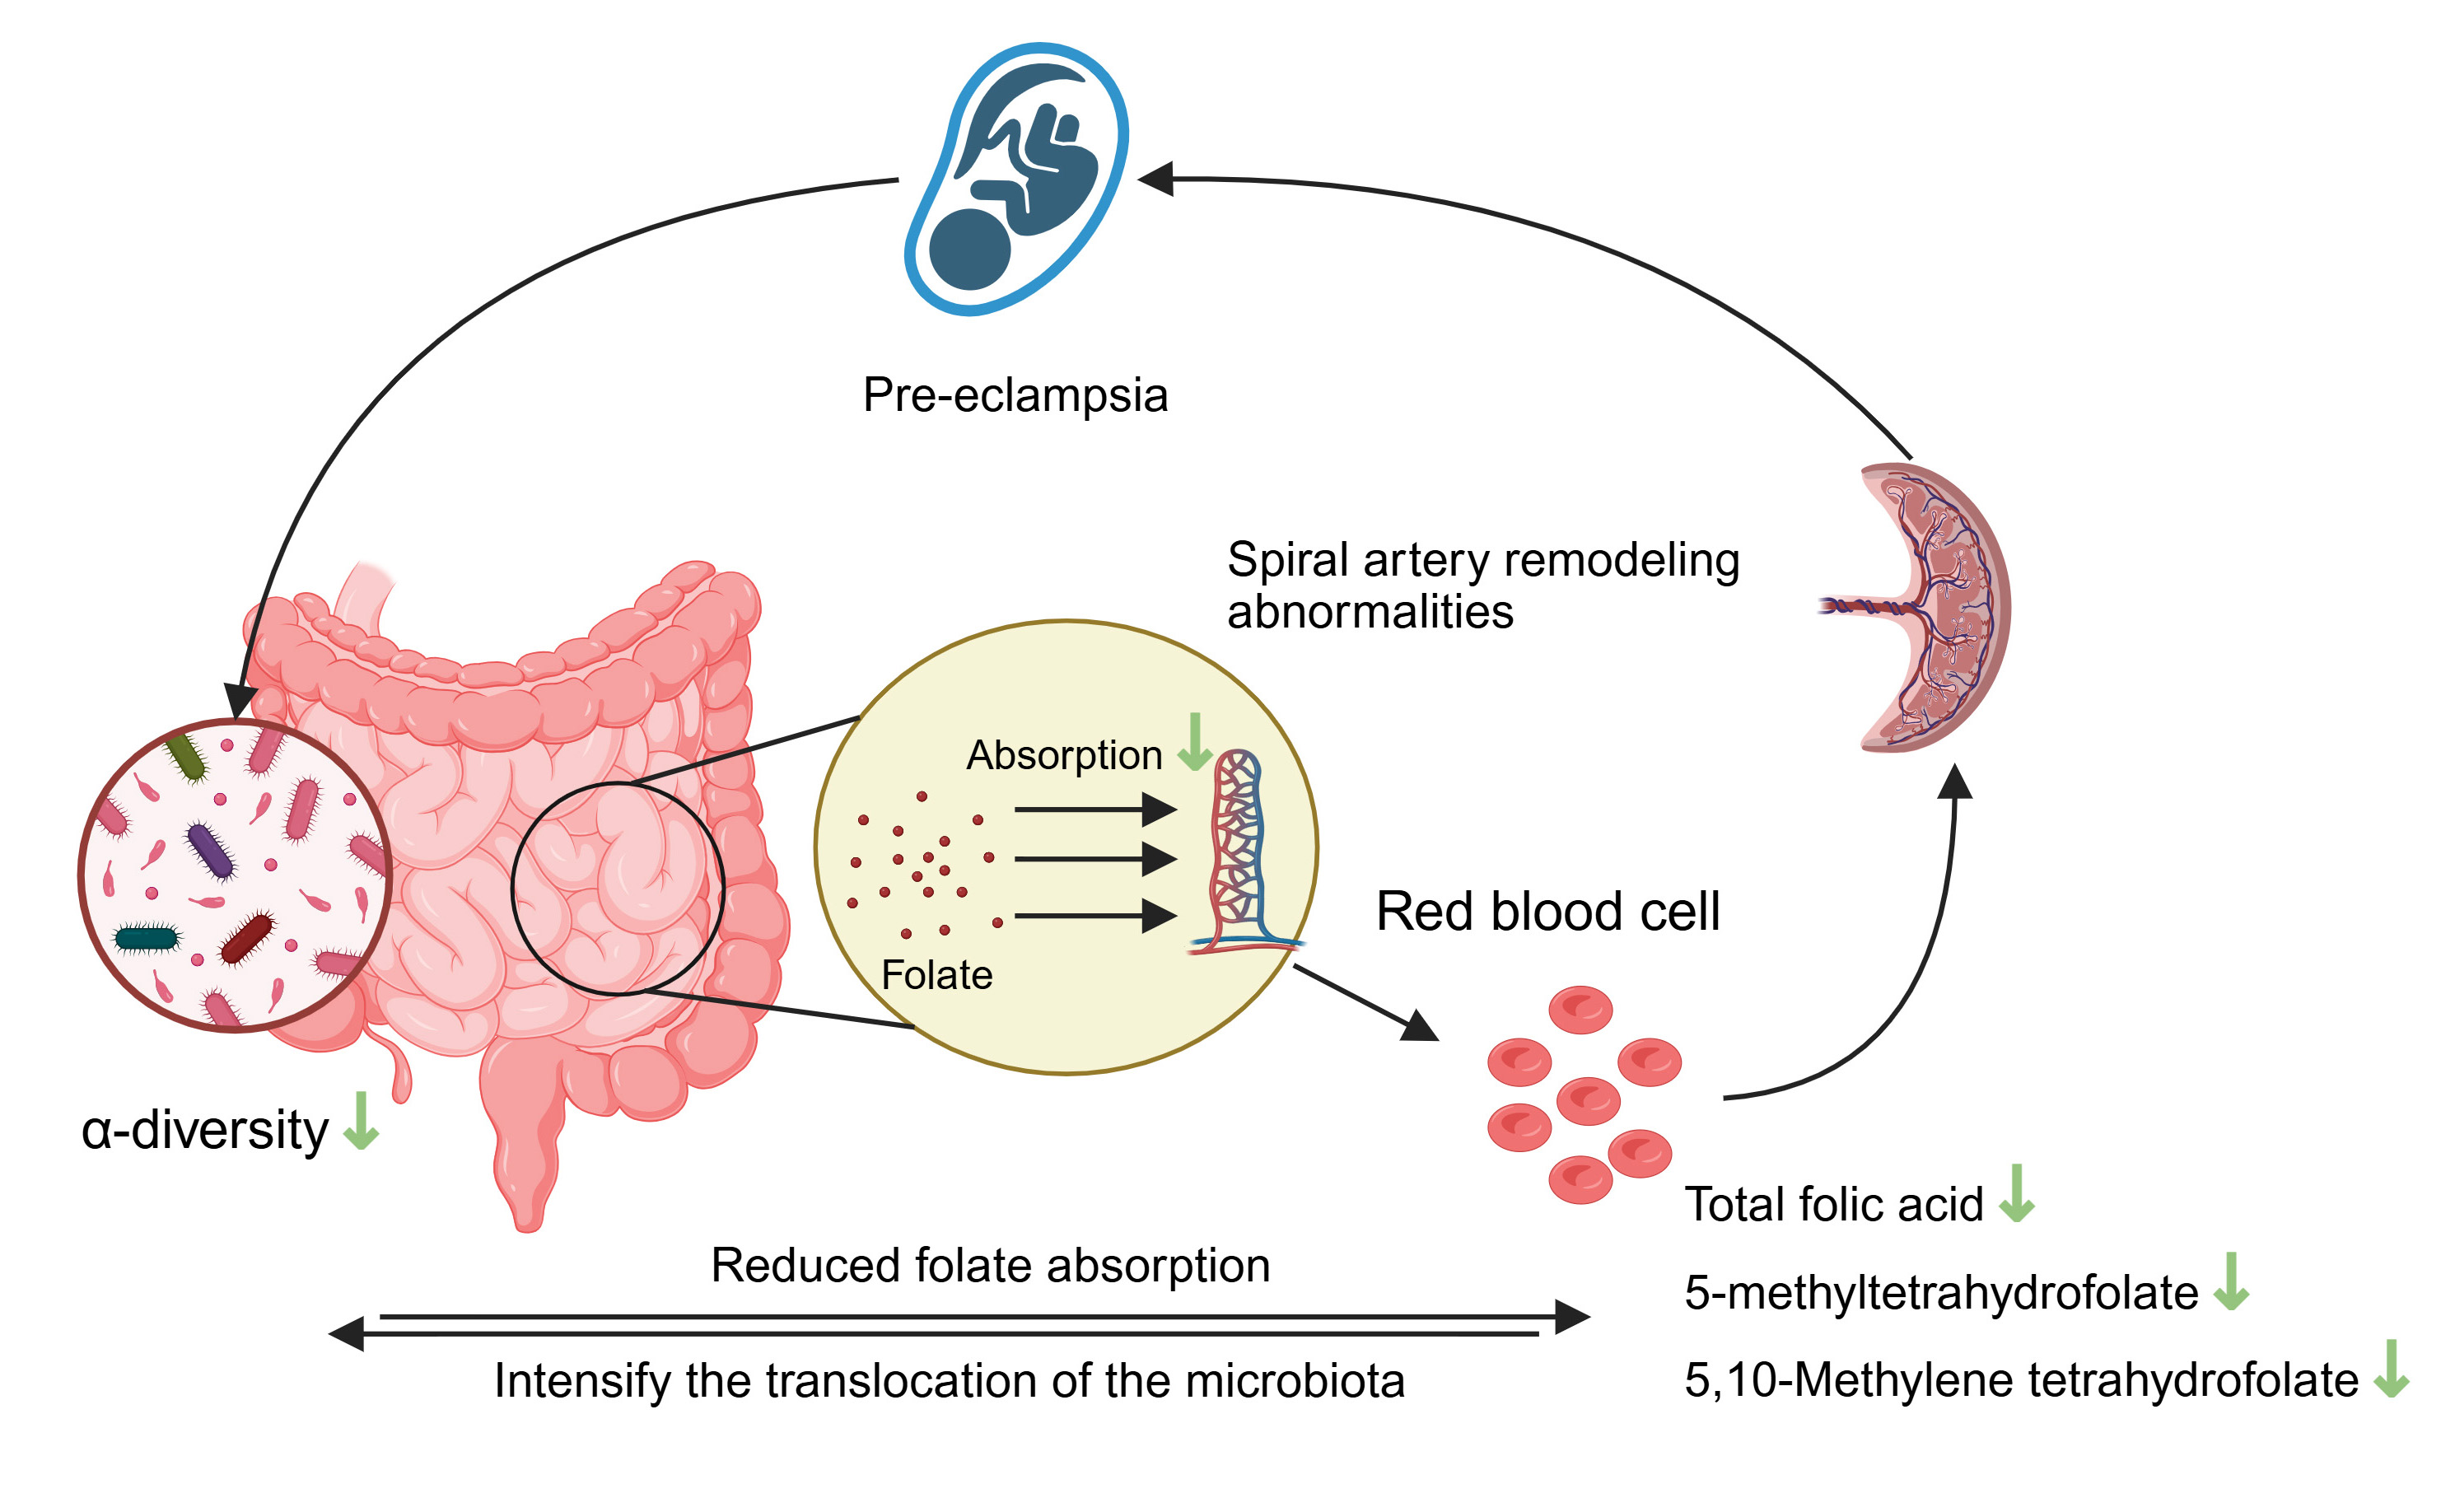
Graphical Abstract
Keywords
- preeclampsia
- red blood cell folate
- gut microbiota
Preeclampsia (PE) is a syndrome that occurs during pregnancy and impacts multiple organ systems. It is typically characterized by the development of high blood pressure and the presence of protein in the urine, usually manifesting after the 20th week of gestation. With a global incidence of approximately 2% to 8%, it is one of the major causes of maternal and perinatal mortality [1]. The core of its pathology is oxidative stress, inflammatory response and vascular endothelial damage triggered by shallow placental implantation. Currently, placental dysfunction is considered as the central link in the pathogenesis of preeclampsia [2, 3, 4, 5].
In recent years, studies have found that gut microbiota dysbiosis is involved in the pathological process of preeclampsia through the gut-placenta axis [6, 7, 8]. The study has found that there seems to be a correlation between gut microbiota and folate [9]. Folic acid, a water-soluble vitamin, is essential during early pregnancy because it is deeply involved in processes such as DNA methylation, protein production, and nucleic acid formation. As a core substance of one-carbon metabolism, its abnormal metabolism is closely related to placental function [10]. In the body, folate needs to be converted into tetrahydrofolate by dihydrofolate reductase, and then the active form of 5-methyltetrahydrofolate is generated through methylenetetrahydrofolate reductase [11]. The failure of normal placental function during early pregnancy leads to the abnormal release of various factors from the placenta. These factors will cause maternal symptoms, thus leading to the maternal syndrome [12]. In patients with preeclampsia, folate deficiency may be associated with preeclampsia [13].
However, folate supplementation during pregnancy does not reduce the risk of preeclampsia [14]. Folate supplementation does not necessarily mean an increase in maternal folate levels, which may be regulated by various factors, such as the gut microbiota [15, 16]. In addition, red blood cell folate is an objective indicator of circulating folate levels and is more reliable [17, 18]. Therefore, examining the association between red blood cell folate concentrations and gut microbiota is more beneficial for advancing our understanding of preeclampsia, including its underlying mechanisms and potential treatment strategies. For this reason, in this study, we comprehensively evaluated the relationship between the red blood cell folate levels and the gut microbiota in women with preeclampsia.
This was a case-control study conducted at Zhongda Hospital Affiliated to Southeast University. All biological samples were collected in 2024. A total of 26 participants were enrolled in this study, including 10 women diagnosed with preeclampsia and 16 participants in the control group, whose ages and gestational weeks at the time of biological sample collection were matched with those of the preeclampsia patients. In addition, we collected the demographic information of all participants from the electronic medical record system.
The inclusion criteria for preeclampsia were as follows: (1) Pregnant women with singleton pregnancy diagnosed with preeclampsia according to the American College of Obstetricians and Gynecologists (ACOG) guidelines [1]. The criteria for exclusion included the following conditions: (2) Use of preeclampsia-related therapeutic drugs before the collection of biological samples; (3) Presence of digestive system diseases or abnormalities, such as diarrhea; (4) Using drugs that may affect the gut microbiota, such as antibiotics, in the past month; (5) Pathogen infection at any site; (6) Complications with other pregnancy-related diseases, such as gestational diabetes mellitus or intrahepatic cholestasis of pregnancy; (7) Unable to cooperate with the collection of biological samples for any reason; (8) Any fetal abnormalities unrelated to preeclampsia; (9) Any history of serious diseases in pregnant women.
To be included in the healthy control group, participants had to meet the criteria of having a single pregnancy and not having preeclampsia. Participants were excluded if they met any of the following criteria: (1) Presence of digestive system diseases or abnormalities, such as diarrhea; (2) Using drugs that may affect the gut microbiota, such as antibiotics, in the past month; (3) Pathogen infection at any site; (4) Complications with other pregnancy-related diseases, such as gestational diabetes mellitus, intrahepatic cholestasis of pregnancy, etc.; (5) Unable to cooperate with the collection of biological samples for any reason; (6) Any fetal abnormalities unrelated to preeclampsia; (7) Any history of serious diseases in pregnant women.
The flow chart (Fig. 1) shows the research design.
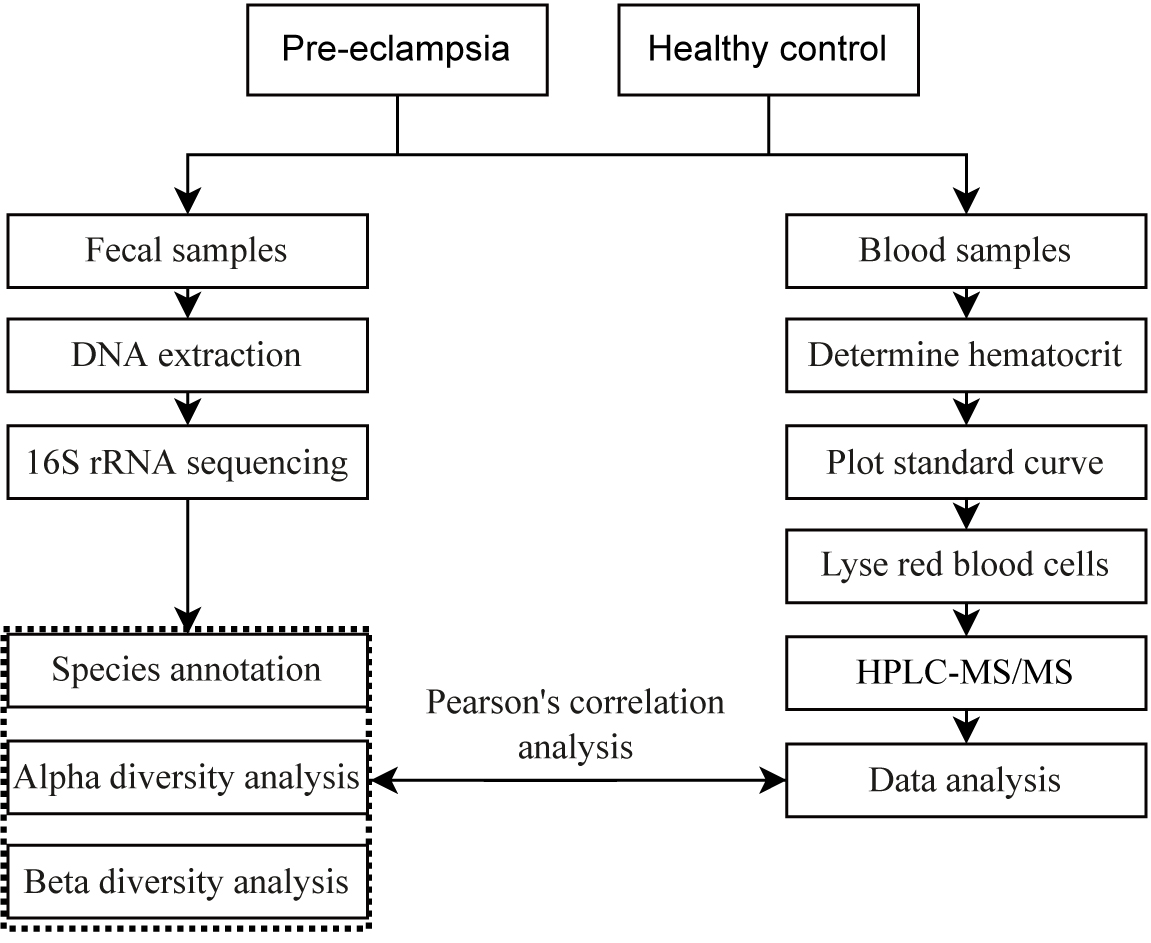 Fig. 1.
Flow chart of the research design. HPLC-MS, High Performance Liquid Chromatography-Tandem Mass Spectrometry.
Once the subjects meet the inclusion criteria, we collected 2 mL of venous blood using an Ethylenediaminetetraacetic acid (EDTA)-containing anticoagulant tube. The blood samples were maintained at a temperature of 4 °C during transport and storage to ensure accurate red blood cell folate analysis. Samples with obvious hemolysis and other abnormal conditions were regarded as unqualified samples.
After the subjects defecated into a sterile and dry container (avoiding mixing with blood or urine), at least 2 g of feces was collected into a sterile collection tube for gut microbiota sequencing. The samples were stored in a refrigerator at –80 °C.
For the detection of red blood cell folate, the samples were pretreated by incubation with mouse serum and solid-phase extraction method. The analytes were detected using the Multiple Reaction Monitoring (MRM) mode of High Performance Liquid Chromatography-Tandem Mass Spectrometry (HPLC-MS/MS) (Waters Masslynx 4.1, Waters Corporation, Milford, MA, USA). The items to be detected include red blood cell folate, 5-methyltetrahydrofolate, 5,10-methylenetetrahydrofolate, 5-formyltetrahydrofolate, and unmetabolized red blood cell folate.
The total DNA of the samples was extracted using a DNA extraction kit (DP302, Tiangen Biotech, Beijing, China), and specific primers with a Barcode label were synthesized according to the full-length primer sequence for PCR amplification. The PCR products were then purified, quantified, and combined to construct the sequencing library (SMRT Bell). Ultimately, high-quality libraries were sequenced on the online platform BMKCloud (www.biocloud.net).
Statistical analyses were conducted with SPSS software version 22.0
(International Business Machines Corporation, Armonk, NY, USA). The
normality of continuous variables was assessed using the Shapiro-Wilk test.
Normally distributed count data were summarized as the mean
Based on the analysis results of features in 16S rRNA sequencing, taxonomic classification was performed across different levels, generating community structure charts, species clustering heatmaps, phylogenetic trees, and taxonomic dendrograms for each sample at the phylum, class, order, family, genus, and species levels. Alpha diversity analysis was carried out to study the species diversity within a single sample. After counting the abundance-based coverage estimator (ACE), Chao1, Shannon and Simpson indexes of each sample, the researcher drew sample dilution curves and grade abundance curves accordingly and then compared the differences in species diversity among different samples by using Beta diversity analysis. According to the distance matrix, the sample hierarchical clustering (UPGMA) tree, non-metric multidimensional scaling (NMDS) analysis, sample clustering heatmap, and sample principal component analysis (PCA) and principal coordinates analysis (PCoA) plots at the corresponding distances were obtained. At the species taxonomy level, intergroup differences in species abundance were further assessed through significance testing, and biomarkers showing statistically significant variations between groups were identified. Based on 16S rRNA or internal transcribed spacer (ITS) gene sequencing data, the researchers performed functional predictive analyses to infer the gene function or phenotype of the sample and calculated the abundance of the predicted functional gene or phenotype.
Finally, Pearson’s correlation analysis was conducted to assess the association between folate levels and gut microbiota alpha diversity. Statistical significance was defined as a p-value of 0.05 or less.
There were no significant differences in age (p = 0.554), pre-pregnancy
body mass index (BMI, p = 0.134), and gestational weeks at biological
sample collection (p = 0.776) between the 2 groups of subjects (Table 1), indicating that the 2 groups of subjects were comparable. The gestational
weeks at delivery in the preeclampsia group were shorter than those in the
control group (p
| Control | Preeclampsia | U/ |
p-value | |
| (n = 16) | (n = 10) | |||
| Age, mean |
31.06 |
30.20 |
–0.601 | 0.554 |
| BMI, mean |
21.76 |
23.90 |
1.553 | 0.134 |
| Gestational weeks at the time of sample collection, median (IQR) (weeks) | 33.64 (2.18) | 32.86 (2.00) | 74.00 | 0.776 |
| Gestational weeks at delivery, median (IQR) (weeks) | 39.29 (1.11) | 34.43 (3.68) | 2.500 | |
| Primipara, n (%) | 15 (93.75) | 8 (80.00) | - | 0.538 |
| Spontaneous pregnancy, n (%) | 15 (93.75) | 9 (90.00) | - | 1.000 |
| Drinking, n (%) | 0 (0.00) | 0 (0.00) | - | - |
| Smoking, n (%) | 0 (0.00) | 0 (0.00) | - | - |
SD, standard deviation; IQR, interquartile range; BMI, body mass index.
We detected and analyzed the red blood cell folate levels in 10 patients with
preeclampsia and 16 healthy pregnant women. The results revealed that the levels
of total erythrocyte folate (p
| Control | Preeclampsia | U/t | p-value | |
| (n = 16) | (n = 10) | |||
| Total erythrocyte folate, mean |
455.09 |
226.79 |
4.06 | |
| Erythrocyte 5-methyltetrahydrofolate, mean |
437.39 |
215.81 |
3.88 | 0.001 |
| Erythrocyte 5,10-methylenetetrahydrofolate, mean (IQR) (ng/mL) | 9.57 (8.35) | 2.50 (3.69) | 23.00 | 0.002 |
| Erythrocyte 5-acyltetrahydrofolate, mean (IQR) (ng/mL) | 1.20 (1.08) | 1.55 (1.31) | 75.00 | 0.816 |
| Erythrocyte unmetabolized folate, mean (IQR) (ng/mL) | 5.59 (6.53) | 2.76 (3.98) | 57.00 | 0.241 |
First, we used multiple indexes to evaluate the alpha diversity of the gut microbiota in preeclampsia patients and the control group, including ACE index (Fig. 2A), Chao1 index (Fig. 2B), Simpson index (Fig. 2C), Shannon index (Fig. 2D), and PD_whole_tree index (Fig. 2E). The results revealed significant differences between the 2 groups in ACE (p = 0.011), Chao1 (p = 0.010), Simpson (p = 0.043), Shannon (p = 0.015), and PD_whole_tree (p = 0.046) indexes, suggesting notable variations in gut microbiota abundance between the preeclampsia and control groups. The rarefaction curves of the 2 groups also showed that as the amount of sequencing data increased, a large number of microorganisms were discovered in the community, meaning that the sequencing volume of each sample was sufficient (Fig. 2F). The rarefaction curve of the diversity index plotted based on the Shannon index also indicated that the data volume of the sequencing results of both groups was large enough, and the number of feature species would not increase with the increase in sequencing volume (Fig. 2G). The rank-abundance curve also demonstrated that the species composition of the sequenced samples was rich and the evenness of the species composition was relatively high (Fig. 2H).
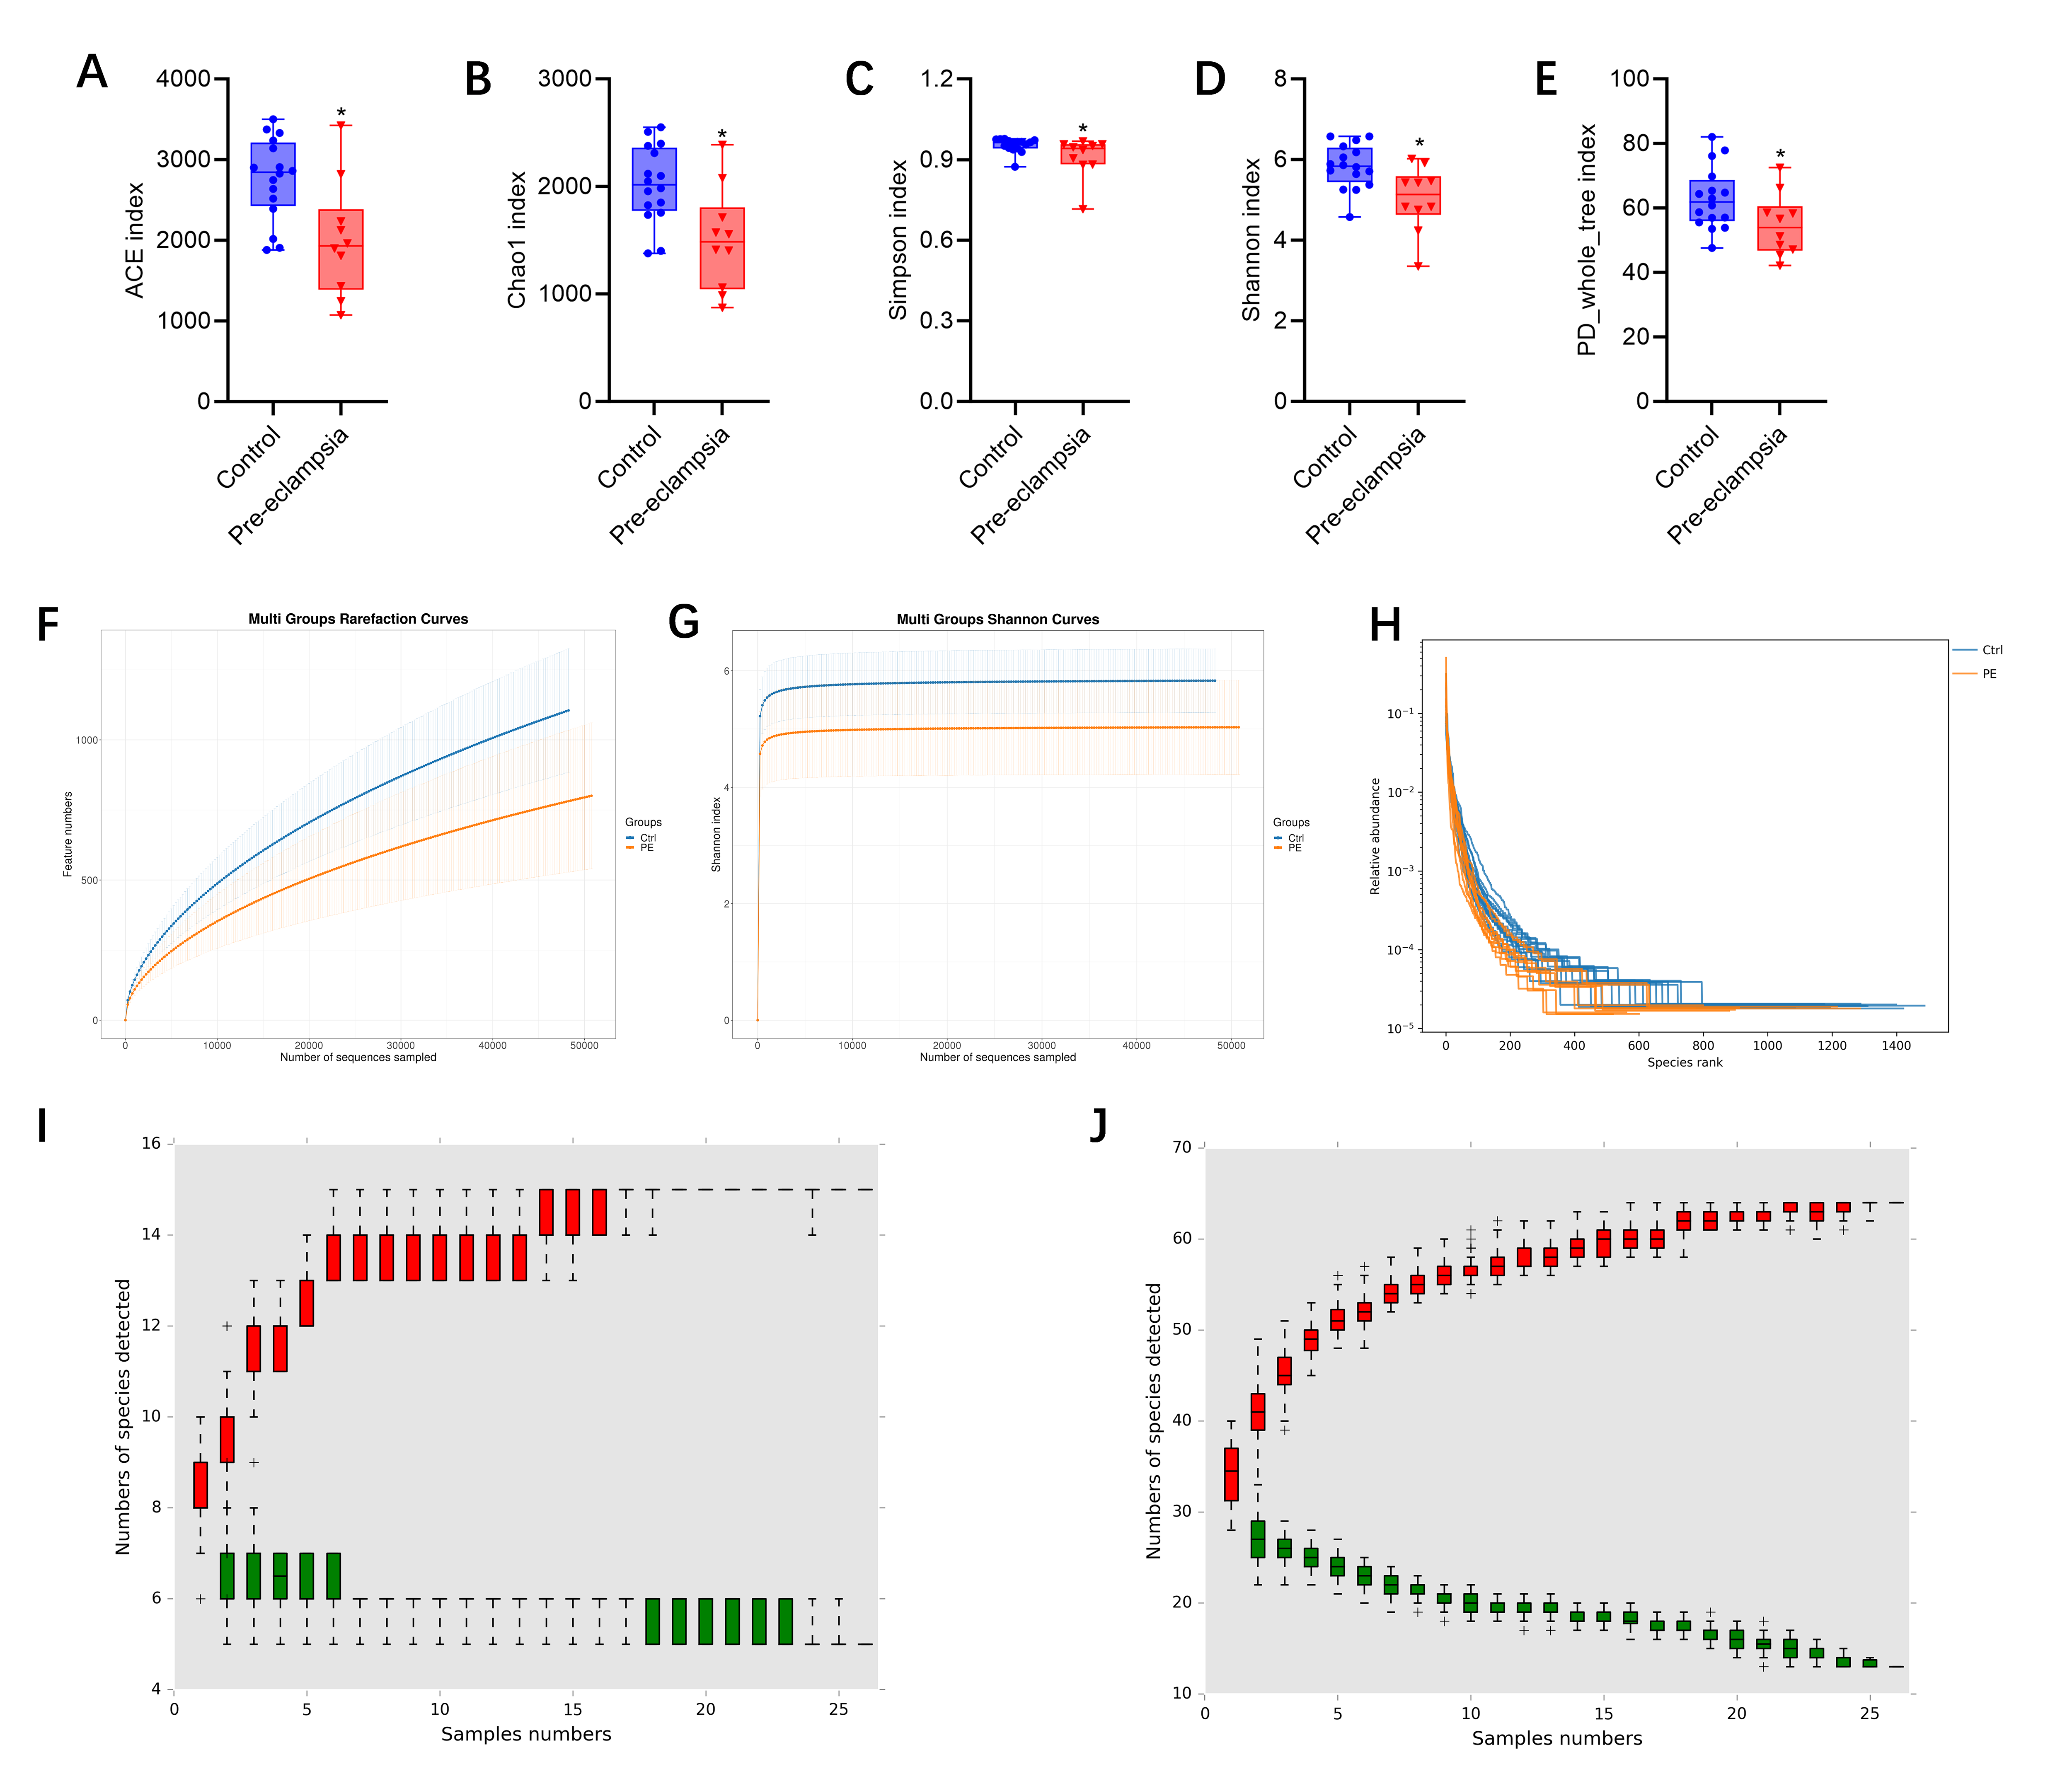 Fig. 2.
Alpha diversity of fecal gut microbiota in preeclampsia vs.
control groups. (A) Abundance-based Coverage Estimator (ACE) index. (B) Chao1
index. (C) Simpson index. (D) Shannon index. (E) PD_whole_tree index. (F)
Rarefaction curve. (G) Shannon index curve. (H) Rank abundance curve. (I) Species
accumulation curve graph (Phylum). (J) Species accumulation curve graph (Genus). PE, preeclampsia; Ctrl, control. Note: *p
Finally, we utilized cumulative relative abundance curves to illustrate the relationship between the number of samples and the number of annotated microbial taxa. The red boxes formed the cumulative curve, which reflected the rate of new species appearance under continuous sampling. Within a certain range, as the sample size increased, a sharp upward curve indicated that a large number of new species were discovered in the community. When the curve tended to be stable, the number of species in the environment no longer increased significantly with the increase in samples. A single green box represented the common species in the sampled data set. Together, these green boxes formed the familiar species curve, reflecting the rate of common species occurrence during continuous sampling. The curve showed a downward trend within a specific range as the sample size increased, indicating that the number of newly detected common species gradually decreased. When the curve flattened out, it meant that the common species in this environment were approaching saturation. The results indicated that the sample sizes were adequate across 6 taxonomic levels: phylum (Fig. 2I), class (Supplementary Fig. 1), order (Supplementary Fig. 2), family (Supplementary Fig. 3), genus (Fig. 2J), and species (Supplementary Fig. 4).
PCA, PCoA, and NMDS were applied to examine variations among sample groups. The first principal component accounted for 29.10% of the variation in the PCA results, while the second principal component explained 12.75%. The characteristic differences among the control group were relatively small, while those among the preeclampsia sample group were relatively large (Fig. 3A). In the results of PCoA, the first principal component contributed 9.90%, and the second accounted for 5.98%. Notable differences in species diversity were observed between the 2 groups from Fig. 3B. The NMDS analysis revealed a stress value of 0.1518 for the 2 groups, indicating that the results of the NMDS analysis had a certain degree of reliability (Fig. 3C). Based on the binary (Fig. 3D) and bray (Fig. 3E) distance algorithms respectively, we plotted the sample clustering heatmaps to intuitively reflect the differences between every 2 samples.
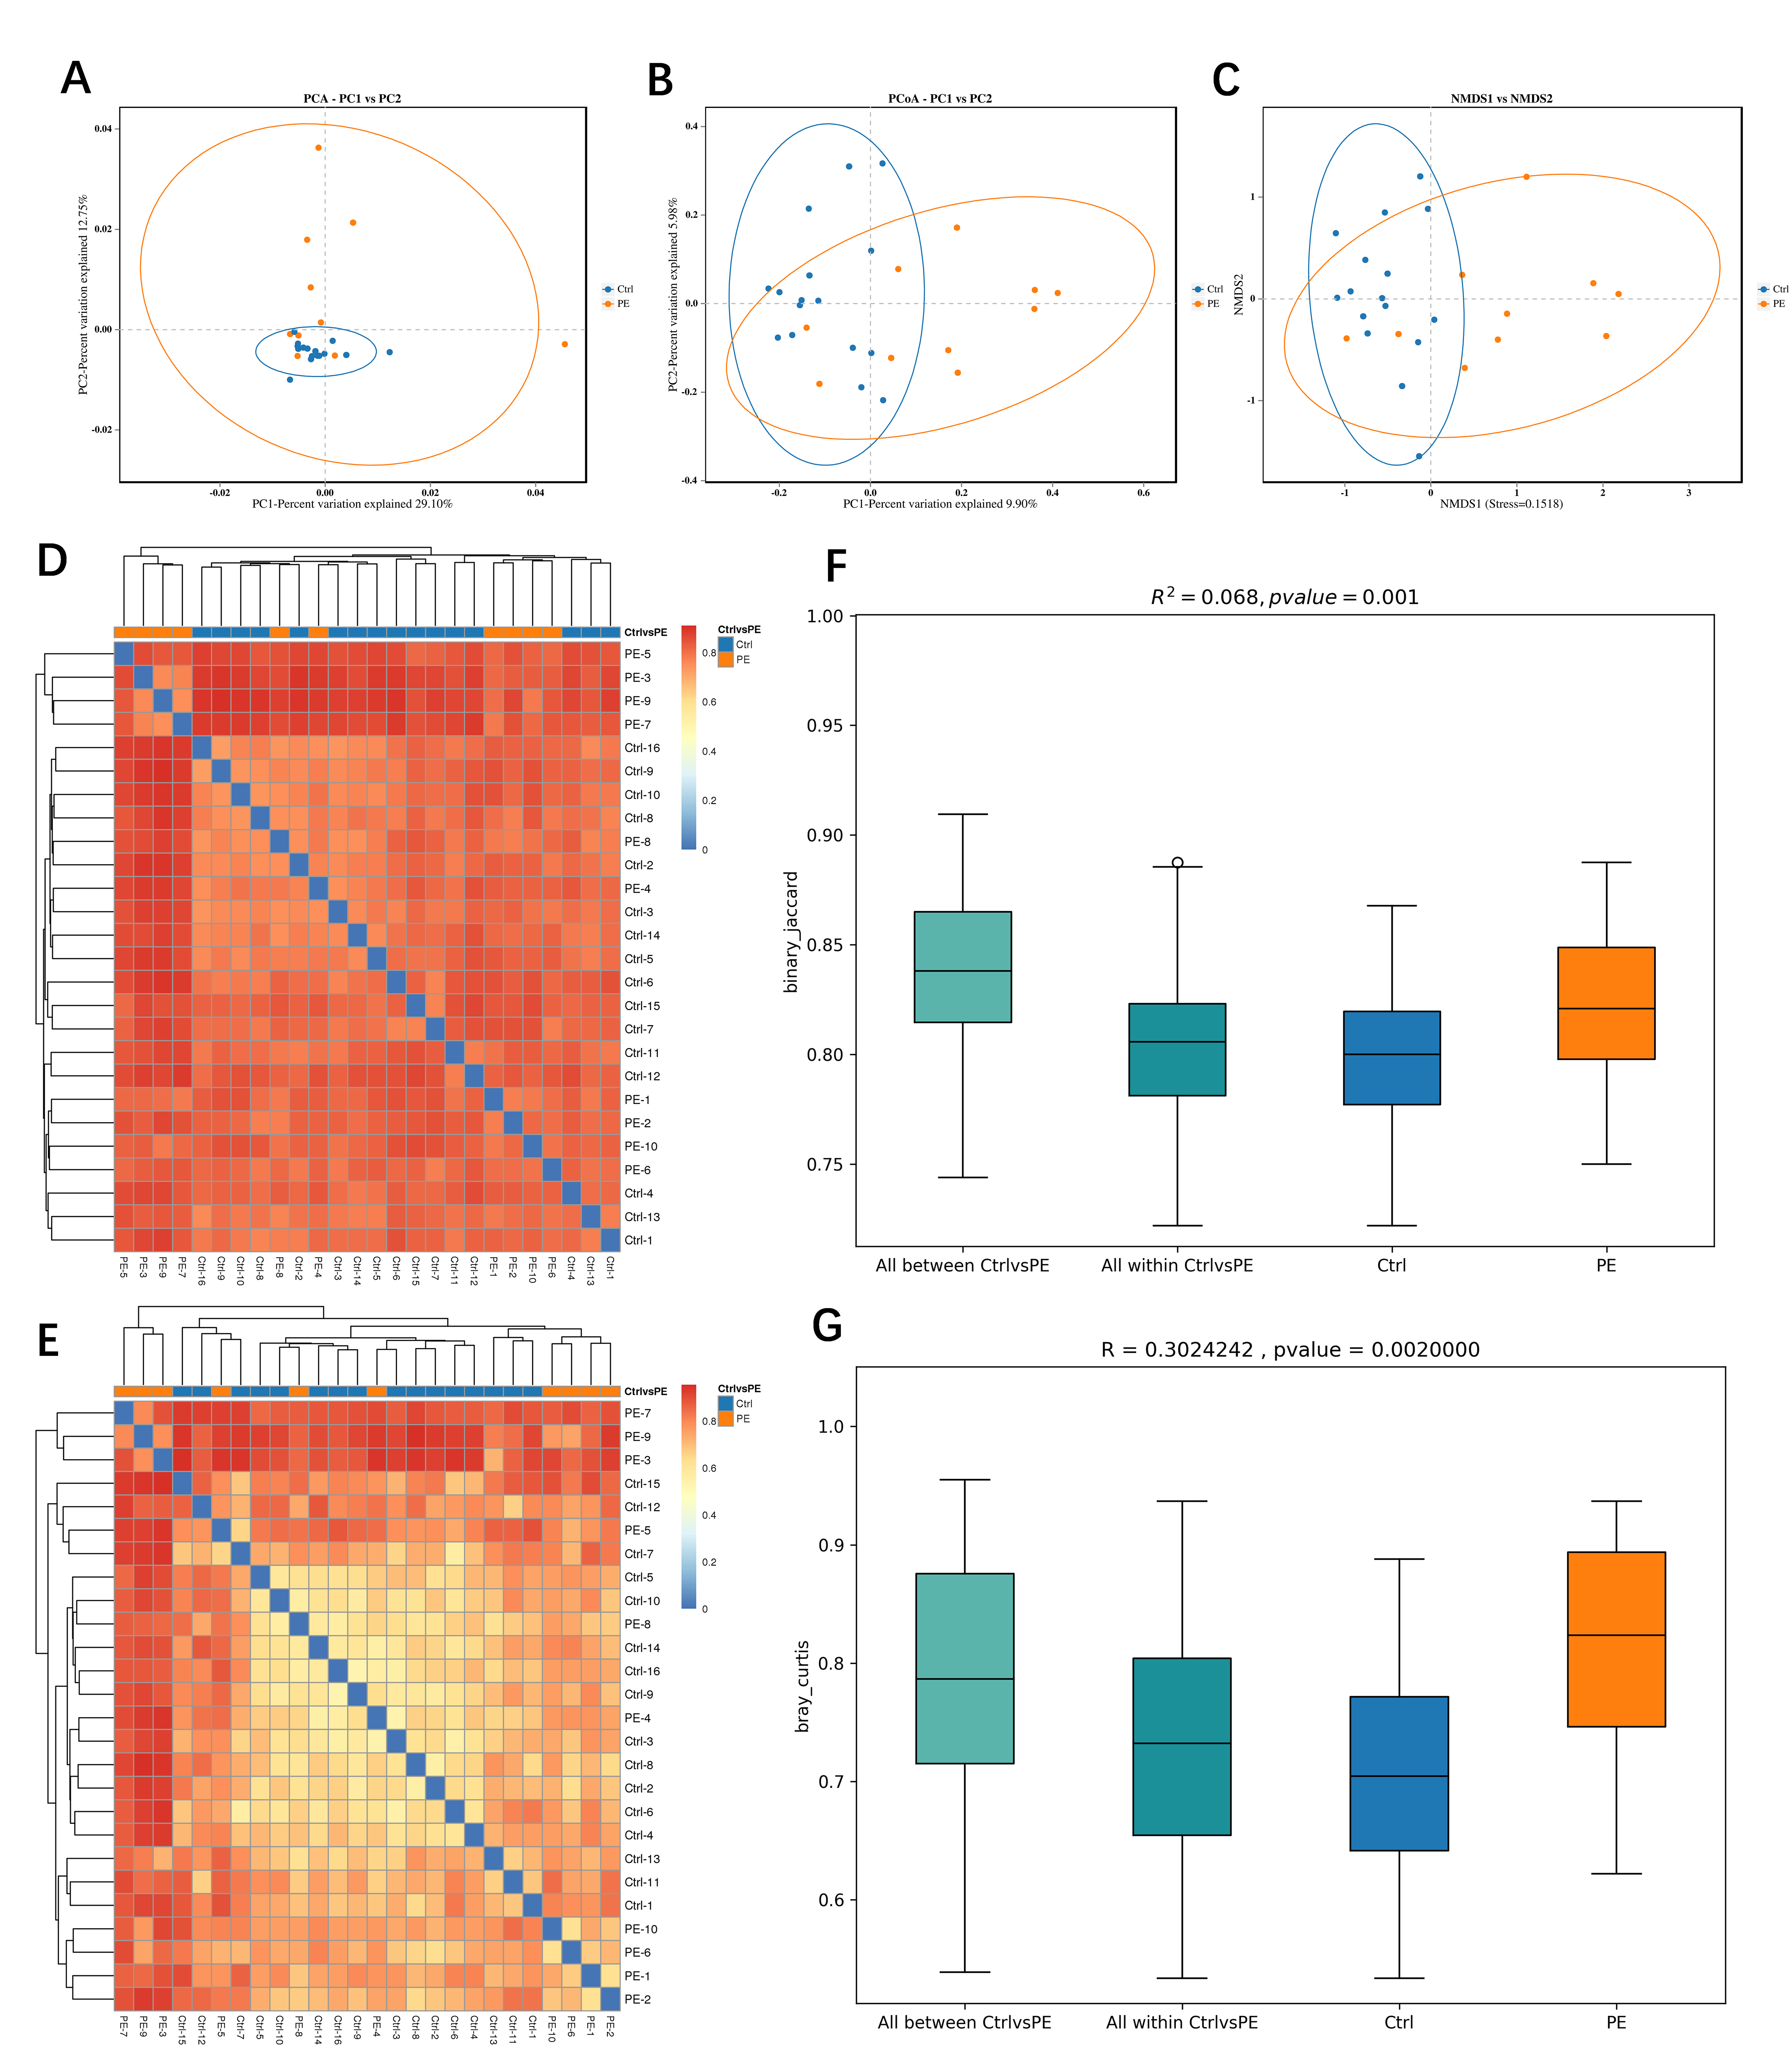 Fig. 3.
Beta diversity of fecal gut microbiota in preeclampsia vs. control groups. (A) Principal component analysis (PCA). (B) Principal coordinates analysis (PCoA). (C) Non-metric multi-dimensional scaling (NMDS). (D) Sample clustering heatmaps based on the binary distance algorithms. (E) Sample clustering heatmaps based on the bray distance algorithms. (F) Permutational multivariate analysis of variance (PERMANOVA/Adonis). (G) Analysis of similarities (Anosim). PC1, principal component 1; PC2, principal component 2.
Permutational Multivariate Analysis of Variance (PERMANOVA, Adonis) and Analysis of Similarities (Anosim) were used to evaluate the reliability of the beta diversity between the 2 groups of samples. The PERMANOVA results yielded an R2 of 0.068 with a p-value of 0.001 (Fig. 3F), and the Anosim results indicated an R-value of 0.302 and a p-value of 0.002 (Fig. 3G). The results of the beta diversity analysis of the 2 groups of samples have a high degree of reliability.
We analyzed the differential microbiota of the two groups of gut microbiota at the phylum (Fig. 4A), class (Supplementary Fig. 5), order (Supplementary Fig. 6), family (Supplementary Fig. 7), genus (Fig. 4B), and species levels (Supplementary Fig. 8). Supplementary Figs. 9–14 display the specific differentially abundant microbiota at the 6 levels. The analysis revealed significant differences in the composition of the gut microbiota across all taxonomic levels.
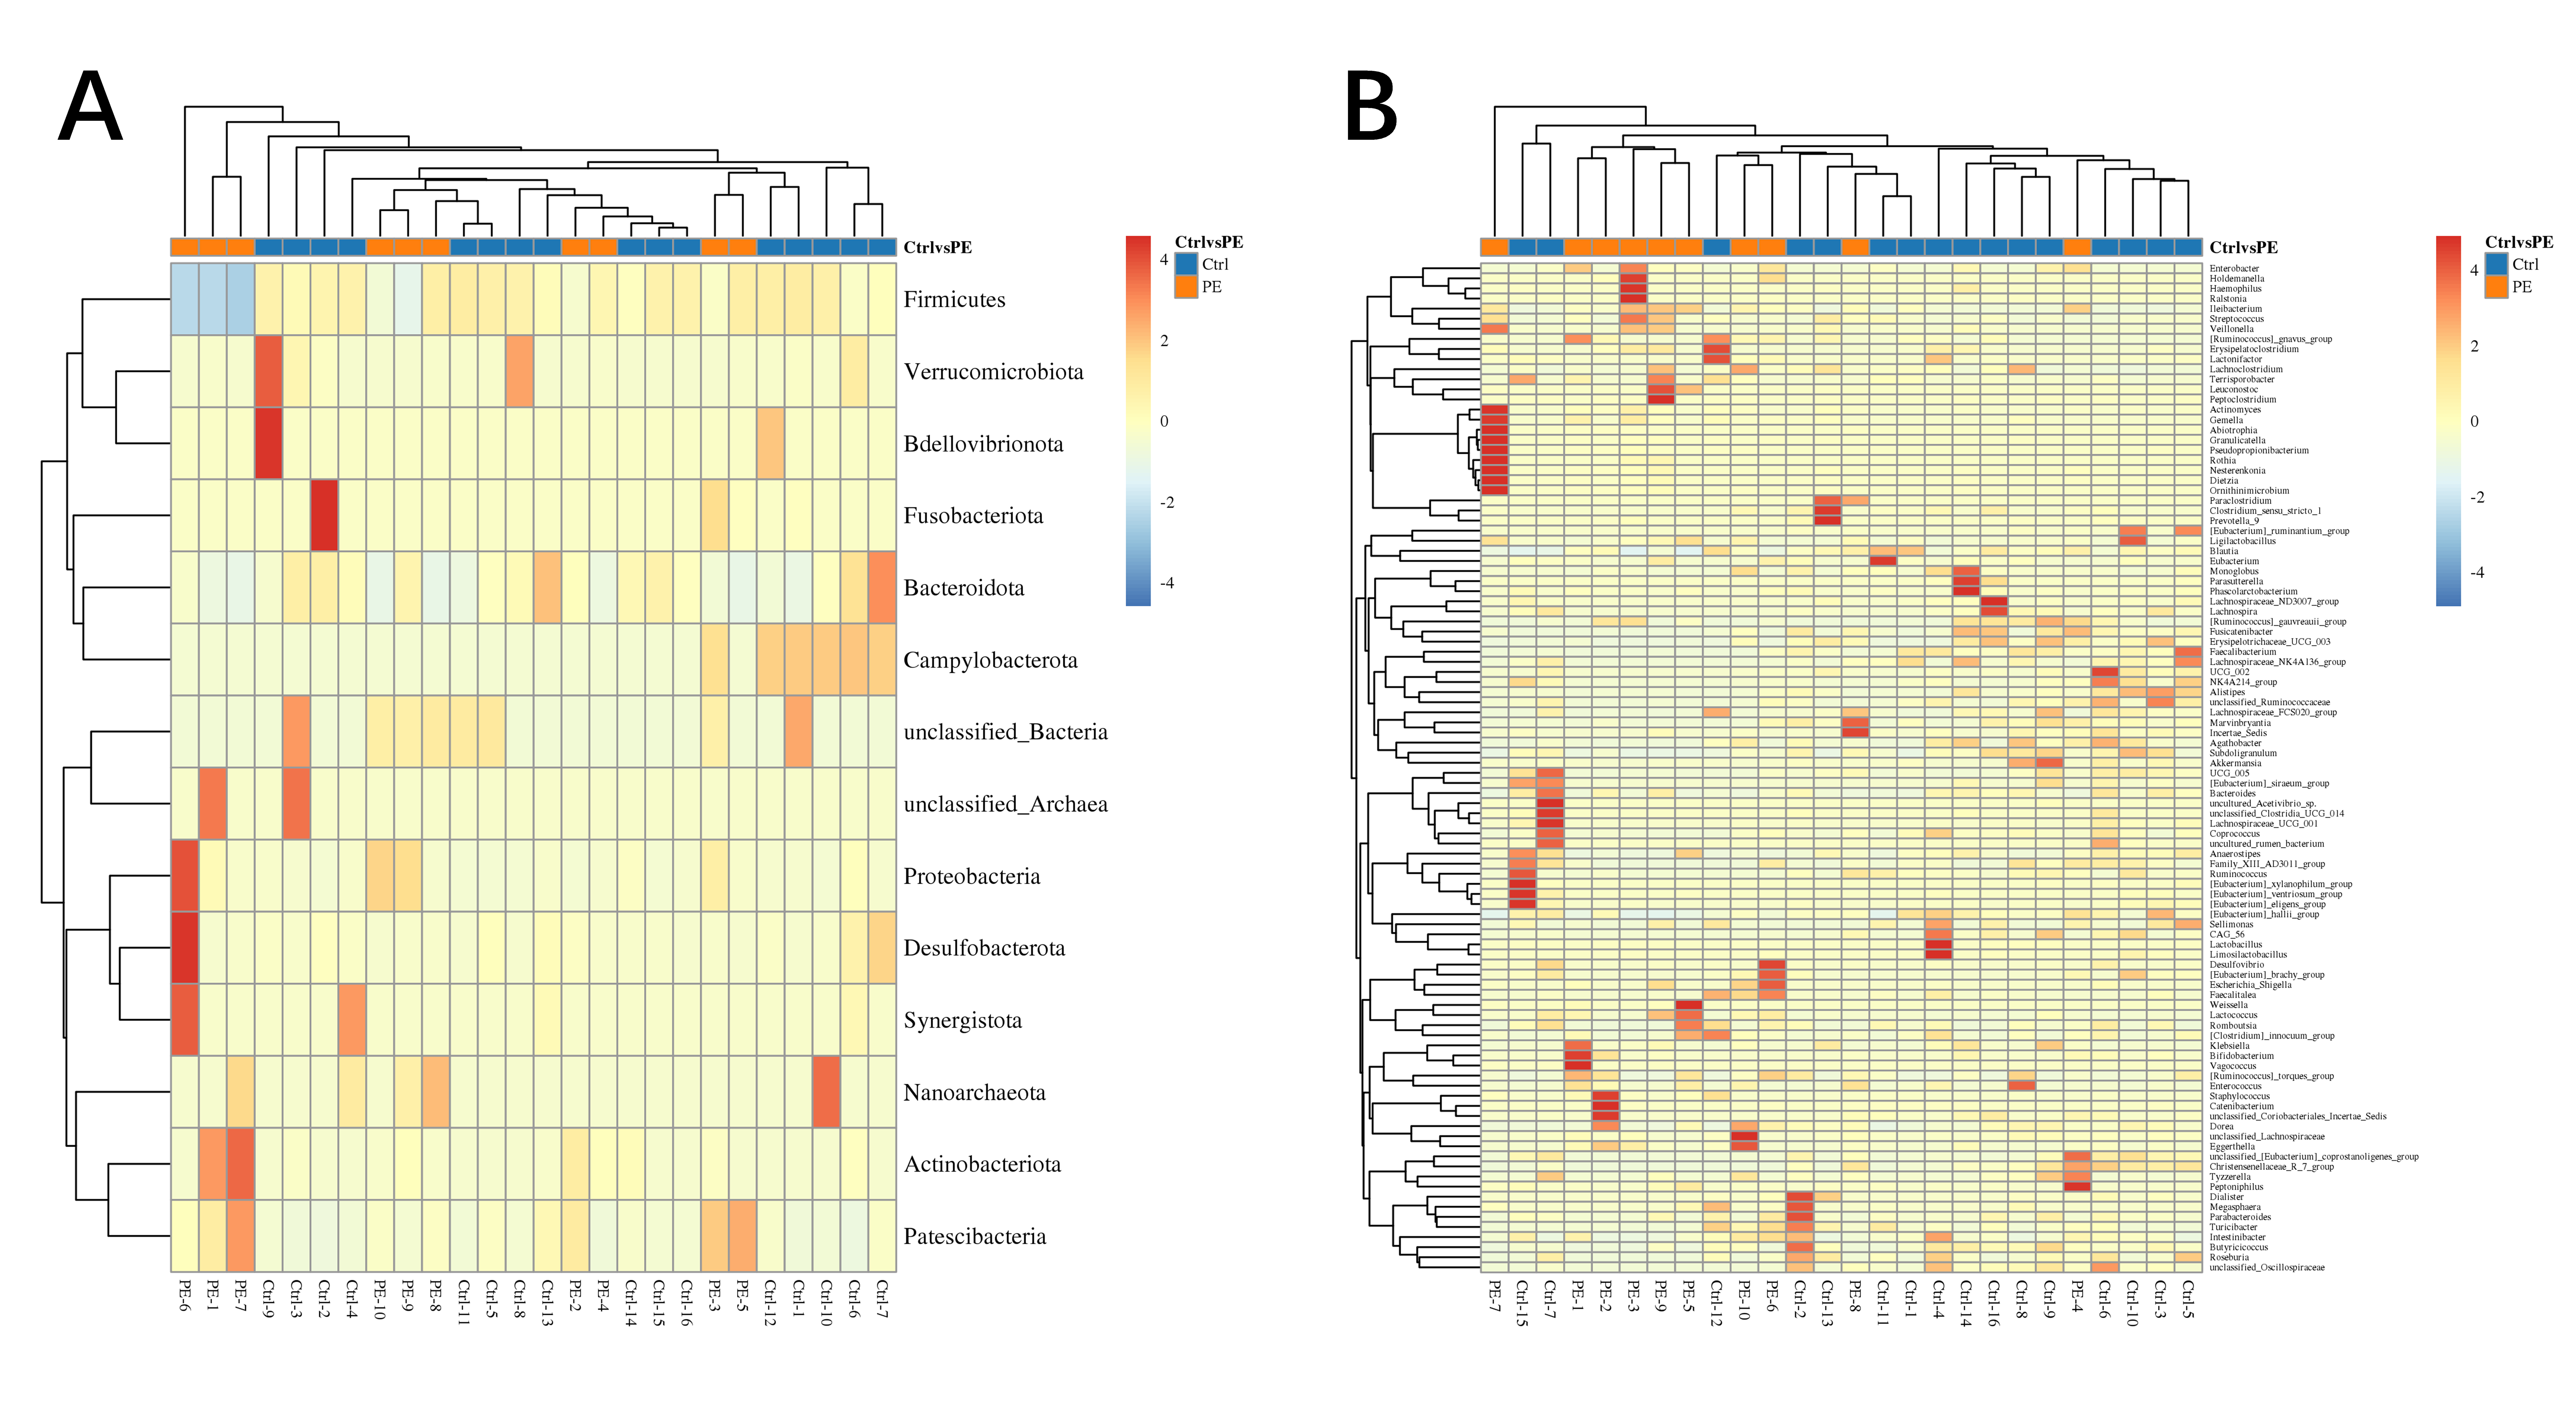 Fig. 4.
Heatmap of differentially abundant microbiota. (A) Phylum. (B) Genus.
We used Pearson’s correlation analysis to evaluate the relationship between 5 alpha diversity indices and 5 forms of folate. The results revealed that total erythrocyte folate and erythrocyte 5-methyltetrahydrofolate were significantly correlated with the 5 alpha diversity indices. Erythrocyte 5,10-methylenetetrahydrofolate was not correlated with the Simpson index. However, Erythrocyte 5-acyltetrahydrofolate and Erythrocyte unmetabolized folate were not correlated with any of the 5 alpha diversity indices (Table 3).
| Pearson Correlation, p-value | ACE index | Chao1 index | PD_whole_tree index | Shannon index | Simpson index |
| Total erythrocyte folate | 0.915, |
0.921, |
0.796, |
0.798, |
0.620, 0.001 |
| Erythrocyte 5-methyltetrahydrofolate | 0.911, |
0.916, |
0.790, |
0.609, 0.001 | 0.609, 0.001 |
| Erythrocyte 5,10-methylenetetrahydrofolate | 0.480, 0.013 | 0.478, 0.014 | 0.417, 0.034 | 0.550, 0.004 | 0.374, 0.060 |
| Erythrocyte 5-acyltetrahydrofolate | 0.028, 0.891 | 0.035, 0.867 | 0.065, 0.752 | 0.189, 0.356 | 0.124, 0.545 |
| Erythrocyte unmetabolized folate | 0.081, 0.693 | 0.090, 0.663 | 0.136, 0.508 | 0.240, 0.238 | 0.222, 0.276 |
ACE, abundance-based coverage estimator.
This study systematically unveiled the unique metabolic profiles of red blood cell folate in individuals diagnosed with preeclampsia: the levels of total folate, 5-methyltetrahydrofolate, and 5,10-methylenetetrahydrofolate were significantly decreased, while there were no differences in the levels of non-metabolically active 5-acyltetrahydrofolate and unmetabolized folate. This finding is consistent with previous clinical observations [19], but further refined the abnormal nodes in the folate metabolic pathway. It is worth noting that 5-methyltetrahydrofolate, as the main active form of folate, a decrease in its level may directly affect placental DNA methylation [20]. Oxidative stress caused by shallow placental implantation may inhibit the activity of methylenetetrahydrofolate reductase, leading to the obstruction of the conversion of 5,10-methylenetetrahydrofolate to 5-methyltetrahydrofolate, forming the cascade folate metabolic disorder observed in this study [21]. A meta-analysis on the prevention of preeclampsia by folic acid supplementation during pregnancy demonstrated that folic acid supplementation during pregnancy cannot reduce the risk of developing preeclampsia [14]. However, an increasing amount of evidence indicates that long-term folic acid supplementation can effectively prevent preeclampsia. The administration of folic acid can reduce the level of serum homocysteine, thereby decreasing the risk and severity of preeclampsia [22]. This highlights that red blood cell folate provides a more accurate measure of folic acid supplementation levels compared to serum folate.
Differences in red blood cell folate concentration between the preeclampsia
group and the control group may also be related to the patients’ intestinal
absorption disorders or the regulation of folate absorption by the microbiota
[23, 24]. On the other hand, folic acid supplements can also influence the
structure of the gut microbiota [25, 26]. It is worth noting that the levels of
unmetabolized folate are similar among the samples. This may be because the
metabolic pathway is blocked, and the exogenously supplemented folic acid may not
be converted into the active form. However, it should also be noted that these
results may be affected by the small sample size, and their interpretation must
be carried out with great caution. Our
We conducted a Pearson correlation analysis and discovered that total red blood
cell folate and 5-methyltetrahydrofolate had a significant positive correlation
with the
Our study found that there was no correlation between the changes in the abundance of gut microbiota and the levels of non-metabolically-active 5-acyltetrahydrofolate and unmetabolized folate. We speculate that only the forms of folate involved in one-carbon metabolism can form a dynamic balance with the microbiota. This may be related to the fact that the clinical supplementation of non-active folate (such as folic acid tablets) fails to improve preeclampsia. This interaction may be amplified through the gut-placenta axis: gut microbiota dysbiosis-abnormal folate metabolism-placental DNA methylation disorder-preeclampsia symptoms.
This study has some limitations: (1) Because of the case-control study design of this study, causality cannot be determined. Future longitudinal studies are needed to explore further the temporal dynamics of folic acid levels and intestinal microbiota composition; (2) With a relatively limited sample size of 26 participants, the study cohort should be enlarged to confirm the generalizability of the observed differences in microbiota; (3) The absence of microbiota metabolite detection (e.g., short-chain fatty acids) limits the ability to elucidate the molecular mechanisms underlying the interaction between folate and gut microbiota.
Our study has confirmed that patients with preeclampsia exhibit dual characteristics—red blood cell folate metabolic disorder and gut microbiota dysbiosis. A significant association exists between the 2 via the form of active folate. This finding has expanded our understanding of the pathological processes involved in preeclampsia, indicating that the gut microbiota can serve as a potential novel target for folate-based interventions. Interventions targeting the gut microbiota may improve folate metabolism and reduce the risk of preeclampsia.
However, it must be emphasized that the sample size in our study was quite small. Therefore, the research findings and conclusions require further verification. In the future, we should increase the sample size and integrate multi-omics technologies to clarify the regulatory network of the “microbiota-folate-placenta” axis. This will lay the foundation for developing microbiota-based prevention and treatment programs for preeclampsia.
The sequencing data in this study is available upon request from the corresponding author.
DQ and XS: design of experiments, conduct of experiments, data analysis, writing of the manuscript, and financial support. YW: design and conduct of experiments, data analysis, and writing of the manuscript. HY: design and guidance of experiments, writing of the manuscript, and editorial review of the manuscript. All authors read and approved the final manuscript. All authors have participated sufficiently in the work and agreed to be accountable for all aspects of the work.
The Ethics Committee of Zhongda Hospital Affiliated to Southeast University granted approval for this study (No. 2024ZDSYLL040-P01), carried out in accordance with the Declaration of Helsinki, and the rights and privacy of all subjects were strictly protected. All the subjects provided written informed consent forms.
Not applicable.
This study was supported by grants from the Research Personnel Cultivation Programme of Zhongda Hospital Southeast University (Project No. CZXM-GSP-RC72).
The authors declare no conflict of interest.
Supplementary material associated with this article can be found, in the online version, at https://doi.org/10.31083/CEOG39032.
References
Publisher’s Note: IMR Press stays neutral with regard to jurisdictional claims in published maps and institutional affiliations.