


 , Wei Liu 1, Shuaiting Liu 1, Jingzhen Yang 1,*
1 Department of Gynecology, Ganzhou Maternal and Child Health Care Hospital, 341000 Ganzhou, Jiangxi, China
Abstract
Background: This study aimed to explore the factors influencing the development of intrauterine adhesions (IUA) in patients with endometrial polyps (EP) following hysteroscopic resection. We also aimed to construct a nomogram model to predict the risk of postoperative IUA and validate its predictive accuracy.
Methods: We conducted a retrospective analysis of data from 322 EP patients treated at our hospital between July 2022 and June 2024. The patients were randomly divided into a modeling group (n = 248) and a verification group (n = 74). Based on whether IUA occurred after hysteroscopic resection, the modeling group was further categorized into an IUA group and a non-IUA group. Data from the modeling group were collected and compared between the two subgroups. We used logistic regression to identify the factors contributing to postoperative IUA. The nomogram model was built using R software, and internal validation was conducted using receiver operating characteristic (ROC) curves, calibration curves, and decision curves. Additionally, we performed external validation using the verification group.
Results: The incidence of postoperative IUA in the modeling group was 20.56% (51/248). Logistic regression analysis revealed that the use of intrauterine devices, history of pelvic inflammatory disease, previous curettage, history of pregnancy termination, and surgical duration were significant risk factors for the development of postoperative IUA (p < 0.050). The area under the curve (AUC) for both the modeling and verification groups was 0.815 (95% CI: 0.753–0.876) and 0.808 (95% CI: 0.747–0.870), respectively. The calibration curve indicated that the predicted probability of IUA occurrence closely matched the actual observed values. The decision curve analysis demonstrated that the predictive model had strong clinical applicability.
Conclusions: The nomogram model, based on five independent risk factors—use of intrauterine devices, history of pelvic inflammatory disease, previous curettage, history of pregnancy termination, and surgical duration—has shown good predictive performance and significant clinical utility in assessing the risk of postoperative IUA in EP patients.
Keywords
- endometrial polyps
- hysteroscopic resection
- intrauterine adhesions
- influencing factors
- nomogram
Endometrial polyps (EP) are a common condition in gynecology, characterized by the hyperplasia of connective tissue in the basal layer of the endometrium, resulting in pedunculated growths that protrude into the uterine cavity. Symptoms can include abnormal uterine bleeding, and some patients may experience infertility, which can significantly impact their daily life [1, 2]. Surgery is the primary treatment for EP, with hysteroscopic resection being favored in clinical practice due to its advantages of low invasiveness, minimal pain, and rapid postoperative recovery [3]. Despite being a minimally invasive procedure with less trauma compared to traditional surgery, intrauterine adhesions (IUA) may still occur postoperatively. Postoperative IUA can lead to menstrual disorders, pregnancy termination, and infertility [4]. Therefore, preventing IUA after surgery in EP patients is crucial. Current clinical research on postoperative IUA in EP patients mainly focuses on identifying the factors that contribute to its occurrence. To prevent IUA, strategies such as early second-look hysteroscopy and the use of hormones to accelerate endometrial repair have been adopted. However, due to the lack of individualized risk prediction studies, the precision of these preventive measures remains limited. Recently, nomograms have emerged as valuable tools for predicting risk by integrating multiple variables and visualizing their relationships with risk events. This approach helps in identifying high-risk populations and enables more precise prevention strategies [5, 6]. This study aims to construct a nomogram prediction model for the occurrence of IUA after hysteroscopic resection in EP patients, with the goal of enhancing the ability to prevent and control IUA. The report is presented as follows.
We conducted a retrospective analysis of the data from patients with EP treated at our hospital between July 2022 and June 2024. The inclusion criteria were: ① diagnosis of EP according to relevant diagnostic criteria [7]; ② indications for hysteroscopic resection; ③ clear consciousness and no cognitive abnormalities; ④ complete clinical data available. The exclusion criteria were: ① presence of other gynecological diseases such as uterine fibroids; ② inability to tolerate hysteroscopic surgery due to severe systemic diseases; ③ abnormal immune system or associated infections; ④ hormonal therapy within the last 3 months prior to surgery; ⑤ women who are pregnant or breastfeeding. This study adhered to ethical medical standards.
The hysteroscopic resection of EP was performed by the same surgical team. The surgery was scheduled 3 to 5 days after the end of the menstrual period. The procedure was as follows: the patient was positioned in the lithotomy position, and routine disinfection of the surgical area was performed. Anesthesia was administered, and once it took effect, a speculum was inserted, followed by dilation of the cervix to 9–10 mm. A hysteroscope was then inserted to examine the uterine cavity, assessing the location, number, and base width of the polyps. The polyp tissue was excised using an electrosurgical knife along the vascular base of the polyp, ensuring the surrounding normal endometrium was preserved. Finally, the uterine cavity was irrigated. Postoperatively, prophylactic antibiotics were administered for 1 day.
A hysteroscopic examination was performed on all patients 6 months after their operation, to assess the presence of IUA. The criteria for determining IUA were as follows [8]: ① symptoms such as reduced menstrual flow or even amenorrhea, and periodic abdominal pain; ② hysteroscopic examination revealing central adhesions (anteroposterior wall adhesions with widened ends, with the occlusion of the uterine horn or loss of uterine cavity symmetry), peripheral adhesions (appearing as semi-curtain or crescent-shaped, with the occlusion of the uterine horn or loss of uterine cavity symmetry), and mixed adhesions (small obstructed cavities). Based on the presence or absence of IUA, the patients were divided into the IUA group and the non-IUA group.
Data were collected from our hospital’s electronic medical records system, including age, disease duration, body mass index (BMI), comorbidities, number of pregnancies, fertility desires, use of intrauterine devices (IUDs), history of pelvic inflammatory disease, history of cesarean section, history of dilation and curettage (D&C), history of pregnancy termination, history of polyp disease, endometrial hyperplasia status, polyp diameter, number of polyps, location of polyps, surgery duration, and intraoperative blood loss.
Data were analyzed using SPSS 25.0 software (IBM Corp., Armonk, NY, USA).
Continuous variables that followed a normal distribution were described as mean
In this study, a total of 409 EP patients were initially collected from the electronic medical record system. After excluding 41 cases lost to follow-up, 46 cases were further excluded based on the exclusion criteria (34 cases with other gynecological diseases and 12 cases who had received hormonal treatment within the 3 months before their surgery). Ultimately, 322 EP patients were included in the study. These patients were randomly divided into a modeling group (n = 248) and a validation group (n = 74). A flowchart of the participants is shown in Fig. 1. In the modeling group of 248 patients, 51 developed IUA postoperatively, with an incidence rate of 20.56%. In the validation group of 74 patients, 14 developed IUA postoperatively, with an incidence rate of 18.92%.
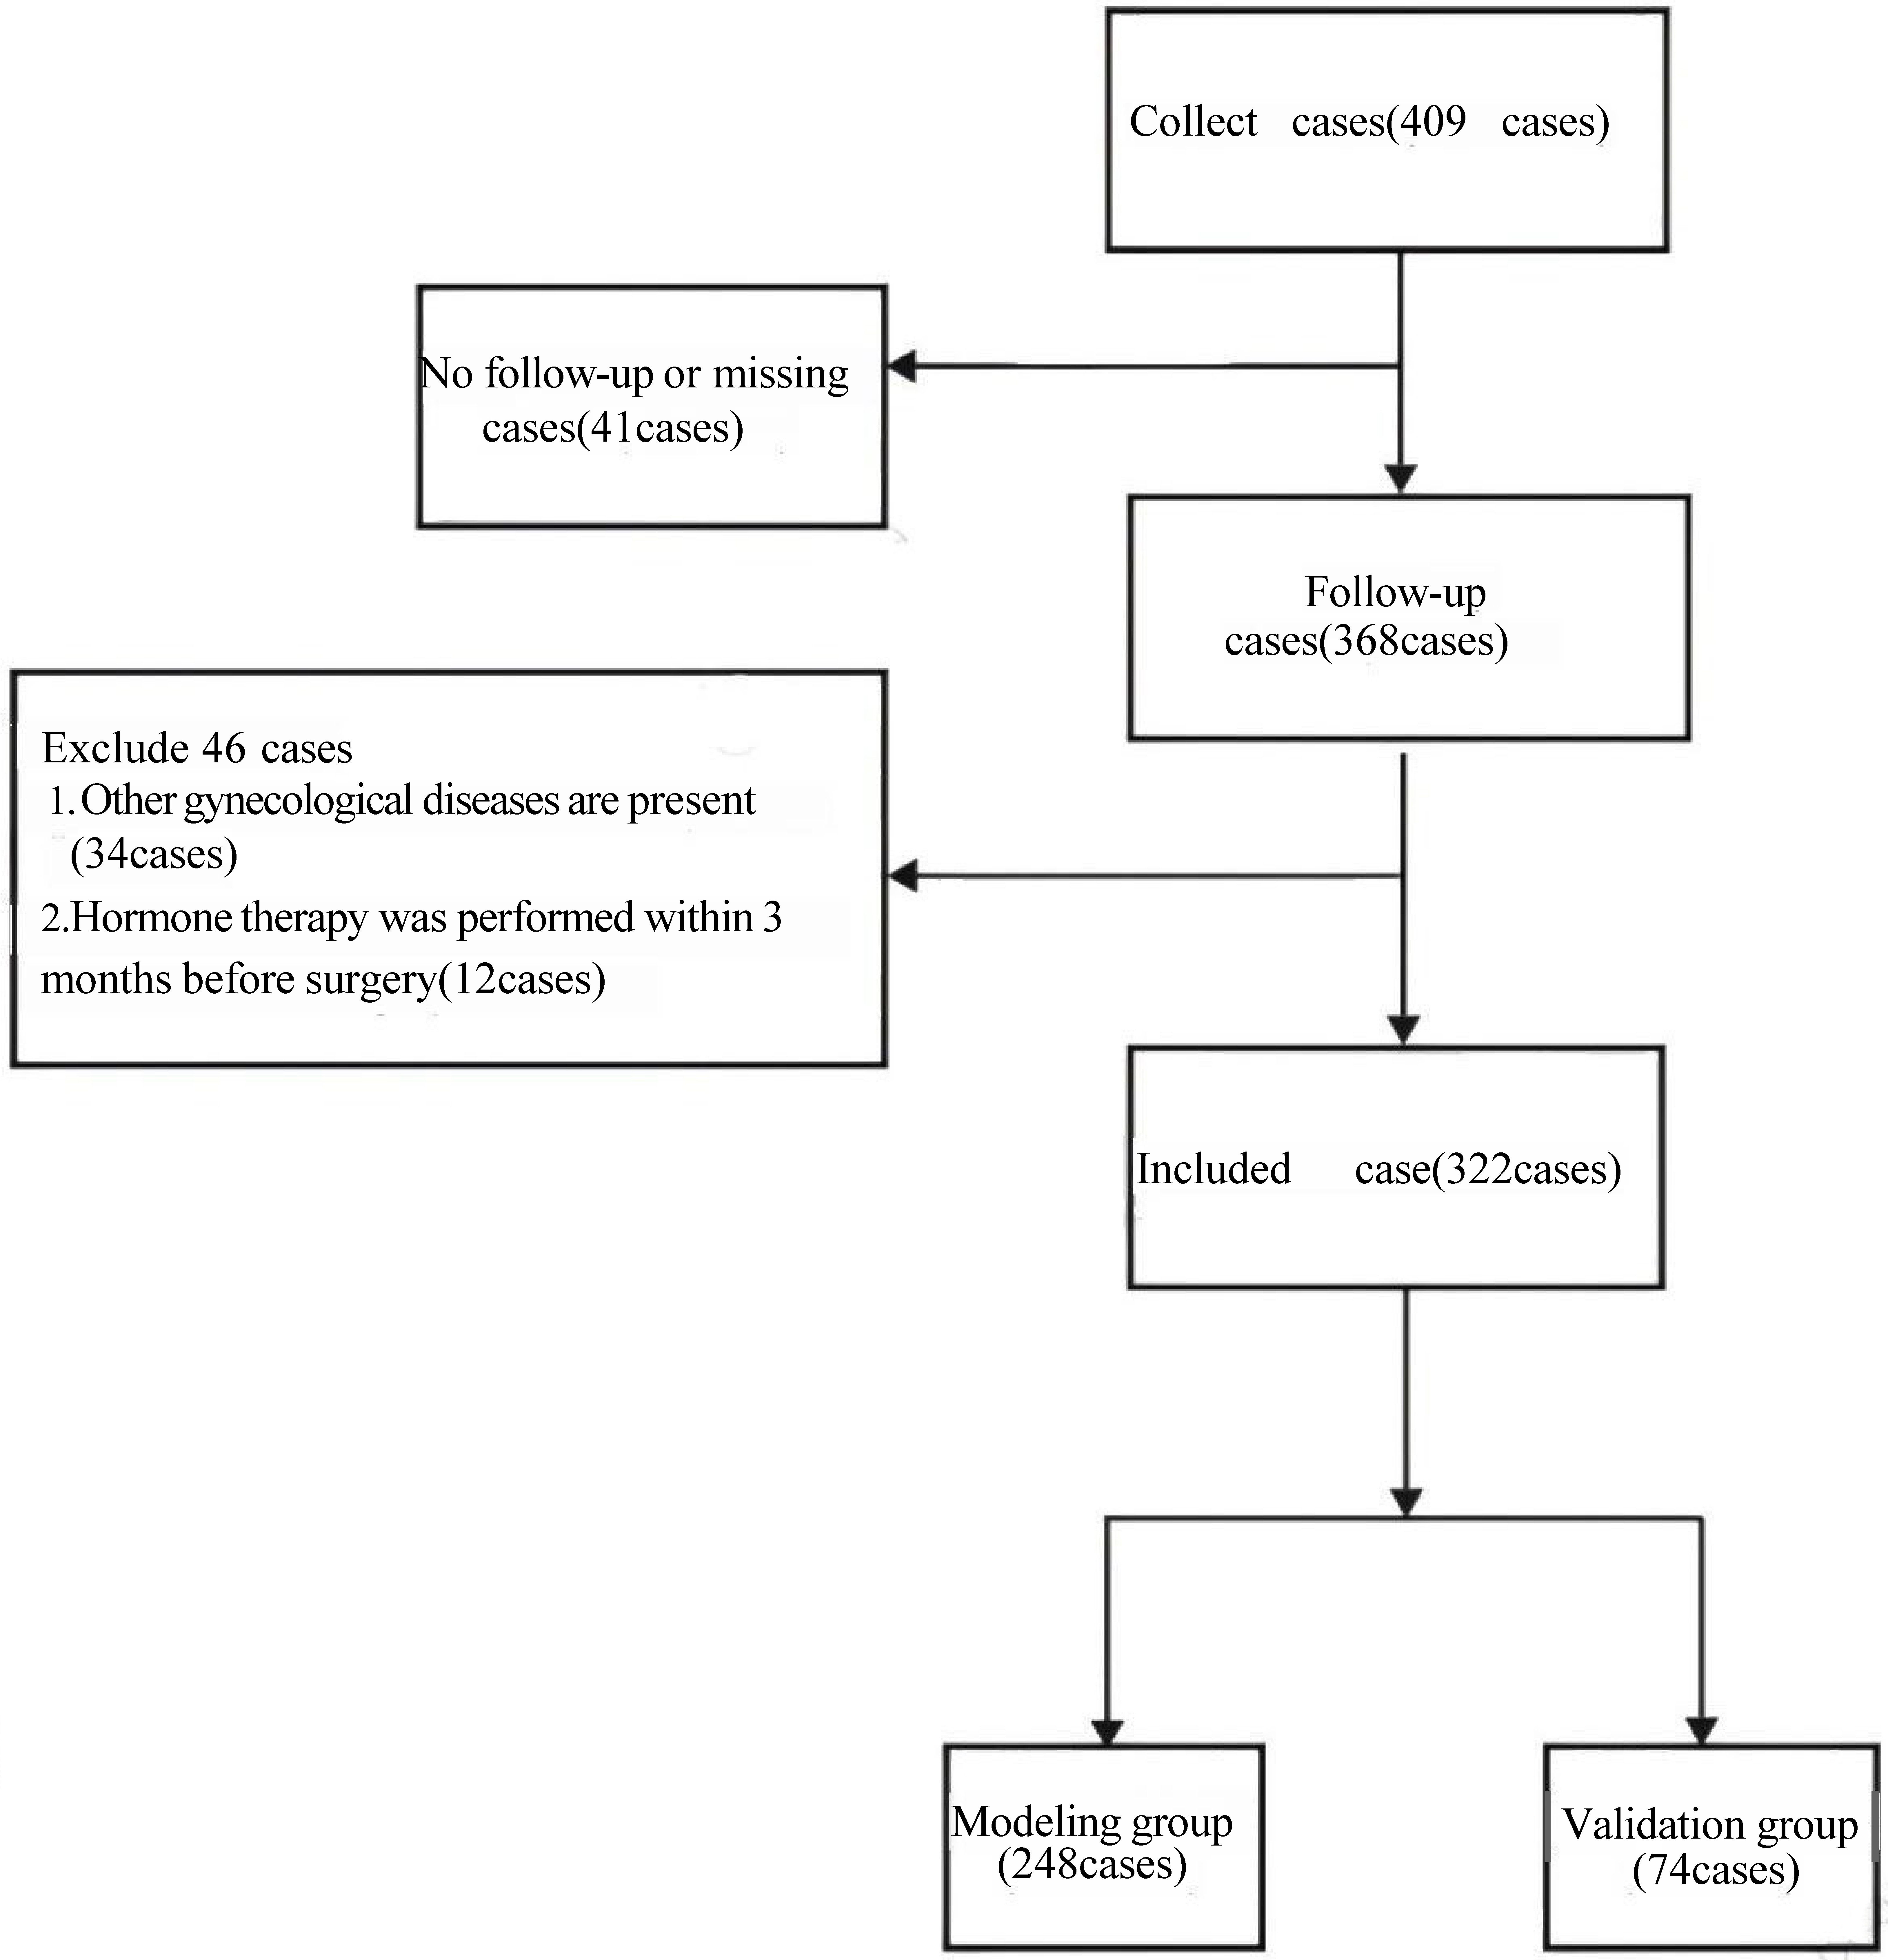 Fig. 1.
Flow chart of subjects.
There were no significant differences in the data between the modeling group and
the validation group (p
| Index | Modeling group (n = 248) | Verification group (n = 74) | p value | ||
| Age (years) | 0.507 | 0.776 | |||
| 52 (20.97) | 13 (17.57) | ||||
| 30–40 | 121 (48.79) | 39 (52.70) | |||
| 75 (30.24) | 22 (29.73) | ||||
| Course of disease (years) | 2.78 |
2.85 |
0.756 | 0.450 | |
| Body mass index (kg/m2) | 22.97 |
22.81 |
0.401 | 0.688 | |
| Complication | |||||
| Hypertension | 69 (27.82) | 23 (31.08) | 0.297 | 0.586 | |
| Diabetes | 46 (18.55) | 11 (14.86) | 0.531 | 0.466 | |
| Pregnancy times (times) | 0.102 | 0.749 | |||
| 166 (66.94) | 51 (68.92) | ||||
| 82 (33.06) | 23 (31.08) | ||||
| Reproductive demand | 0.383 | 0.536 | |||
| Yes | 134 (54.03) | 43 (58.11) | |||
| No | 114 (45.97) | 31 (41.89) | |||
| Using contraceptive devices | 0.322 | 0.570 | |||
| Yes | 103 (41.53) | 28 (37.84) | |||
| No | 145 (58.47) | 46 (62.16) | |||
| History of pelvic inflammatory disease | 63 (25.40) | 21 (28.38) | 0.262 | 0.609 | |
| History of cesarean section | |||||
| History of dilation and curettage (D&C) | 98 (39.52) | 26 (35.14) | 0.462 | 0.497 | |
| History of pregnancy termination | 61 (24.60) | 21 (28.38) | 0.429 | 0.512 | |
| History of polyps | 69 (27.82) | 24 (32.43) | 0.590 | 0.443 | |
| Endometrial hyperplasia | 92 (37.10) | 25 (33.78) | 0.270 | 0.603 | |
| Polyp diameter (cm) | 0.238 | 0.626 | |||
| 106 (42.74) | 34 (45.95) | ||||
| 142 (57.26) | 40 (54.05) | ||||
| Number of polyps | 0.582 | 0.446 | |||
| Single shot | 153 (61.69) | 42 (56.76) | |||
| Multiple | 95 (38.31) | 32 (43.24) | |||
| Polyp location | 2.099 | 0.552 | |||
| Anterior wall | 61 (24.60) | 19 (25.68) | |||
| Posterior wall | 68 (27.42) | 16 (21.62) | |||
| Sidewall | 63 (25.40) | 17 (22.97) | |||
| Cornu | 56 (22.58) | 22 (29.73) | |||
| Operation time (min) | 36.02 |
35.78 |
0.421 | 0.674 | |
| Intraoperative blood loss (mL) | 19.70 |
19.33 |
0.807 | 0.420 | |
In the IUA group, there were significant differences compared to the non-IUA
group in terms of the use of IUDs, history of pelvic inflammatory disease,
history of D&C, history of pregnancy termination, and surgical duration
(p
| Index | IUA group (n = 51) | Non IUA group (n = 197) | p value | ||
| Age (years) | 0.919 | 0.632 | |||
| 9 (17.65) | 43 (21.83) | ||||
| 30–40 | 24 (47.06) | 97 (49.24) | |||
| 18 (35.29) | 57 (28.93) | ||||
| Course of disease (years) | 2.84 |
2.76 |
0.787 | 0.432 | |
| Body mass index (kg/m2) | 23.17 |
22.92 |
0.529 | 0.597 | |
| Complication | |||||
| Hypertension | 16 (31.37) | 53 (26.90) | 0.403 | 0.526 | |
| Diabetes | 12 (23.53) | 34 (17.26) | 1.054 | 0.305 | |
| Pregnancy times (times) | 0.509 | 0.475 | |||
| 32 (62.75) | 134 (68.02) | ||||
| 19 (37.25) | 63 (31.98) | ||||
| Reproductive demand | 2.063 | 0.151 | |||
| Yes | 23 (45.10) | 111 (56.35) | |||
| No | 28 (54.90) | 86 (43.65) | |||
| The use of contraceptive devices | 7.905 | 0.005 | |||
| Yes | 30 (58.82) | 73 (37.06) | |||
| No | 21 (41.18) | 124 (62.94) | |||
| History of pelvic inflammatory disease | 20 (39.22) | 43 (21.83) | 6.464 | 0.011 | |
| History of cesarean section | 21 (41.18) | 64 (32.49) | 1.358 | 0.244 | |
| History of D&C | 31 (60.78) | 67 (34.01) | 12.151 | ||
| History of termination of pregnancy | 19 (37.25) | 42 (21.32) | 5.547 | 0.019 | |
| History of polyps | 17 (33.33) | 52 (26.40) | 0.971 | 0.324 | |
| Endometrial hyperplasia | 24 (47.06) | 68 (34.52) | 2.731 | 0.098 | |
| Polyp diameter (cm) | 2.322 | 0.128 | |||
| 17 (33.33) | 89 (45.18) | ||||
| 34 (66.67) | 108 (54.82) | ||||
| Number of polyps | 1.253 | 0.263 | |||
| Single shot | 28 (54.90) | 125 (63.45) | |||
| Multiple | 23 (45.10) | 72 (36.55) | |||
| Polyp location | 4.838 | 0.184 | |||
| Anterior wall | 14 (27.45) | 47 (23.86) | |||
| Posterior wall | 11 (21.57) | 57 (28.93) | |||
| Sidewall | 18 (35.29) | 45 (22.84) | |||
| Cornu | 8 (15.69) | 48 (24.37) | |||
| Operation time (min) | 38.21 |
35.45 |
4.174 | ||
| Intraoperative blood loss (mL) | 20.35 |
19.53 |
1.516 | 0.131 | |
IUA, intrauterine adhesions.
Univariate analysis showed that factors potentially associated with the
occurrence of postoperative IUA in EP patients included the use of intrauterine
devices, history of pelvic inflammatory disease, history of D&C, history of
pregnancy termination, and surgical duration (p
| Index | OR (95% CI) | p value |
| Age | 1.019 (0.535–1.942) | 0.954 |
| Course of disease | 0.942 (0.510–1.740) | 0.849 |
| Body mass index | 0.981 (0.534–1.801) | 0.951 |
| Hypertension | 0.975 (0.535–1.776) | 0.934 |
| Diabetes | 0.842 (0.423–1.675) | 0.624 |
| Pregnancy times | 0.978 (0.532–1.799) | 0.943 |
| Reproductive demand | 1.601 (0.909–2.821) | 0.103 |
| Using contraceptive devices | 3.217 (1.780–5.815) | |
| History of pelvic inflammatory disease | 2.792 (1.503–5.187) | 0.001 |
| History of cesarean section | 1.201 (0.658–2.192) | 0.551 |
| History of D&C | 3.498 (1.966–6.224) | |
| History of pregnancy termination | 2.679 (1.406–5.105) | 0.003 |
| History of polyps | 1.372 (0.759–2.480) | 0.295 |
| Endometrial hyperplasia | 1.594 (0.891–2.853) | 1.594 |
| Polyp diameter | 1.023 (0.553–1.893) | 0.942 |
| Number of polyps | 0.984 (0.529–1.832) | 0.984 |
| Polyp location | 1.296 (0.702–2.394) | 0.407 |
| Operation time | 2.816 (1.558–5.090) | 0.001 |
| Intraoperative blood loss | 1.503 (0.846–2.669) | 0.164 |
OR, odds ratio; 95% CI, 95% confidence interval; EP, endometrial polyps.
Using the occurrence of IUA (no = 0, yes = 1) in EP patients after hysteroscopic
resection as the dependent variable and the five factors identified as
potentially significant in the univariate analysis (Table 3) as independent
variables (assignments shown in Table 4), a multivariate logistic regression
analysis was conducted. Variable screening was performed using the stepwise
forward method. It was found that the use of intrauterine devices (OR = 5.316),
history of pelvic inflammatory disease (OR = 4.059), history of D&C (OR =
5.314), history of pregnancy termination (OR = 3.514), and surgical duration (OR
= 1.149) were influencing factors for the occurrence of IUA in EP patients
postoperatively (p
| Independent variable | Assignment instructions |
|---|---|
| The use of contraceptive devices | No = 0, Yes = 1 |
| History of pelvic inflammatory disease | No = 0, Yes = 1 |
| History of D&C | No = 0, Yes = 1 |
| History of pregnancy termination | No = 0, Yes = 1 |
| Surgical time | Actual measurement value |
| Variable | SE | Wald |
p value | OR value | 95% CI | |
|---|---|---|---|---|---|---|
| The use of contraceptive devices | 1.671 | 0.430 | 15.127 | 5.316 | 2.290–12.336 | |
| History of pelvic inflammatory disease | 1.401 | 0.443 | 9.987 | 0.002 | 4.059 | 1.702–9.678 |
| History of D&C | 1.670 | 0.419 | 15.917 | 5.314 | 2.339–12.073 | |
| History of pregnancy termination | 1.257 | 0.426 | 8.706 | 0.003 | 3.514 | 1.525–8.097 |
| Surgical time | 0.139 | 0.044 | 9.785 | 0.002 | 1.149 | 1.053–1.254 |
| constant | –8.887 | 1.742 | 26.015 | - |
A nomogram model was developed based on five key factors to predict the occurrence of IUA in patients with EP following hysteroscopic resection. The following points were assigned for each factor: 60 points for the use of intrauterine devices, 50.5 points for history of pelvic inflammatory disease, 59 points for history of D&C, 45 points for history of pregnancy termination, and for surgical duration, every additional 2 minutes beyond the baseline surgical time of 24 minutes, 10 points were assigned. When the score reached 44 points, the maximum score (100 points) was achieved. The total score corresponds to the predicted probability of IUA occurrence in EP patients after surgery, as shown in Fig. 2.
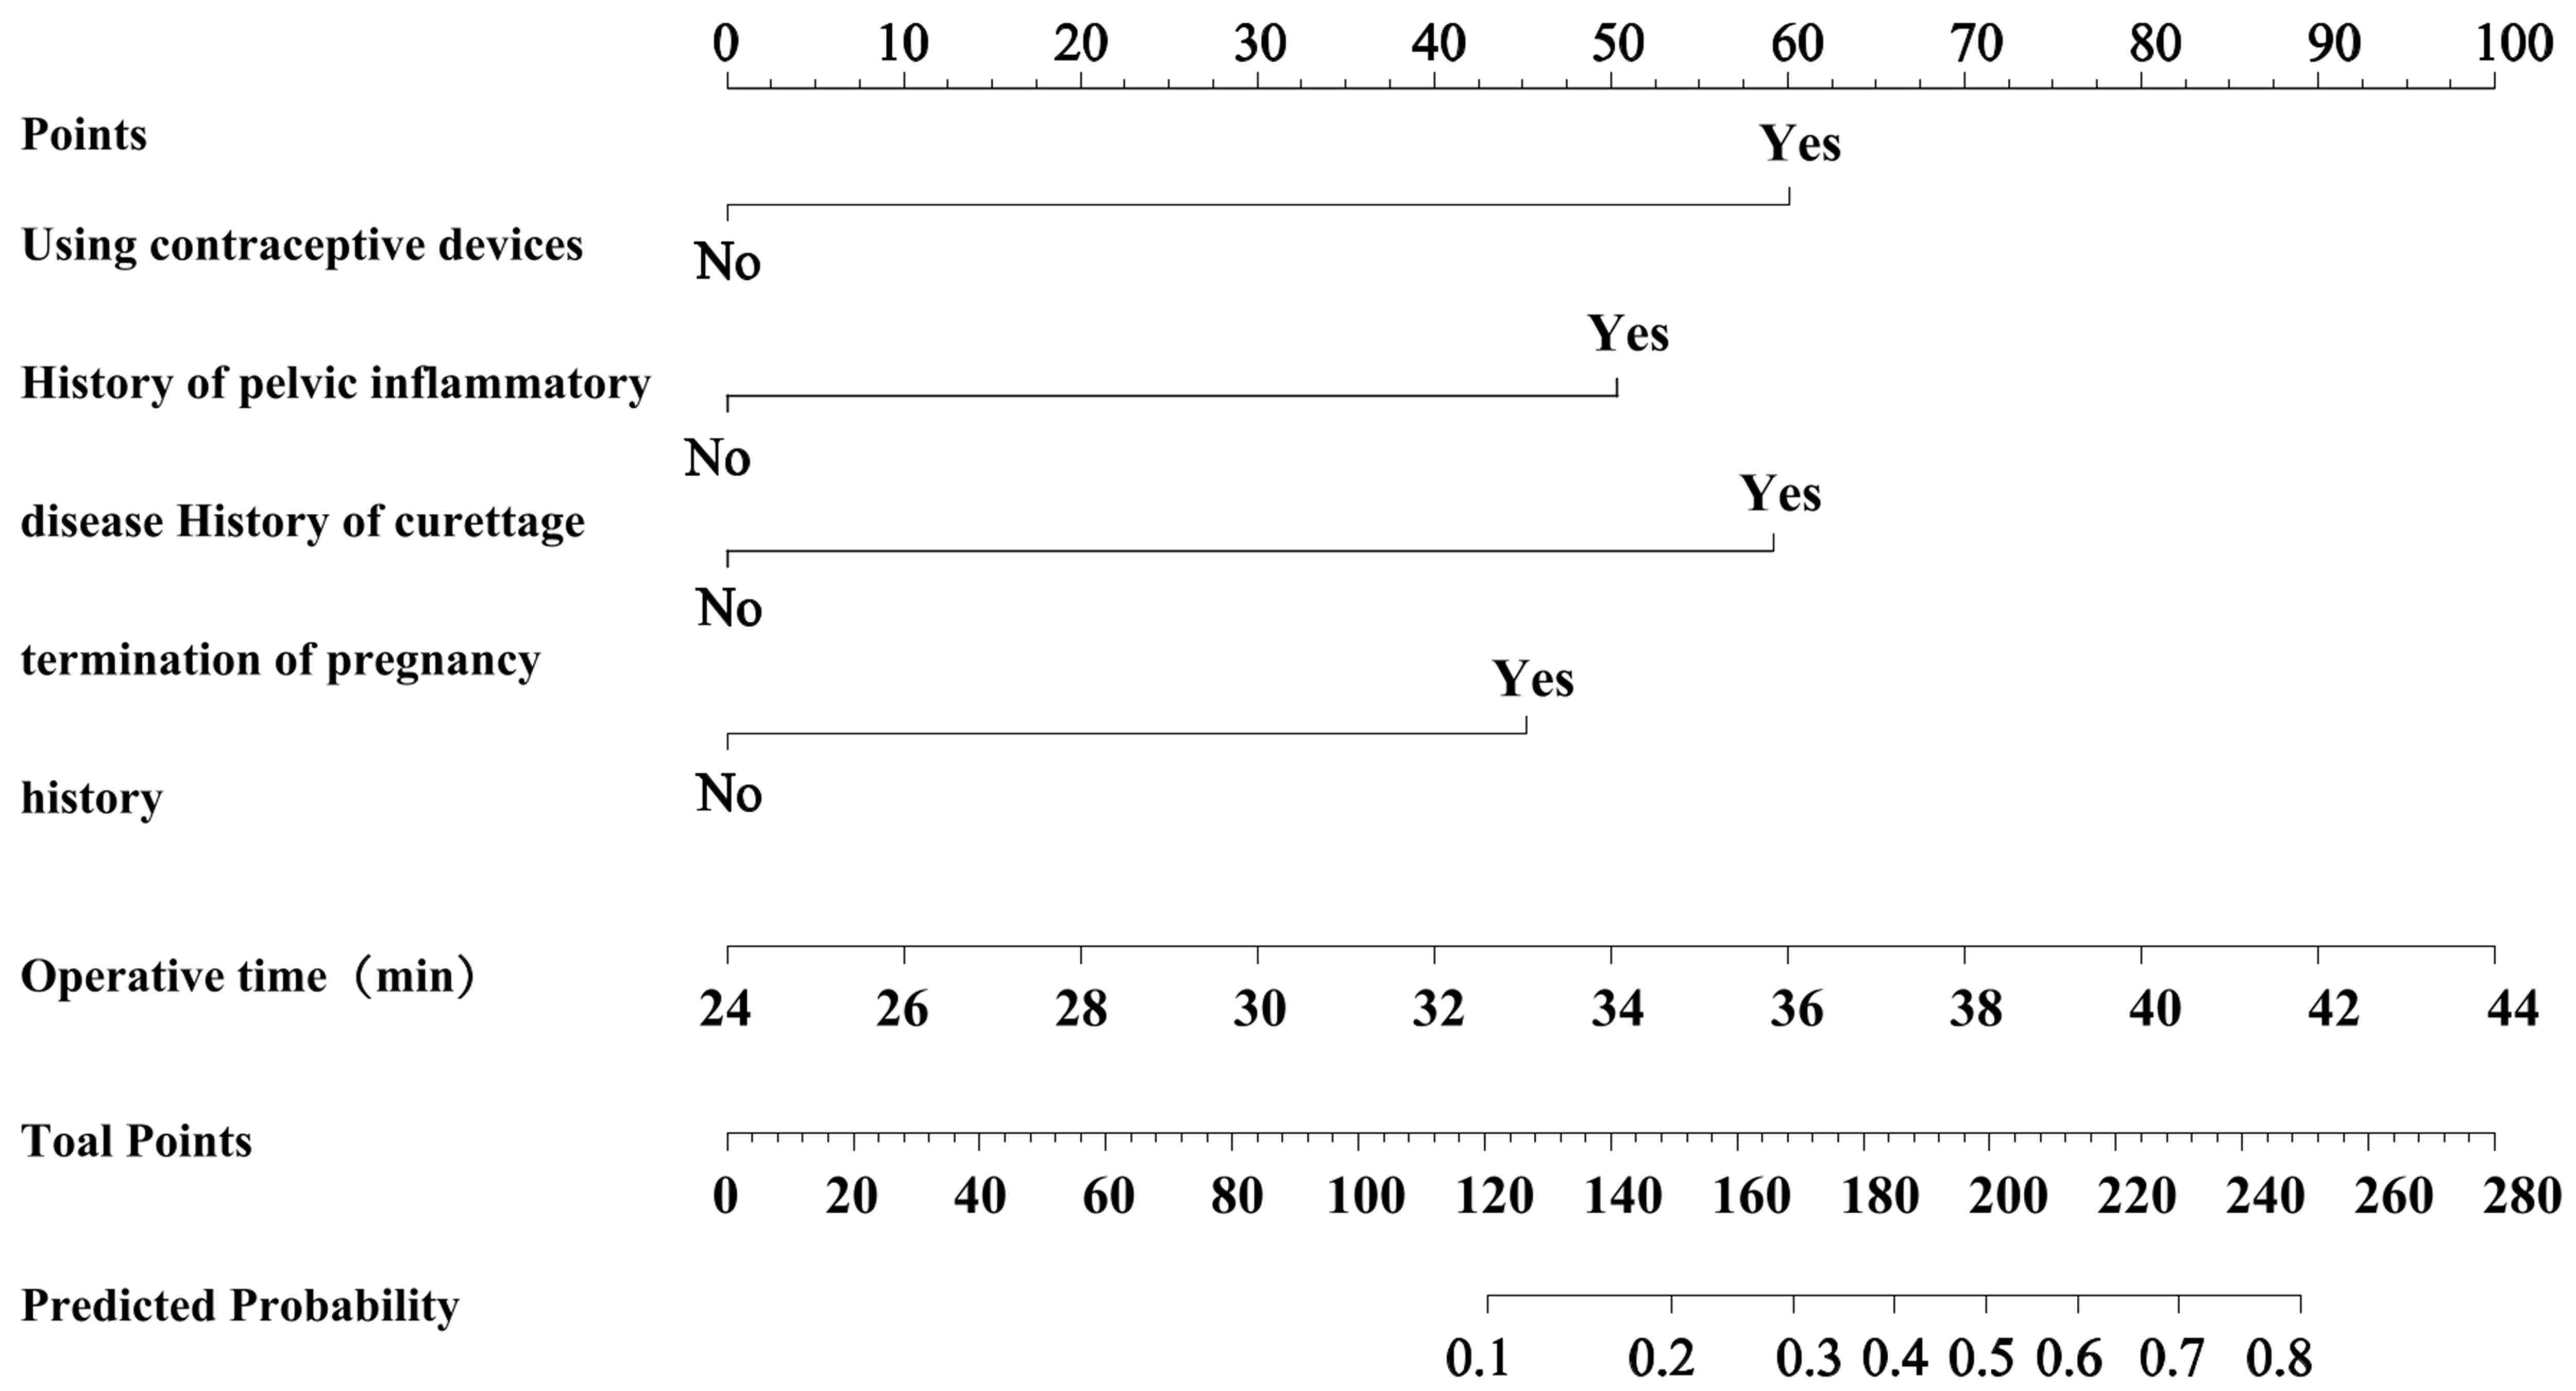 Fig. 2.
Construction of nomogram model for IUA occurrence after hysteroscopic resection in EP patients.
Internal validation showed that the model’s predicted AUC was 0.815 (95% CI:
0.753–0.876), with a sensitivity and specificity of 80.40% and 70.10%,
respectively (see Fig. 3A). The calibration curve demonstrated good fit (see Fig. 3B), and the Hosmer-Lemeshow (HL) test yielded
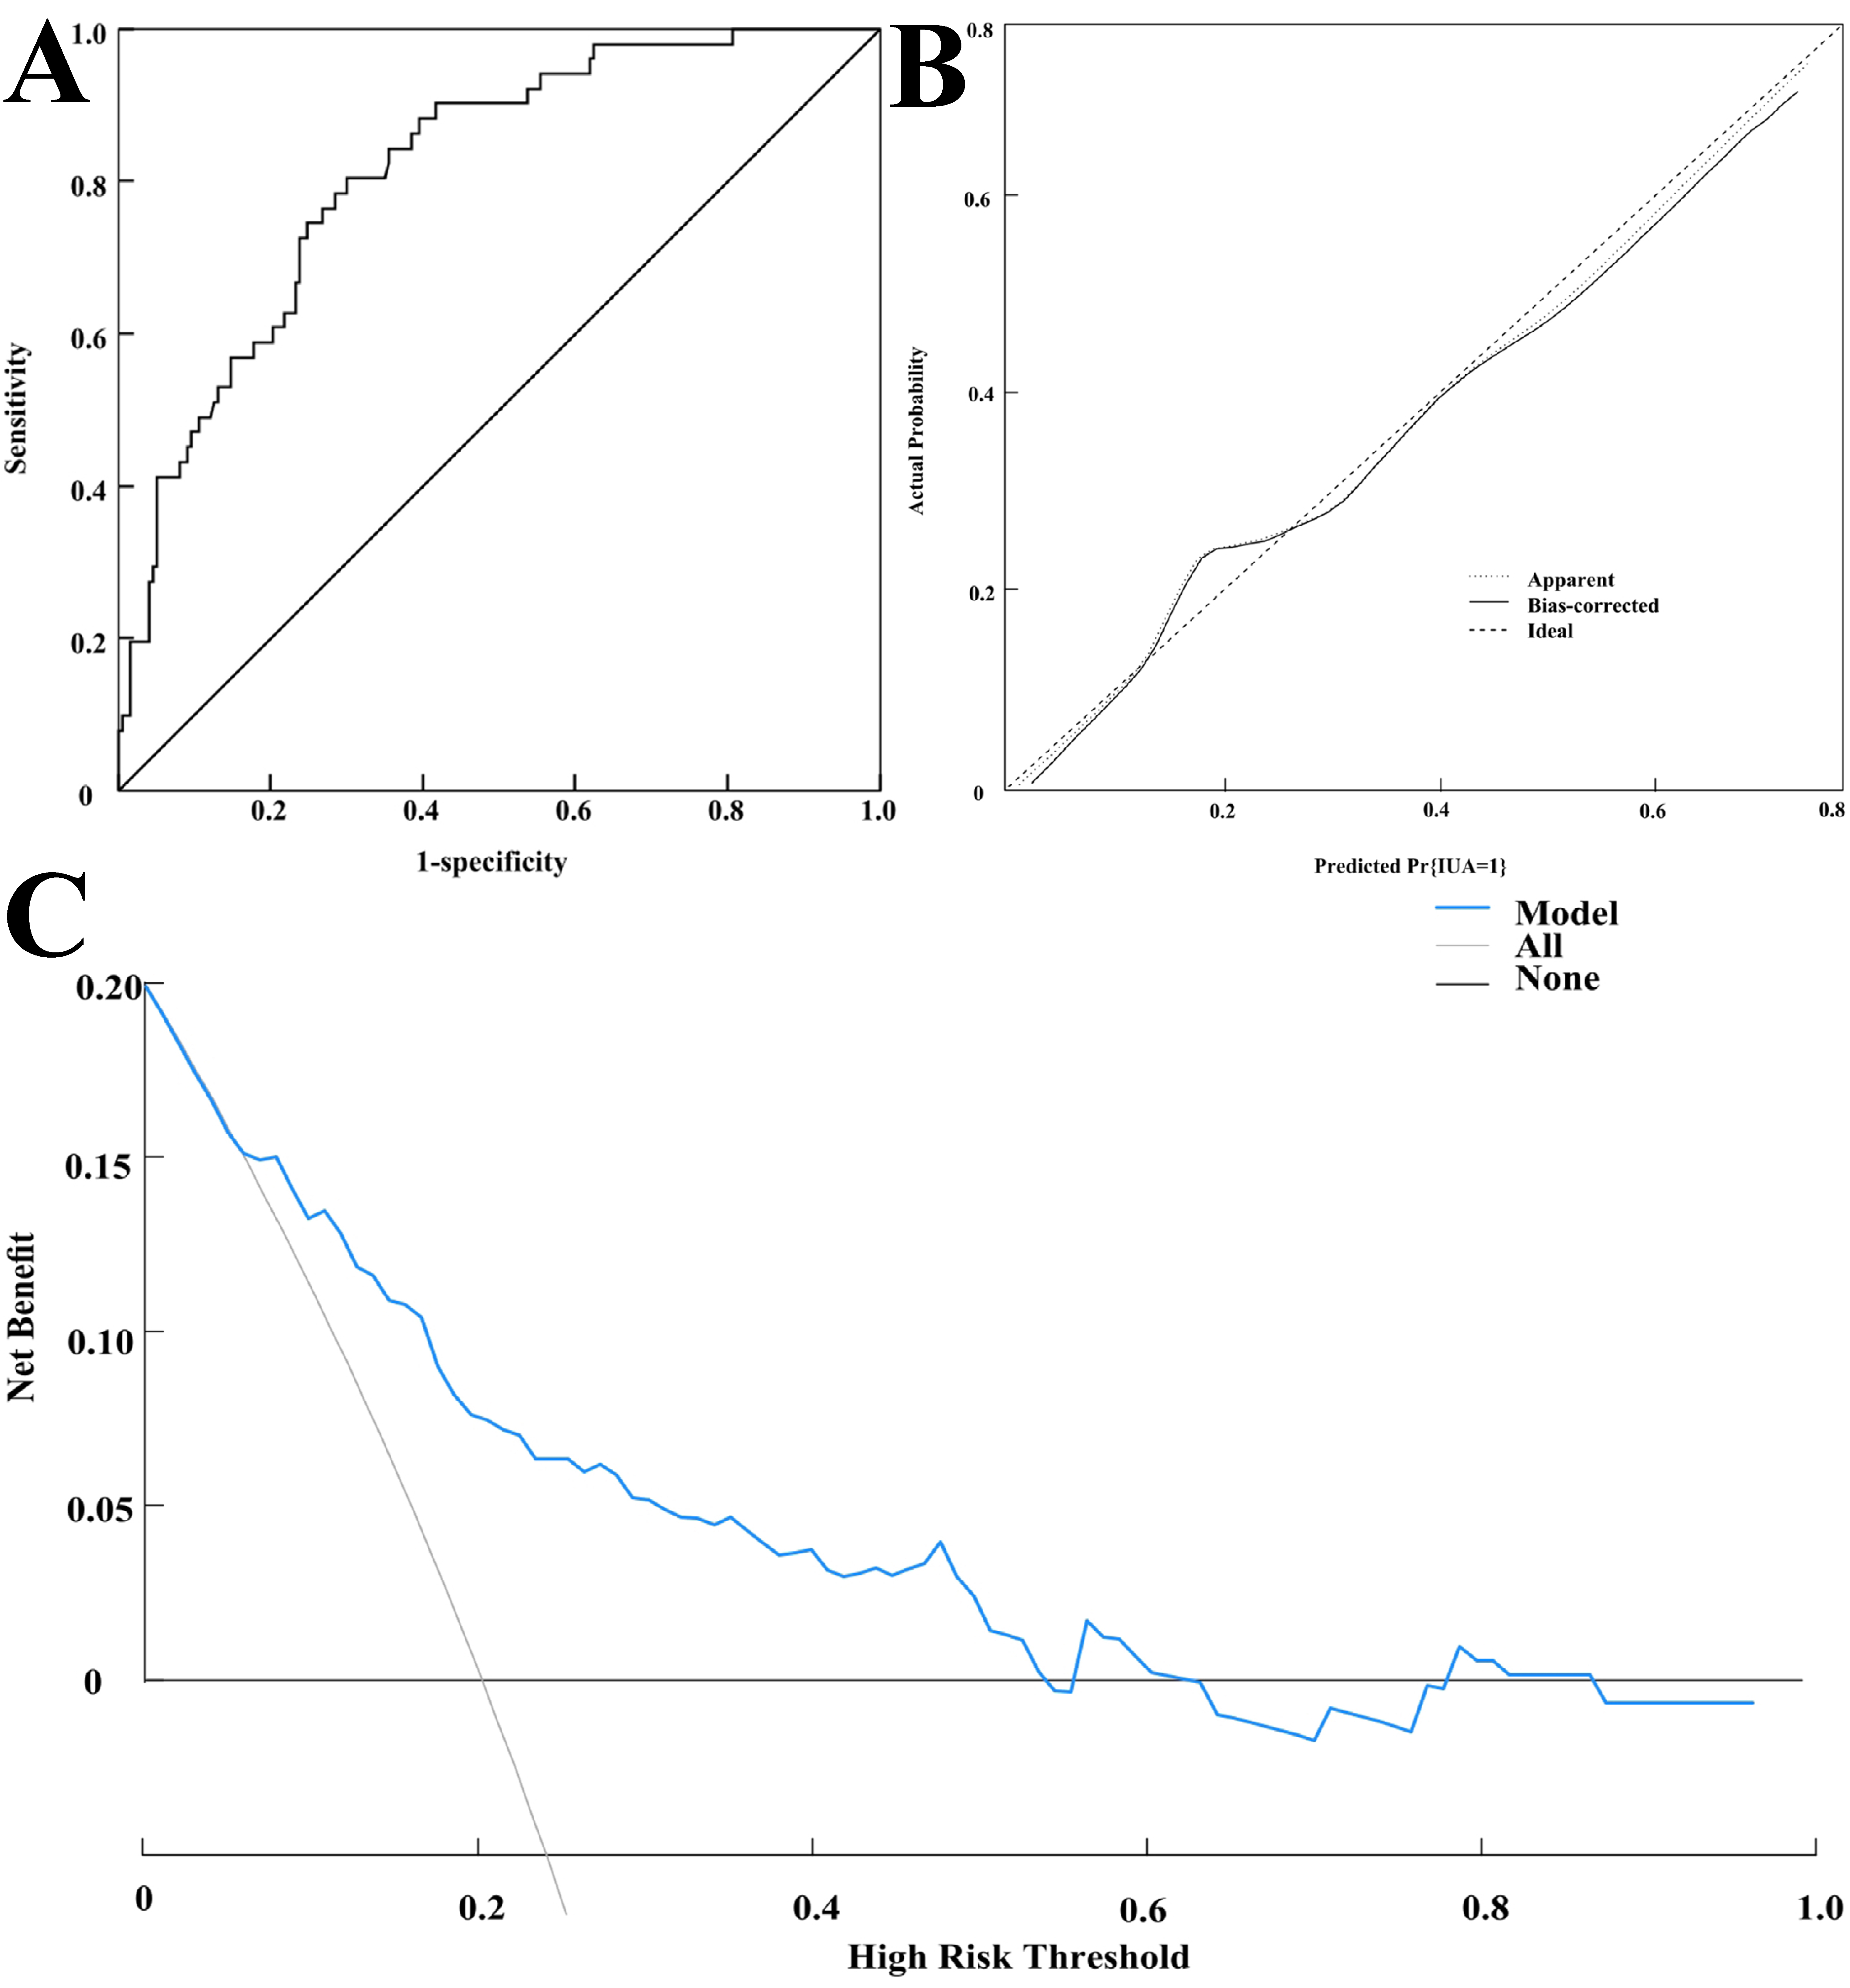 Fig. 3.
Internal validation of the nomogram model. (A) Receiver operating characteristic (ROC) curve for internal validation of the model. (B) Calibration curve for internal validation of the model. (C) Decision curve of the modeling group.
External validation showed that the model’s predicted AUC was 0.808 (95% CI:
0.747–0.870), with a sensitivity and specificity of 86.30% and 65.00%,
respectively (see Fig. 4A). The calibration curve demonstrated good fit (see Fig. 4B), and the Hosmer-Lemeshow (HL) test yielded
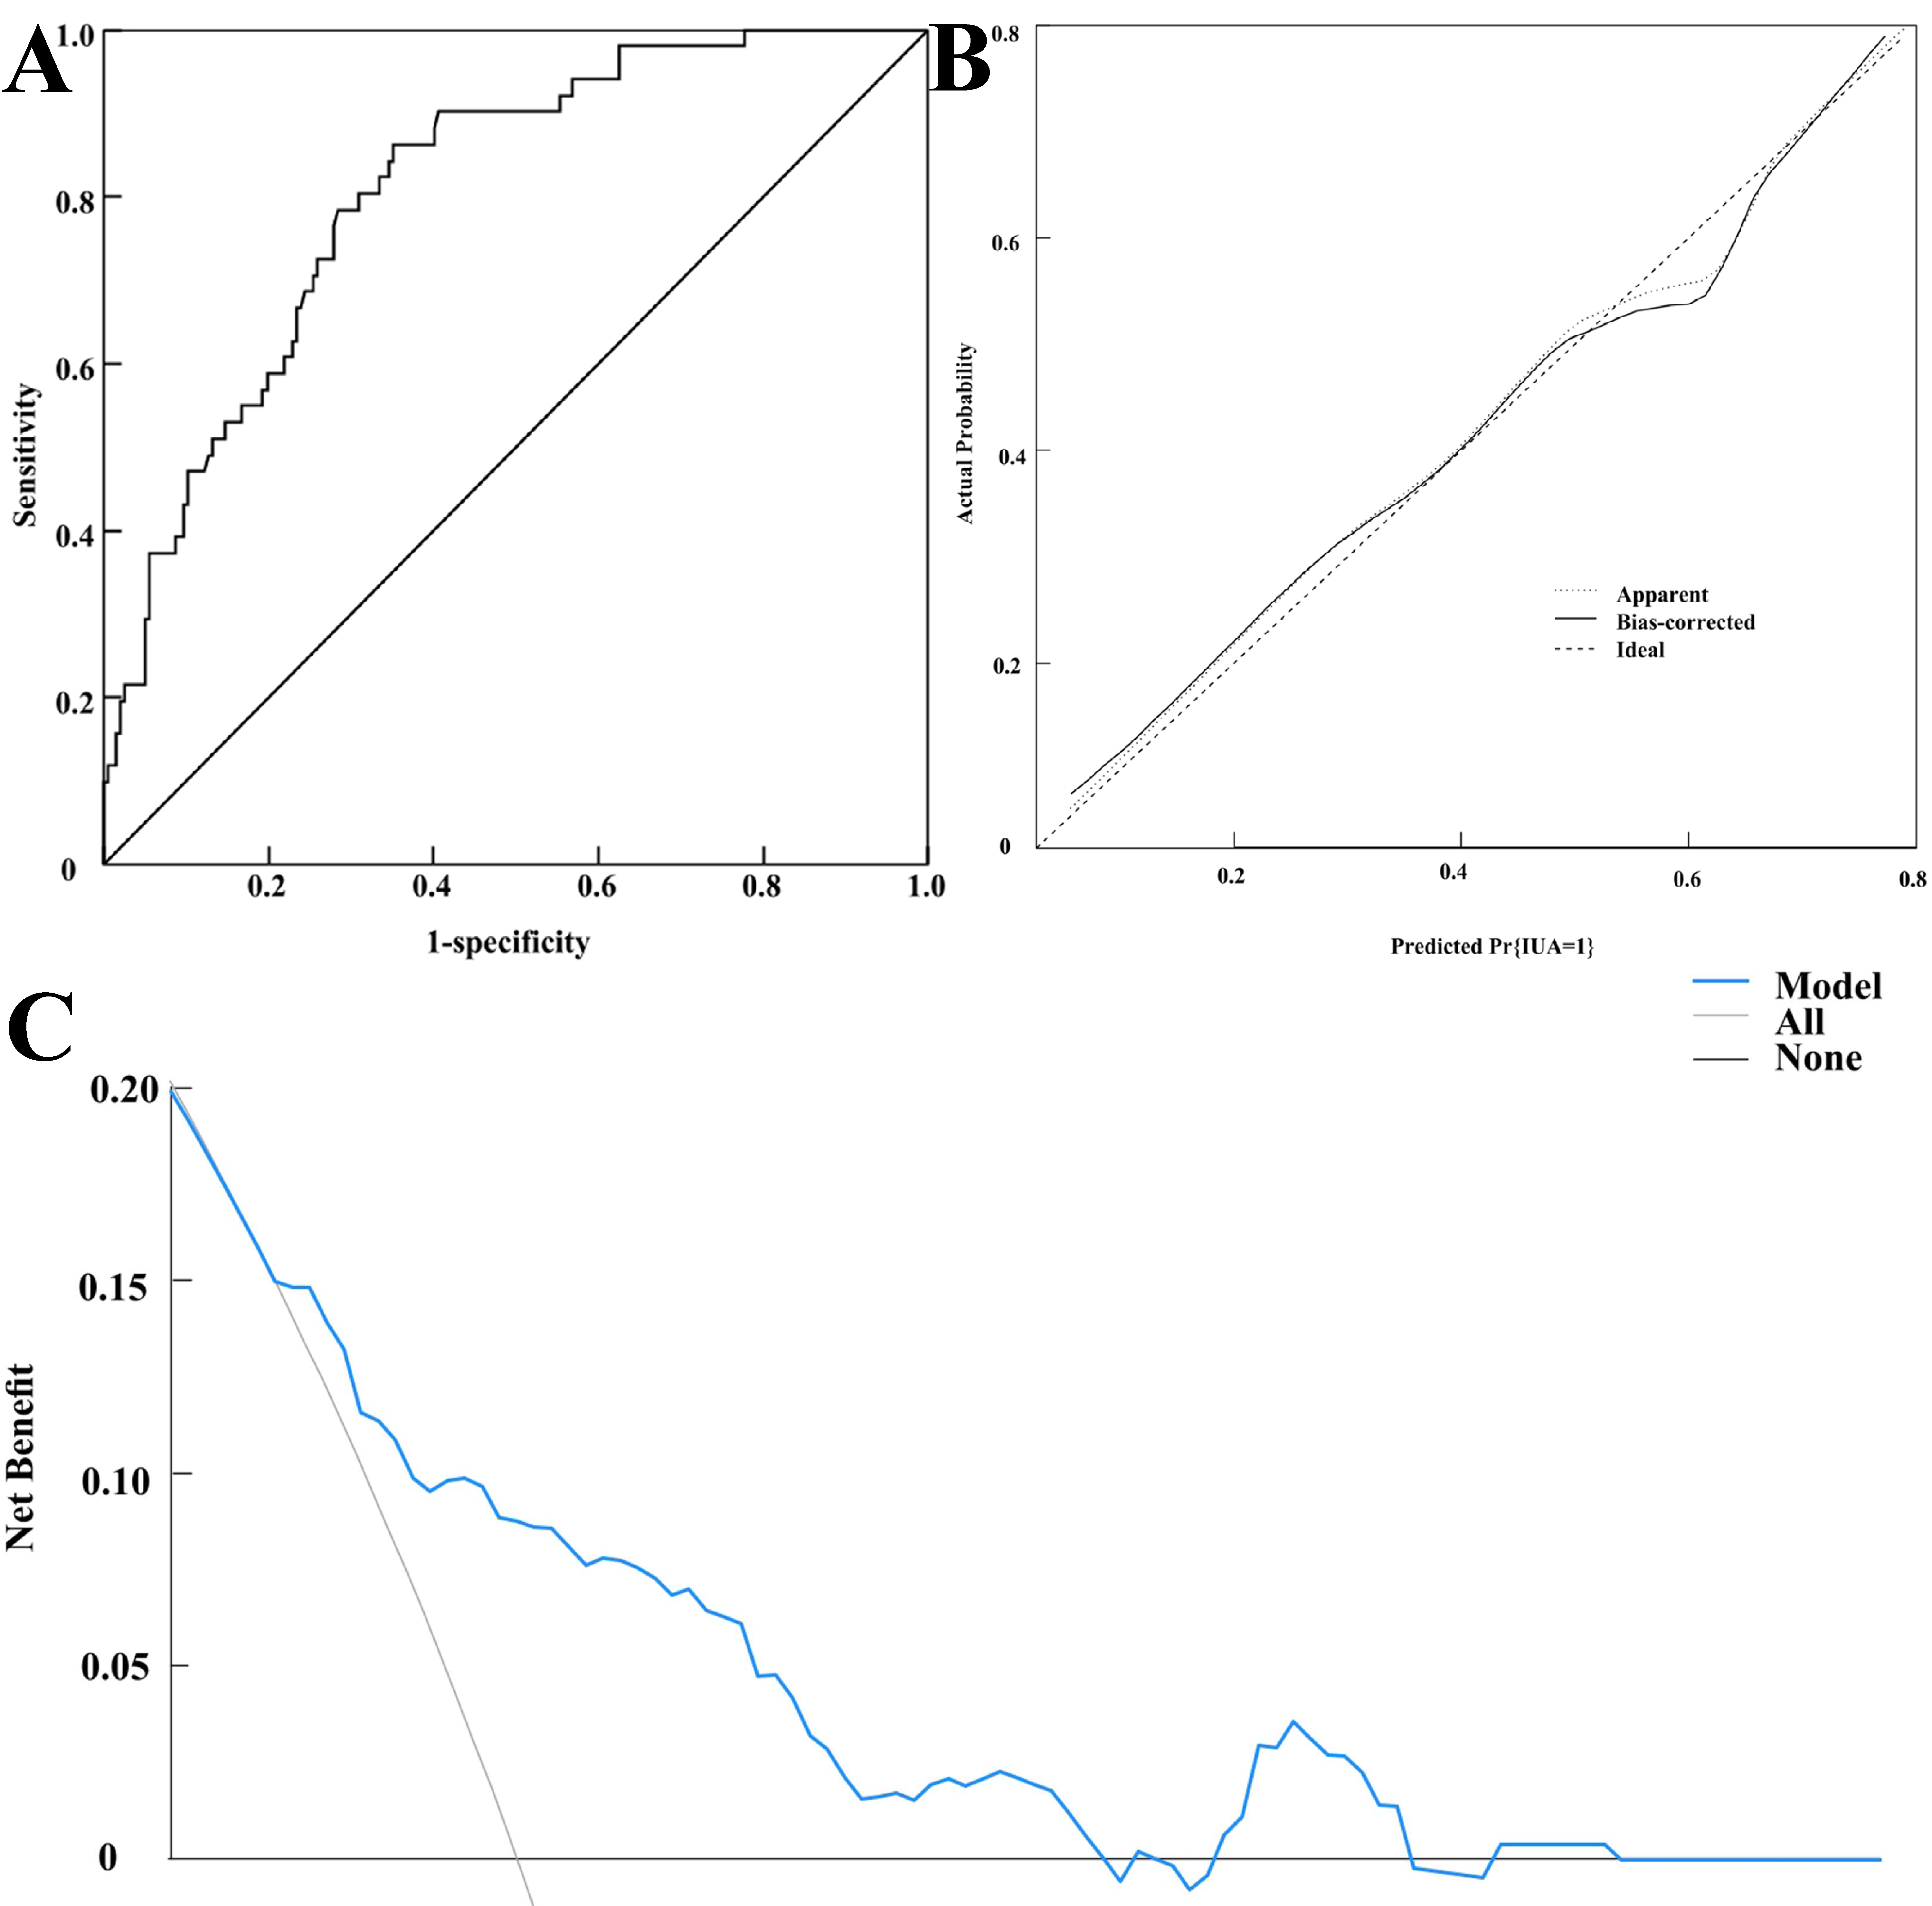 Fig. 4.
External validation of the model. (A) ROC curve for external validation of the model. (B) Calibration curve for external validation of the model. (C) Decision curve of the verification group.
EP can occur in individuals of any age after adolescence and is associated with a variety of factors, including endocrine disorders, obesity, and inflammatory stimuli [9]. Hysteroscopic resection, which removes pathological tissues with minimal trauma, is the preferred treatment for EP. However, intraoperative manipulations during the procedure may lead to IUA. In this study, the incidence of postoperative IUA among 248 EP patients was found to be 20.56%, which aligns with the postoperative IUA incidence rates of 18%–25% reported by Takasaki et al. [4]. Patients with IUA often experience reduced menstrual flow or even amenorrhea, and severe cases may lead to infertility or adverse pregnancy outcomes [10, 11]. Therefore, it is necessary to identify factors associated with postoperative IUA in EP patients and predict individual risks to enable targeted interventions.
Our study found that the use of IUDs, history of pelvic inflammatory disease (PID), history of D&C, history of pregnancy termination, and surgical duration were significantly associated with postoperative IUA in EP patients. The mechanisms behind these associations are as follows: (1) IUDs can irritate the endometrium, reduce the activity of lytic enzymes, induce abnormal collagen fiber proliferation, and promote tissue scarring. These effects, combined with surgical stimulation, lead to excessive production of inflammatory factors, thereby contributing to the development of IUA [12, 13]. Su et al. [14] reported that the risk of postoperative IUA in EP patients using an IUD was 2.08 times higher than in those who did not use one, which supports our findings. Therefore, a thorough assessment of the risks and contraceptive benefits of IUDs is essential when selecting contraceptive methods. Non-invasive methods, such as oral contraceptives, which have minimal impact on the endometrium, should be prioritized, especially for patients with high-risk factors for IUA. (2) History of PID may cause long-term uncontrolled inflammation, damaging cervical and other tissues, thereby increasing IUA risk [15]. Strengthening gynecological health education, emphasizing the prevention of sexually transmitted infections (STIs), and providing appropriate treatment for existing PID are critical for controlling inflammation and minimizing tissue damage [16, 17]. (3) History of D&C can damage the endometrial basal layer due to excessive negative pressure, disrupting epithelial regeneration and leading to inadequate endometrial coverage, which heightens the risk of IUA [18, 19]. Surgeons should perform curettage gently, carefully identify lesion locations, and avoid excessive endometrial damage [20]. (4) History of pregnancy termination may impair endometrial epithelial growth and stromal cell development, predisposing patients to IUA [21, 22]. (5) Prolonged surgical duration in EP patients reflects more complex conditions, severe tissue destruction, and greater surgical difficulty, resulting in higher postoperative IUA risk [23, 24]. Surgeons should optimize surgical plans and shorten the surgical duration as much as possible through preoperative simulation to minimize tissue damage and improve efficiency to prevent IUA.
To accurately identify high-risk patients for postoperative IUA following
hysteroscopic resection, we constructed a nomogram prediction model. Each
variable in the model was assigned a score that reflects its impact on IUA risk.
The total score, derived from the sum of individual scores, corresponds to the
predicted probability of IUA occurrence. Our model demonstrated strong
discrimination (AUC of 0.815 in the training cohort, with a sensitivity and
specificity of 80.40% and 70.10%, respectively; AUC of 0.808 in the validation
cohort, with a sensitivity and specificity of 86.30% and 65.00%, respectively)
and calibration (Hosmer-Lemeshow test:
The use of IUDs, history of PID, curettage, termination of pregnancy, and surgical duration are independent risk factors for postoperative IUA in EP patients after hysteroscopic resection. The constructed nomogram model effectively predicts IUA risk, providing a valuable tool for identifying high-risk patients and guiding early, precise interventions. This study’s strength lies in the development of the first risk prediction model for IUA based on quantifiable indicators, demonstrating strong clinical applicability. Both internal and external validations were conducted to ensure the robustness and generalizability of the model. However, due to its single-center, retrospective nature, and the relatively small sample size, the model’s applicability to other settings is limited. Therefore, future prospective multicenter studies are necessary to optimize the model and enhance its external validity.
Data is available from the corresponding author on reasonable request.
LL and JY designed the research study and wrote the manuscript. LL and WL performed the research. LL, WL and JY collected data, SL analyzed the data. All authors contributed to editorial changes in the manuscript. All authors read and approved the final manuscript. All authors agree to be accountable for all aspects of the work.
This study was conducted in accordance with the guidelines of the Declaration of Helsinki and approved by the Ethics Committee of Ganzhou Maternal and Child Health Care Hospital (approval number: 202510). Informed consent was obtained from all patients or their families/legal guardians prior to participation.
Not applicable.
This research received no external funding.
The authors declare no conflict of interest.
References
Publisher’s Note: IMR Press stays neutral with regard to jurisdictional claims in published maps and institutional affiliations.