


 , Seher Koyuncu Aydın 1
1 Department of Obstetrics and Gynecology, University of Health Sciences Turkey, Sancaktepe Sehit Prof. Dr. Ilhan Varank Training and Research Hospital, 34785 Istanbul, Turkey
Abstract
Advanced maternal age (AMA) has been associated with various adverse obstetric, perinatal, and neonatal outcomes. This study primarily aimed to compare pregnancy outcomes in women aged 40 years and older with those aged 35–39 years, with a secondary aim to determine advanced maternal age by comparing these two age groups with those aged 20–34 years.
This was a retrospective review of adults who gave birth between January 2020 and August 2024. All pregnant women in this study were single pregnancies and aged 20 years and older. Pregnant women using assisted reproductive technology and those with missing data were excluded from the study. This study included three groups of pregnant women: 20–34, 35–39, and 40 years and older. Perinatal outcomes of the three groups were compared.
AMA has previously been associated with various adverse obstetric outcomes. However, while there was a significant difference in birth weeks between the 20–34 years age group and the ≥40 age group (p = 0.019), the birth weeks of other age groups were similar. Moreover, there was no statistically significant difference between birth weights. Maternal ages of 35–39 and ≥40 years were associated with increased rates of cesarean delivery, pre-eclampsia, low birth weight, gestational diabetes mellitus (GDM), fetal growth restriction (FGR), preterm delivery, and low Apgar score (p < 0.001); however, rates of placental abruption, and preterm premature rupture of membranes (PPROMs) were similar to women aged <35 years. Gestational hypertension (GHT) (adjusted odds ratio (adjOR): 6.710, 95% confidence interval (95% CI): 2.755–16.343, p = < 0.001), oligohydramnios (adjOR: 2.145, 95% CI: 1.056–4.356, p = 0.035), macrosomia (adjOR: 5.459, 95% CI: 1.164–25.609, p = 0.031), and postpartum hemorrhage (adjOR: 5.139, 95% CI: 1.021–25.872, p = 0.047) are more common in women aged ≥40 years compared to both the reference group and the <35 age group.
Adverse perinatal outcomes are more common in pregnant women aged 35 and over. These adverse outcomes are more common in the ≥40 years age group. To prevent these negative outcomes as well as potential maternal and fetal mortality and morbidity, we believe it is crucial to monitor these pregnant women closely during the prenatal period.
Keywords
- advanced maternal age
- adverse obstetric outcomes
- adverse perinatal outcomes
Since the percentage of women giving birth after the age of 35 has increased over time, especially in high-income countries, concerns have simultaneously recently arisen regarding the effects of advanced maternal age (AMA) on pregnancy outcomes [1, 2]. Meanwhile, AMA has been linked to a variety of unfavorable obstetric, perinatal, and neonatal outcomes [3]. Data from some studies have shown that AMA is associated with numerous adverse pregnancy outcomes, including abortus, chromosomal abnormalities, stillbirth, fetal growth restriction (FGR), preterm birth, pre-eclampsia, gestational diabetes mellitus (GDM), and higher rates of cesarean (CS) delivery [4, 5, 6, 7, 8]. According to previous study the primary reason for poor perinatal outcomes in AMA is insufficient uterine vascularity, which is linked to lower fetal oxygenation and an elevated risk of hypertension [9]. The impact of maternal age on perinatal outcomes is debatable, as another study has revealed that older and younger women had comparable perinatal results [10]. Although 35 years is considered to be an advanced age, this circumstance has recently started to be addressed, with some studies suggesting that 40 years is a better cutoff point for identifying high-risk pregnancies [11, 12].
Therefore, this study primarily aimed to compare pregnancy complications and pregnancy outcomes in women aged 40 years and older with those aged 35–39 years, with a secondary aim to determine advanced maternal age by comparing these age groups with those aged 20–34 years.
This study was conducted at Sancaktepe Şehit Prof. Dr. İlhan Varank Training and Research Hospital between January 2020 and August 2024. This study was approved by the local Medical Ethics Committee of Sancaktepe Sehit Prof. Dr. Ilhan Varank Training and Research Hospital, department of Obstetrics and Gynecology, Istanbul, Turkey (grant no: E-46059653-050.04-259020152). Adults who gave birth at the research center between January 2020 and August 2024 were reviewed retrospectively. All pregnant women included in this study were single pregnancies and at least 20 years old. The study included three groups of pregnant women: 20–34, 35–39, and 40 years and older. Women with multiple pregnancies, those who became pregnant with assisted reproductive technology, and pregnant women with missing data were not included in this study.
Hospital data were used to gather information on age, body mass index (BMI),
obstetric history, obstetric outcomes, and chronic diseases, which included
pregestational diabetes mellitus, chronic hypertension,
hypothyroidism/hyperthyroidism, migraine, asthma, and epilepsy. Additionally,
information on delivery mode, low birth weight (birth weight
Iron deficiency, GDM, placental abruption, pre-eclampsia, eclampsia and
hemolysis, elevated liver enzymes, low platelet levels syndrome (HELLP syndrome), and
postpartum hemorrhage were all considered adverse maternal outcomes. A hemoglobin
level below 11.0 g/dL in postpartum women was considered anemia [13]. GDM
diagnoses were made following a minimum fasting value higher than 92 mg/dL, a
1-hour satiety value of 180 mg/dL, or a 2-hour satiety value of 153 mg/dL in the
75-gram oral glucose tolerance test [14]. Pre-eclampsia was diagnosed if blood
pressure was high (systolic
Preterm premature rupture of membranes (PPROMs), preterm delivery, oligohydramnios, FGR, low birth weight, fetal macrosomia, and stillbirth were all considered adverse perinatal outcomes. Obstetric ultrasound measurements were defined as oligohydramnios when the amniotic fluid index was less than 5 cm, or the single deepest vertical pool of amniotic fluid was less than 2 cm [18]. Indicators of FGR included an umbilical artery pulsatility index (PI) above the 95th percentile or a cerebroplacental ratio (CPR) below the 5th percentile, along with an abdominal circumference (AC) or estimated fetal weight (EFW) below the 3rd percentile or EFW or/and AC below the 10th percentile [19]. Delivery after 24 weeks but before 37 weeks were considered preterm. Similarly, PPROMs occur when the chorioamniotic membranes rupture between 24 and 36 weeks and 6 days [20]. Stillbirth occurs when a fetus weighs 500 grams or more and dies in utero after the 20th week of pregnancy [21]. Definitions of adverse maternal and perinatal outcomes are summarized in Table 1 (Ref. [13, 14, 15, 16, 17, 18, 19, 20, 21]).
| Outcome | Definition |
|---|---|
| Iron deficiency | Hemoglobin value less than 11.0 g/dL in women who gave birth [13]. |
| Gestational diabetes mellitus (GDM) | An absence of any threshold value: fasting glucose |
| Pre-eclampsia | High blood pressure (systolic |
| Eclampsia | Seizures in the context of pre-eclampsia [15]. |
| HELLP syndrome | Hemolysis, elevated liver enzymes, and low platelet counts [15]. |
| Placental abruption | Premature detachment of the placenta before delivery [13]. |
| Postpartum hemorrhage | Total blood loss |
| Preterm delivery | Delivery before 37 weeks of gestation. |
| Preterm premature rupture of membranes (PPROMs) | Rupture of membranes before the onset of labor and before 37 weeks of gestation [20]. |
| Oligohydramnios | Amniotic fluid index |
| Fetal growth restriction (FGR) | Estimated fetal weight or abdominal circumference |
| Macrosomia | Birth weight |
| Low birth weight | Birth weight |
| Stillbirth | Fetal death after 20 weeks of gestation, with a birth weight of |
| Low Apgar score | 1st-minute Apgar |
Statistical analysis was conducted to assess the impact of AMA on particular
pregnancy outcomes, which were considered independently. The SPSS 20 software
package (SPSS Inc., Chicago, IL, USA) was used for all analyses. First,
descriptive statistics were created for each of the three groups and all patients
for each pregnancy outcome and any confounding factor. For nonparametric and
continuous confounders, Kruskal-Wallis test/pairwise comparisons of the group
(significance values were adjusted using Bonferroni correction for multiple
tests) and Chi-square tests were applied for categorical variables. The reference
group comprised mothers under 35 years old on the anticipated delivery date.
Multivariable logistic regression was then used to determine the crude and
adjusted effects of the AMA on each of the unfavorable pregnancy outcomes.
Confounders for the adjusted models included parity, BMI, history of miscarriage,
pregestational diabetes mellitus, chronic hypertension, and chronic disease. When
95 % confidence intervals (95% CIs) and adjusted odds ratios (adjORs) were
calculated, p
A total of 1616 patients meeting the study criteria were included. The flow
diagram is shown in Fig. 1. The patients were divided into three age groups; the
first consisted of 585 (36.2%) patients aged 20–34, the second consisted of 515
(31.9%) patients aged 35–39, and the third comprised 516 (31.9%) patients aged
40 and over. The third group included eight patients aged 50 and over. Table 2
summarizes the demographic characteristics, obstetric history, and patient
characteristics of the three groups according to maternal age. When patient
characteristics were compared according to maternal age group, there was no
significant difference in maternal anemia and chronic hypertension; however,
there was a significant difference between other parameters. While the rates of
gravida, parity, and chronic disease were significantly different in all age
groups (p
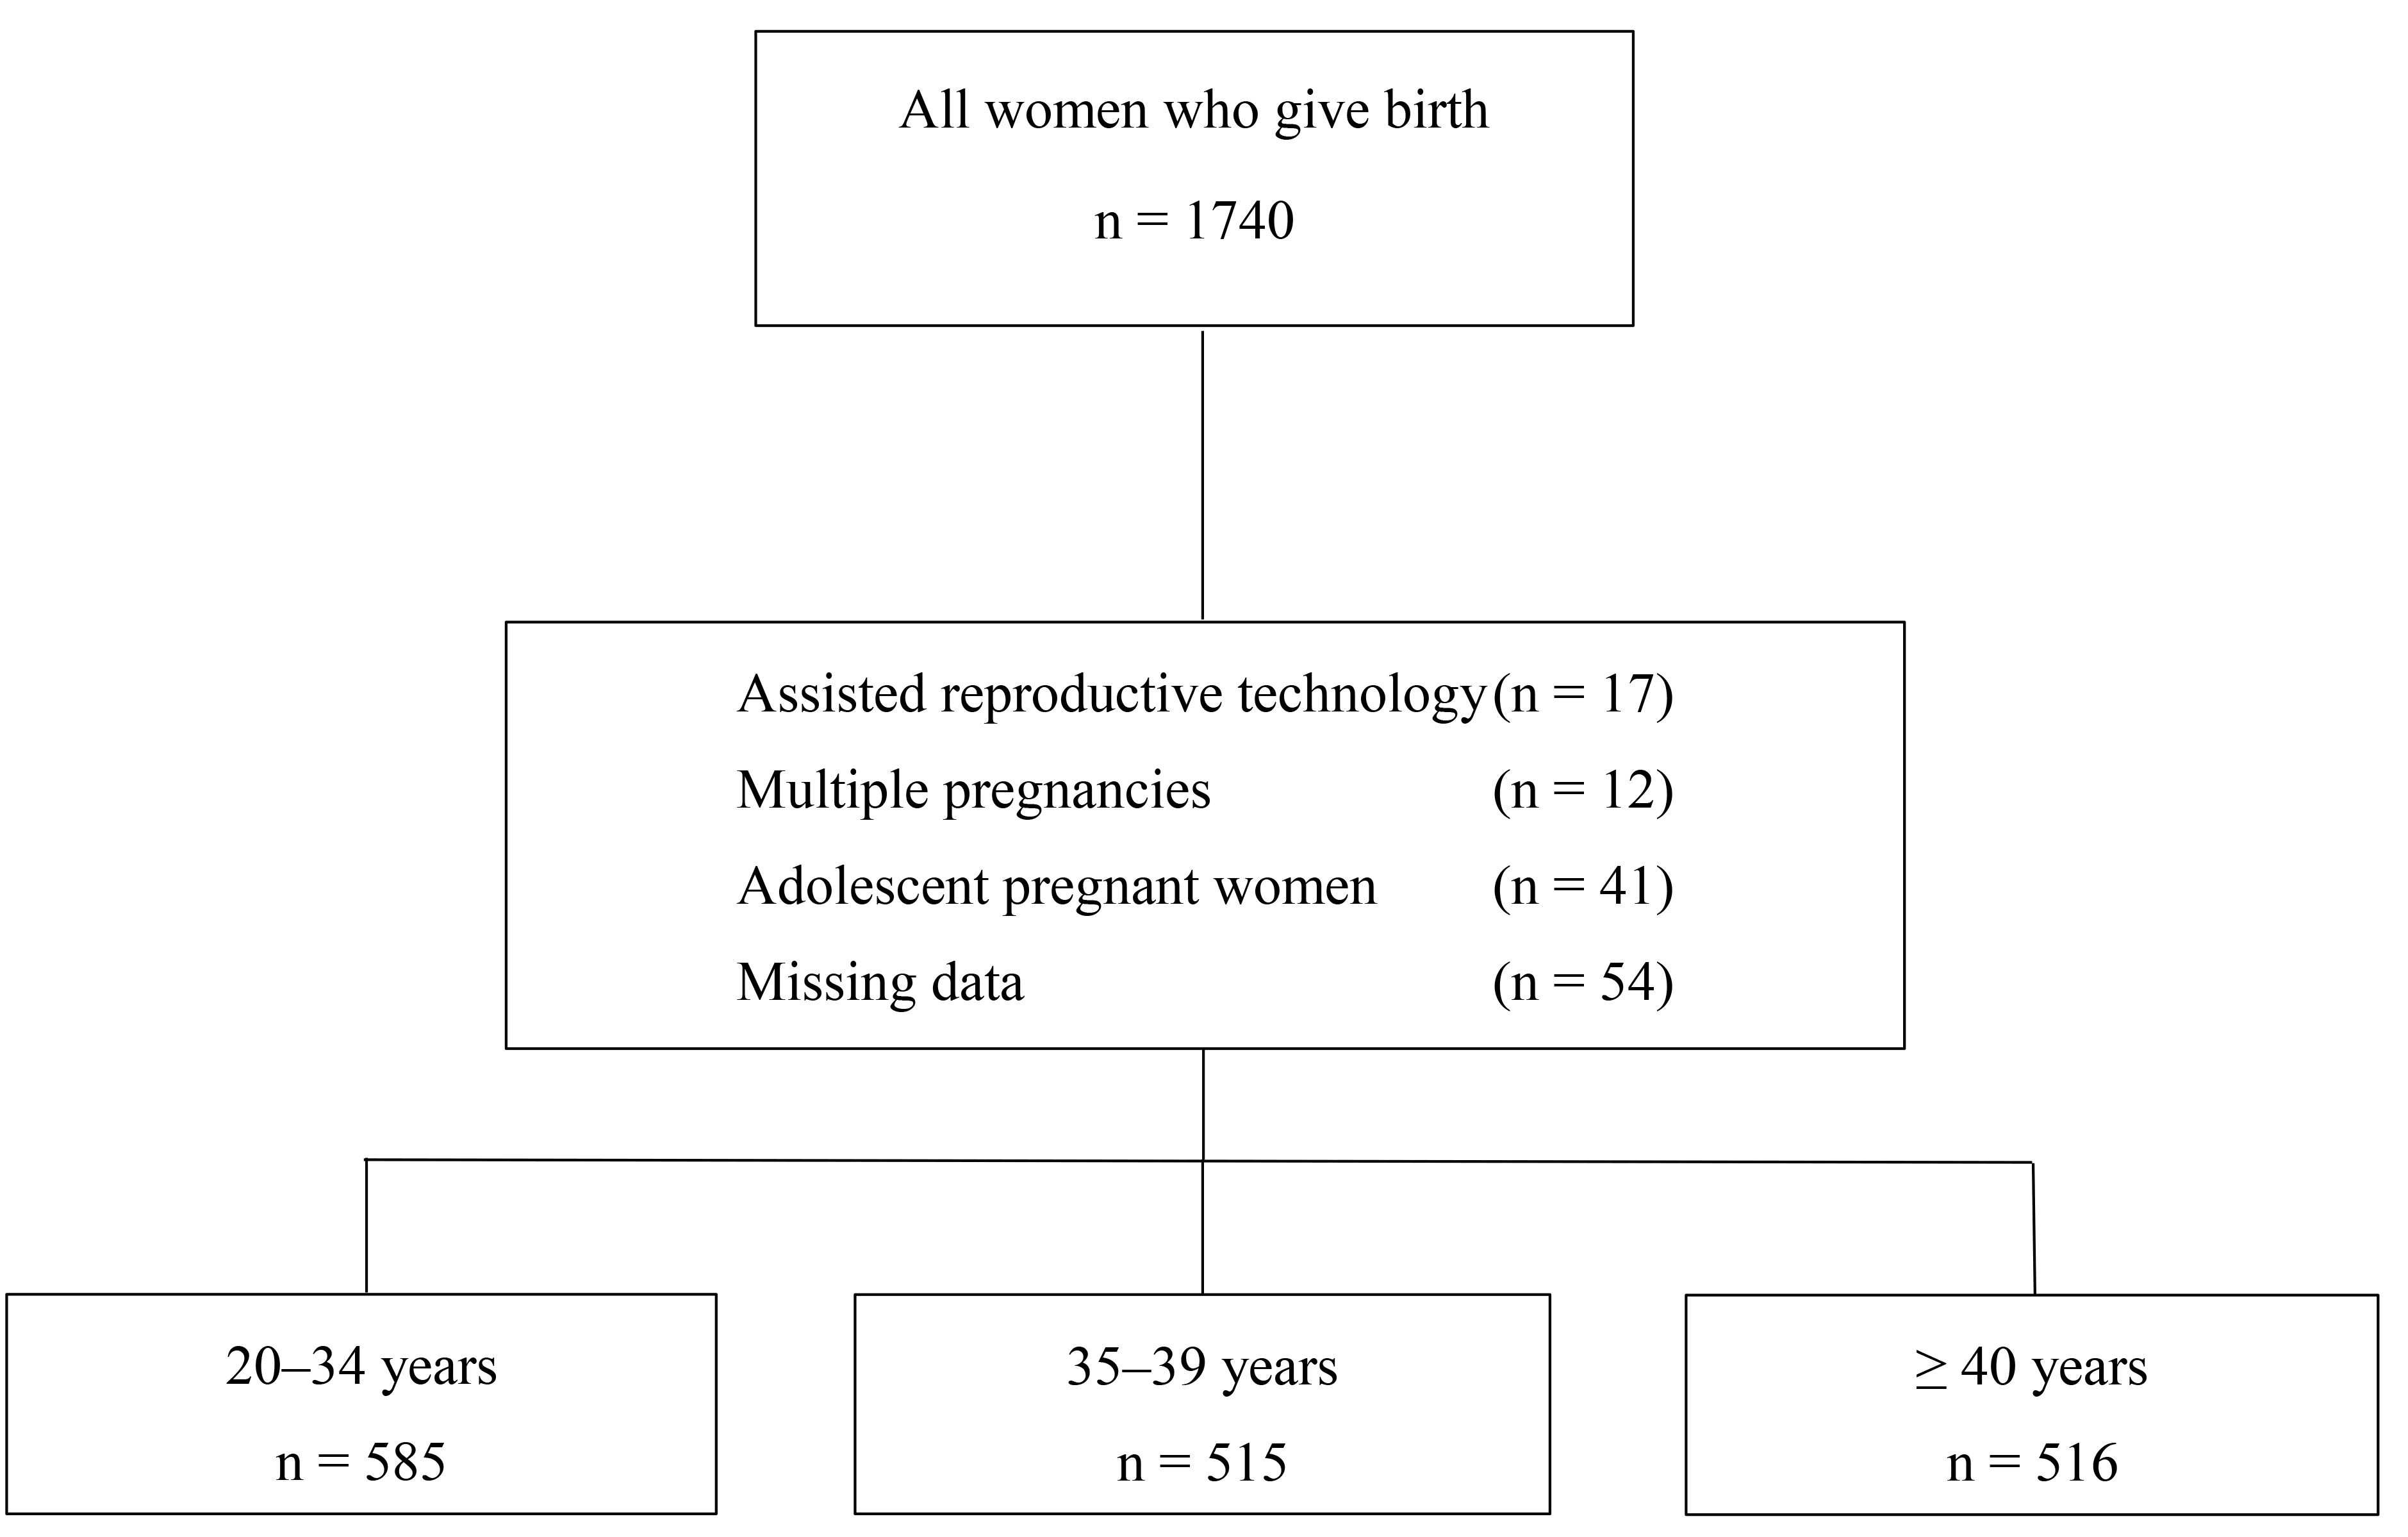 Fig. 1.
Flow diagram showing the distribution of study participants according to age groups and exclusion criteria.
| 20–34 years | 35–39 years | 20–34 vs. 35–39 years | 20–34 vs. |
35–39 vs. |
Overall p-value | ||
| n = 585 | n = 515 | n = 516 | p-value | p-value | p-value | ||
| Age (years) median (IQR) | 25.0 (6) | 37.0 (2) | 41.0 (2) | ||||
| Body mass index (BMI) median (IQR) | 23.8 (9.2) | 24.2 (8.3) | 25.8 (8.5) | 0.0491a | 0.0091a | ||
| Gravidity median (IQR) | 2.0 (2) | 3.0 (2) | 2.0 (1) | ||||
| Parity median (IQR) | 1.0 (2) | 2.0 (1) | 1.0 (1) | ||||
| Gestational week median (IQR) | 38.0 (2) | 39.0 (1) | 39.0 (3) | 0.0571a | 0.0191a | 1.01a | 0.0121 |
| Birth weight (grams) median (IQR) | 3300 (508) | 3365 (730) | 3415 (818) | 0.0651 | |||
| History of miscarriage (%) | 35 (27.3%) | 58 (45.3%) | 35 (27.3%) | 0.0022a | 0.1952a | 0.0032 | |
| History of previous cesarean section (%) | 22 (3.8%) | 191 (37.1%) | 131 (25.4%) | ||||
| Maternal anemia (%) | 199 (34.0%) | 178 (34.6%) | 164 (31.8%) | 0.2832a | 0.1432a | 0.1142a | 0.6022 |
| Pregestational diabetes mellitus (%) | 2 (0.3%) | 4 (0.8%) | 9 (1.7%) | 0.1092a | 0.0062a | 0.0542a | 0.0492 |
| Chronic hypertension (%) | 2 (0.3%) | 5 (1.0%) | 8 (1.6%) | 0.0632a | 0.0112a | 0.1342a | 0.1132 |
| Chronic disease (%) | 12 (2.1%) | 65 (12.6%) | 111 (21.5%) | ||||
IQR, interquartile range. 1 Kruskal-Wallis test. 1a Kruskal-Wallis test/pairwise group comparisons (significance values have been adjusted using the Bonferroni correction for multiple tests). 2 Chi-square test. 2a Chi-square test (significance values have been adjusted using the Bonferroni correction for multiple tests).
Table 3 shows the percentage of cases affected by obstetric outcomes for each maternal age group and summarizes the adjusted ORs with 95% CIs estimating the effect of AMA for each obstetric outcome compared with the reference group of women younger than 35 years.
| Outcome | 20–34 years (n = 585) | 35–39 years (n = 515) | |||
| n (%) | n (%)/adjOR (95% CI) | p-value | n (%)/adjOR (95% CI) | p-value | |
| Vaginal delivery | 559 (95.6%) | 269 (52.2%)/0.045 (0.029–0.070) | 276 (53.5%)/0.071 (0.046–0.111) | ||
| Cesarean delivery | 26 (4.4%) | 246 (47.8%)/22.271 (14.287–34.717) | 240 (46.5%)/14.016 (9.035–21.745) | ||
| Gestational hypertension | 6 (1.0%) | 11 (2.1%)/2.080 (0.753–3.749) | 0.158 | 40 (7.8%)/6.710 (2.755–16.343) | |
| Pre-eclampsia | 3 (0.5%) | 32 (6.2%)/11.265 (3.397–37.353) | 45 (8.7%)/12.768 (3.886–42.070) | ||
| Oligohydramnios | 13 (2.2%) | 13 (2.5%)/1.162 (0.522–2.583) | 0.713 | 27 (5.2%)/2.145 (1.056–4.356), | 0.035 |
| Placental abruption | 1 (0.2%) | 1 (0.2%)/4.540 (0.482–42.760) | 0.186 | 2 (0.4%)/3.952 (0.421–37.083) | 0.186 |
| Preterm delivery | 19 (3.2%) | 60 (11.7%)/3.820 (2.222–6.567) | 77 (14.9%)/3.802 (2.226–6.494) | ||
| Preterm premature rupture of membranes | 7 (1.2%) | 4 (0.8%)/0.585 (0.162–2.114) | 0.413 | 2 (0.4%)/0.233 (0.043–1.271) | 0.092 |
| Gestational diabetes | 4 (0.7%) | 27 (5.2%)/8.502 (2.929–24.677) | 46 (8.9%)/14.246 (5.042–40.307) | ||
| Fetal growth restriction | 3 (0.5%) | 12 (2.3%)/4.700 (1.301–16.975) | 0.018 | 15 (2.9%)/4.991 (1.402–17.769) | 0.013 |
| Low birth weight |
15 (12.0%) | 40 (40.0%)/3.931 (2.155–7.173) | 60 (48.0%)/3.602 (1.979–6.558) | ||
| Macrosomia |
2 (1.8%) | 4 (23.5%)/2.697 (0.485–15.007) | 0.257 | 11 (64.7%)/5.459 (1.164–25.609) | 0.031 |
| 1st-minute Apgar |
3 (4.2%) | 26 (36.1%)/10.225 (3.053–34.243) | 43 (59.7%)/14.006 (4.261–46.041) | ||
| 5th-minute Apgar |
2 (0.3%) | 8 (1.6%)/5.129 (1.069–24.617) | 0.041 | 15 (2.9%)/5.449 (1.194–24.877) | 0.029 |
| Postpartum hemorrhage | 2 (0.3%) | 3 (0.6%)/2.171 (0.345–13.680) | 0.409 | 7 (1.4%)/5.139 (1.021–25.872) | 0.047 |
| Postpartum blood transfusion | 8 (1.4%) | 11 (2.1%)/1.490 (0.568–3.907) | 0.418 | 4 (0.8%)/0.463 (0.130–1.650) | 0.235 |
| Postpartum intravenous iron treatment | 57 (9.7%) | 28 (5.4%)/0.519 (0.316–0.852) | 0.009 | 2 (0.4%)/0.40 (0.10–0.168) | |
95% CI, 95% confidence interval; adjOR, adjusted odds ratio. *Adjusted models
controlled for parity, body mass index, history of miscarriage, pregestational
diabetes, chronic hypertension, and chronic disease. All patients under 35 years
on the anticipated expected date are included in the reference group. Bold values
indicate statistically significant results (p
The median gestational age at birth was 38.0 weeks (IQR: 2) in the
AMA was also significantly associated with pre-eclampsia (adjOR: 11.265, 95%
CI: 3.397–37.353; adjOR: 12.768, 95% CI: 3.886–42.070), GDM (adjOR: 8.502,
95% CI: 2.929–24.677; adjOR: 14.246, 95% CI: 5.042–40.307), and CS (adjOR:
22.271, 95% CI: 14.287–34.717; adjOR: 14.016, 95% CI: 9.035–21.745).
Additionally, AMA was significantly associated with gestational hypertension
(GHT) (adjOR: 6.710, 95% CI: 2.755–16.343), oligohydramnios (adjOR: 2.145, 95%
CI: 1.056–4.356), macrosomia (adjOR: 5.459, 95% CI: 1.164–25.609), and
postpartum hemorrhage (adjOR: 5.139, 95% CI: 1.021–25.872) in pregnant women
aged
The prevalence of women who delay childbirth for various reasons is increasing
worldwide. Therefore, the impact of the decision to postpone childbirth on
perinatal and maternal outcomes is becoming increasingly important since adverse
perinatal outcomes are becoming increasingly common in older patients [22]. Our
study found that AMA is associated with several adverse obstetric outcomes. There
was a significant difference in the gestational week at birth between the 20–34
and
Pregnancies at
Maternal age has been suggested as an independent predictor of GDM [21].
Similarly, a previous study found that the prevalence of GDM in women over 40
years of age was 12.5 times higher than in controls [23]. A recent study reported
that GDM was more common in both women aged over 35 and those over 40 years of
age [24]. Meanwhile, our study identified the 35–39 years and the
In a study conducted for pre-eclampsia, AMA was claimed to be a risk factor for pre-eclampsia, and it was reported that the risk of pre-eclampsia increased by 4.56 times compared to pregnancies in mothers under 35 years of age [25]. Similarly, another study reported that the risk of pre-eclampsia increased by 3.4 times in pregnancies over 40 years of age [24]. Our research found that the prevalence of pre-eclampsia was higher in both the 35–39 and the over 40 age groups.
In our study, FGR rates were statistically higher in the 35–39 years and
Our study presents some strengths and weaknesses. The main strength of our study is the sample size, which allows for multivariate data analysis. The limitations of our study include the fact that it is a retrospective study and that data from a single center reflect the outcomes of pregnancies in a limited geographic area. Furthermore, additional confounding factors such as smoking status and socioeconomic factors may also influence perinatal outcomes; the lack of availability of these data was another limitation. Randomized controlled trials involving multiple clinical centers are needed to clarify the importance of advanced age on maternal and fetal outcomes.
The prevalence of adverse prenatal outcomes increases significantly in women who become pregnant after the age of 35 years; however, these adverse outcomes are even more pronounced in women aged 40 years and over. The risks associated with AMA not only affect the course of labor but can also negatively impact the health of the fetus, the pregnancy, and the pregnant woman. We believe that close and careful prenatal monitoring of AMA pregnancies is extremely important to avoid such risks and minimize possible maternal and infant mortalities. This approach can increase the safety of the pregnancy and play a vital role in protecting the health of both mother and baby.
The datasets used and analyzed during the current study are available from the corresponding author on reasonable request.
Both authors contributed to the study conception and design. Material preparation, data collection and analysis were performed by OSG, and SKA. The first draft of the manuscript was written by OSG, SKA and both authors commented on previous versions of the manuscript. Both authors read and approved the final manuscript. Both authors have participated sufficiently in the work and agreed to be accountable for all aspects of the work.
All experimental procedures of this study were approved by the local Medical Ethics Committee of Sancaktepe Sehit Prof. Dr. Ilhan Varank Training and Research Hospital, department of Obstetrics and Gynecology, Istanbul, Turkey (E-46059653-050.04-259020152), which were in complete accordance with the ethical standards and regulations of human studies of the Helsinki declaration. Written informed consent was obtained from all participants.
Not applicable.
This research received no external funding.
The authors declare no conflict of interest.
References
Publisher’s Note: IMR Press stays neutral with regard to jurisdictional claims in published maps and institutional affiliations.