


 , Xu Chen 2,†, Shujun Ding 1,*
1 Department of Ultrasonography, Wuxi People’s Hospital Affiliated to Nanjing Medical University, 214023 Wuxi, Jiangsu, China
2 Department of Ultrasound, Affiliated Children’s Hospital of Jiangnan University (Wuxi Children’s Hospital), 214000 Wuxi, Jiangsu, China
†These authors contributed equally.
Abstract
This study aimed to develop a nomogram model integrating virtual touch tissue imaging quantification (VTIQ) with clinicopathological features to predict postoperative breast cancer recurrence, guide individualized treatment, and improve prognosis.
This study retrospectively included 420 female patients who underwent radical mastectomy for breast cancer and received an elastography touch imaging quantification examination before surgery at our hospital (2017–2022). The patients were divided into training and validation sets at a ratio of 7:3. After a 3-year follow-up, both cohorts were stratified into recurrence and non-recurrence groups. Clinicopathologic characteristics and VTIQ parameters (shear wave velocity, SWV) were compared between the two groups. A nomogram for predicting postoperative recurrence in breast cancer was developed using multivariable logistic regression. The performance was evaluated using a receiver operating characteristic (ROC) analysis, calibration assessment, and decision curve analysis (DCA) to assess discrimination, calibration, and clinical usefulness.
The training set showed significantly higher SWV values in recurrent patients than in non-recurrent patients (p < 0.05). Logistic regression identified histological grade (odds ratio (OR): 3.36, 95% confidence interval (CI): 1.23–9.19), calcification (OR: 3.16, 95% CI: 1.15–8.68), estrogen receptor (ER)/progesterone receptor (PR) (OR: 2.74, 95% CI: 1.03–7.31), and SWV (OR: 3.71, 95% CI: 1.75–7.84) as independent predictive factors for postoperative recurrence of breast cancer (p < 0.05). The area under the ROC curve (AUROC) was 0.789 (95% CI: 0.729–0.850) for the training set and 0.728 (95% CI: 0.615–0.841) for the validation set. These findings indicate that the nomogram model demonstrates good discrimination for the postoperative recurrence of breast cancer. Calibration and DCA curves confirmed that the predicted probabilities of the model closely matched the actual pathological grading results, demonstrating the clinical utility of the model.
The nomogram model integrating VTIQ parameters with clinicopathological features demonstrates good predictive value for postoperative recurrence of breast cancer. This model provides an important reference for identifying patients at high risk of recurrence before surgery and may improve patient prognosis.
Keywords
- VTIQ
- clinicopathological features
- breast cancer
- postoperative recurrence
- nomogram
Breast cancer remains a leading global malignancy in women, with persistently high incidence and mortality rates [1]. Although surgery is the mainstay of breast cancer treatment, postoperative recurrence remains a significant factor affecting patient prognosis, with approximately 20%–30% of patients experiencing local recurrence or distant metastasis within 5 years after surgery [2]. Current clinical practice mainly uses tumor size, nodal status, and histological grade to evaluate recurrence risk [3]. However, these conventional markers have important limitations. Their assessments are largely based on static morphological observations, which fail to dynamically reflect the biological behavior heterogeneity and micrometastatic potential of tumors. This can lead to overtreatment in some low-risk patients and undertreatment in high-risk patients [4, 5]. Therefore, the search for novel and more effective predictive markers and methods has become an important direction in current breast cancer research.
Ultrasound has become a commonly used modality for clinical evaluation of breast cancer, due to its advantages of being non-invasive, convenient, and repeatable. Two-dimensional grayscale ultrasound can clearly display the morphology, size, boundaries, and internal echogenicity of breast cancer, aiding in the identification of cystic or solid components within masses [6]. Color Doppler ultrasound, on the other hand, reflects tumor angiogenesis by detecting blood flow signals within and around the tumor [7]. However, in predicting postoperative recurrence of breast cancer, both modalities still have limitations in terms of specificity and sensitivity, making it difficult to accurately identify patients at higher risk of recurrence [8, 9]. Virtual touch tissue imaging quantification (VTIQ), as a novel ultrasound technique, is capable of non-invasively and real-time reflecting the stiffness characteristics of tumors by quantitatively measuring the shear wave velocity (SWV) [10]. It has currently become an important clinical tool for the evaluation of breast cancer [11]. Research shows the stiffness of tumor tissue is closely related to its invasiveness, proliferative capacity, and recurrence risk [10]. As the core parameter of VTIQ, SWV shows a significant positive correlation with histological grade and nuclear proliferationantigen-67 (Ki-67) index of breast cancer tissues, which are indicators of malignancy [12]. Moreover, its diagnostic performance is significantly superior to that of traditional ultrasound elastography scores [12]. Other studies have also shown that tumor stiffness is closely related to the extracellular matrix remodeling and stromal fibrosis, which are components of the pro-invasive microenvironment. Parameters of VTIQ (such as the maximum value of Young’s modulus) can serve as potential biomarkers for predicting lymph node metastasis and chemosensitivity [13, 14]. However, the existing studies have predominantly focused on the diagnostic value of VTIQ as a single modality, with a lack of research on the construction of multiparametric predictive models by integrating VTIQ with clinicopathological features.
This study aims to construct and validate a nomogram model combining VTIQ quantitative parameters (SWV) with clinicopathological features to predict postoperative recurrence of breast cancer. By integrating these parameters, we seek to provide a reference for accurately identifying patients at high risk of recurrence and metastasis, thereby optimizing treatment strategies and improving patient prognosis.
This study retrospectively included 420 female patients who underwent radical
mastectomy for breast cancer and received elastography touch imaging
quantification examination before surgery at our hospital (2017–2022). The
patients were divided into the training set and the validation set in a ratio of
7:3. After 3-year follow-up, both cohorts were stratified into recurrence and
non-recurrence groups by recurrence status. Inclusion criteria: the postoperative
pathological examination confirmed the diagnosis of breast cancer [15]; 18 years
In this study, nine independent variables are planned to be included. The total
sample size is set at 5–10 times the number of independent variables. Based on
clinical data from our hospital, the postoperative recurrence rate of breast
cancer is approximately 18%. Considering a potential sample loss of 10%–20%,
the required sample size was calculated using the formula: N = a
Baseline data for 420 breast cancer patients were retrospectively collected from the hospital’s electronic medical record system. The collected information encompassed age, body mass index (BMI), menopausal history, obstetric history, smoking history, drinking history and family history.
Clinical-pathological characteristics of 420 breast cancer patients were
collected, including alcohol consumption history, preoperative tumor quadrant,
tumor maximum diameter, location of the tumor, clinical stage, histological
grade, tumor shape, doppler flow signals, marginal characteristics,
calcification, vascular invasion, estrogen receptor (ER)/progesterone receptor
(PR), human epidermal growth factor 2 (HER2), Ki-67, and SWV. The status of ER
and PR was assessed using the Allred scoring system, with a score equal to or
greater than 2 considered positive. HER2 status was considered negative if it was
0 or +1, and positive if it was +++. Cases with a score of ++ required further
fluorescence in situ hybridization (FISH) testing. If gene amplification
was detected by FISH, the result was considered positive; otherwise, it was
considered negative. The Ki-67 index
A Siemens ACUSON OXANA2 ultrasound diagnostic system (Siemens AG, S/N 216293, Munich, Germany), equipped with a 9L4 linear array probe. During the examination, the examinee was positioned in a lateral or supine position with both arms abducted to fully expose the bilateral breasts and axillary regions. A systematic scanning was performed centered on the nipple. Patients held their breath during VTIQ examination. The transducer was carefully positioned on the skin surface without exerting extra pressure. The VTIQ mode was activated, and the largest cross-sectional area of the lesion was captured. Images were acquired three times, and the best-quality image (displayed in green) was selected for analysis. The same lesion was assessed three times by two experienced physicians, each with over 10 years of clinical experience. Three to four sampling points were obtained from the relatively harder and softer regions of the mass, respectively. The SWV was measured and recorded in m/s, with the maximum SWV value used as the quantitative parameter for assessment. During the examination, the physicians were blinded to the clinical information of the examinees. The inter-operator intraclass correlation coefficient (ICC) for SWV measurements was 0.945, indicating excellent agreement. All pathological diagnoses were confirmed by postoperative histopathological examination. The pathological examination results were determined through a joint consultation by two pathologists with over 10 years of experience in breast examination and pathology.
Analyses were performed using SPSS 27.0 (IBM Corporation, Armonk, NY, USA) and R
4.3.0 (Lucent Technologies, Murray Hill, NJ, USA). All variables to be assessed
were statistically described, and the presence of outliers and missing values was
analyzed. Missing values were imputed using multiple imputation, and variables
with missing data exceeding 20% were discarded. Continuous variables were
converted into binary or multicategorical variables as needed. For normally
distributed numerical variables with homogeneity of variance, data are presented
as mean
This study analyzed 294 breast cancer patients in the training set, of whom 53
experienced postoperative recurrence and 241 did not. In the validation set,
there were 126 breast cancer patients, with 23 experiencing postoperative
recurrence and 103 remaining recurrence-free. No significant differences existed
in age, BMI, menopausal history, obstetric history, smoking history, drinking
history and family history between recurrence and non-recurrence groups across
training and validation sets (p
| Indicators | Training set | Validation set | |||||||
| Recurrence group (n = 53) | Non-recurrence group (n = 241) | p | Recurrence group (n = 23) | Non-recurrence group (n = 103) | p | ||||
| Age ( |
56.93 |
56.82 |
0.079 | 0.937 | 56.23 |
56.16 |
0.026 | 0.979 | |
| BMI ( |
21.92 |
22.00 |
0.242 | 0.809 | 21.32 |
21.83 |
0.896 | 0.372 | |
| Menopausal history (n, %) | 0.320 | 0.572 | 0.013 | 0.910 | |||||
| Yes | 31 (58.49) | 151 (62.66) | 14 (60.87) | 64 (62.14) | |||||
| No | 22 (41.51) | 90 (37.34) | 9 (39.13) | 39 (37.86) | |||||
| Obstetric history (n, %) | 0.031 | 0.860 | 0.229 | 0.632 | |||||
| Yes | 43 (81.13) | 198 (82.16) | 18 (78.26) | 85 (82.52) | |||||
| No | 10 (18.87) | 43 (17.84) | 5 (21.74) | 18 (17.48) | |||||
| Smoking history (n, %) | 0.111 | 0.740 | 0.126 | 0.723 | |||||
| Yes | 2 (3.77) | 7 (2.90) | 1 (4.35) | 3 (2.91) | |||||
| No | 51 (96.23) | 234 (97.10) | 22 (95.65) | 100 (97.09) | |||||
| Drinking history (n, %) | 0.038 | 0.845 | 0.049 | 0.826 | |||||
| Yes | 8 (15.09) | 39 (16.18) | 4 (17.39) | 16 (15.53) | |||||
| No | 45 (84.91) | 202 (83.82) | 19 (82.61) | 87 (84.47) | |||||
| Family history (n, %) | 0.062 | 0.803 | 0.064 | 0.801 | |||||
| Yes | 11 (18.87) | 42 (17.43) | 5 (21.74) | 20 (19.42) | |||||
| No | 42 (81.13) | 199 (82.57) | 18 (78.26) | 83 (80.58) | |||||
BMI, body mass index.
In the training set, the pathological images of patients in the recurrence group showed that the cancerous tissue exhibited glandular or cord-like structures, with nuclei that were deeply stained and showed evident pleomorphism and mitotic figures, and obvious proliferation of surrounding fibrous tissue (Fig. 1A). In contrast, the pathological results of patients in the non-recurrence group revealed that the atypical cells within the mass were arranged in irregular nests (Fig. 1B).
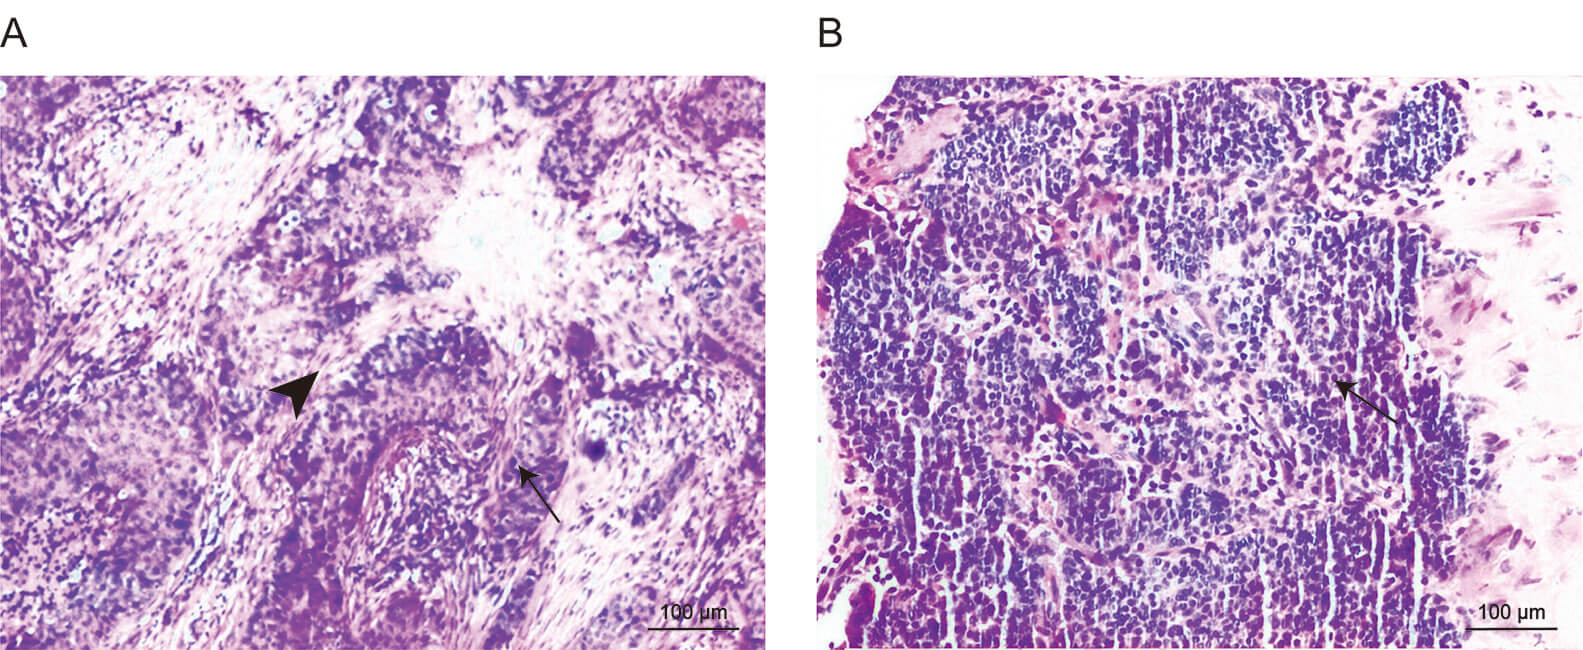 Fig. 1.
Pathological examination results of the two groups of patients
(100
The recurrence group had a higher proportion of patients with tumor maximum
diameter
| Indicators | Recurrence group (n = 53) | Non-recurrence group (n = 241) | p | ||
| Preoperative tumor quadrant | 0.243 | 0.993 | |||
| Outer upper | 14 (26.41) | 68 (28.22) | |||
| Outer lower | 7 (13.21) | 32 (13.28) | |||
| Inner upper | 15 (28.30) | 71 (29.46) | |||
| Inner lower | 13 (24.53) | 55 (22.82) | |||
| Central area | 4 (7.55) | 15 (6.22) | |||
| Tumor maximum diameter | 7.313 | 0.007 | |||
| 35 (66.04) | 199 (82.57) | ||||
| 18 (33.96) | 42 (17.43) | ||||
| Location of the tumor | 0.968 | 0.325 | |||
| Left | 22 (41.51) | 118 (48.96) | |||
| Right | 31 (58.49) | 123 (51.04) | |||
| Clinical stage | 4.353 | 0.037 | |||
| I–II | 36 (67.92) | 195 (80.91) | |||
| III | 17 (32.08) | 46 (19.09) | |||
| Histological grade | 16.164 | ||||
| I–II | 25 (47.17) | 181 (75.10) | |||
| III | 28 (52.83) | 60 (24.90) | |||
| Tumor shape | 6.196 | 0.013 | |||
| Regular | 28 (52.83) | 170 (70.54) | |||
| Irregular | 25 (47.17) | 71 (29.46) | |||
| Doppler flow signals | 0.672 | 0.412 | |||
| Rich blood flow | 23 (43.40) | 90 (37.34) | |||
| Poor blood flow | 30 (56.60) | 151 (62.66) | |||
| Marginal characteristics | 0.041 | 0.840 | |||
| Distinct | 25 (47.17) | 110 (45.64) | |||
| Indistinct | 28 (52.83) | 131 (54.36) | |||
| Calcification | 17.266 | ||||
| Yes | 14 (26.42) | 17 (7.05) | |||
| No | 39 (73.58) | 224 (92.95) | |||
| Vascular invasion | 8.635 | 0.003 | |||
| Yes | 17 (32.08) | 36 (14.94) | |||
| No | 36 (67.92) | 205 (85.06) | |||
| ER/PR | 24.543 | ||||
| All negative | 35 (66.04) | 72 (29.88) | |||
| Positive in any one | 18 (33.96) | 169 (70.12) | |||
| HER2 | 11.404 | ||||
| Positive | 31 (58.49) | 81 (33.61) | |||
| Negative | 22 (41.51) | 160 (66.39) | |||
| Ki-67 | 1.714 | 0.190 | |||
| High expression | 37 (69.81) | 145 (60.17) | |||
| Low expression | 16 (30.19) | 96 (39.83) | |||
ER, estrogen receptor; PR, progesterone receptor; HER2, human epidermal growth factor 2; Ki-67, nuclear proliferationantigen-67.
SWV measurements were significantly elevated in the recurrence versus
non-recurrence group (p
| Indicators | Recurrence group (n = 53) | Non-recurrence group (n = 241) | t | p |
| SWV ( |
7.33 |
4.06 |
8.840 |
VTIQ, virtual touch tissue imaging quantification; SWV, shear wave velocity.
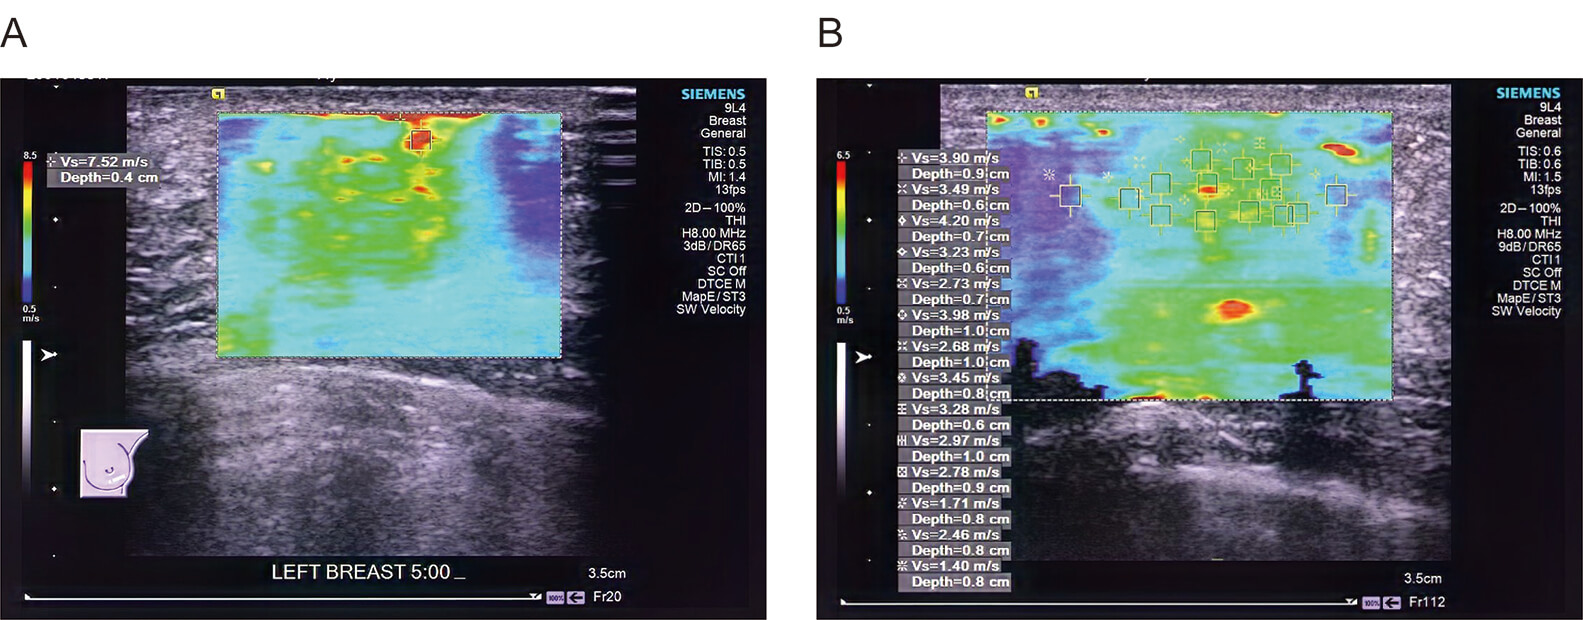 Fig. 2.
Preoperative VTIQ quantitative images of patients with and without postoperative recurrence. (A) The preoperative VTIQ of patients in the recurrence group shows the SWV of the tumor at 7.52 m/s. (B) The preoperative VTIQ of patients in the non-recurrence group shows the SWV of the tumor at 3.90 m/s.
Logistic regression assessed postoperative recurrence using tumor maximum diameter, clinical stage, histological grade, tumor shape, calcification, vascular invasion, ER/PR, HER2, and SWV as predictors. The results showed that histological grade (odds ratio (OR): 3.36, 95% confidence interval (CI): 1.23–9.19), calcification (OR: 3.16, 95% CI: 1.15–8.68), ER/PR (OR: 2.74, 95% CI: 1.03–7.31), and SWV (OR: 3.71, 95% CI: 1.75–7.84) were all independent influencing factors for predicting postoperative recurrence of breast cancer. In this study, the variance inflation factor (VIF) values were all less than 5, indicating the absence of multicollinearity. See Table 4.
| Variables | S.E | Z | p | OR (95% CI) | Tolerance | VIF | ||
| Tumor maximum diameter | ||||||||
| 1.00 (Reference) | ||||||||
| 0.42 | 0.41 | 1.025 | 0.305 | 1.52 (0.68–3.41) | 0.809 | 1.236 | ||
| Clinical stage | ||||||||
| I–II | 1.00 (Reference) | |||||||
| III | –0.24 | 0.44 | –0.551 | 0.582 | 0.78 (0.33–1.86) | 0.596 | 1.679 | |
| Histological grade | ||||||||
| I–II | 1.00 (Reference) | |||||||
| III | 1.21 | 0.51 | 2.358 | 0.018 | 3.36 (1.23–9.19) | 0.405 | 2.469 | |
| Tumor shape | ||||||||
| Regular | 1.00 (Reference) | |||||||
| Irregular | –0.67 | 0.52 | –1.284 | 0.199 | 0.51 (0.19–1.42) | 0.343 | 2.918 | |
| Calcification | ||||||||
| No | 1.00 (Reference) | |||||||
| Yes | 1.15 | 0.52 | 2.232 | 0.026 | 3.16 (1.15–8.68) | 0.710 | 1.409 | |
| Vascular invasion | ||||||||
| No | 1.00 (Reference) | |||||||
| Yes | 0.06 | 0.45 | 0.139 | 0.889 | 1.06 (0.44–2.57) | 0.667 | 1.499 | |
| ER/PR | ||||||||
| Positive in any one | 1.00 (Reference) | |||||||
| All negative | 1.01 | 0.50 | 2.019 | 0.044 | 2.74 (1.03–7.31) | 0.410 | 2.437 | |
| HER2 | ||||||||
| Negative | 1.00 (Reference) | |||||||
| Positive | –0.40 | 0.56 | –0.722 | 0.471 | 0.67 (0.22–1.99) | 0.287 | 3.486 | |
| SWV | ||||||||
| 1.00 (Reference) | ||||||||
| 1.31 | 0.38 | 3.430 | 3.71 (1.75–7.84) | 0.783 | 1.277 | |||
S.E, standard error; VIF, variance inflation factor; OR, odds ratio; CI, confidence interval.
Based on logistic regression findings, we developed a postoperative recurrence nomogram. The nomogram identified histological grade and ER/PR as the strongest predictors of postoperative breast cancer recurrence, followed by SWV and calcification. The total score ranges from 0 to 350 points, corresponding to predicted probabilities of postoperative breast cancer recurrence between 0.1 and 0.7. See Fig. 3.
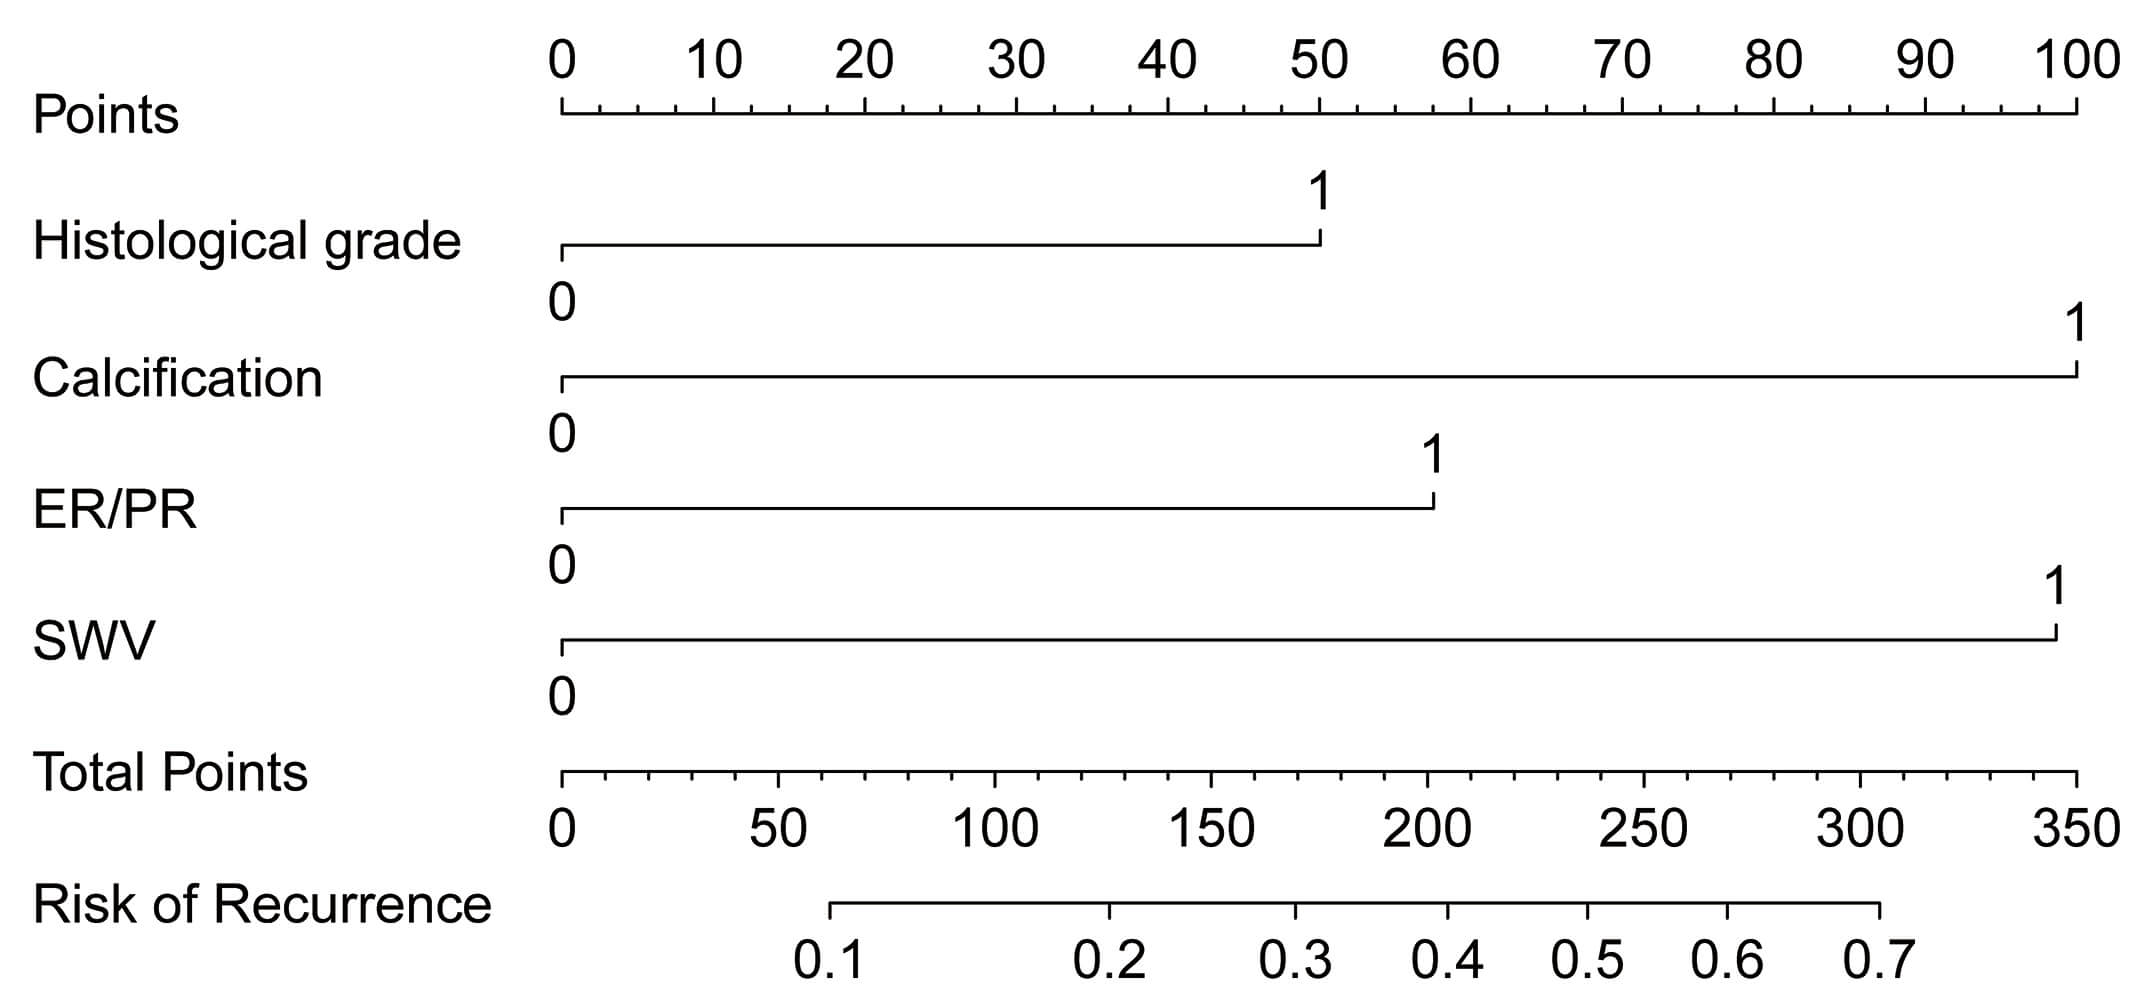 Fig. 3.
Nomogram model for predicting postoperative recurrence in breast cancer.
The nomogram demonstrated good predictive accuracy with training set area under the curve (AUC) = 0.789 (95% CI: 0.729–0.850) and validation set AUC = 0.728 (95% CI: 0.615–0.841). See Fig. 4A,B. Calibration curves indicated strong agreement between nomogram-predicted and observed recurrence probabilities in both training and validation sets, with a slope of 1, indicating good model calibration. See Fig. 4C,D. The DCA showed that the decision curves for predicting postoperative recurrence of breast cancer by the nomogram model in between the training and validation sets were located in the upper right of the graph. When the probability threshold of the nomogram ranged from 1% to 60%, the model yielded high net clinical benefit in predicting lymph-node metastasis in both cohorts, indicating its potential clinical utility. See Fig. 4E,F.
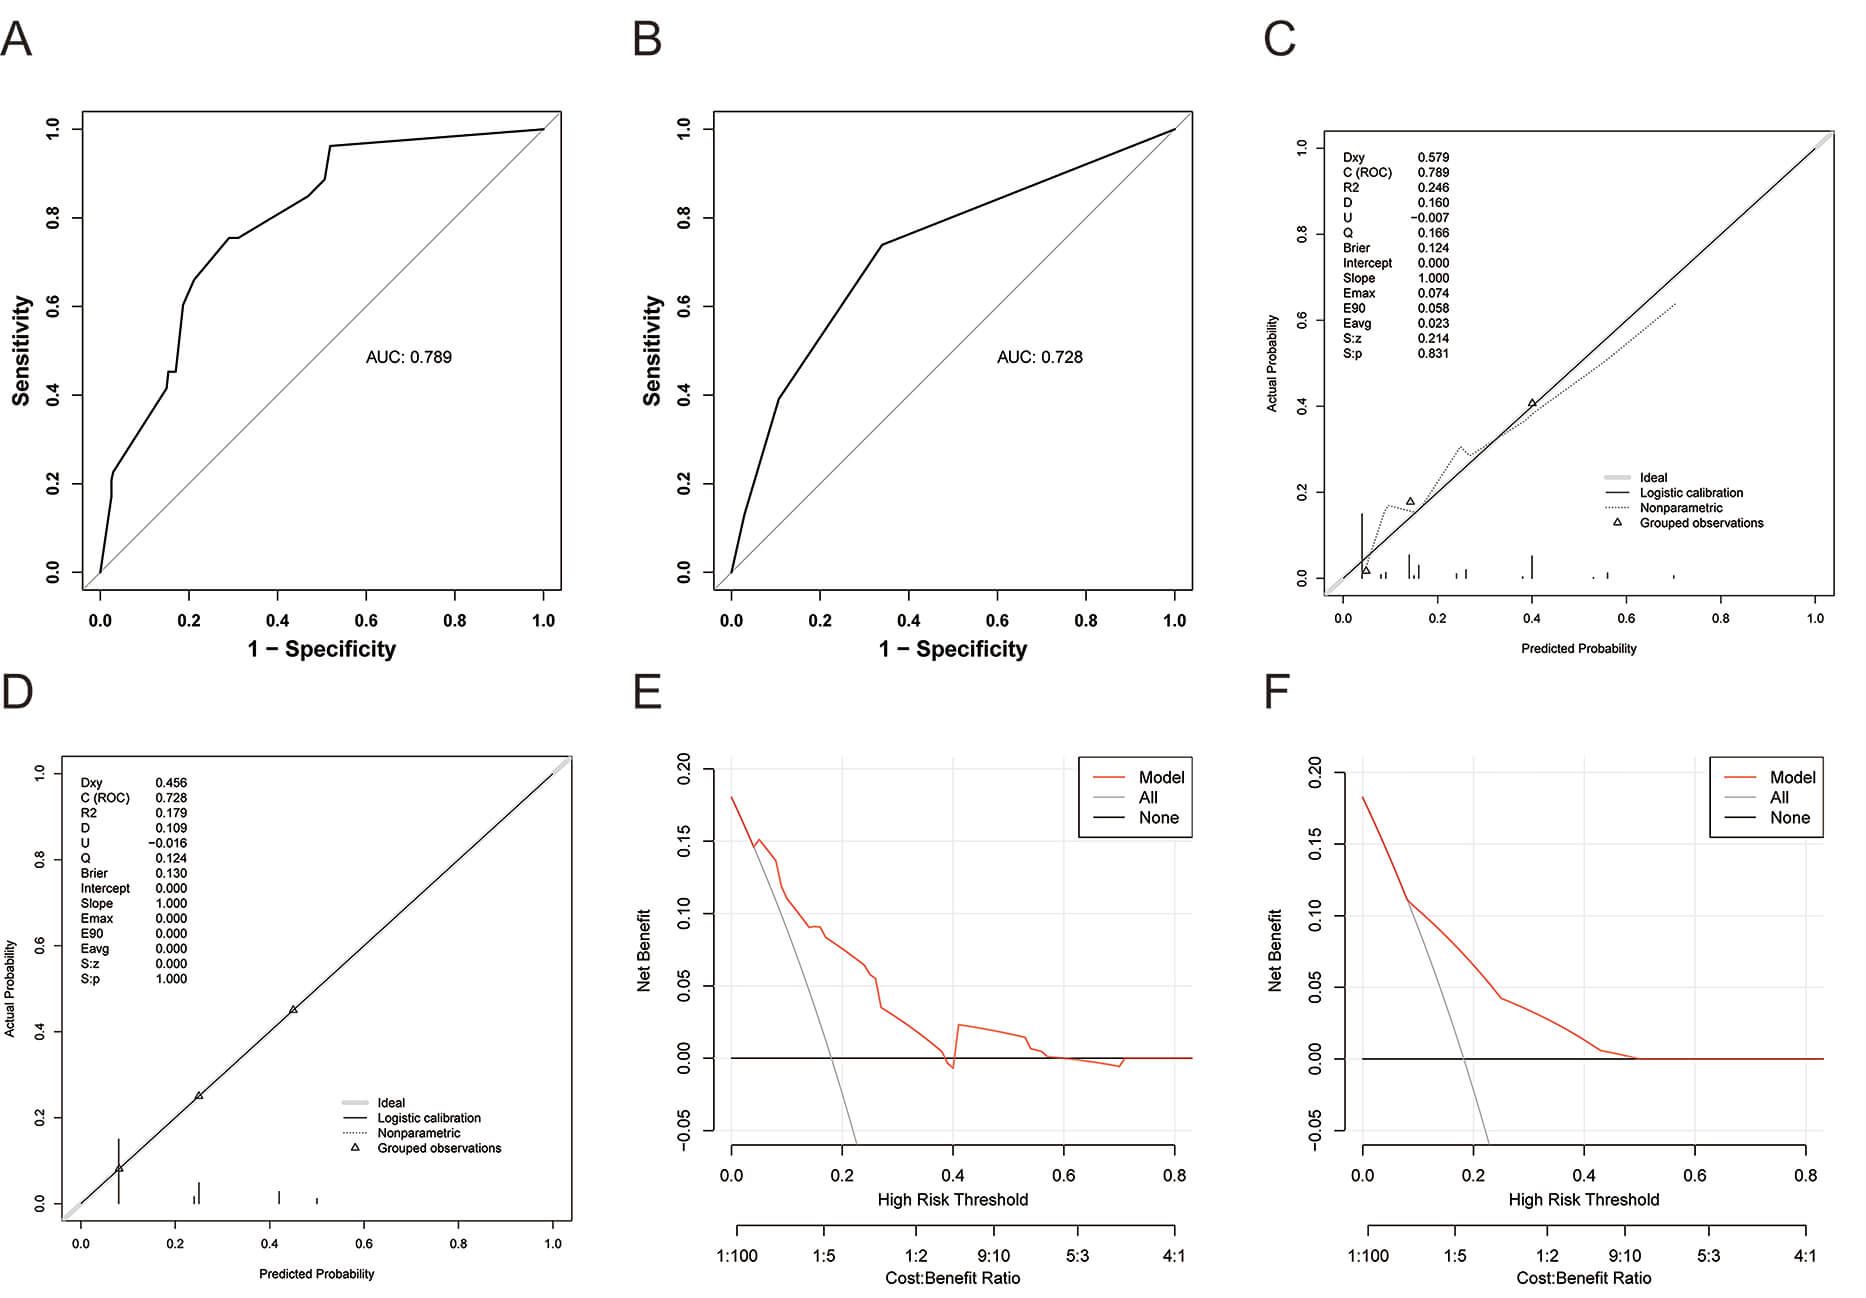 Fig. 4.
Validation of nomogram model for predicting postoperative recurrence in breast cancer. (A) The receiver operating characteristic (ROC) curve for predicting postoperative recurrence of breast cancer in the training set using the nomogram model. (B) The ROC curve for predicting postoperative recurrence of breast cancer in the validation set using the nomogram model. (C) The calibration curve for predicting postoperative recurrence of breast cancer in the training set using the nomogram model. (D) The calibration curve for predicting postoperative recurrence of breast cancer in the validation set using the nomogram model. (E) The decision curve analysis (DCA) curve for predicting postoperative recurrence of breast cancer in the training set using the nomogram model. (F) The DCA curve for predicting postoperative recurrence of breast cancer in the validation set using the nomogram model.
Breast cancer recurrence, characterized by its high incidence, unpredictability,
and severe threat to quality of life, has emerged as a significant challenge in
clinical oncology, imposing a substantial economic and psychological burden on
patients and their families [17, 18]. This research effectively developed and
validated a nomogram incorporating VTIQ parameters (SWV) and essential
clinical-pathological characteristics to forecast the recurrence risk in breast
cancer patients post-radical surgery. The study results confirmed that SWV
values, as well as histological grade, calcification, and ER/PR status, are
independent predictors of postoperative recurrence in breast cancer. The nomogram
indicated robust predictive capability (AUC
In this study, we analyzed 294 breast cancer patients in the training set, among
whom 53 experienced recurrence and 241 did not. In the validation set, there were
126 breast cancer patients, with 23 experiencing recurrence and 103 remaining
recurrence-free. Between the training and validation sets, no statistically
significant differences were observed between the recurrence and non-recurrence
groups regarding age, BMI, menopausal history, obstetric history, smoking
history, drinking history and family history (p
The influencing factors of postoperative recurrence in breast cancer are
complex, with extratumoral factors including lifestyle behaviors, endocrine
function, tumor grade, molecular subtypes, and histological grade [19, 20]. In
this study, univariate analysis showed that patients in the recurrence group had
a higher proportion of tumor maximum diameter
In this study, multivariate analysis was used to identify the most predictive independent factors (histological grade, calcification, ER/PR status, and SWV), based on which a nomogram prediction model was constructed and externally validated. The AUC values for the training and validation sets were 0.789 (95% CI: 0.729–0.850) and 0.728 (95% CI: 0.615–0.841), respectively. These results suggest that the model possesses strong discriminative power, effectively differentiating patients with a high risk of recurrence from those with a low risk. The calibration curves revealed a close match between the predicted probabilities and the actual recurrence probabilities, highlighting the model’s accuracy and reliability. DCA further demonstrated that the model has certain clinical utility. The strengths of this study lie in the integration of traditional clinicopathological features with VTIQ. As a non-invasive imaging technique, VTIQ provides quantitative information on tissue stiffness, thereby complementing the limitations of traditional pathological examinations. Moreover, the independent predictive factors identified through logistic regression analysis further enhanced the accuracy and reliability of the model. In clinical practice, patients identified as high-risk should be offered intensified surveillance and considered for more aggressive adjuvant therapy to maximize the chance of preventing recurrence.
There are also several limitations in this study that need to be considered. Firstly, the retrospective study design may be affected by selection bias and information bias. Secondly, the relatively short follow-up period of 3 years may not fully reflect the long-term recurrence pattern, and postoperative adjuvant therapy was not included in the analysis. Future studies should focus on conducting prospective research and consider the impact of postoperative treatment by conducting longer follow-up to further verify the predictive efficacy of this model. Moreover, although the overall sample size (n = 420) is moderate, the number of events (recurrences, n = 76) remains limited. This low event-to-variable ratio may compromise model stability and generalizability and increase the risk of over-fitting. To address this limitation, we performed both internal and external validation together with calibration analyses; the results confirm that the model maintains consistent performance and has practical clinical value.
This study successfully developed and preliminarily validated a nomogram model integrating VTIQ with clinicopathological features to assess the risk of postoperative recurrence in breast cancer patients. The model showed strong predictive accuracy, calibration, and clinical applicability, offering valuable prognostic stratification for postoperative recurrence risk.
Data supporting this study are available from the corresponding author upon reasonable request.
SD: Conceptualization, validation, data curation, writing—review and editing. CZ: Conceptualization, methodology, software, formal analysis, investigation, writing—original draft preparation. XC: Investigation, data curation, writing—review and editing. All authors read and approved the final manuscript. All authors have participated sufficiently in the work and agreed to be accountable for all aspects of the work.
The study was approved by the ethics committee of Wuxi People’s Hospital Affiliated to Nanjing Medical University (Ethics Approval Number: KY23040), and written informed consent was obtained from all patients. All procedures complied with institutional ethics guidelines and the Declaration of Helsinki.
Not applicable.
This research received no external funding.
The authors declare no conflict of interest.
References
Publisher’s Note: IMR Press stays neutral with regard to jurisdictional claims in published maps and institutional affiliations.