


 , Sijie Mo 2, Zhibin Huang 2, Xiaohan Zou 2, Hongtian Tian 2, Huaiyu Wu 2, Shuzhen Tang 2, Mengyun Wang 2, Jinfeng Xu 1,2, Chenyao Xu 3, Fajin Dong 1,2,*
 , Liping Mao 3,*
1 Department of Ultrasound, The First Affiliated Hospital, Southern University of Science and Technology, Shenzhen People’s Hospital, 518020 Shenzhen, Guangdong, China
2 Department of Ultrasound, Shenzhen People’s Hospital, The Second Clinical Medical College, Jinan University, 518020 Shenzhen, Guangdong, China
3 Department of Ultrasonography, Luoyang Maternal and Child Health Hospital, 471000 Luoyang, Henan, China
Abstract
Breast cancer (BC) is a major global malignancy with rising incidence. The lack of effective traditional anti-human epidermal growth factor receptor 2 (HER2) therapies for HER2-low BC underscores the critical need to identify this subtype early. Dynamic contrast-enhanced magnetic resonance imaging (DCE-MRI) radiomics can help to differentiate between HER2-low and HER2-zero BC, although this method has limited contrast and access. Ultrasound (US) is a cost-effective technique, although radiomics research remains limited, and traditional radiomics largely ignores peritumoral value. This study aimed to determine whether intra- and peritumoral radiomic features observed by grayscale US can differentiate between HER2-low and HER2-zero BC.
This retrospective diagnostic study enrolled 209 consecutive BC cases from May 2022 to January 2024. These cases were categorized as HER2-low (immunohistochemistry (IHC) 1+/2+, no erythroblastic leukemia viral oncogene homolog 2 (ERBB2) fluorescence in situ hybridization (FISH) amplification, n = 129) or HER2-zero (IHC 0, n = 80). Patients were age-matched and randomly assigned (block size = 10) to the training (n = 155) and validation (n = 54) cohorts, with predefined exclusion criteria applied (e.g., missing pathological data, poor US quality). After calibration, two experienced radiologists performed blinded manual intratumoral region-of-interest (ROI) segmentation (ITK-SNAP v3.8.0), with interoperator consistency confirmed by immunocytochemistry (ICC) >0.75. Pyradiomics was used to automate the expansion of the 1 mm and 2 mm peritumoral regions, feature extraction, and z-score normalization. Features were filtered via Spearman’s correlation, Mann-Whitney U test, and least absolute shrinkage and selection operator (LASSO) regression (10-fold cross-validation for optimal λ). A predictive model for HER2 status was built using LASSO regression (variance inflation factor (VIF) <1.2 to avoid multicollinearity), and the performance of this model was evaluated for accuracy, sensitivity, specificity, receiver operating characteristic (ROC) curves (area under the curve, AUC), calibration curves (Hosmer-Lemeshow test), and decision curve analysis (DCA). A radiomic nomogram integrating radiomic and clinical signatures was evaluated in the validation cohort. Statistical analyses were performed using R v4.2.2 (two-sided p < 0.05 for significance).
The clinical model showed limited discrimination in the test set (AUC = 0.594). A total of 3320 radiomic features were extracted from intratumoral, as well as 1 mm and 2 mm peritumoral regions, with the selection of 30, 19, and 24 features, respectively, via LASSO regression. The intratumoral-only model had AUCs of 0.730 (training) and 0.649 (test), while the intratumoral + 1 mm peritumoral model exhibited enhanced performance (training AUC = 0.852; test AUC = 0.868). The 2 mm peritumoral-integrated model demonstrated a high AUC in the training set (0.918), but poor performance in the test set (AUC = 0.509). A combined model (intratumoral + 1 mm peritumoral features + clinical factors) was used to generate a nomogram (no multicollinearity, VIF: 1.039–1.179) with AUCs of 0.882 (training) and 0.835 (test). The DCA confirmed the clinical utility of the combined model, although the diagnostic performance of the model was slightly lower than that of the intratumoral + 1 mm peritumoral model.
Combining 1 mm peritumoral radiomics with intratumoral and clinical data improves the discrimination of HER2-low from HER2-zero BC (AUC = 0.882), thus reducing the need for biopsy and assisting with therapy planning. Optimizing peritumoral margins enhances diagnostic accuracy, thereby validating radiomics for BC subtyping.
Keywords
- breast cancer
- HER2
- radiomics
- ultrasound
Breast cancer (BC) is the predominant malignancy in the female population globally, and remains the most frequent cause of cancer-related death among women [1]. BC has considerable negative effects on quality of life and survival, accounting globally for approximately 43.8 million cases within a 5-year prevalence period [2]. Epidemiologic data from 2024 show sustained increases in BC incidence rates across demographic strata [3]. Human epidermal growth factor receptor 2 (HER2)-overexpression is observed in 15% of invasive BCs and correlates with increased metastatic propensity and adverse prognostic trajectories [4]. Current translational research in precision oncology has redefined therapeutic paradigms for HER2-driven malignancies, resulting in significant survival benefits from targeted treatment [5]. HER2 signaling not only drives BC progression, but also crosstalks with estrogen receptor pathways, thereby influencing treatment resistance and metastatic potential [6].
Recent oncopathologic consensus defines the HER2-low phenotypic subset as tumors which demonstrate an immunohistochemical (IHC) staining intensity for HER2 of 1+ or 2+, with concomitant absence of erythroblastic leukemia viral oncogene homolog 2 (ERBB2) gene amplification as detected by fluorescent in situ hybridization (FISH) [7, 8]. The physiological interplay between the mammary gland and the female reproductive system underscores the shared risk factors and pathogenic mechanisms between BC (including HER2-low subtypes) and gynecologic cancers. Recent studies have demonstrated that genetic susceptibility (e.g., breast cancer antigen (BRCA) mutations), hormonal dysregulation, and lifestyle factors (e.g., obesity, smoking) contribute to BC pathogenesis and even to secondary primary malignancies [9]. Studies have also shown that traditional anti-HER2 treatment modalities are not effective in the treatment of HER2-low BC [2]. However, clinical data indicate that antibody-drug conjugates such as trastuzumab deruxtecan and trastuzumab duocarmazine might confer benefits to patients with low HER2 expression. Indeed, trastuzumab deruxtecan has demonstrated efficacy in HER2-low BC [10], thus expanding the scope of treatment beyond traditional HER2-positive tumors [10, 11, 12]. Therefore, identifying HER2-low status at an early stage during BC disease progression is of paramount importance for customizing treatment strategies, particularly in the case of therapy-resistant, hormone receptor-negative tumors [13, 14].
Although ultrasound (US) is sensitive for the detection of BC [15], the ability to differentiate between HER2-low and HER2-zero expression continues to pose a significant challenge. Dynamic contrast-enhanced magnetic resonance imaging (DCE-MRI) radiomics has been used to help distinguish between these two BC subtypes [16]. Although Bian et al. [17] reported an MRI-based radiomics framework for this differentiation, their methodology is constrained by the need for contrast-enhanced protocols and specialized imaging facilities. Moreover, reliance on core needle biopsies as the principal means for ascertaining HER2 status has proven inadequate, with an approximately 20% rate of misdiagnosis in cases of HER2-low BC [18]. As a primary modality for BC screening, US offers distinct advantages of widespread accessibility and cost-effectiveness compared to MRI. However, despite its clinical significance, there is only limited research on the correlation between US radiomics features and HER2 expression status (HER2-zero vs. HER2-low), with few studies having systematically explored this potential association.
Traditional radiomics analysis has predominantly focused on intratumoral characteristics, largely neglecting the diagnostic potential of peritumoral regions. However, given the heterogeneous invasion patterns observed across different tumor types, where peritumoral areas serve as the primary pathway for tumor infiltration, these regions may provide critical complementary information for tumor diagnosis and characterization [19]. Furthermore, the use of US intratumoral and peritumoral radiomics to differentiate between HER2-low and HER2-zero BC has yet to be reported. The aim of this study was therefore to evaluate the utility of intratumoral and peritumoral radiomic signatures generated by grayscale US in differentiating HER2-low BC from HER2-zero BC.
The study protocol was approved by the Institutional Review Board of Shenzhen People’s Hospital (ethical clearance number: LL-KY-2022479-02) and was conducted in accordance with the principles of the Declaration of Helsinki. All participants provided written informed consent for the use of their clinical and imaging data prior to inclusion in this retrospective study. The study design, execution, and reporting adhered to the rigorous standards of the standards for reporting diagnostic accuracy studies (STARD) guidelines [20] for research into diagnostic accuracy, thereby ensuring transparency, reproducibility, and ethical integrity throughout the investigation.
This retrospective diagnostic study was conducted from May 2022 to January 2024
and enrolled consecutive BC patients (n = 209) who met pre-defined HER2 status
criteria. HER2-low (n = 129) was defined as IHC 1+/2+ with no FISH amplification
of ERBB2, while
HER2-zero (n = 80) was defined as IHC 0, as per the 2018 ASCO/CAP guidelines [21]. The
cohort was stratified into training (n = 155) and validation (n = 54) subsets
through computer-generated block randomization (block size = 10), with mean ages
of 52.97
The exclusion criteria were: (1) lack of postoperative pathological data; (2) poor-quality US images; (3) presence of tumor other than BC; (4) BC patients who had received radiotherapy or neoadjuvant chemotherapy within the previous three months; (5) patients with psychiatric disorders that hindered cooperation during clinical examinations; and (6) BC patients with open skin ulcers on the breasts. A flowchart depicting the patient inclusion process is shown in Fig. 1, while Fig. 2 presents a workflow diagram outlining the steps involved in constructing the radiomics model.
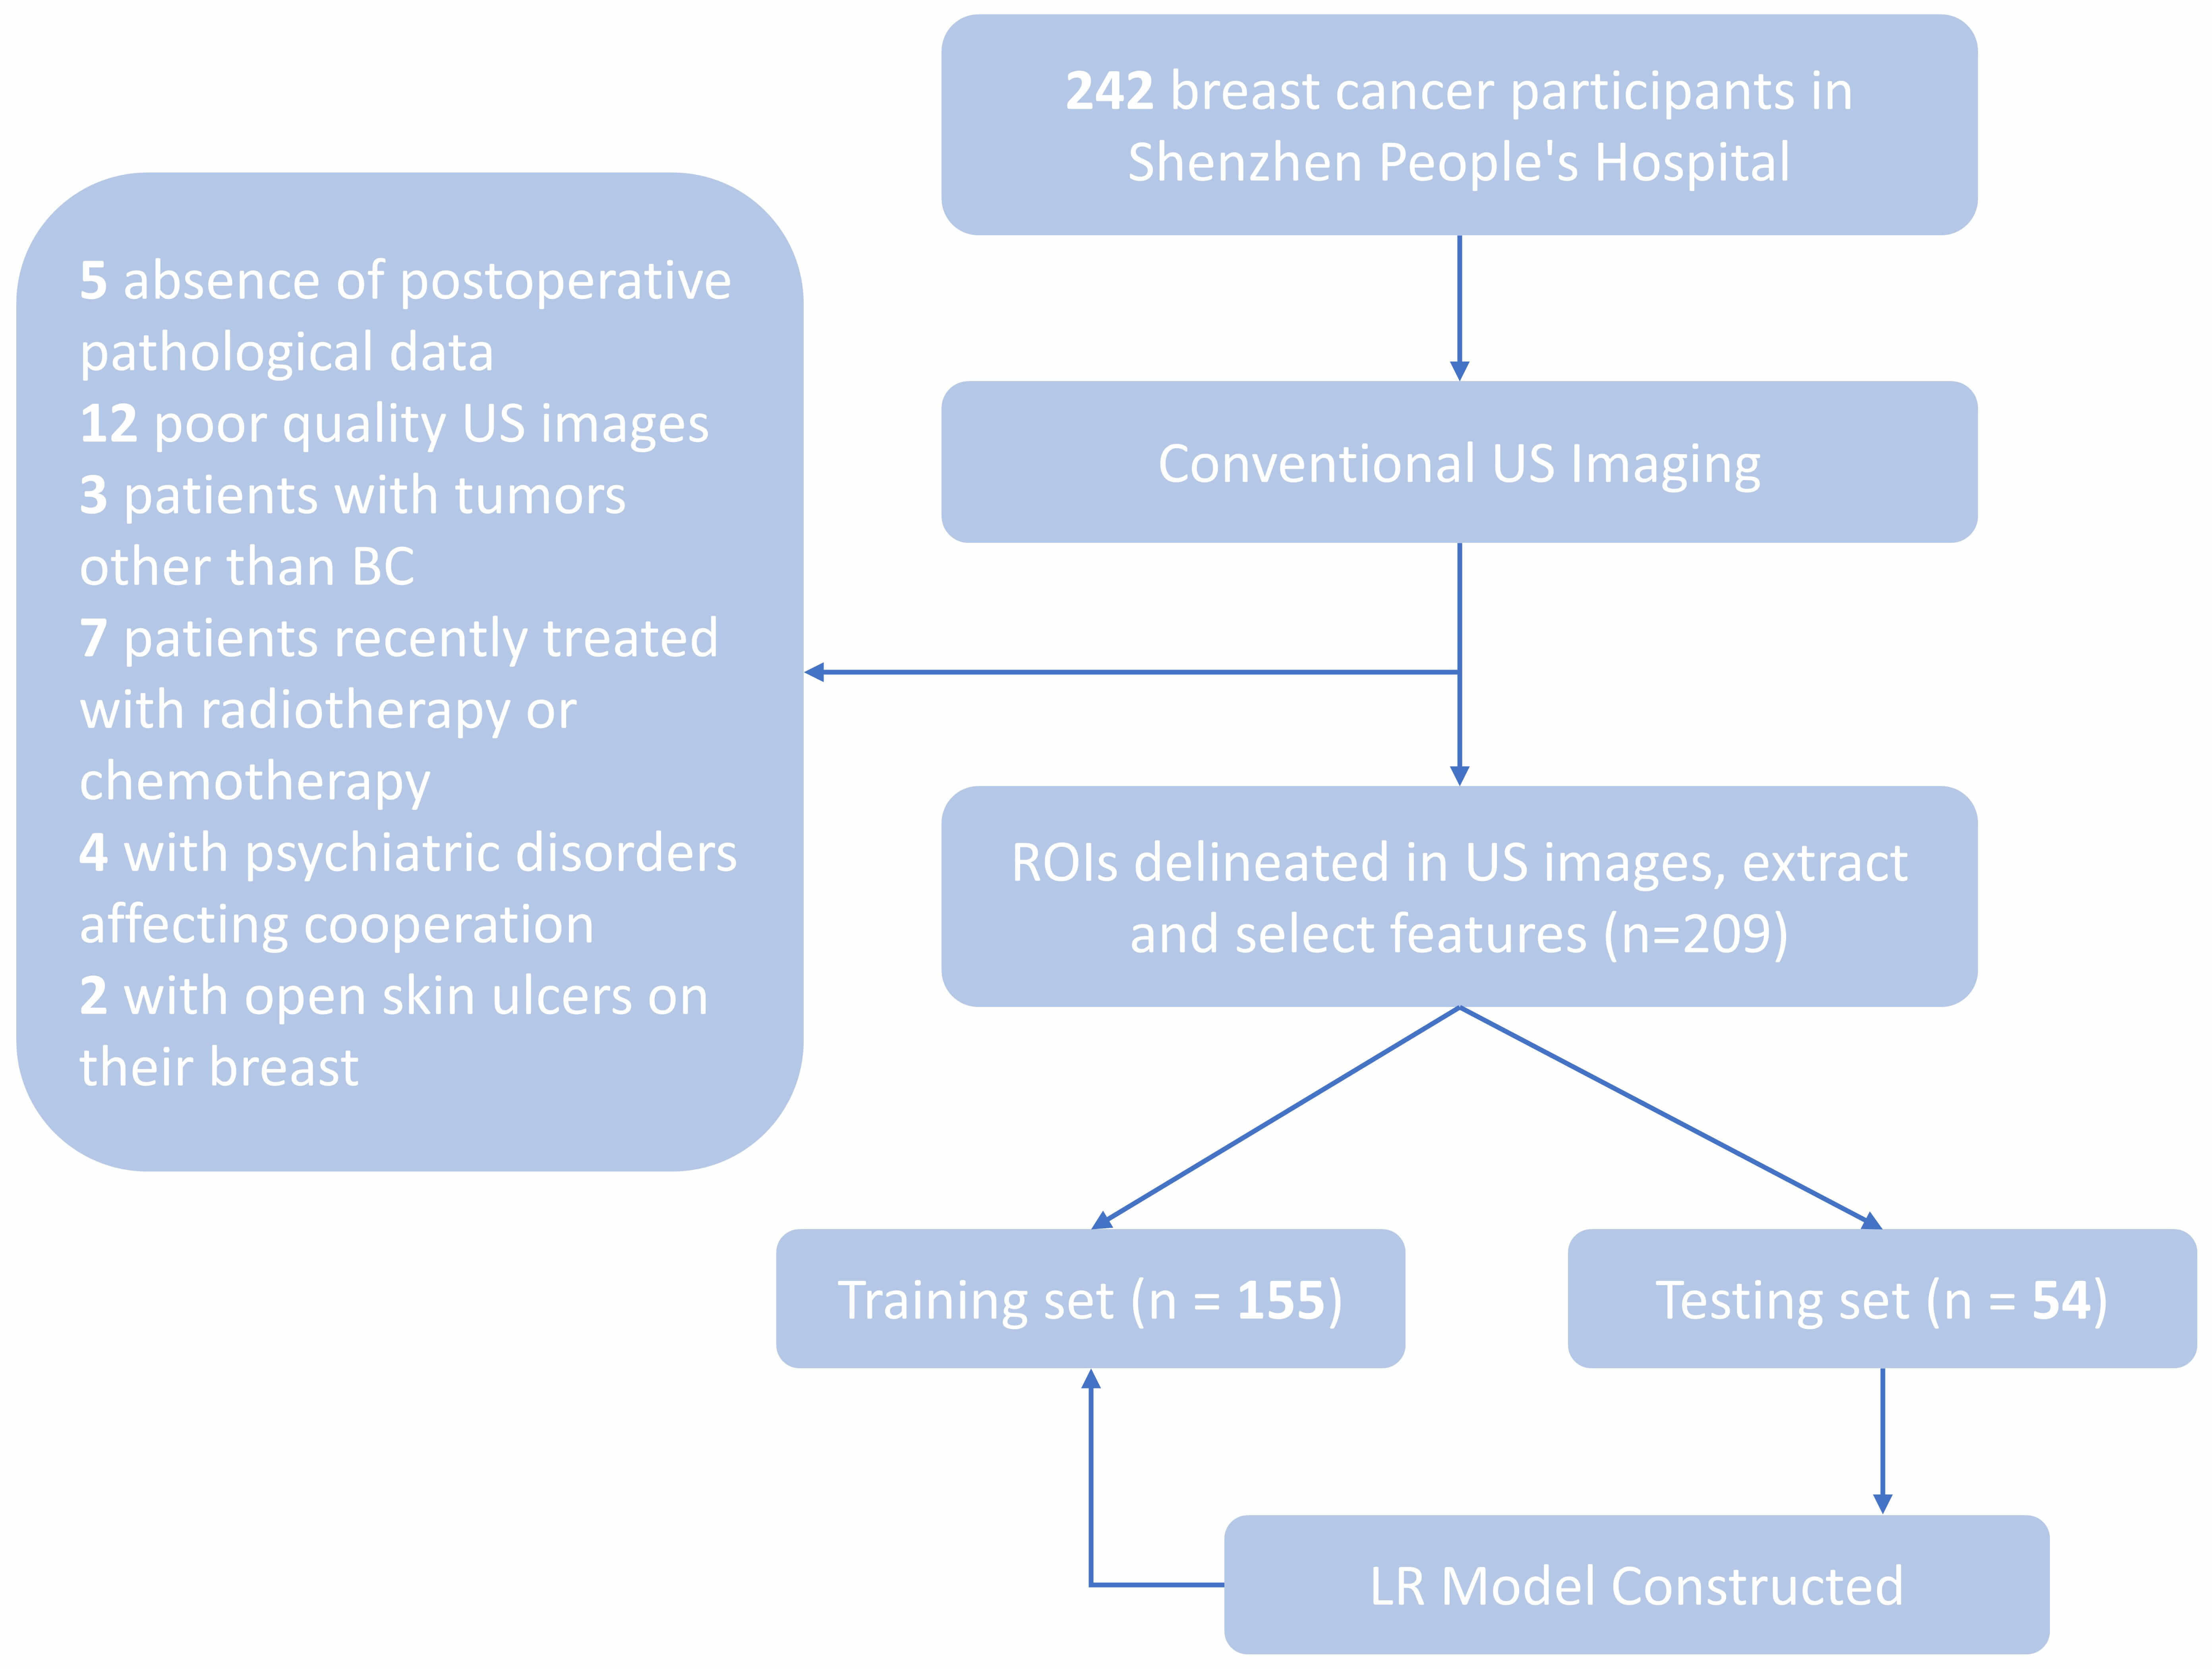 Fig. 1.
Flowchart showing inclusion and exclusion criteria. US, Ultrasound; BC, Breast cancer; ROI, region of interest; LR, logistic regression.
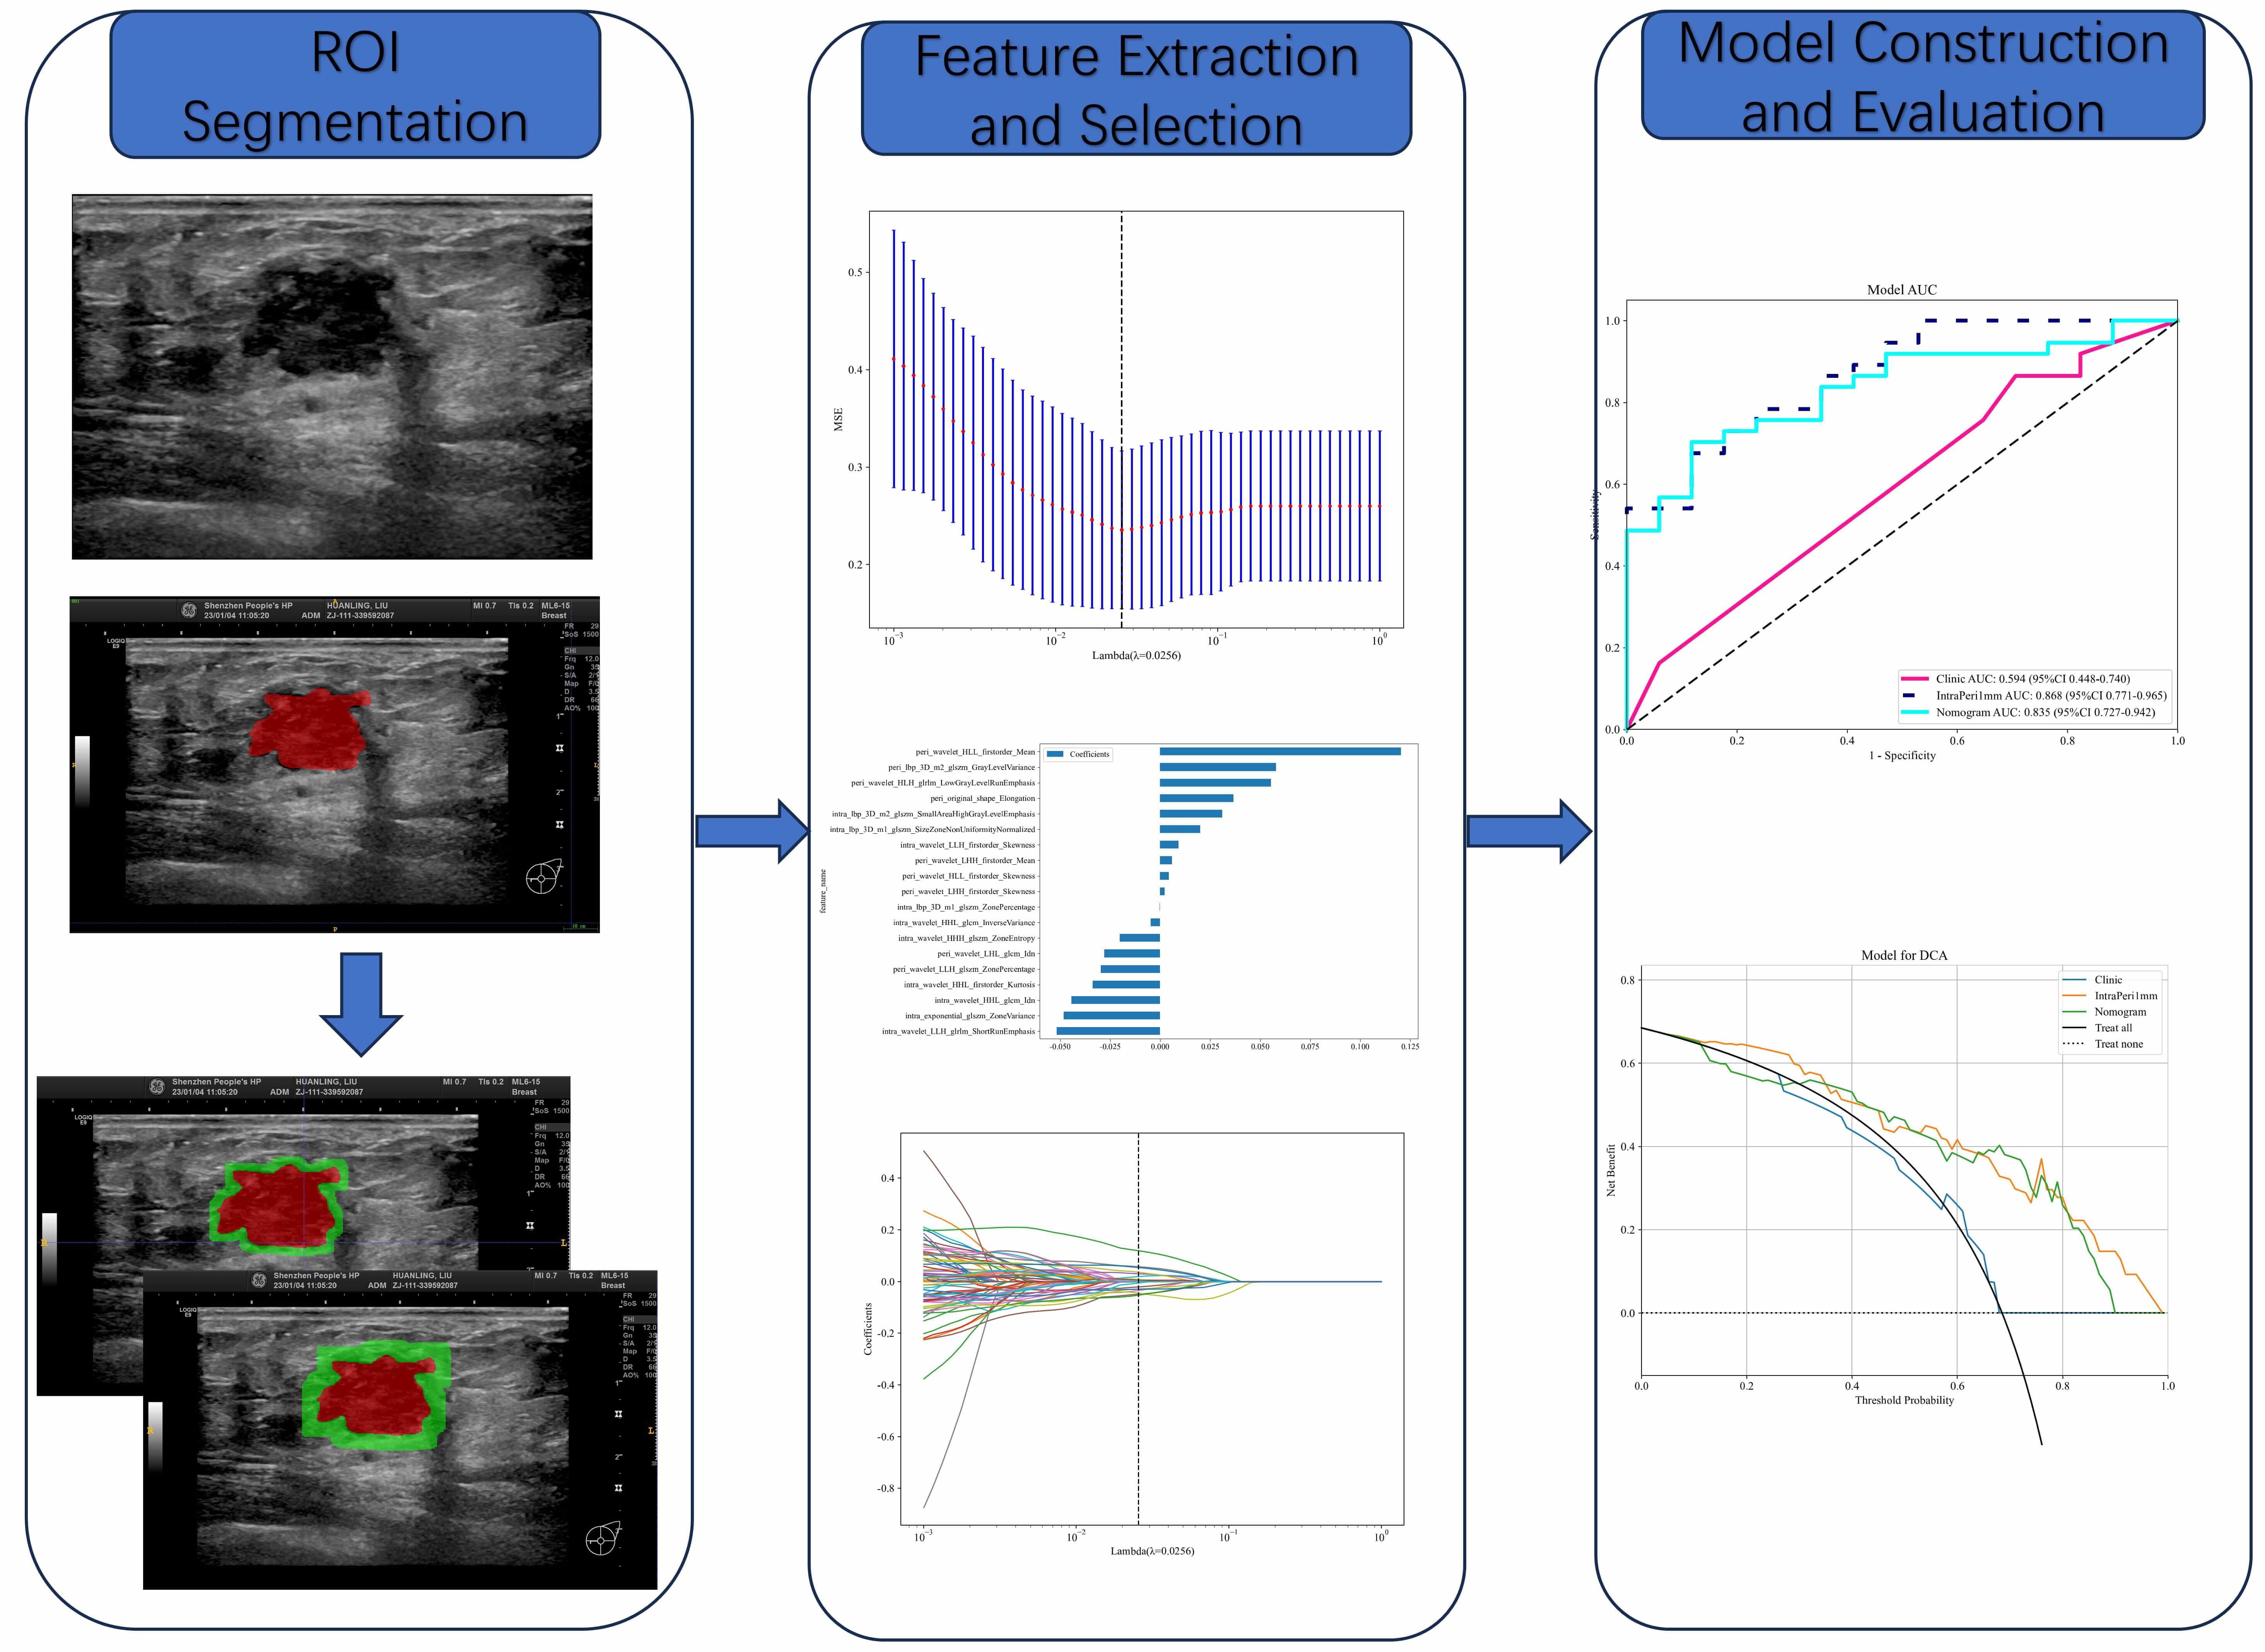 Fig. 2.
ROI Segmentation. Note: To define the ROI, manual segmentation was conducted on the intratumoral area in US images, with subsequent AI-assisted automatic segmentation of the peritumoral region at 1 mm and 2 mm intervals. Feature Selection: Features were derived from the delineated US images around the tumor. LASSO regression models were employed to select features, with the aim of enhancing the quality of analysis. Model Construction & Evaluation: Omics models were built based on the selected feature variables, and their diagnostic performance was assessed through analysis by AUC and DCA. AUC, area under the curve; DCA, decision curve analysis; LASSO, least absolute shrinkage and selection operator.
Manual segmentation of tumor regions was conducted with rigorous quality control
measures in order to minimize operator-dependent variability. Prior to formal
segmentation, each participating radiologist (n = 3) underwent a standardized
training program on 15 calibration cases that were excluded from the main study
cohort. This training established consensus on critical segmentation parameters,
including boundary definition criteria for irregular margins, protocols for
handling heterogeneous echo patterns, and standardized ITK-SNAP software settings
(version 3.8.0; http://www.itksnap.org/; developed by Paul A. Yushkevich,
University of Pennsylvania, Philadelphia, PA, USA). The segmentation process
itself involved a dual-observer design with two independent radiologists. Each
had more than a decade of specialized experience in breast US, and performed
blinded annotations without access to pathological results. To assess
interoperator consistency, the immunocytochemistry (ICC) was calculated from 30 randomly selected US
images, with ICC values
The radiomic features underwent standardized preprocessing through z-score
normalization to eliminate dimensional disparities. Feature correlation analysis
was conducted using Spearman’s rank correlation coefficient, with highly
correlated features (Spearman’s
LASSO regression was employed to select variables for the development of a
predictive model of HER2 status. Prior to building the predictive model,
multicollinearity among variables was assessed by calculating the variance
inflation factor (VIF). A VIF value
Statistical analyses were conducted using R software (version 4.2.2; The R
Foundation for Statistical Computing, Vienna, Austria). A two-sided
p-value of
This investigation comprised 209 eligible patients stratified into training (n = 155) and test (n = 54) cohorts. Clinical profiling included patient age, anthropometric parameters (height/weight), tumor diameter, and spatial distribution (Table 1). Univariate logistic regression identified significant associations between HER2-low status and age (odds ratio [OR] = 1.006, p = 0.049), height (OR = 1.002, p = 0.020), weight (OR = 1.007, p = 0.021), lymph node metastasis (OR = 1.014, p = 0.046), ER-positivity (OR = 1.007, p = 0.001), and progesterone receptor (PR)-positivity (OR = 1.007, p = 0.002). Multivariate adjustment revealed that ER status was the only independent predictor of HER2-low status (OR = 1.019, 95% confidence interval [CI]: 1.007–1.033; p = 0.012) (Table 2). The clinical prediction model demonstrated limited discriminative capacity in the test set (AUC = 0.594, 95% CI: 0.448–0.740). The comprehensive performance evaluation, including calibration and decision curves for all models in both training and test sets, is presented in Fig. 3.
| Variables | Total (n = 209) | HER2-zero (n = 80) | HER2-low (n = 129) | p-value | |
| Age (years) | 50 (44, 62) | 52 (45, 62) | 50 (43, 60) | 0.414 | |
| Height (cm) | 158 (155, 161) | 158 (154, 161) | 158 (155, 161) | 0.788 | |
| Weight (kg) | 57 (55, 60) | 58 (54, 60) | 57 (55, 60) | 0.860 | |
| Menopausal status | 0.844 | ||||
| Premenopausal | 105 (50%) | 39 (49%) | 66 (51%) | ||
| Postmenopausal | 104 (50%) | 41 (51%) | 63 (49%) | ||
| History of breast cancer | 0.745 | ||||
| Absent | 199 (95%) | 77 (96%) | 122 (95%) | ||
| Present | 10 (5%) | 3 (4%) | 7 (5%) | ||
| Location | 0.484 | ||||
| Right | 102 (49%) | 42 (52%) | 60 (47%) | ||
| Left | 107 (51%) | 38 (48%) | 69 (53%) | ||
| Clinical tumor stage | 0.303 | ||||
| T1 | 131 (62%) | 46 (57%) | 85 (66%) | ||
| T2 or above | 78 (38%) | 34 (42%) | 44 (34%) | ||
| Clinical nodal stage | 0.439 | ||||
| N0 | 152 (73%) | 61 (76%) | 91 (70%) | ||
| N+ | 57 (27%) | 19 (24%) | 38 (30%) | ||
| L (mm) | 18 (13, 25) | 19 (14, 25) | 18 (13, 26) | 0.944 | |
| S (mm) | 14 (10, 20) | 15 (12, 20) | 14 (10, 18) | 0.192 | |
| Middle (mm) | 11 (8, 14) | 12 (8, 15) | 11 (8, 13) | 0.080 | |
| Shape | 0.383 | ||||
| Oval or Round | 1 (0%) | 1 (1%) | 0 (0%) | ||
| Irregular | 208 (100%) | 79 (99%) | 129 (100%) | ||
| Orientation | 0.190 | ||||
| Parallel | 48 (23%) | 14 (18%) | 34 (26%) | ||
| Not parallel | 161 (77%) | 66 (82%) | 95 (74%) | ||
| Margin | |||||
| Not circumscribed | 188 (90%) | 63 (79%) | 125 (97%) | ||
| Circumscribed | 21 (10%) | 17 (21%) | 4 (3%) | ||
| Echo patten | 0.222 | ||||
| Hypoechoic | 33 (16%) | 9 (11%) | 24 (19%) | ||
| Others | 176 (84%) | 71 (89%) | 105 (81%) | ||
| Posterior echo | 0.600 | ||||
| Shadowing | 108 (52%) | 39 (49%) | 69 (53%) | ||
| No posterior features | 101 (48%) | 41 (51%) | 60 (47%) | ||
| Calcification | 0.965 | ||||
| Absent | 142 (68%) | 55 (69%) | 87 (67%) | ||
| Present | 67 (32%) | 25 (31%) | 42 (33%) | ||
| Vascularity | 0.427 | ||||
| Absent | 83 (40%) | 35 (44%) | 48 (37%) | ||
| Present | 126 (60%) | 45 (56%) | 81 (63%) | ||
| ER | 90 (80, 90) | 90 (58, 90) | 90 (80, 90) | 0.001 | |
| PR | 80 (10, 90) | 80 (2, 90) | 80 (40, 90) | 0.040 | |
| KI67 | 20 (10, 30) | 30 (10, 40) | 20 (10, 30) | 0.002 | |
Note: L, Maximum diameter; S, Shortest path; Middle, anteroposterior diameter; HER2, human epidermal growth factor receptor 2; ER, estrogen receptor; PR, progesterone receptor; KI67, marker of proliferation Ki-67; T1, tumor stage 1; T2, tumor stage 2.
| Variable | Univariable analysis | Multivariable analysis | ||||
| OR | 95% CI | p-value | OR | 95% CI | p-value | |
| Clear | 0.333 | 0.129–0.862 | 0.057 | - | - | - |
| KI67 | 1.002 | 0.994–1.010 | 0.697 | - | - | - |
| Height | 1.002 | 1.001–1.004 | 0.020 | 1.001 | 0.947–1.058 | 0.971 |
| Age | 1.006 | 1.001–1.011 | 0.049 | 0.982 | 0.957–1.008 | 0.245 |
| ER-positivity | 1.007 | 1.004–1.010 | 0.001 | 1.019 | 1.007–1.033 | 0.012 |
| Weight | 1.007 | 1.002–1.011 | 0.021 | 0.981 | 0.918–1.048 | 0.630 |
| PR-positivity | 1.007 | 1.004–1.011 | 0.002 | 1.000 | 0.990–1.010 | 0.971 |
| Middle | 1.011 | 0.990–1.031 | 0.381 | - | - | - |
| L | 1.014 | 1.003–1.026 | 0.046 | 0.996 | 0.969–1.024 | 0.828 |
| S | 1.014 | 0.999–1.030 | 0.128 | - | - | - |
| T | 1.077 | 0.688–1.685 | 0.786 | - | - | - |
| Direction | 1.196 | 0.889–1.611 | 0.322 | - | - | - |
| Margin | 1.229 | 0.845–1.786 | 0.366 | - | - | - |
| Posteriorecho | 1.314 | 0.908–1.900 | 0.223 | - | - | - |
| Echo | 1.339 | 1.002–1.791 | 0.098 | - | - | - |
| Bloodflow | 1.350 | 0.958–1.902 | 0.150 | - | - | - |
| Shape | 1.460 | 1.116–1.912 | 0.021 | 2.134 | 0–17,378.69 | 0.890 |
| Location | 1.484 | 1.012–2.175 | 0.089 | - | - | - |
| Calcification | 1.941 | 1.188–3.171 | 0.026 | 1.322 | 0.696–2.514 | 0.474 |
| N | 2.333 | 1.323–4.116 | 0.014 | 1.452 | 0.715–2.948 | 0.386 |
| History | 2.500 | 0.631–9.895 | 0.273 | - | - | - |
Note: CI, confidence interval; OR, odds ratio; N, lymph node metastasis; T, clinical tumor stage.
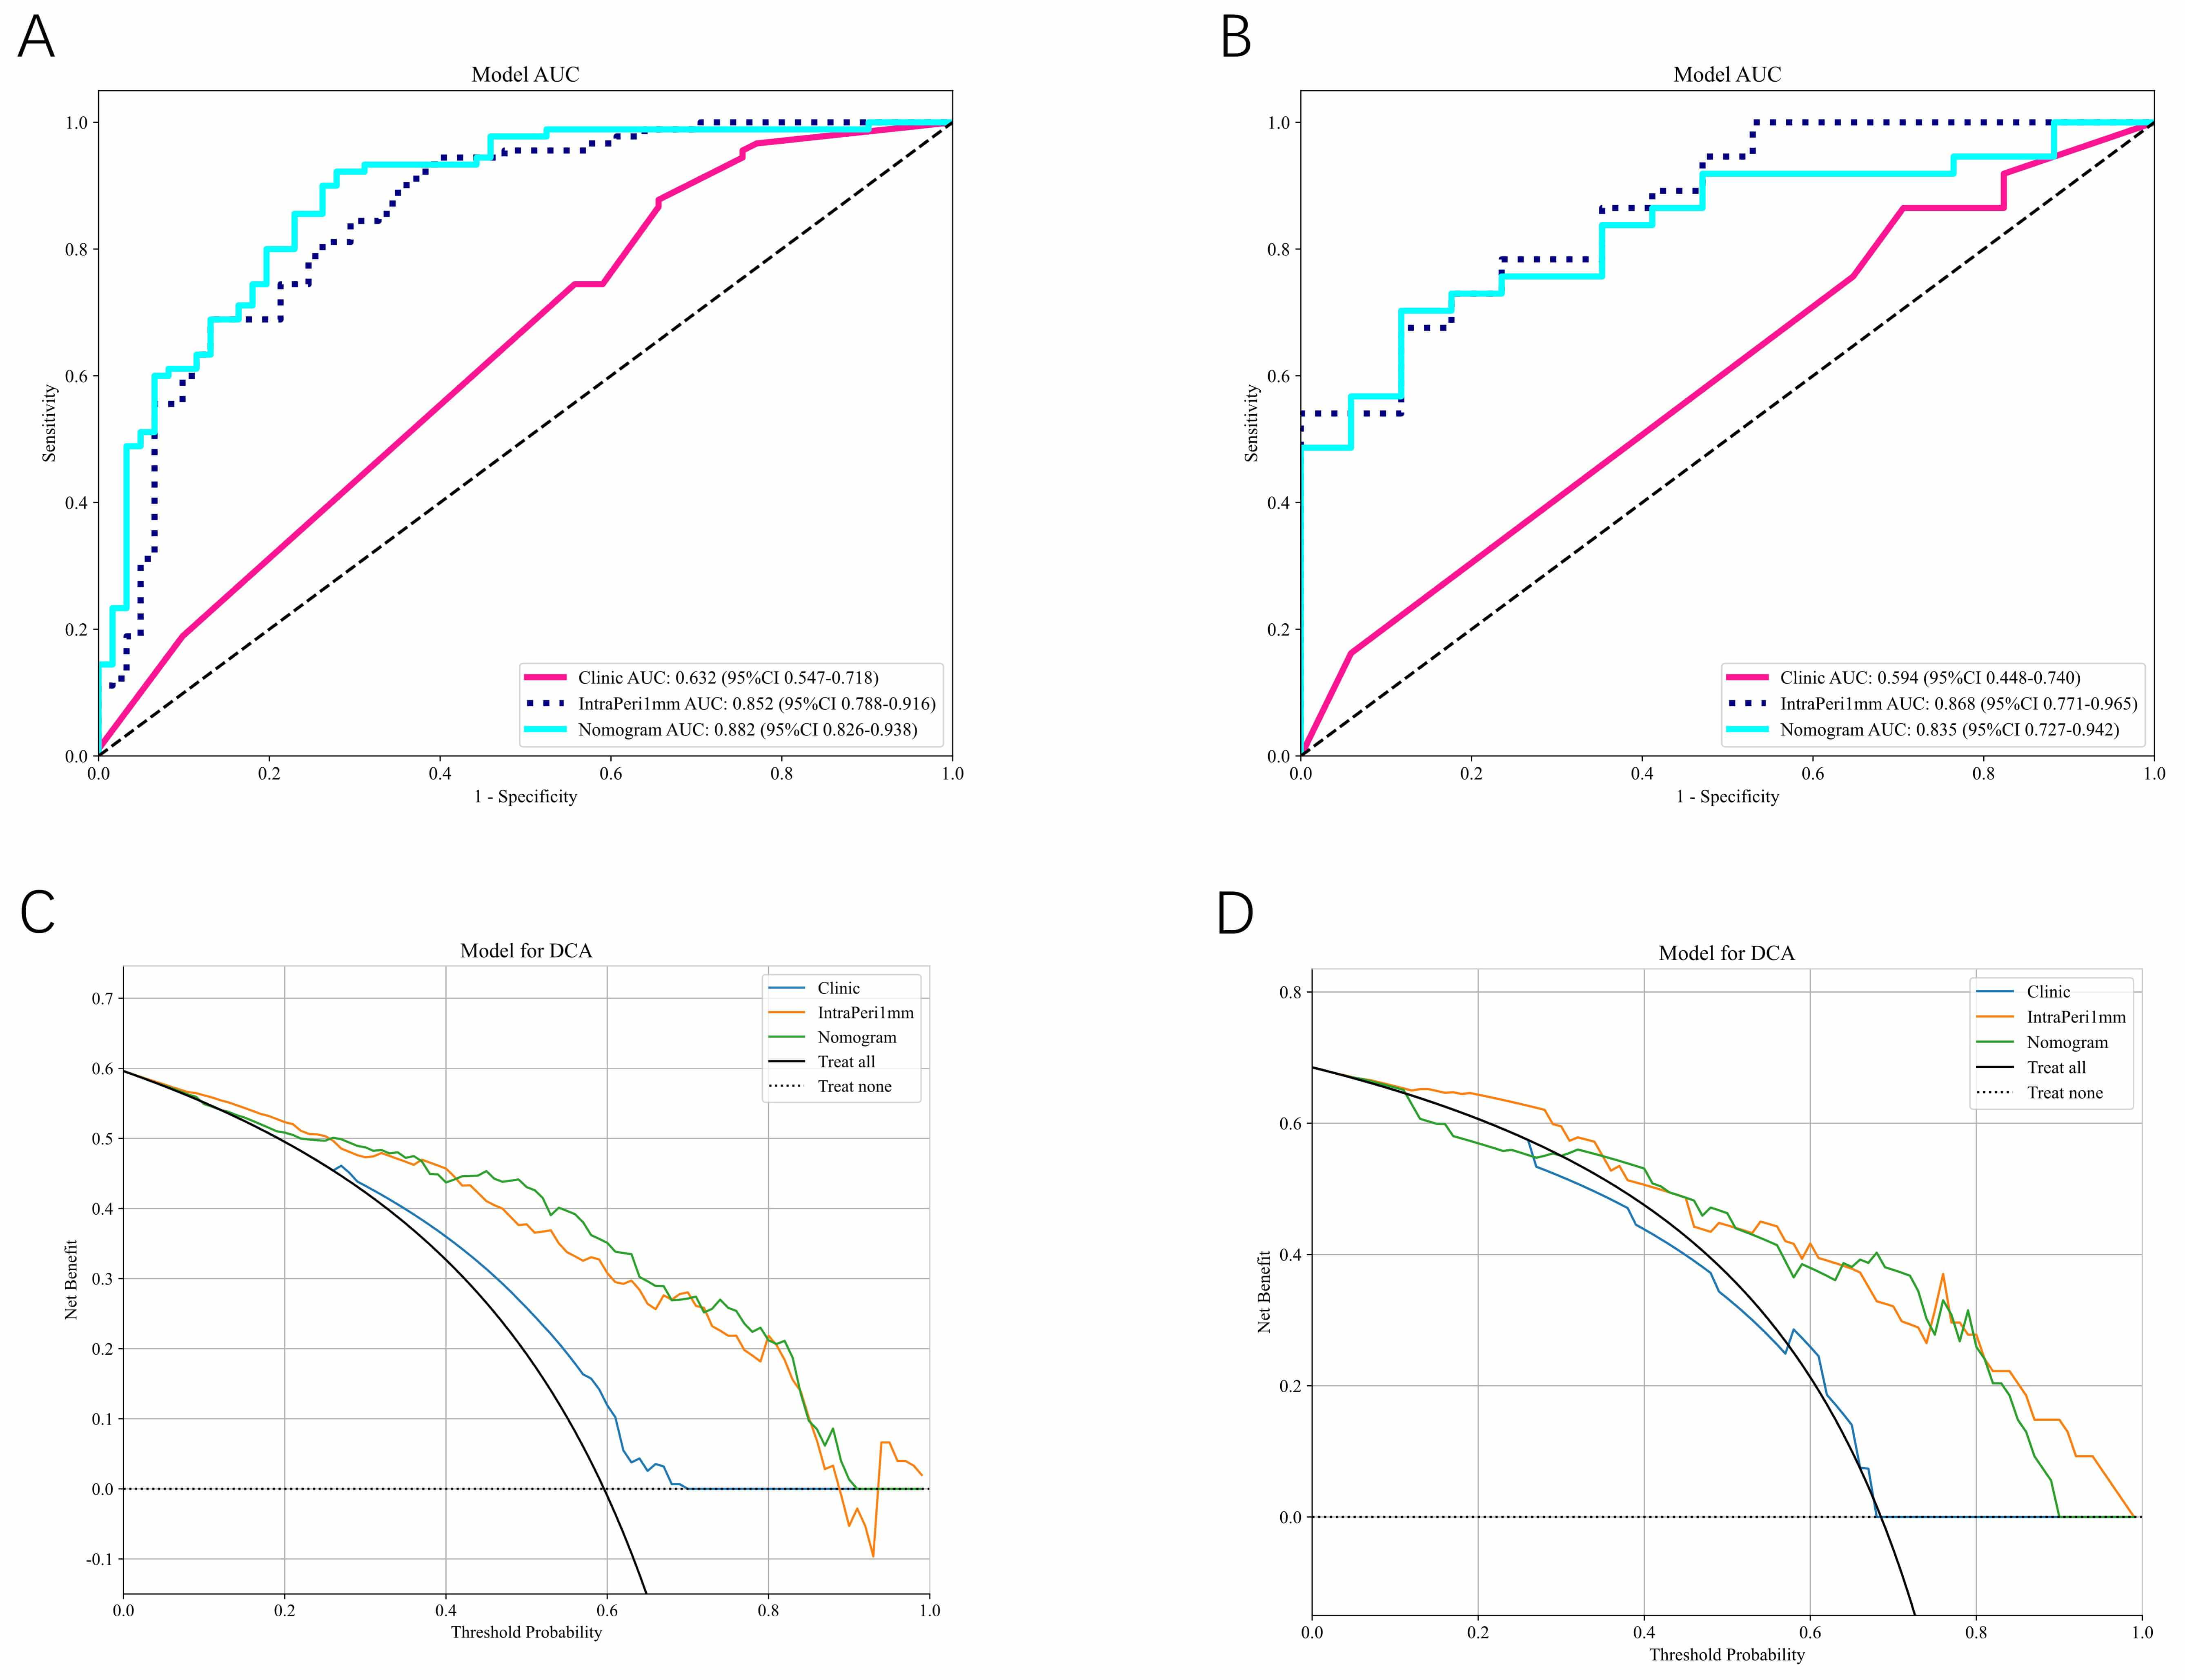 Fig. 3.
Model performance comparison. (A,B) Calibration curves for the clinical model, radiology model, and column chart model in the training (A) and test (B) sets. (C,D) Decision curves for the clinical model, radiology model, and column chart model in the training (C) and test (D) sets.
A total of 3320 radiomic signatures were extracted from within the intratumoral region and the 1 mm and 2 mm ROIs in the peritumoral region. These included 1651 intratumoral features and 1651 peritumoral features. LASSO dimensionality reduction was used to select 30 features from the intratumoral region, and 19 and 24 features from the 1 mm and 2 mm peritumoral regions, respectively. The selected features and their corresponding coefficients for each region are visualized in Fig. 4A–C. A composite radiomics model was developed by integrating the intratumoral features with the peritumoral features extracted from both the 1 mm and 2 mm regions. This model was designed to quantitatively assess the differentiation of HER2-low from HER2-zero BC. The performance metrics of these models, as evaluated in the training and test cohorts, are detailed in Table 3.
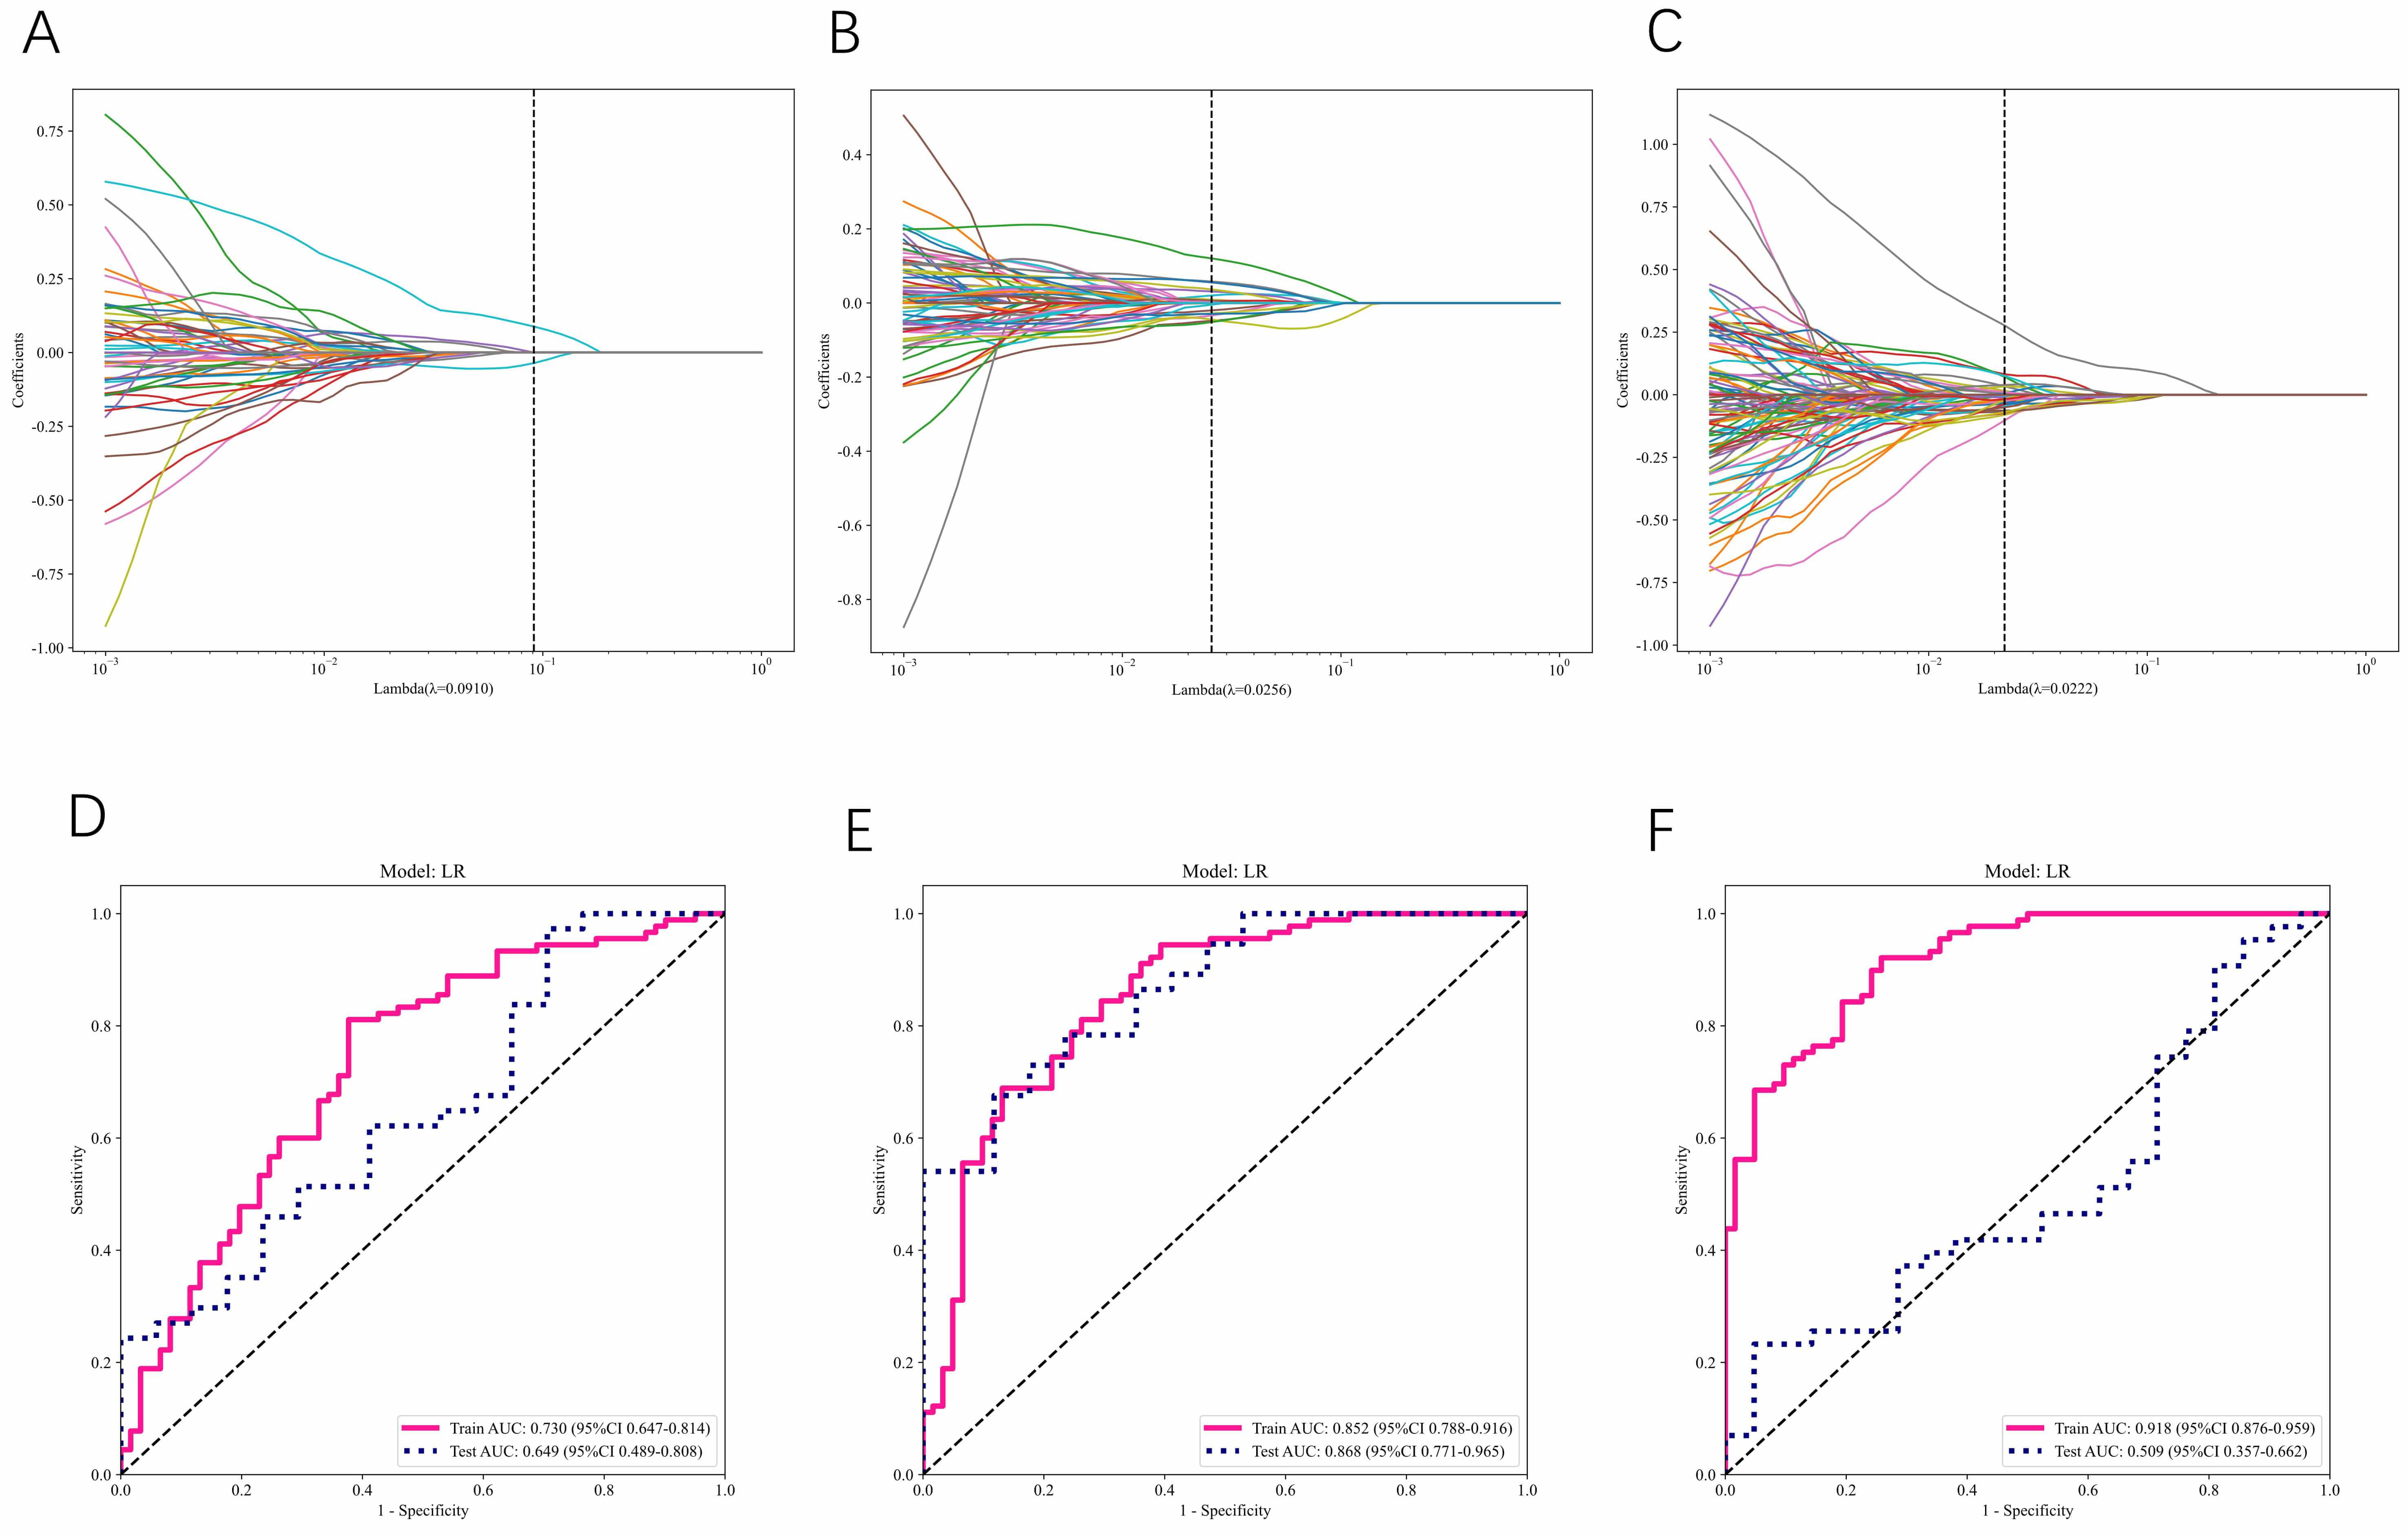 Fig. 4.
AUC plots of the radiomics model for the area in and around the tumor. (A) Radiological characteristics of the intratumoral area selected by LASSO. (B) Radiomics characteristics of the 1 mm peritumoral area selected by LASSO. (C) Radiomics characteristics of the 2 mm peritumoral area selected by LASSO. (D–F) ROC curves of intratumoral (D), 1 mm peritumoral (E) and 2 mm peritumoral (F) regions.
| Set | Signature | AUC | 95% CI | PPV | NPV | Sensitivity | Specificity | Accuracy |
| Train | Clinic | 0.632 | 0.547–0.718 | 0.661 | 0.636 | 0.867 | 0.344 | 0.656 |
| Intra | 0.730 | 0.647–0.814 | 0.758 | 0.679 | 0.800 | 0.623 | 0.728 | |
| IntraPeri 1 mm | 0.852 | 0.788–0.916 | 0.884 | 0.646 | 0.678 | 0.869 | 0.755 | |
| IntraPeri 2 mm | 0.918 | 0.876–0.959 | 0.835 | 0.852 | 0.910 | 0.742 | 0.841 | |
| Nomogram | 0.882 | 0.826–0.938 | 0.828 | 0.846 | 0.911 | 0.721 | 0.834 | |
| Test | Clinic | 0.594 | 0.448–0.740 | 0.718 | 0.400 | 0.757 | 0.353 | 0.630 |
| Intra | 0.649 | 0.489–0.808 | 0.745 | 0.714 | 0.946 | 0.294 | 0.741 | |
| IntraPeri 1 mm | 0.868 | 0.771–0.965 | 0.923 | 0.536 | 0.649 | 0.882 | 0.722 | |
| IntraPeri 2 mm | 0.509 | 0.357–0.662 | 0.900 | 0.370 | 0.209 | 0.952 | 0.453 | |
| Nomogram | 0.835 | 0.727–0.942 | 0.926 | 0.556 | 0.676 | 0.882 | 0.741 |
Note: Intra, intratumoral features; Peri, peritumoral features; PPV, positive predictive value; NPV, negative predictive value; Nomogram, combined clinical features, intratumoral and 1 mm peritumoral US imaging features.
The radiomics model based on intratumoral features alone demonstrated an AUC of 0.730 (95% CI: 0.647–0.814) in the training set, and 0.649 (95% CI: 0.489–0.808) in the test set (Fig. 4D). In comparison, the peritumoral radiomics model combining intratumoral features with a 1 mm ROI showed enhanced performance, achieving AUC values of 0.852 (95% CI: 0.788–0.916) in the training set and 0.868 (95% CI: 0.771–0.965) in the test set (Fig. 4E). Expansion of the peritumoral ROI to 2 mm while maintaining integration of intratumoral features resulted in the model exhibiting superior training set performance, with an AUC of 0.918 (95% CI: 0.876–0.959). However, a substantial performance degradation was observed in the test set, with an AUC of just 0.509 (95% CI: 0.357–0.662) (Fig. 4F).
These findings suggest that incorporation of peritumoral regions into radiomics analysis results in better predictive performance compared to using intratumoral analysis alone. Additionally, by comparing results from different peritumoral sizes, the peritumoral region with a 1 mm ROI, in combination with the intratumoral model, was found to have the best predictive performance.
We next developed a comprehensive prediction model by integrating intratumoral and 1 mm peritumoral US imaging-derived radiomic features with clinical risk factors. This model led to the creation of a nomogram, depicted in Fig. 5, which was designed to discriminate between HER2-low and HER2-zero BCs. Notably, the VIFs of the predictors in the nomogram, which included clinical risk factors and radiomic features, ranged from 1.039 to 1.179, indicating the absence of multicollinearity among the variables. The model performance was assessed based on its AUC value. In the training set, the model exhibited an AUC of 0.882 (95% CI: 0.826–0.938), while in the test set the AUC was 0.835 (95% CI: 0.727–0.942). DCA revealed that nomograms incorporating clinical features, intratumoral and 1 mm peritumoral US imaging radiomic features were capable of differentiating HER2-low from HER2-zero BC.
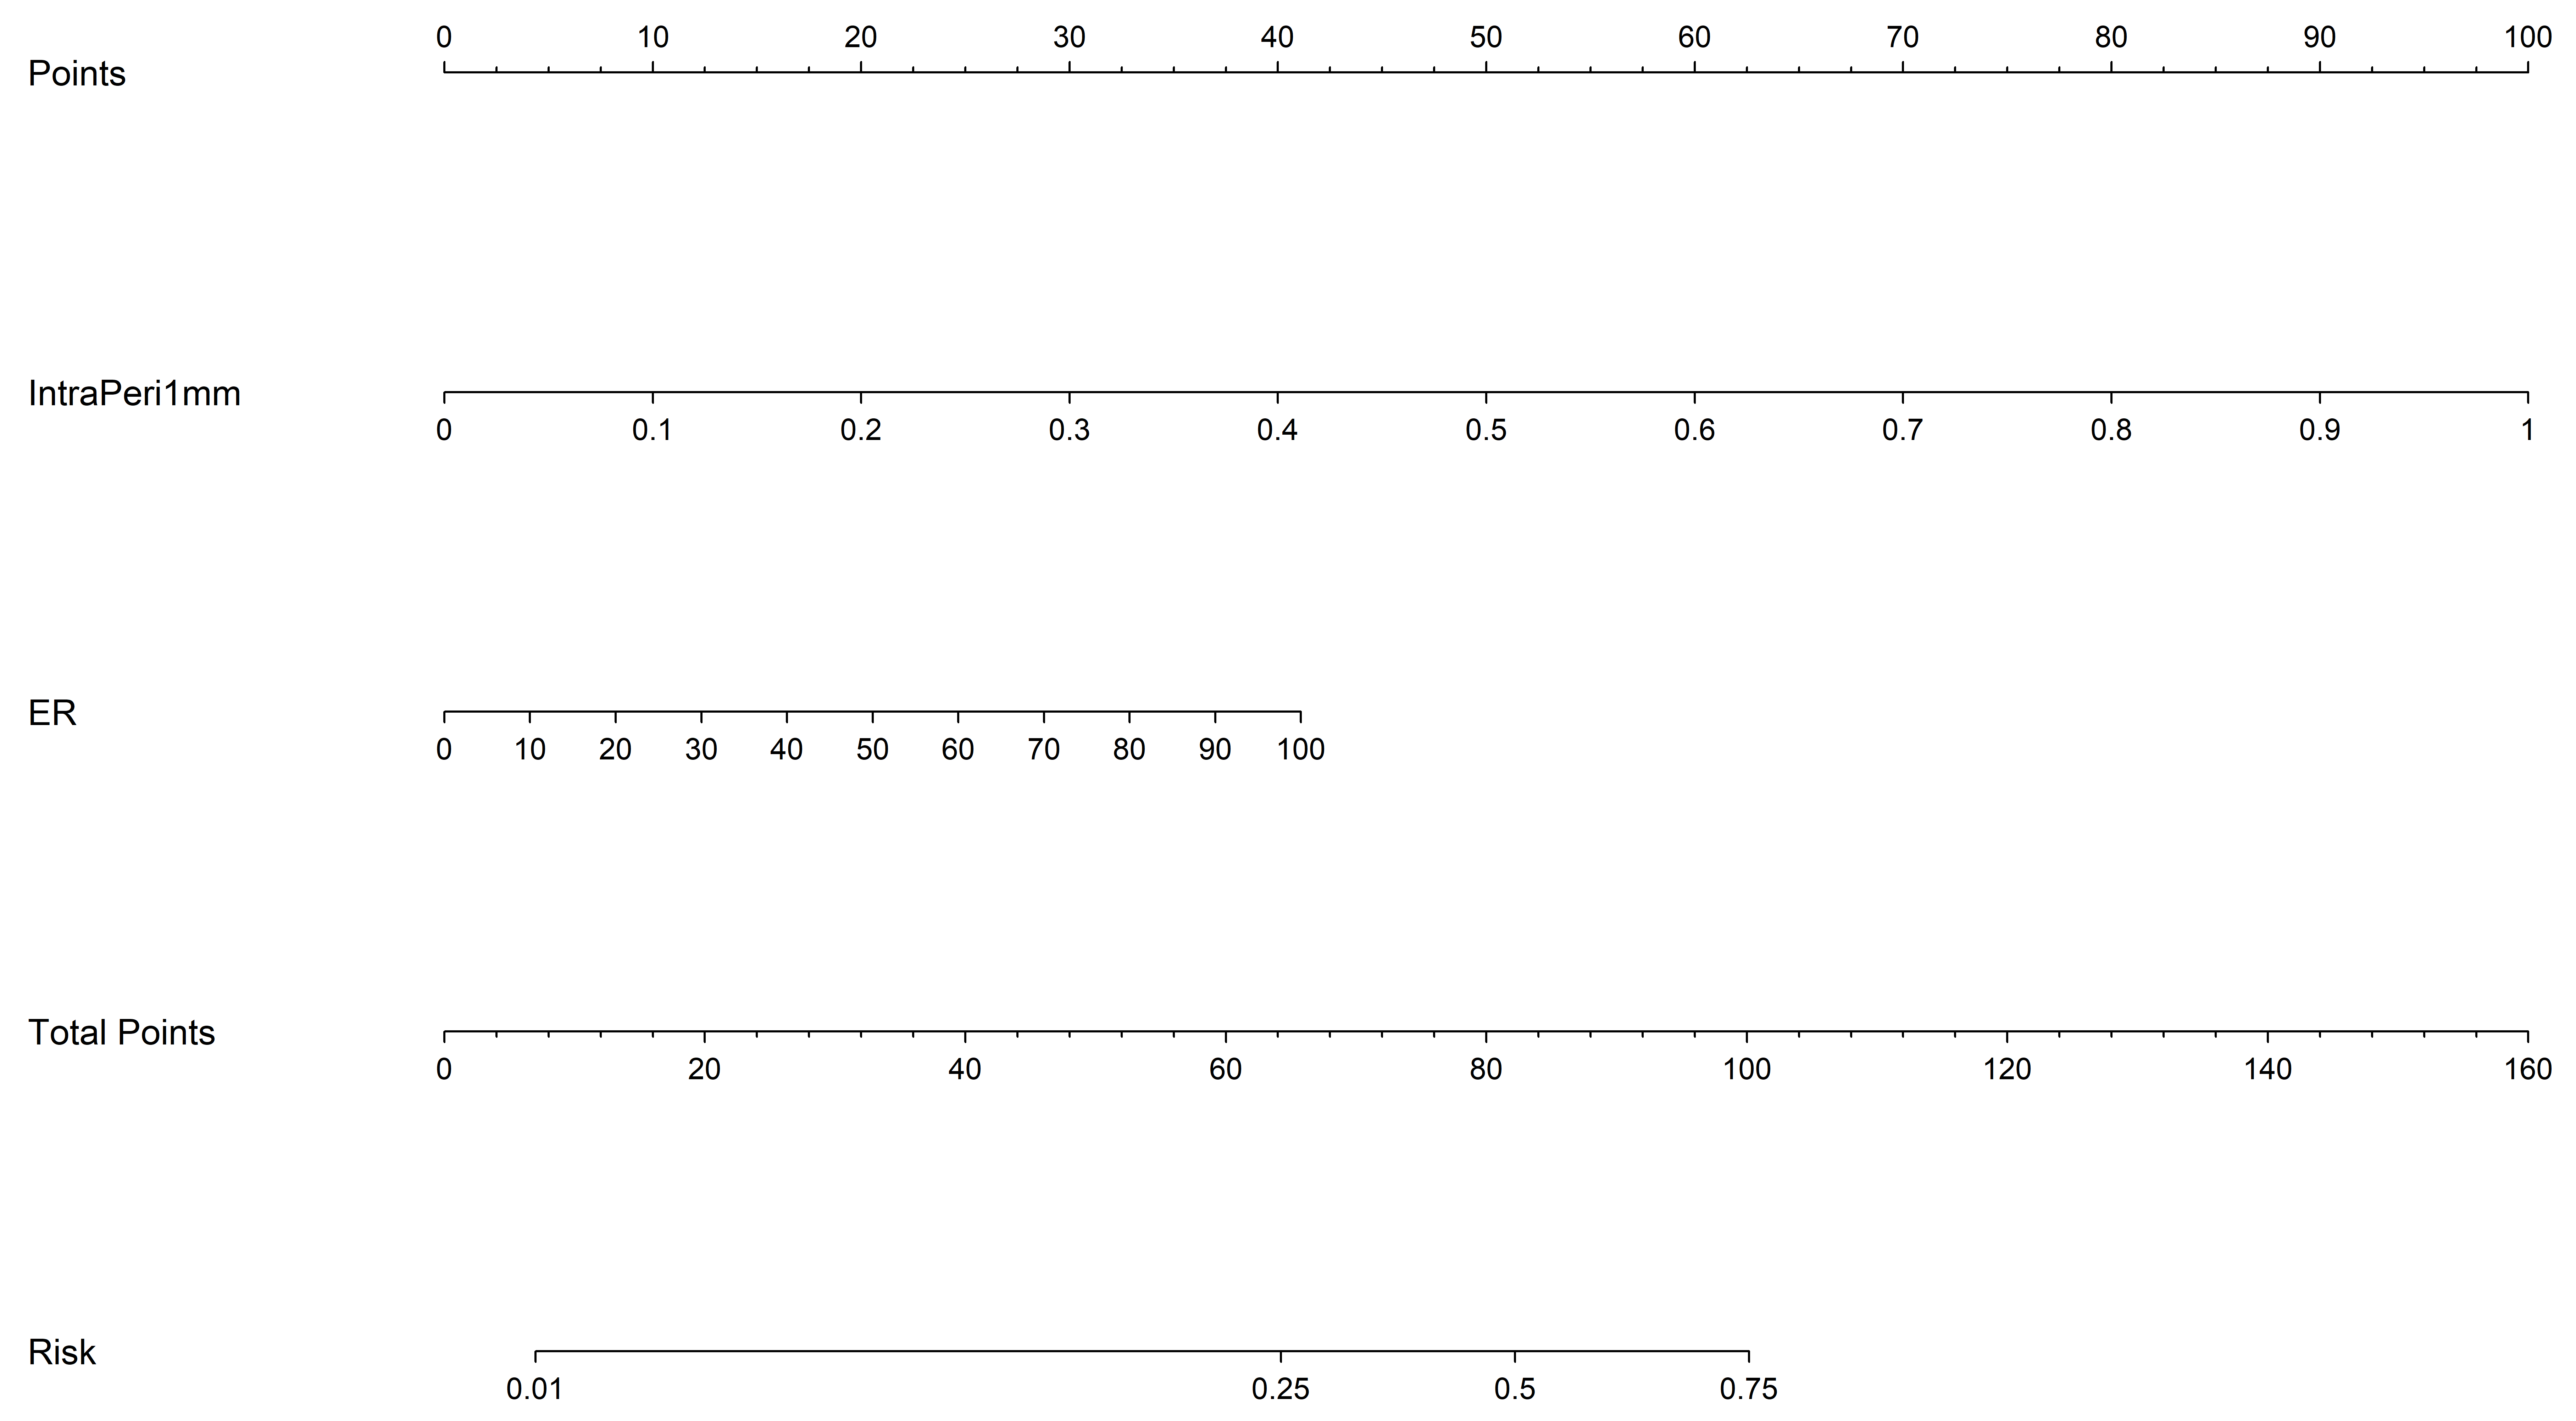 Fig. 5.
Construction of the nomogram model, incorporating clinical features with intratumoral and peritumoral US imaging-derived radiomic features. ER, ER-positivity.
Notably, the results indicated the diagnostic ability of the nomogram was marginally lower than that of the intra-tumoral and 1 mm peritumoral radiomics models.
In this study, we developed a predictive model integrating clinical parameters and grayscale US-based intratumoral and peritumoral radiomic features to differentiate HER2-low from HER2-zero status in BC patients. Previous studies that concentrated on the imaging profiles of HER2-negative and HER2-positive cases reported diagnostic performance ranging from moderate to substantial accuracy [23, 24]. However, until recently, HER2-low BC has often been under-represented in clinical research. The emergence of new antibody-drug conjugates (ADCs) targeting HER2 has once again drawn attention to HER2-low tumors [25]. A subset of BCs featuring low HER2 expression level and lacking significant ERBB2 amplification is designated as “HER2-low”. These tumors are characterized by an IHC score for HER2 of either 1+ or 2+, and a negative test result for ERBB2 in ISH [26]. Given their different biological phenotype, therapeutic responses, and clinical outcomes, HER2-low BC should be considered a novel BC subtype separate from HER2-zero (IHC 0) BC. In future, the definition of HER2 status in BC is likely to include three categories, comprising HER2-positive, HER2-negative, and HER2-low, of which the latter subgroup may benefit from targeted therapy regimens.
Bian et al. [17] devised a multiparametric, MRI-based radiomics approach to discriminate HER2-zero tumors from HER2-positive tumors. The former were further subdivided into HER2-low and HER2-zero subtypes, achieving an acceptable AUC of 0.81. Yin et al. [16] also reported a DCE-MRI radiomics model to differentiate these two subtypes, achieving an AUC of 0.78. While their work demonstrated the potential of radiomics for HER2 subtyping, their approach requires specialized equipment and contrast administration, thus limiting widespread clinical adoption. In contrast, our US-based model not only achieves superior performance (AUC = 0.882), but also overcomes these practical constraints through the inherent advantages of US technology. Moreover, the performance of our model surpasses that of the nomogram model by Yin et al. [16]. US is one of the primary modalities for clinical BC screening, with considerable merit beyond its extensive availability and cost-effectiveness compared to MRI. The ubiquitous availability of US in primary care clinics and community hospitals addresses a critical accessibility gap. Whereas MRI scanners are predominantly available in tertiary care centers (present in only 18% of Chinese county-level hospitals according to recent surveys), US systems are present in over 95% of healthcare facilities. This is particularly important for the detection of HER2-low, as such patients often present initially at community healthcare settings before specialist referral.
Previous studies on radiomics in BC molecular typing have focused on deriving information and features from the intratumoral region to differentiate between HER2-low and HER2-zero BC [27, 28, 29]. However, there is now increasing evidence for a substantial correlation between the tumor microenvironment (TME) and cancer cell behavior, including unrestricted proliferation and immune evasion. This implies that peritumoral regions may also furnish valuable information [30]. Therefore, in the present study we used IHC and FISH to determine HER2 status, combined the results from intratumoral and adjacent peritumoral regions of BC, designed a comprehensive radiomics and clinical model by applying machine learning algorithms, and compared the diagnostic accuracy of different models for discriminating HER2-low from HER2-zero BC. Our integrated model demonstrated robust discriminative performance, with AUC values of 0.882 (95% CI: 0.826–0.938) in the training cohort and 0.835 (95% CI: 0.727–0.942) in the validation cohort. These results indicate that an intratumoral and peritumoral radiomics model, combined with the clinical model, can effectively distinguish between HER2-low and HER2-zero BC subtypes.
Furthermore, this study found the clinical model exhibited relatively poor performance when compared to the clinical model combined with the intratumoral and peritumoral radiomics model, as well as to the nomogram model. The latter two models demonstrated a high discriminative capacity between HER2-low and HER2-zero BCs. The AUC of the clinical model in this study was 0.594, which is considerably lower than the 0.866 reported by Chen et al. [27] for their clinical model. These authors included ER status, PR status, lymph node metastasis and internal echo to construct their clinical model after multivariate analysis, whereas the present study included only the ER status. The difference in AUC value may also be partly due to the limited sample size of our study. This led to a wide distribution of clinical data, causing certain relevant factors to be excluded following multi-factor screening. In future investigations, we plan to expand the cohort size to enhance the generalizability and robustness of our model. Notably, the highest diagnostic performance in the test set was not achieved by the nomogram model. Although this model incorporated both clinical and radiomic data, the AUC was 0.835 (95% CI: 0.730–0.940). Instead, the intratumoral and peritumoral radiomic model exhibited superior diagnostic efficacy, achieving an AUC of 0.868 (95% CI: 0.770–0.970). Critically, the high positive predictive value (PPV = 0.923) of our 1 mm intra-peri-tumoral model signifies excellent reliability for the confirmation of HER2-low status, thereby strengthening the indication for biopsy. Conversely, the moderate negative predictive value (NPV = 0.536) suggests that a negative result does not independently rule out the target condition, highlighting the need to integrate this tool with other clinical assessments for comprehensive decision-making.
This study focused on the 1 mm and 2 mm peritumoral regions for feature extraction. Nevertheless, uncertainties persist concerning the most appropriate delineation of the peritumoral region in BC. To date, a globally recognized gold standard for defining the peritumoral region in this specific clinical scenario is still lacking. The adoption of multi-scale, fixed-distance zones (0 mm, 1 mm, 2 mm) in the current study was based on existing findings in the field of BC radiomics and research into the TME, as well as validation results from our own study. The goal of this design is to strike a balance between capturing biologically relevant information (e.g., immune infiltration, neovascularization in the TME) and ensuring practical feasibility in clinical imaging analysis. Zhao et al. [31] provided compelling evidence for the utility of multi-scale peri-tumoral regions in predicting lympho-vascular invasion (LVI) in BC via DCE-MRI. Their multi-institutional study of 496 invasive BC cases involved the construction of models targeting 0–1 mm, 1–3 mm, and 3–5 mm peritumoral regions. The 0–1 mm peritumoral region contributed the highest weight coefficient in their fusion models [31]. After confirming 1 mm as the basic margin, we investigated the concept of multi-scale peritumoral margin validation, expanded the margin outward using 1 mm as the minimum unit, and sequentially designed larger peritumoral margins of 2 mm and 3 mm. We then constructed the respective radiomics models and tested their efficacy. However, the efficacy of models with 2 mm and larger peritumoral margins was all inferior. The AUC value, sensitivity, and specificity of the 2 mm margin model were significantly lower compared with the 1 mm model, while the efficacy of models with 3 mm margins or greater was even lower. In summary, the decisions regarding margin size in our study and the overall scope of this discussion are based on existing findings from previous BC peritumoral studies, combined with validation from our own experimental data, giving rise to the final scheme.
The 1 mm region is considered optimal, as the isolated peritumoral region often lacks sufficient data to adequately reflect the nuances of BC aggressiveness and US signal transmission. Moreover, the 2 mm region may contain excessive normal breast tissue, reducing the distinction between HER2-low and HER2-zero BC types. For example, in the final characteristics, “peri_wavelet_HLL_firstorder_Mean” reflects the average gray intensity of the peritumoral region post-wavelet transformation. Biologically, a higher value for this feature may indicate more prominent abnormal signals (e.g., inflammation or fibrosis) in HER2-low peritumoral tissues. Inflammation in the TME can attract immune cells that release cytokines to promote tumor growth and angiogenesis, while fibrosis forms a rigid extracellular matrix facilitating tumor cell invasion. In contrast, HER2-zero tumors show relatively homogeneous signals in the peritumoral region, with the difference facilitating subtype differentiation and providing insights into the distinct biological behaviors of this tumor subtype. “Intra_exponential_glszm_ZoneVariance” characterizes the variability in size of intratumoral homogeneous regions. Its negative weight implies that HER2-low tumors are likely to have more uniform intratumoral zone distribution. In contrast, HER2-zero tumors exhibit higher intratumoral heterogeneity, which is closely linked to tumor prognosis and treatment response, and may be associated with necrotic or cystic regions. Necrotic areas often indicate a more aggressive tumor phenotype, arising when rapid tumor growth outpaces blood supply, making this feature a valuable biological marker for distinguishing the two subtypes. “Peri_wavelet_LHL_glcm_Idn” quantifies the local homogeneity of peritumoral tissue via inverse difference normalization. A negative value for this characteristic indicates higher heterogeneity in the HER2-low peritumoral micro-environment, possibly due to mixed fibrosis or inflammation. This can alter tumor-stroma interactions, thereby affecting tumor cell motility and survival. Tumor-stroma cross-talk, including immune cell infiltration and angiogenesis, closely correlates with HER2 expression. Such interactions are concentrated in the area adjacent to the tumor, providing the biological signals needed to discriminate between HER2 subtypes in our US radiomics model [30, 32]. The peritumoral micro-environment is a critical hub for immunosuppressive cell interactions (e.g., cancer-associated fibroblast (CAF)-mediated T-cell inhibition, tumor-associated macrophage (TAM)-induced therapy resistance). The micro-environmental differences between HER2 subtypes are precisely what is targeted by our peritumoral radiomics model [33]. The choice of 1 mm, rather than a broader margin, avoids diluting these tumor-specific signals. Expansion beyond 1 mm, as in the 2 mm model, increases the proportion of normal breast tissue (e.g., mammary ducts, adipose tissue) that is unrelated to tumor-stroma interactions, which is likely to explain the observed degradation in the performance of the test set (AUC = 0.509). The findings of this research support the practicality of peritumoral characteristics in US-based radiomics. Furthermore, the clinical workflow integration of our US radiomics model offers additional practical benefits. Unlike MRI which requires separate scheduling, US can be performed during routine diagnostic or biopsy procedures without additional patient visits, thus reducing diagnostic delays and allowing immediate clinical decision-making. This is particularly valuable for time-sensitive cases. Together, these advantages suggest our US-based approach may be a transformative solution for the detection of HER2-low BC in diverse clinical settings, from resource-limited rural clinics to advanced cancer centers. This should help address critical barriers to the widespread implementation of precision diagnostics in BC care.
To address the inherent subjectivity of manual ROI segmentation, we implemented
rigorous measures to minimize operator-dependent variability. Prior to formal
segmentation, each participating radiologist (n = 3) completed standardized
training using 15 calibration cases that were excluded from the main cohort. This
established consensus on critical parameters, including boundary definitions for
irregular margins, protocols for heterogeneous echo patterns, and standardized
ITK-SNAP software settings (version 3.8.0; http://www.itksnap.org/; developed by
Paul A. Yushkevich, University of Pennsylvania, Philadelphia, PA, USA). The
segmentation process employed a dual-observer design with two radiologists (each
with
This study had several limitations that should be acknowledged. Firstly, a single-center retrospective design was adopted, where all enrolled cases were sourced from only one institution. We plan to mitigate this constraint by increasing the sample size and employing a multicenter study framework. Second, the extraction of all radiomics features based on manually delineated ROIs can be subjective. Despite the use of a double depiction method to ensure consistency, potential biases may still exist. To alleviate this limitation, features with a low ICC can be excluded to enhance robustness. At the same time, automatic algorithms based on deep learning can be employed in future to improve segmentation accuracy. This problem can be addressed by implementing artificial intelligence to automatically delineate ROI areas.
This study is the first attempt to investigate the utility of US-derived intratumoral and peritumoral features in radiomic analysis to discriminate between HER2-low and HER2-zero BC. Furthermore, the intra-peri-tumoral radiomic model developed in this study provides an auxiliary diagnostic tool to support the development of neoadjuvant chemotherapy protocols, and decreases the need for invasive biopsy procedures in BC patients. Our results confirm that peritumoral features harbor crucial information regarding the tumor itself, thereby justifying their inclusion in future radiomic research.
BC, breast cancer; US, ultrasound; BI-RADS, Breast Imaging-Reporting and Data System; ROC, receiver operating characteristic curve; CI, confidence interval; AUC, area under the curve; IQR, interquartile range; FISH, fluorescence in situ hybridization; HER2, human epidermal growth factor receptor 2; IHC, immunohistochemistry; OR, odds ratio.
The datasets used and analyzed during the current study are available from the corresponding authors on reasonable request.
MNS designed the research study, conceived the radiomics model framework, and drafted the initial manuscript. SJM, ZBH and XHZ performed ultrasound image acquisition and preliminary quality control, ensuring compliance with imaging standards. HYW and HTT extracted clinical and pathological data from patient records, and verified data accuracy. SZT and MYW participated in manual ROI segmentation of ultrasound images, and assisted in validating inter-operator consistency via ICC analysis. CYX conducted radiomic feature preprocessing and LASSO regression-based feature selection using Pyradiomics and R software. JFX, FJD and LPM supervised the study design and interpreted the statistical results. FJD and LPM are the corresponding authors and the guarantor of the integrity of the entire study. All authors contributed to editorial changes in the manuscript. All authors read and approved the final manuscript. All authors have participated sufficiently in the work and agreed to be accountable for all aspects of the work.
This study was conducted in accordance with the Declaration of Helsinki and was approved by the institutional review board of the First Affiliated Hospital, Southern University of Science and Technology, Shenzhen People’s Hospital (LL-KY-2022479-02). This study obtained the informed consent of all patients. All methods were carried out in accordance with relevant guidelines and regulations.
Some of our experiments were carried out on Python technology provided by the LySono Research Platform. We thank LySono Team’ s help in this research.
This research received no external funding.
The authors declare no conflict of interest.
References
Publisher’s Note: IMR Press stays neutral with regard to jurisdictional claims in published maps and institutional affiliations.