


 , Ling Han 1,2, Yali Chen 1,2, Xinghui Liu 1,2, Hengxi Chen 1,2,3,*
1 Department of Obstetrics and Gynecology, West China Second University Hospital, Sichuan University, 610041 Chengdu, Sichuan, China
2 Key Laboratory of Birth Defects and Related Diseases of Women and Children (Sichuan University), Ministry of Education, 610041 Chengdu, Sichuan, China
3 Department of Day Surgery, Chengdu Hi-Tech Zone Hospital for Women and Children, 610041 Chengdu, Sichuan, China
Abstract
Red blood cell distribution width (RDW) is associated with inflammation and oxidative stress. This study investigated the predictive value of RDW for hypertensive disorders of pregnancy (HDP).
This retrospective cohort study, using propensity score matching (PSM), included 1546 women admitted to the West China Second University Hospital between January 2021 and January 2022. Univariate logistic regression analysis was performed on variables that remained unbalanced after PSM. Receiver operating characteristic (ROC) curves were used to assess the predictive ability of RDW for HDP.
Following a 1:1 PSM, the analysis enrolled two cohorts: a simple hypertension group (n = 420) with a matched control group (n = 420), and a preeclampsia group (n = 353) and a matched control group (n = 353). Univariate logistic regression analysis revealed no significant association between RDW and simple hypertension (gestational or chronic); however, a significant correlation was observed between RDW and preeclampsia. ROC curve analysis demonstrated that the coefficient of variation of RDW predicted severe preeclampsia with 72% diagnostic accuracy, with a cutoff value of ≥14.65% and area under the curve (AUC) of 0.696. Additionally, the RDW standard deviation (RDWSD) predicted severe preeclampsia with 76% diagnostic accuracy, with a cutoff value of ≥51.85 fL and AUC of 0.661.
Although RDW is a significant independent predictor of preeclampsia, its diagnostic performance is moderate. Due to its speed, low cost, and wide availability, RDW is best utilized as an auxiliary component in combinatorial risk models or multi-marker panels, augmenting established predictors.
Keywords
- red blood cell distribution width
- hypertensive disorders of pregnancy
- preeclampsia
- predictive effect
- propensity score-matching study
Hypertensive disorder of pregnancy (HDP) involves the presence of hypertension
during pregnancy and persists for up to 12 weeks after delivery [1]. HDP is
typically classified into four subtypes: chronic hypertension, gestational
hypertension, preeclampsia, and chronic hypertension with superimposed
preeclampsia. Chronic hypertension with superimposed preeclampsia is
characterized by chronic hypertension accompanied by organ damage or proteinuria
[1, 2, 3]. Severe preeclampsia is commonly defined as preeclampsia associated with
any of the following: severe hypertension (i.e., systolic blood pressure
Red blood cell distribution width (RDW) indicates the fluctuation in red blood cell volume, a sign of complete blood count. It was previously utilized for the differential diagnosis of anemia, but recently, it has been linked to inflammation and oxidative stress, thereby gradually becoming a predictor of incidence rate and mortality in various diseases, particularly cardiovascular diseases [4, 5, 6, 7]. Despite existing studies exploring the correlation between RDW and HDP, these have primarily taken the form of case-control studies with small sample sizes [8, 9, 10]. The objective of this study is to examine the predictive effectiveness of RDW in HDP using the propensity score-matching (PSM) approach.
We reviewed the medical records of pregnant women admitted to the West China Second University Hospital, a tertiary referral center, between January 2021 and January 2022. Pregnant women aged 20–45 years who underwent scheduled examinations during pregnancy and delivered after 28 weeks of gestation at our hospital were enrolled. Participants lacking well-documented clinical reports were excluded.
The enrolled patients were divided into two groups for the cohort study. Cohort 1 comprised a comparative analysis of patients diagnosed with gestational or chronic hypertension (simple hypertension group) and a group of normal patients. Cohort 2 involved a comparison of patients diagnosed with preeclampsia (preeclampsia group), including preeclampsia, severe preeclampsia (excluding hemolysis, elevated liver enzymes, and low PLT count), and chronic hypertension with preeclampsia, with a control group of healthy patients.
Data were collected by reviewing electronic medical records. Baseline characteristics, such as age, gestational age, blood pressure, gravidity, parity, body weight gain, body mass index (BMI), comorbidities [including anemia, kidney disease, systemic lupus erythematosus (SLE), diabetes, multiple pregnancies, and intrahepatic cholestasis of pregnancy (ICP)], and gestational weeks at delivery were meticulously examined. Key blood indicators, including RDW, hemoglobin (HGB), and PLT count, were carefully recorded during the 11+6- to 13+6-week prenatal examination.
Data cleaning was performed by excluding the cases with missing values. PSM was
conducted using the MatchIt package in R software (version 4.1.3, R Foundation
for Statistical Computing, Vienna, Austria) to establish balanced cohorts based
on all available demographic and clinical covariates, including maternal age,
BMI, gestational age, parity, chronic hypertension, and diabetes. We employed
nearest neighbor matching with a 1:1 ratio and a caliper width of 0.1. Propensity
score distribution consistency between groups was verified by visual inspection
of pre- and post-matching histograms. Finally, we confirmed the cohort
comparability by statistically comparing all demographic and clinical
characteristics between the groups after matching. Continuous variables that
violated the normality assumption based on the Kolmogorov-Smirnov tests are
presented as medians [interquartile ranges (IQRs)] and were compared using the
Wilcoxon rank-sum test. Categorical variables are presented as frequencies
(percentages) and were compared using the
During the study period, our hospital admitted 20,445 pregnant women, of whom 15,662 met the inclusion criteria. The baseline characteristics of patients before PSM are shown in Supplementary Table 1. Following a 1:1 PSM, the analysis included 1546 women (420, 353, and 773 in the hypertension, preeclampsia, and matched control groups, respectively). The selection process is illustrated in Fig. 1. The baseline characteristics of the enrolled patients post-PSM are presented in Tables 1,2. Except for RDW, other baseline data, including age and complications [SLE, antiphospholipid syndrome (APS), and gestational diabetes mellitus (GDM)], showed no statistically significant differences.
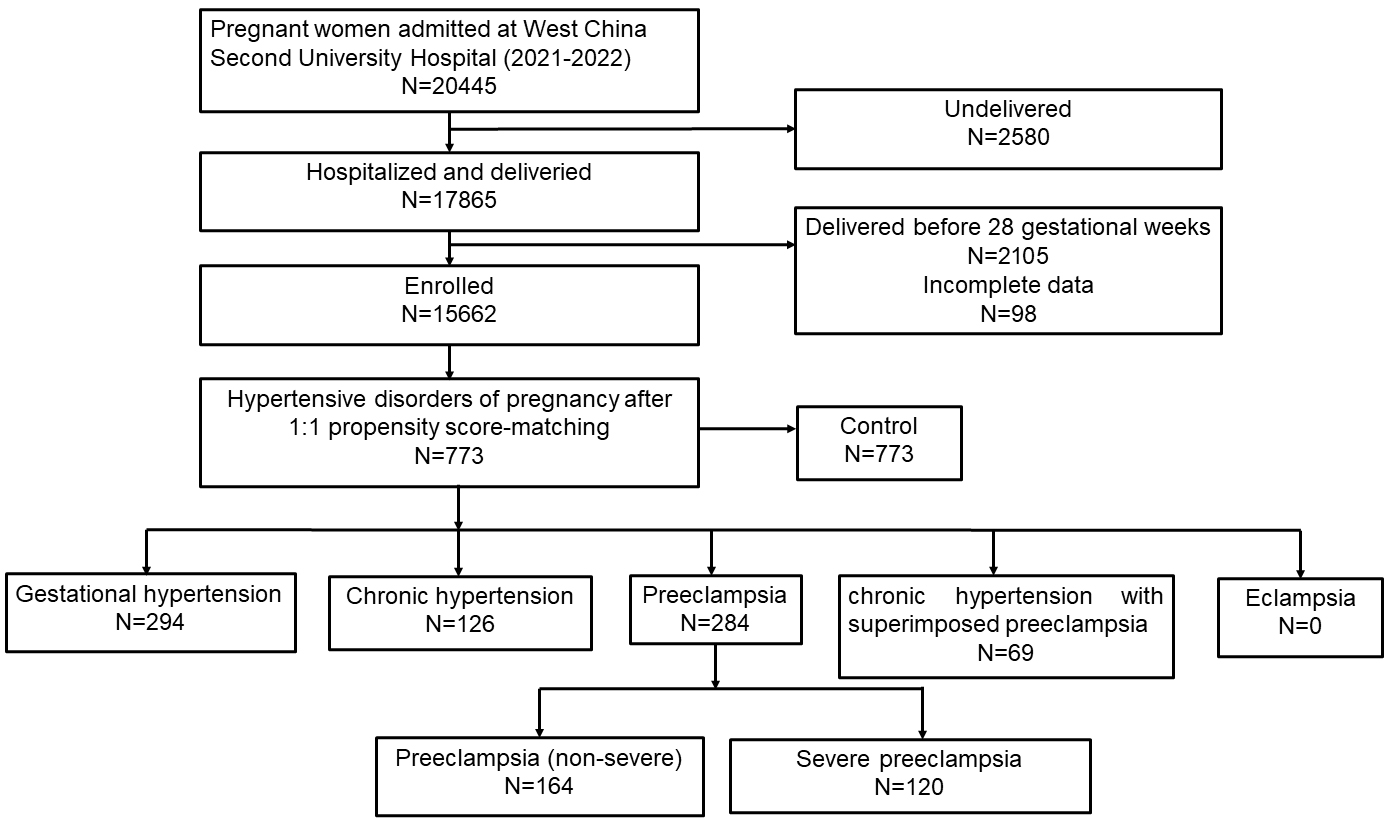 Fig. 1.
Flow chart of patients’ selection.
| Characteristics | Control (N = 420) | Hypertension (N = 420) | p | |
| RDWCV1 (%), median (IQR) | 13.52 (13.31–14.12) | 13.81 (13.10–14.40) | 6.09 × 10⁻³ | |
| RDWSD (fL), median (IQR) | 45.55 (43.18–47.92) | 45.61 (43.43–48.23) | 0.51 | |
| Age (years), median (IQR) | 32 (30–35) | 32 (29–36) | 0.76 | |
| Gestation days (days), median (IQR) | 273.0 (262–276) | 270.5 (265–275) | 0.04 | |
| Gain weight (kg), median (IQR) | 12.5 (10.0–15.0) | 13.0 (9.5–16.0) | 0.71 | |
| BMI (kg/m2), median (IQR) | 21.25 (19.310–23.150) | 20.86 (19.447–23.127) | 0.27 | |
| WBC (×109/L), median (IQR) | 9.10 (7.60–10.80) | 9.15 (7.58–10.83) | 0.76 | |
| NEUT (×109/L), median (IQR) | 6.820 (5.5100–8.6100) | 6.845 (5.5225–8.5025) | 0.71 | |
| LYMPH (×109/L), median (IQR) | 1.59 (1.2900–1.9800) | 1.64 (1.2800–1.9625) | 0.96 | |
| HGB (g/L), median (IQR) | 126 (116.75–133.00) | 126 (117.00–133.00) | 0.78 | |
| PLT (×109/L), median (IQR) | 188.0 (155.00–227.25) | 190.5 (147.00–228.00) | 0.77 | |
| Nationality, n (%) | 0.84 | |||
| Han | 406 (96.7%) | 407 (96.9%) | ||
| Others | 14 (3.3%) | 13 (3.1%) | ||
| Occupation, n (%) | 0.18 | |||
| Employed | 405 (96.4%) | 397 (94.5%) | ||
| Unemployed | 15 (3.6%) | 23 (5.5%) | ||
| Number of pregnancies, n (%) | 0.33 | |||
| 1 | 150 (35.7%) | 144 (34.3%) | ||
| 2 | 125 (29.8%) | 111 (26.4%) | ||
| 145 (34.5%) | 165 (39.3%) | |||
| Number of abortions, n (%) | 0.40 | |||
| 0 | 198 (47.1%) | 189 (45.0%) | ||
| 1 | 131 (31.2%) | 123 (29.3%) | ||
| 2 | 66 (15.7%) | 71 (16.9%) | ||
| 25 (6.0%) | 37 (8.8%) | |||
| Number of births, n (%) | 0.99 | |||
| 0 | 278 (66.2%) | 274 (65.2%) | ||
| 1 | 135 (32.1%) | 138 (32.9%) | ||
| 2 | 6 (1.4%) | 7 (1.7%) | ||
| 1 (0.2%) | 1 (0.2%) | |||
| Mode of conception, n (%) | 0.42 | |||
| Normal | 366 (87.1%) | 358 (85.2%) | ||
| Assisted reproduction | 54 (12.9%) | 62 (14.8%) | ||
| Fetal malformation, n (%) | 0.28 | |||
| No | 411 (97.9%) | 415 (98.8%) | ||
| Yes | 9 (2.1%) | 5 (1.2%) | ||
| Amniotic fluid abnormality, n (%) | 0.60 | |||
| No | 401 (95.5%) | 404 (96.2%) | ||
| Yes | 19 (4.5%) | 16 (3.8%) | ||
| Nephropathy, n (%) | 0.85 | |||
| No | 405 (96.4%) | 406 (96.7%) | ||
| Yes | 15 (3.6%) | 14 (3.3%) | ||
| SLE, n (%) | 1.00 | |||
| No | 415 (98.8%) | 416 (99.0%) | ||
| Yes | 5 (1.2%) | 4 (1.0%) | ||
| APS, n (%) | 0.52 | |||
| No | 416 (99.0%) | 414 (98.6%) | ||
| Yes | 4 (1.0%) | 6 (1.4%) | ||
| GDM, n (%) | 0.66 | |||
| No | 284 (67.6%) | 278 (66.2%) | ||
| Yes | 136 (32.4%) | 142 (33.8%) | ||
| Hepatitis B, n (%) | 0.87 | |||
| No | 400 (95.2%) | 399 (95.0%) | ||
| Yes | 20 (4.8%) | 21 (5.0%) | ||
| Twins, n (%) | 0.49 | |||
| No | 389 (92.6%) | 394 (93.8%) | ||
| Yes | 31 (7.4%) | 26 (6.2%) | ||
| ICP, n (%) | 0.58 | |||
| No | 390 (92.9%) | 394 (93.8%) | ||
| Yes | 30 (7.1%) | 26 (6.2%) | ||
| Placenta previa, n (%) | 1.00 | |||
| No | 407 (96.9%) | 407 (96.9%) | ||
| Yes | 13 (3.1%) | 13 (3.1%) | ||
| Heart disease, n (%) | - | |||
| No | 420 (100%) | 420 (100%) | ||
| Yes | 0 (0%) | 0 (0%) | ||
| Arhythmia, n (%) | 1.00 | |||
| No | 410 (97.6%) | 410 (97.6%) | ||
| Yes | 10 (2.4%) | 10 (2.4%) | ||
| Scarred uterus, n (%) | 0.66 | |||
| No | 80 (19.0%) | 85 (20.2%) | ||
| Yes | 340 (81.0%) | 335 (79.8%) | ||
| RH negative blood, n (%) | 0.76 | |||
| No | 414 (98.6%) | 415 (98.8%) | ||
| Yes | 6 (1.4%) | 5 (1.2%) | ||
| Anemia, n (%) | 0.81 | |||
| No | 383 (91.2%) | 385 (91.7%) | ||
| Yes | 37 (8.8%) | 35 (8.3%) | ||
| Fetal macrosomia, n (%) | 0.65 | |||
| No | 409 (97.4%) | 411 (97.9%) | ||
| Yes | 11 (2.6%) | 9 (2.1%) | ||
| FGR, n (%) | 0.65 | |||
| No | 411 (97.9%) | 409 (97.4%) | ||
| Yes | 9 (2.1%) | 11 (2.6%) | ||
| Thyroid dysfunction, n (%) | 0.64 | |||
| No | 348 (82.9%) | 353 (84.0%) | ||
| Hyperthyroidism | 0 (0%) | 0 (0%) | ||
| Hypothyroidism | 72 (17.1%) | 67 (16.0%) | ||
| Depression, n (%) | 0.76 | |||
| No | 307 (73.1%) | 303 (72.1%) | ||
| Yes | 113 (26.9%) | 117 (27.9%) | ||
| Dead fetus in uterus, n (%) | 1.00 | |||
| No | 418 (99.5%) | 419 (99.8%) | ||
| Yes | 2 (0.5%) | 1 (0.2%) | ||
RDWCV, red blood cell distribution width coefficient of variation; RDWSD, red blood cell distribution width standard deviation; IQR, interquartile range; BMI, body mass index; WBC, white blood cell; NEUT, neutrophil granulocyte; LYMPH, lymphocyte; HGB, hemoglobin; PLT, platelet; SLE, systemic lupus erythematosus; APS, antiphospholipid syndrome; GDM, gestational diabetes mellitus; ICP, intrahepatic cholestasis of pregnancy; FGR, fetal growth restriction.
| Characteristics | Control (N = 353) | Preeclampsia (N = 353) | p | |
| RDWCV1, median (IQR) | 13.80 (1.20) | 14 (1.60) | ||
| RDWSD, median (IQR) | 46.40 (5.10) | 46.80 (6.30) | 0.03 | |
| Age, median (IQR) | 32 (6) | 32 (7) | 0.57 | |
| Gestation days, median (IQR) | 268 (24) | 261 (21) | 0.21 | |
| Gain weight, median (IQR) | 12 (5.50) | 12 (6) | 0.85 | |
| BMI, median (IQR) | 20.72 (3.43) | 20.70 (3.49) | 0.80 | |
| WBC, median (IQR) | 8.90 (3.60) | 9 (3) | 0.71 | |
| NEUT, median (IQR) | 6.75 (3.18) | 6.62 (2.96) | 0.62 | |
| LYMPH, median (IQR) | 1.57 (0.65) | 1.60 (0.66) | 0.51 | |
| HGB, median (IQR) | 122 (16) | 124 (17) | 0.06 | |
| PLT, median (IQR) | 182 (71) | 184 (83) | 0.94 | |
| Nationality, n (%) | 0.33 | |||
| Han | 337 (95.50%) | 342 (96.90%) | ||
| Others | 16 (4.50%) | 11 (3.10%) | ||
| Occupation, n (%) | 0.15 | |||
| Employed | 316 (89.50%) | 327 (92.60%) | ||
| Unemployed | 37 (10.50%) | 26 (7.40%) | ||
| Number of pregnancies, n (%) | 0.39 | |||
| 1 | 134 (38%) | 139 (39.40%) | ||
| 2 | 109 (30.90%) | 93 (26.30%) | ||
| 110 (31.20%) | 121 (34.30%) | |||
| Number of abortions, n (%) | 0.51 | |||
| 0 | 184 (52.10%) | 176 (49.90%) | ||
| 1 | 97 (27.50%) | 93 (26.30%) | ||
| 2 | 42 (11.90%) | 56 (15.90%) | ||
| 30 (8.50%) | 28 (7.90%) | |||
| Number of births, n (%) | 0.78 | |||
| 0 | 232 (65.70%) | 243 (68.80%) | ||
| 1 | 109 (30.90%) | 101 (28.60%) | ||
| 2 | 10 (2.80%) | 7 (2%) | ||
| 2 (0.60%) | 2 (0.60%) | |||
| Mode of conception, n (%) | 0.74 | |||
| Normal | 257 (72.80%) | 253 (71.70%) | ||
| Assisted reproduction | 96 (27.20%) | 100 (28.30%) | ||
| Fetal malformation, n (%) | 0.43 | |||
| No | 347 (98.30%) | 344 (97.50%) | ||
| Yes | 6 (1.70%) | 9 (2.50%) | ||
| Amniotic fluid abnormality, n (%) | 0.76 | |||
| No | 328 (92.90%) | 330 (93.50%) | ||
| Yes | 25 (7.10%) | 23 (6.50%) | ||
| Nephropathy, n (%) | 1 | |||
| No | 333 (94.30%) | 333 (94.30%) | ||
| Yes | 20 (5.70%) | 20 (5.70%) | ||
| SLE, n (%) | 1 | |||
| No | 350 (99.20%) | 351 (99.40%) | ||
| Yes | 3 (0.80%) | 2 (0.60%) | ||
| APS, n (%) | 0.63 | |||
| No | 345 (97.70%) | 343 (97.20%) | ||
| Yes | 8 (2.30%) | 10 (2.80%) | ||
| GDM, n (%) | 0.67 | |||
| No | 257 (72.80%) | 252 (71.40%) | ||
| Yes | 96 (27.20%) | 101 (28.60%) | ||
| Hepatitis B, n (%) | 0.52 | |||
| No | 334 (94.60%) | 330 (93.50%) | ||
| Yes | 19 (5.40%) | 23 (6.50%) | ||
| Twins, n (%) | 0.57 | |||
| No | 286 (81%) | 280 (79.30%) | ||
| Yes | 67 (19%) | 73 (20.70%) | ||
| ICP, n (%) | 1 | |||
| No | 323 (91.50%) | 323 (91.50%) | ||
| Yes | 30 (8.50%) | 30 (8.50%) | ||
| Placenta previa, n (%) | 0.47 | |||
| No | 325 (92.10%) | 330 (93.50%) | ||
| Yes | 28 (7.90%) | 23 (6.50%) | ||
| Heart disease, n (%) | 1 | |||
| No | 352 (99.70%) | 351 (99.40%) | ||
| Yes | 1 (0.30%) | 2 (0.60%) | ||
| Arhythmia, n (%) | 0.81 | |||
| No | 344 (97.50%) | 345 (97.70%) | ||
| Yes | 9 (2.50%) | 8 (2.30%) | ||
| Scarred uterus, n (%) | 0.27 | |||
| No | 288 (81.60%) | 299 (84.70%) | ||
| Yes | 65 (18.40%) | 54 (15.30%) | ||
| RH negative blood, n (%) | 0.48 | |||
| No | 353 (100%) | 351 (99.40%) | ||
| Yes | 0 (0%) | 2 (0.60%) | ||
| Anemia, n (%) | 0.57 | |||
| No | 307 (87%) | 312 (88.40%) | ||
| Yes | 46 (13%) | 41 (11.60%) | ||
| Fetal macrosomia, n (%) | 0.44 | |||
| No | 337 (95.50%) | 341 (96.60%) | ||
| Yes | 16 (4.50%) | 12 (3.40%) | ||
| FGR, n (%) | 0.82 | |||
| No | 309 (87.50%) | 311 (88.10%) | ||
| Yes | 44 (12.50%) | 42 (11.90%) | ||
| Thyroid dysfunction, n (%) | 0.38 | |||
| No | 294 (83.30%) | 285 (80.70%) | ||
| Hyperthyroidism | 0 (0%) | 0 (0%) | ||
| Hypothyroidism | 59 (16.70%) | 68 (19.30%) | ||
| Depression, n (%) | 0.72 | |||
| No | 272 (77.10%) | 268 (75.90%) | ||
| Yes | 81 (22.90%) | 85 (24.10%) | ||
| Dead fetus in uterus, n (%) | 1 | |||
| No | 347 (98.30%) | 347 (98.30%) | ||
| Yes | 6 (1.70%) | 6 (1.70%) | ||
The patient characteristics before (Supplementary Table 1) and after
(Tables 1,2) PSM are listed. Table 1 displays p-values exceeding 0.05,
indicating the absence of statistical differences in all factors between the two
groups except for RDWCV1 (p
| Comparison | Characteristics | Beta | SE | score | OR (95% CI) | p |
| Control vs. simple hypertension group | RDWCV1 | 0.12 | 0.07 | 1.81 | 1.13 (0.99, 1.28) | 0.07 |
| Gestation days | 0.01 | 0.00 | 1.18 | 1.01 (0.99, 1.01) | 0.24 | |
| Length of stay | 0.02 | 0.02 | 1.10 | 1.02 (0.99, 1.05) | 0.27 | |
| Control vs. preeclampsia group | RDWCV1 | 0.16 | 0.05 | 3.00 | 1.18 (1.06, 1.31) | |
| RDWSD | 0.05 | 0.01 | 3.29 | 1.05 (1.02, 1.08) | ||
| Gestation days | 0.00 | 0.00 | –0.76 | 1.00 (1.00, 1.00) | 0.45 | |
| Length of stay | 0.00 | 0.01 | 0.20 | 1.00 (0.98, 1.02) | 0.84 |
Simple hypertension group: including gestational hypertension and chronic hypertension.
Preeclampsis group: including preeclampsis, severe preeclampsis, chronic hypertension with superimposed preeclampsis.
OR, odds ratio.
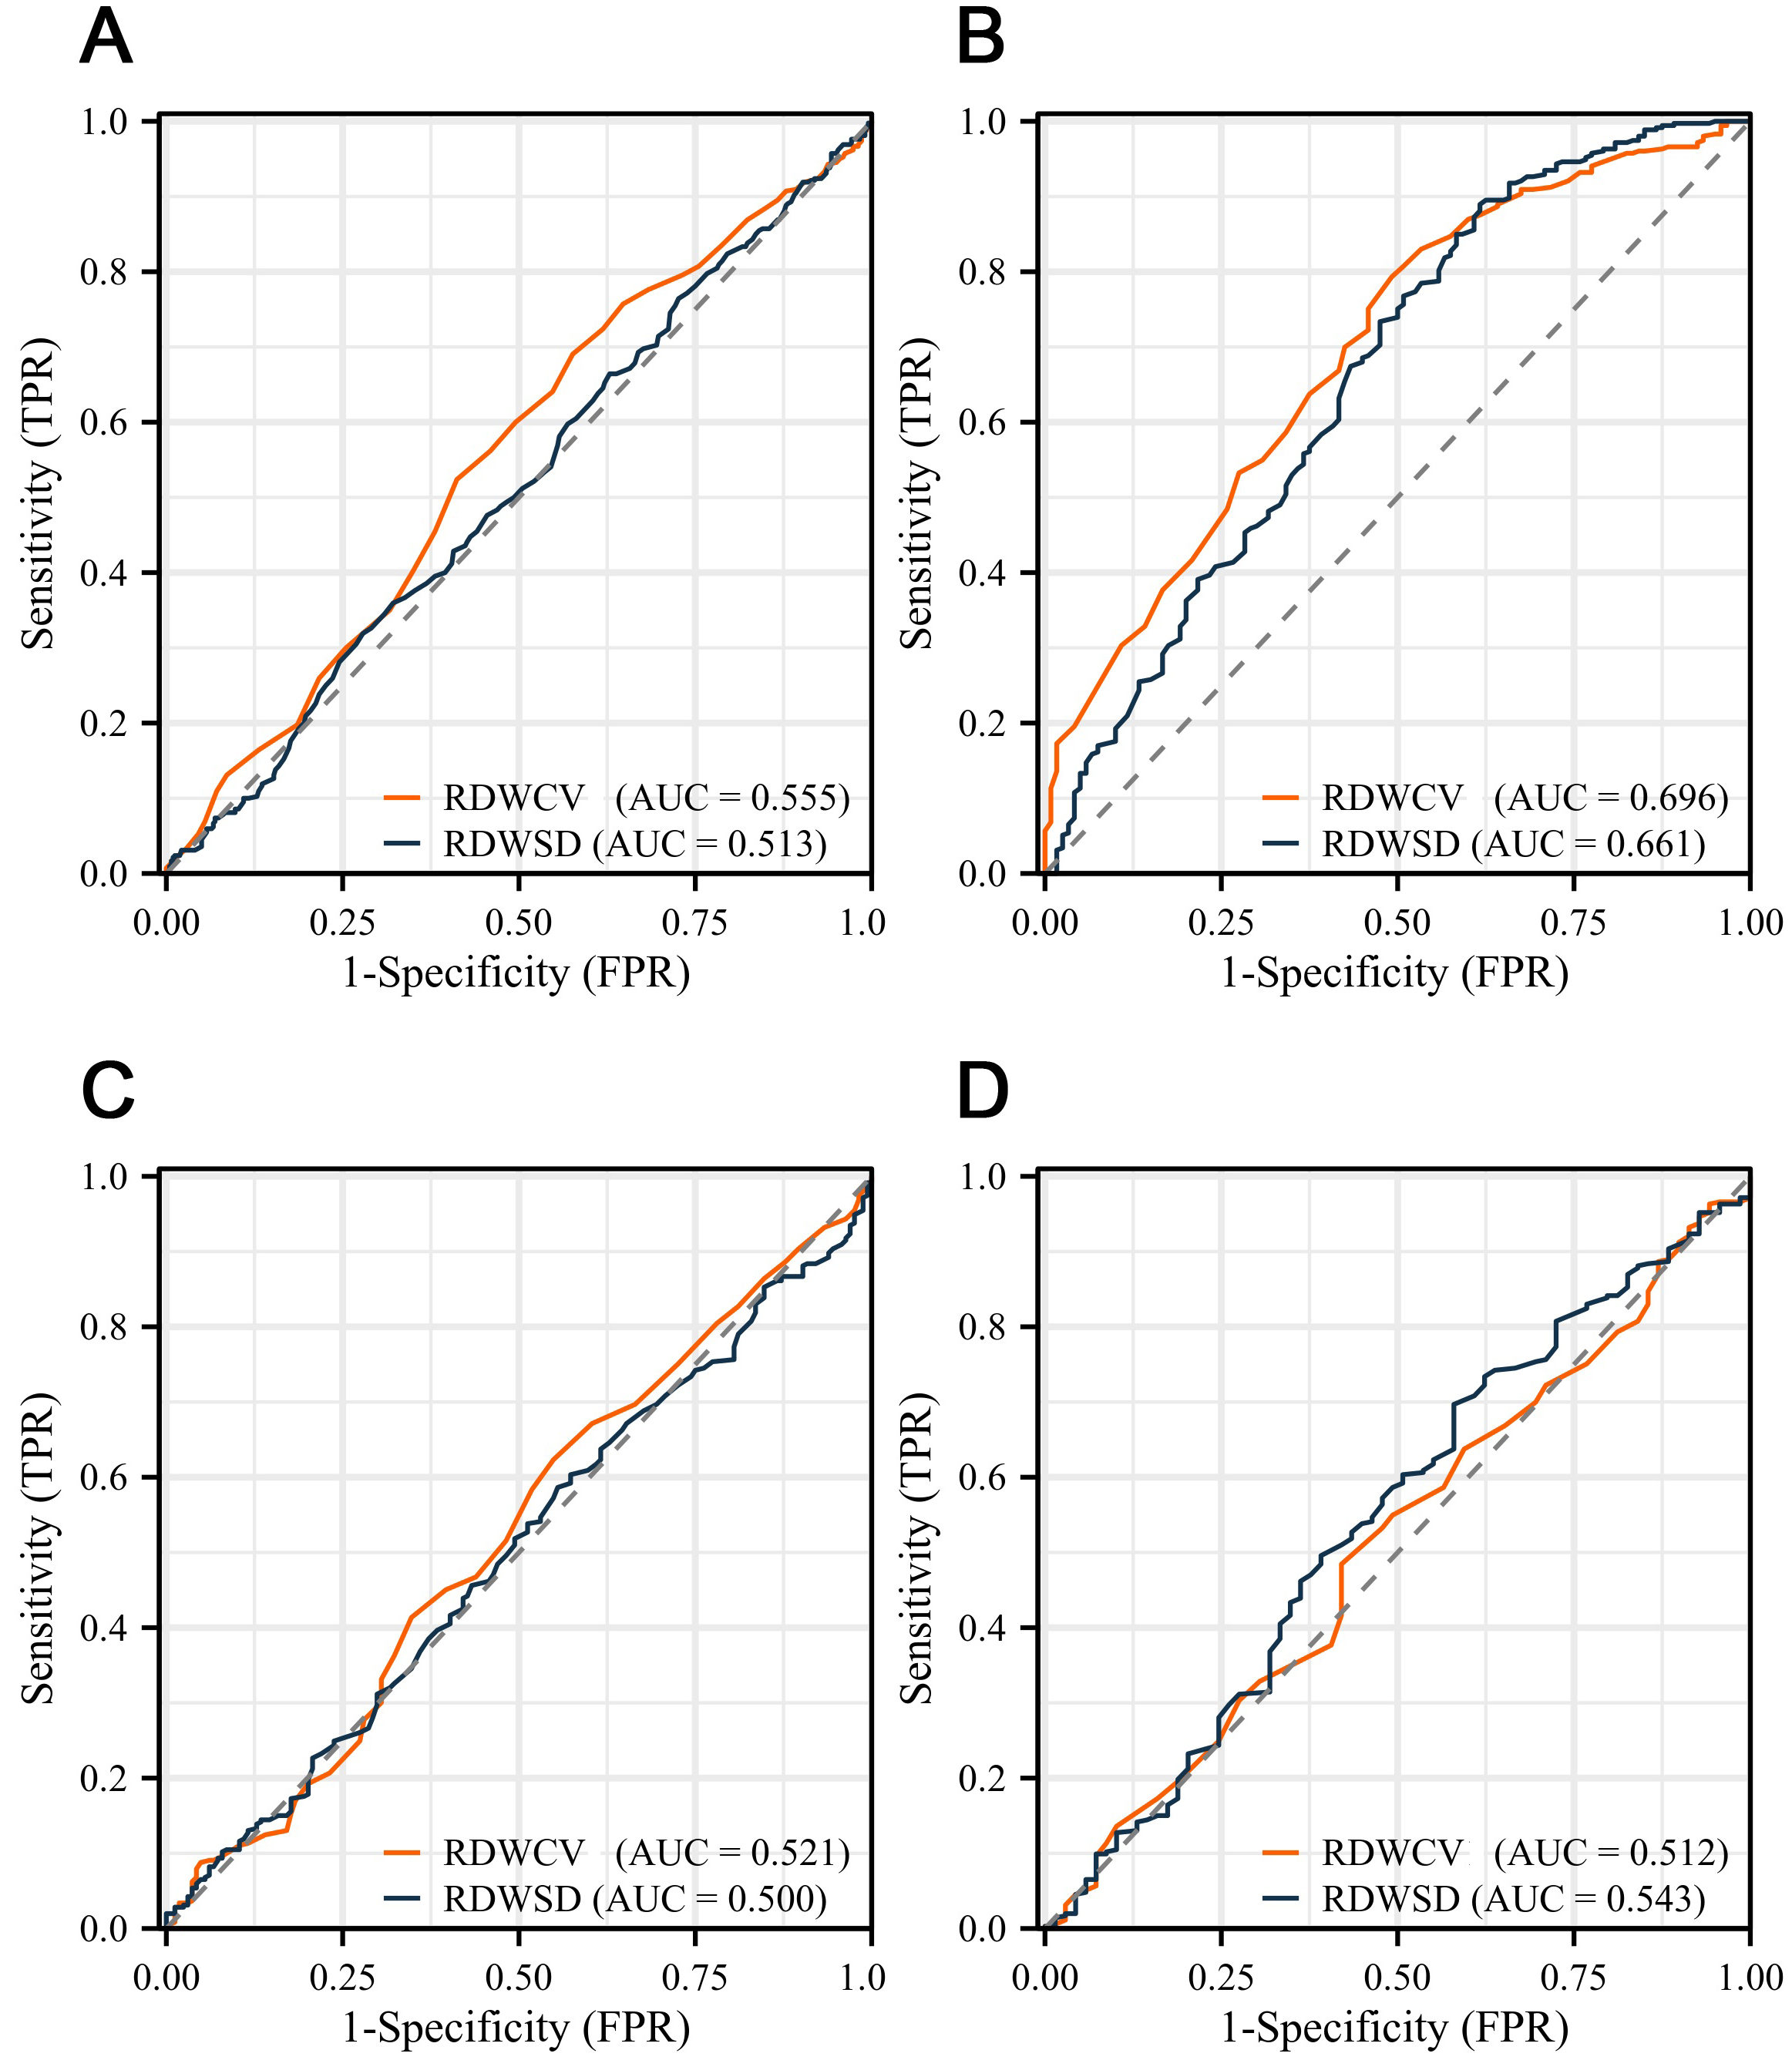 Fig. 2.
The receiver operating characteristic (ROC) curve analysis of red blood cell distribution width (RDW) in hypertensive disorders of pregnancy (HDP). (A) In gestational hypertension or chronic hypertension. (B) In severe preeclampsia. (C) In preeclampsia (non-severe preeclampsia). (D) Chronic hypertension with superimposed preeclampsia. RDWCV, red blood cell distribution width coefficient of variation; RDWSD, red blood cell distribution width standard deviation; AUC, area under the curve; TPR, true positive rate; FPR, false positive rate.
After PSM, 626 patients were included in the preeclampsia and matched control
groups. Univariate logistic regression analysis of variables not corrected after
PSM revealed a significant correlation between RDW and preeclampsia (p
Subsequently, we assessed the diagnostic value of the RDW in each subgroup. ROC
curve analysis revealed that RDWCV possessed a diagnostic accuracy of 72% for
severe preeclampsia, with an RDWCV threshold of
ROC curve analysis showed that RDW exhibited a relatively low diagnostic value for preeclampsia (non-severe preeclampsia) (AUC of RDWCV = 0.521, AUC of RDWSD = 0.500) (Fig. 2C) and chronic hypertension with superimposed preeclampsia (AUC of RDWCV = 0.512, AUC of RDWSD = 0.543) (Fig. 2D).
Preeclampsia is one of the most serious complications of pregnancy and poses significant risks to both maternal and fetal health. Early detection can enhance prognosis, although exploratory research with samples from established cases has identified potential biomarkers [such as soluble fms-like tyrosine kinase-1 (sFlt1)/placental growth factor (PlGF) ratio, PlGF alone, alpha-fetoprotein (AFP)/pregnancy-associated plasma protein-A (PAPP-A) ratio, placental protein 13 (PP 13), and growth differentiation factor 15 (GDF I5)] [11]. However, no ideal predictive biomarkers have been identified.
Several studies have explored the relationship between RDW and HDP, primarily
using case-control designs with limited sample sizes [8, 9, 10], yielding
inconsistent conclusions [12]. A meta-analysis indicated that RDW levels
correlated with various HDP subtypes except for preeclampsia [13].
Mechanistically, RDWCV, calculated as (standard deviation of red blood cell
volume/mean cell volume)
HDP is among the most frequent complications during pregnancy, with preeclampsia affecting 3–5% of pregnancies [14, 15, 16]. Currently, it is widely acknowledged that the placenta plays a pivotal role in preeclampsia development. The infiltration of trophoblast cells into the uterine wall during early pregnancy leads to the remodeling of the uterine spiral arteries. If arterial infiltration is impaired or incomplete, hypoxia or reperfusion injury may occur, exacerbating the production of reactive oxygen species and triggering oxidative stress in the placenta. When oxidative stress is initiated, it leads to increased synthesis of pro-inflammatory factors, ultimately resulting in an intensified inflammatory response and endothelial dysfunction, contributing to preeclampsia development [17, 18, 19, 20, 21].
RDW is an easily obtainable and cost-effective hematological parameter that reflects variations in red blood cell volume. A growing body of research has identified a correlation between RDW and hypertension, as well as its severity. Additionally, an elevated RDW is associated with a poorer prognosis in various cardiovascular disorders, including acute myocardial infarction and heart failure. The association between RDW and preeclampsia can be attributed to heightened inflammation and oxidative stress. Inflammation can disrupt iron metabolism, potentially shortening the lifespan of red blood cells and consequently increasing RDW [22, 23]. Inflammation might also hinder erythropoietin production, leading to the release of immature red blood cells into the bloodstream [24, 25]. Additionally, oxidative stress and damage, the key characteristics of preeclampsia, may also contribute to an increase in RDW [26]. Elevated RDW values can reflect disease severity.
This study had certain limitations. First, as a PSM study, unmatched cases from each group were excluded, thereby reducing the overall sample size. Second, this study did not examine the relationship between RDW and patient prognosis. Third, this study was based on a single-center Chinese Han population, which limits the generalizability of our findings. RDW cutoffs may vary across ethnicities owing to genetic differences in erythropoiesis or inflammatory responses. External validation of multiethnic cohorts is essential prior to clinical adoption.
RDW was significantly associated with severe preeclampsia. However, its standalone diagnostic accuracy (AUC 0.661–0.696) remains moderate. Although the low cost, speed, and availability of RDW are advantageous, its primary clinical utility is likely to be as an auxiliary component within combinatorial risk models or multi-marker panels, augmenting rather than replacing established predictors. Future research must prioritize validating the additive prognostic value of RDW in such integrated approaches compared with current standards.
RDW, red blood cell distribution width; HDP, hypertensive disorders of pregnancy; PSM, propensity score-matching; ROC, receiver operating characteristic; AUC, area under the curve; BMI, body mass index; IQR, interquartile range; RDWCV, red blood cell distribution width coefficient of variation; RDWSD, red cell distribution width standard deviation; WBC, white blood cell; SLE, systemic lupus erythematosus; APS, antiphospholipid syndrome; GDM, gestational diabetes mellitus; ICP, intrahepatic cholestasis of pregnancy; OR, odds ratio; FGR, fetal growth restriction; sFlt1, soluble fms-like tyrosine kinase-1; PlGF, placental growth factor; AFP, alpha-fetoprotein; PAPP-A, pregnancy-associated plasma protein-A; GDF I5, growth differentiation factor 15; MCV, mean corpuscular volume; TPR, true positive rate; FPR, false positive rate; PP 13, placental protein 13; NEUT, neutrophil granulocyte; LYMPH, lymphocyte; HGB, hemoglobin; PLT, platelet.
The datasets used and analyzed during the current study are available from the corresponding author on reasonable request.
BL and HC planned the cohort. BL collected the data. BL, LH, YC, XL, HC analyzed and interpreted the data. All authors contributed to editorial changes in the manuscript. All authors read and approved the final manuscript. All authors have participated sufficiently in the work and agreed to be accountable for all aspects of the work.
The study was conducted in accordance with the Declaration of Helsinki. The research protocol was approved by the Ethics Committee of West China Second University Hospital (Ethic Approval Number: 2023154), and all of the participants provided signed informed consent.
Not applicable.
This research received no external funding.
The authors declare no conflict of interest.
Supplementary material associated with this article can be found, in the online version, at https://doi.org/10.31083/CEOG39720.
References
Publisher’s Note: IMR Press stays neutral with regard to jurisdictional claims in published maps and institutional affiliations.