


 , Pei Wang 1, Jie Liu 1,*
1 Department of Obstetrics, Hangzhou Women’s Hospital (Hangzhou Maternity and Child Health Care Hospital), 310008 Hangzhou, Zhejiang, China
Abstract
Preeclampsia (PE) is a common complication of pregnancy and there is currently a lack of valuable diagnostic and predictive methods for it. This study aimed to explore the association between renal function markers, blood lipid levels in late pregnancy and PE, then assess the combined predictive value for PE.
This was a retrospective case-control study that selected 263 eligible patients in late pregnancy diagnosed with PE as the case group and 264 healthy parturients as the control group. All participants were hospitalized from January 2021 to December 2023. The levels of serum renal function [creatinine (Cr), uric acid (UA) and urea] and blood lipid [total cholesterol (TC), triglycerides (TG) and high-density lipoprotein (HDL)] were compared between two groups. Logistic regression analysis was used to explore the association between these indicators and PE. Then the receiver operating characteristic (ROC) curve was drawn to evaluate the predictive value of them for PE. p < 0.05 was considered statistically significant.
Univariate analysis showed that the PE group had significantly higher levels of TG, Cr, UA, and urea than the control group [3.56 (3.01–4.38) mmol/L vs. 2.98 (2.50–3.42) mmol/L, 54.00 (47.00–62.00) μmol/L vs. 46.00 (42.00–51.00) μmol/L, 367.00 (305.50–425.00) μmol/L vs. 278.00 (244.00–306.00) μmol/L, 3.50 (2.75–4.40) mmol/L vs. 2.90 (2.60–3.55) mmol/L respectively]. Multivariable analysis showed that the serum TG [adjusted odds ratio (AOR) = 1.827 (95% confidence interval (95% CI) = 1.277–2.615)], Cr [AOR = 1.066 (95% CI = 1.028–1.106)] and UA [AOR = 1.016 (95% CI = 1.011–1.022)] were risk factors for PE (p < 0.001). ROC curves revealed that areas under the curve (AUC) were 0.703 (95% CI = 0.658–0.747), 0.734 (95% CI = 0.691–0.777) and 0.822 (95% CI = 0.786–0.857) respectively. The AUC, sensitivity and specificity of the combination of TG, Cr and UA were 0.864 (95% CI = 0.833–0.896), 76.4%, and 84.8%.
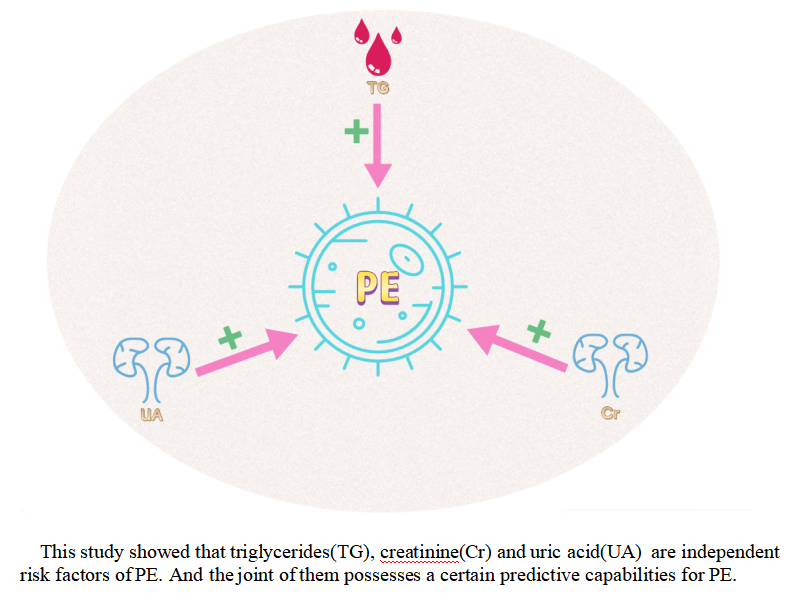
The increased levels of serum TG, Cr and UA imply greater possibility of PE, thus they are considered as the risk factors. And their combination has a certain predictive value for PE, which may offer a fresh, convenient and efficient method for the diagnosis and treatment of PE.
Graphical Abstract
Keywords
- blood lipid
- creatinine
- uric acid
- triglycerides
- preeclampsia
- predict
Hypertensive disorder of pregnancy stands as one of the prevalent complications during pregnancy, especially preeclampsia (PE), being a particularly serious form that can profoundly impact both pregnant women and fetuses. The global incidence rate of PE amounts to 5–8% [1]. Clinically, it is characterized by the emergence of hypertension, edema, and the presence of urinary protein [2]. These symptoms tend to progress in pace with the pregnancy advances, even leading to grave consequences. In severe instances, it would culminate in terminal organ damage, seizures, and is a significant contributing factor to maternal and fetal mortality [3].
Previous study has demonstrated that PE will inflict detrimental effects on numerous organs, encompassing the brain, kidneys, liver, cardiovascular system, blood system, uterus, placenta, and more [4]. The fundamental pathological and physiological alterations associated with PE involve systemic small vessel spasms and endothelial injury, stemming from a complex interplay of various factors, mechanisms, and pathways [5]. Despite extensive research, the precise etiology and pathogenesis of PE remain incompletely understood to this day [6].
The sole effective treatment for preeclampsia is termination of pregnancy [7]. Accordingly, PE frequently results in premature delivery, heightening the rate of preterm birth [8]. Hence, discovering a clinical approach capable of predicting the onset and progression of PE is crucial for early identification and timely intervention, ultimately mitigating adverse outcomes and enhancing perinatal prognosis. Among the commonly employed detection methods in clinical settings, blood lipid and renal function determinations stand out for their accuracy, swiftness, and cost-effectiveness [9, 10]. Notably, these indicators harbor a wealth of clinical information. Consequently, this study aimed to analyze the association between these two types of laboratory indicators and PE then assess their predictive value of this disease. This might contribute a novel clinical perspective for the prevention, improved prognosis and timely treatment of PE.
All the participants were selected among 31,658 puerperants who delivered in Hangzhou Women’s Hospital (Hangzhou Maternal and Child Health Care Hospital) from January 2021 to December 2023. All patients with PE were assessed and diagnosed by seasoned obstetricians who possessed at least two decades of clinical expertise in obstetrics and took accountability for these evaluations and diagnoses. Ultimately a total of 263 patients in late pregnancy diagnosed with PE were incorporated into the case group (PE group), and 264 healthy pregnant women during the same period randomly selected as the control group (Fig. 1). Excel data were derived from the hospital information system (HIS) in the light of the principle of unique matching. This study employed biological samples and data from individuals without any identifying information for research. So an exemption from the requirement of informed consent was granted by the ethics committee. The study was approved by the Ethics Committee of Hangzhou Women’s Hospital (Medical Ethics Review A: No.2024-096). In addition, the study was conducted in accordance with the Declaration of Helsinki.
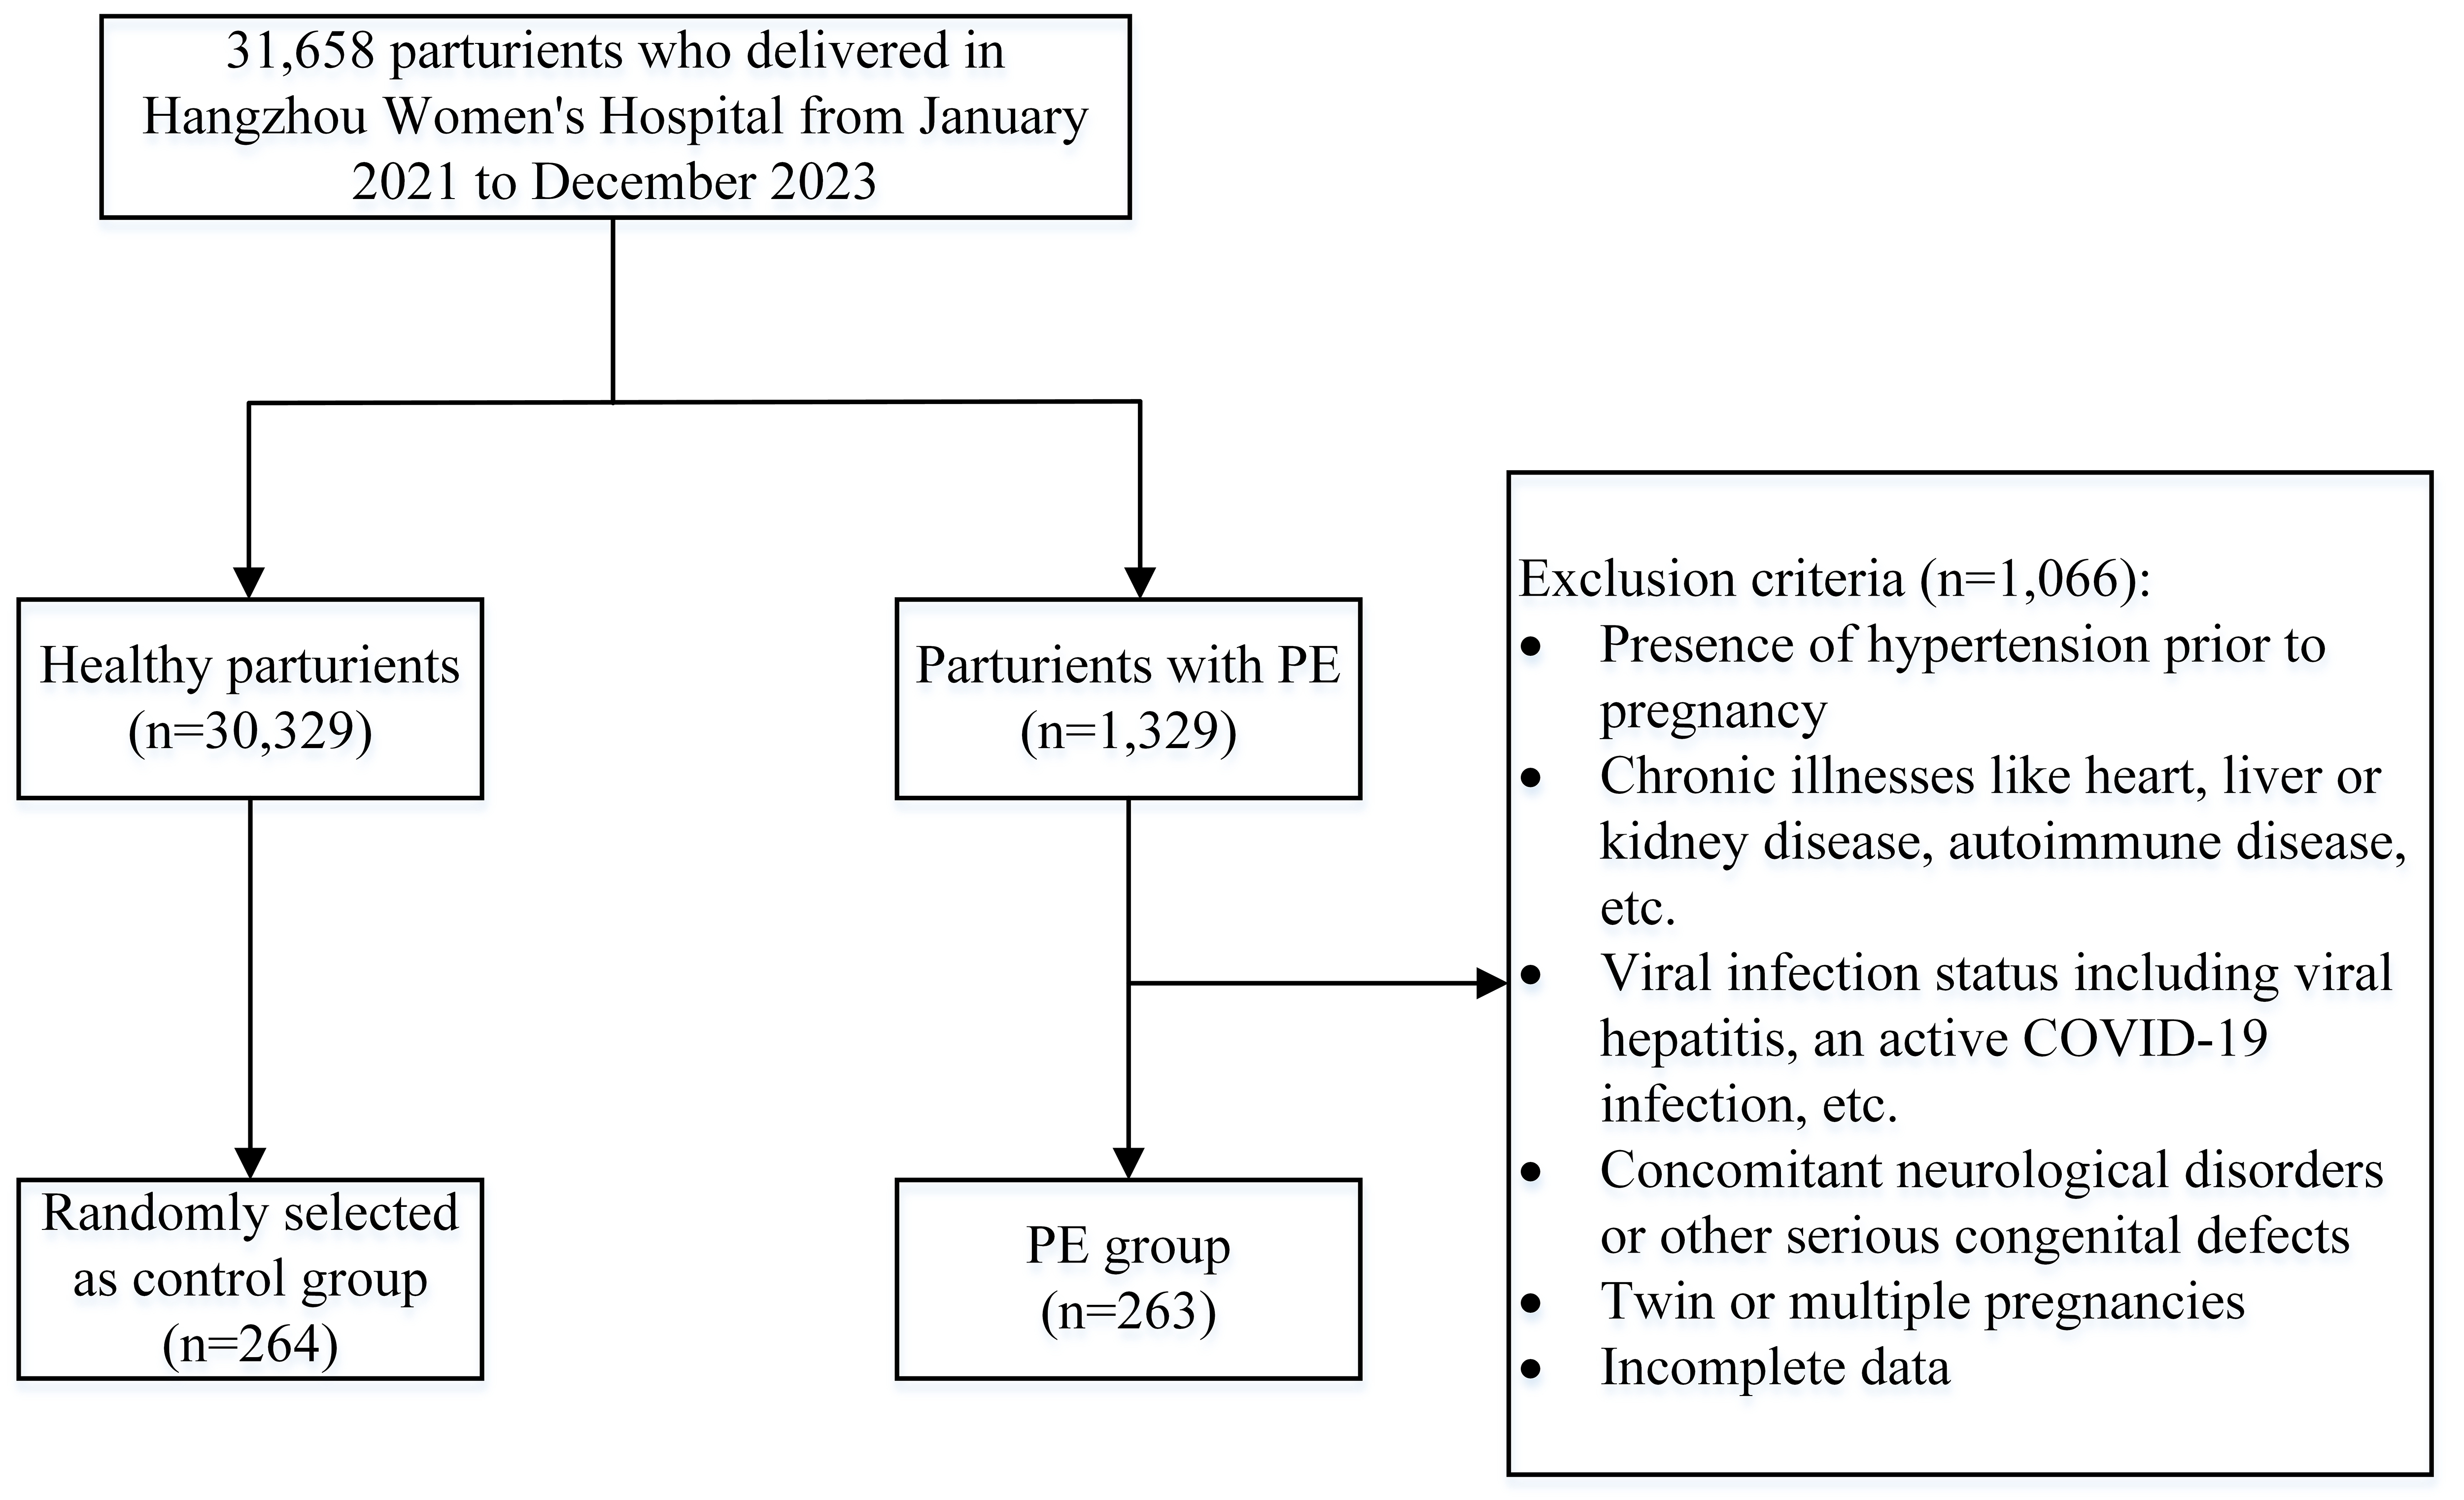 Fig. 1.
Flow chart of the study population. PE, preeclampsia; COVID-19, coronavirus disease 2019.
After the 20th week of pregnancy, a systolic blood pressure
(1) Presence of hypertension prior to pregnancy.
(2) Coupling with coronary heart disease, liver or kidney disease, diabetes, thyroid disease, autoimmune disease or any other chronic illnesses.
(3) Complications including viral hepatitis, an active coronavirus disease 2019 (COVID-19) infection or any other viral infection status.
(4) Coexisting coagulation dysfunction or recent use of drugs that affect the coagulation system.
(5) Twin or multiple pregnancies.
(6) Incomplete data.
(1) Meeting the diagnostic criteria for PE.
(2) Diagnosed and confirmed by a senior obstetrician.
(3) Inconsistent with any one of the above exclusion criteria.
The demographic data for both the PE group and control group were collected, encompassing the maternal age, gestation age, body mass index (BMI), gravidity and parity and baseline blood pressure [tested within 12th weeks of pregnancy, including systolic blood pressure (SBP) and diastolic blood pressure (DBP)].
Blood lipid markers [including total cholesterol (TC), triglycerides (TG), and high-density lipoprotein (HDL)] and renal function markers [including creatinine (Cr), uric acid (UA), and urea] were also gathered from both groups during late pregnancy.
All laboratory data was measured by the auto automatic time-resolved fluorescence immunoassay analyzer (PerkinElmer, Shelton, CT, USA). TG (Solarbio, 100T/96S; Beijing, China), TC (ZIKER, 96T/48T; Shenzhen, Guangdong, China) and HDL (Solarbio, BC5325-100T/96S; Beijing, China) were detected through enzymatic assay. Cr was determined by picric acid method (bioseth, 50T/24S; Zhenjiang, Jiangsu, China), UA was measured through uricase method (Solarbio, 50T/24S; Beijing, China), and urea was detected by Urease-GLDH method (Biosino Bio-Technology And Science Inc, semi-automatic; Beijing, China). The detection procedure was carried out according to the instructions.
All testing and follow-up personnel attended pre-employment training and obtained qualification certificates from health institutions. Retest of the remaining sample and repeated test were conducted as a part of internal quality control in the laboratories, while external quality auditors participated in activities of external quality assessment organized by the Clinical Laboratory Center of Ministry of Health twice a year and obtained activities certificates.
Statistical analysis was performed by utilizing SPSS 27.0 (IBM Corp., Armonk,
NY, USA) in this study. As an initial step, Kolmogorow-Smironov test was
conducted to determine the distribution. Median and percentile [M
(P25–P75)] were utilized to describe the skewed distribution.
Mann-Whitney U-test of independent samples was used to compare the quantitative
data between two groups, while the Chi-square test was employed for univariate
analysis of qualitative data. Furthermore, the binary logistic regression of
multivariate analysis was employed to assess the association between renal
function markers, blood lipid levels, and PE. Finally, the receiver operating
characteristic (ROC) curves of the significant indicators were generated to
evaluate their predictive value for PE by analyzing the area under the curves
(AUC). p
There was no significant statistical disparity in terms of maternal and
gestation age between the PE group and control group (p
| Indicators | Control group | PE group | Z/ |
p | |
| (n = 264) | (n = 263) | ||||
| Maternal age (years) | 28.00 (25.00–33.00) | 30.00 (25.00–33.00) | 1.219 | 0.269 | |
| BMI (kg/m2) | 25.75 (22.77–27.67) | 27.85 (25.93–30.41) | 50.414 | ||
| Gravidity | 4.010 | 0.0451 | |||
| 1 | 145 (54.92) | 167 (63.50) | |||
| 119 (45.08) | 96 (36.50) | ||||
| Parity | 26.166 | ||||
| 0 | 173 (65.53) | 223 (84.79) | |||
| 91 (34.47) | 40 (15.21) | ||||
| Gestation age (weeks) | 36.57 (36.14–37.14) | 36.43 (35.00–37.00) | 6.728 | 0.090 | |
| SBP (mmHg) | 109.00 (102.00–117.00) | 122.00 (115.00–128.00) | 96.432 | ||
| DBP (mmHg) | 63.50 (59.00–70.00) | 74.00 (69.00–80.00) | 108.433 | ||
The quantitative data were expressed by median and percentile [M
(P25–P75)], and qualitative data were expressed by n (%). 1, p
In comparison of blood lipids levels and renal function markers (Table 2), the
PE group exhibited significantly elevated levels of TG, Cr, UA and urea compared
to the control group (2.98 mmol/L vs. 3.56 mmol/L, 46.00 µmol/L vs. 54.00
µmol/L, 278.00 µmol/L vs. 367.00 µmol/L, 2.90 mmol/L vs. 3.50
mmol/L, all p
| Indicators | Control group | PE group | Z | p |
| (n = 264) | (n = 263) | |||
| TC (mmol/L) | 6.77 (6.02–7.61) | 6.77 (5.88–7.96) | 0.230 | 0.632 |
| TG (mmol/L) | 2.98 (2.50–3.42) | 3.56 (3.01–4.38) | 47.970 | |
| HDL (mmol/L) | 2.06 (1.81–2.33) | 2.03 (1.76–2.31) | 1.006 | 0.316 |
| Cr (µmol/L) | 46.00 (42.00–51.00) | 54.00 (47.00–62.00) | 70.884 | |
| UA (µmol/L) | 278.00 (244.00–306.00) | 367.00 (305.50–425.00) | 133.253 | |
| Urea (mmol/L) | 2.90 (2.60–3.55) | 3.50 (2.75–4.40) | 29.671 |
The quantitative data were expressed by median and percentile [M
(P25–P75)]. 1, p
Taking into account the interconnection of blood lipid indicators, we
incorporated TC and HDL into the logistic regression analysis, despite they were
not significant factors in the univariate analysis. After adjusting for
confounding factors such as BMI, gravidity, parity, SBP, and DBP, the binary
logistic regression analysis revealed a significant association between TG
[
| Indicators | Standard Error | Wald | Degrees of freedom | p | AOR (95% CI) | |
| BMI (kg/m2) | 0.180 | 0.047 | 14.662 | 1 | 1.197 (1.092–1.313) | |
| Gravidity | –0.022 | 0.201 | 0.012 | 1 | 0.914 | 0.978 (0.659–1.452) |
| Parity | –1.095 | 0.456 | 5.771 | 1 | 0.335 (0.137–0.817) | |
| SBP (mmHg) | 0.053 | 0.018 | 8.358 | 1 | 0.0042 | 1.054 (1.017–1.093) |
| DBP (mmHg) | 0.120 | 0.024 | 24.254 | 1 | 1.127 (1.075–1.182) | |
| TC (mmol/L) | 0.269 | 0.141 | 3.646 | 1 | 0.056 | 1.308 (0.993–1.724) |
| TG (mmol/L) | 0.603 | 0.183 | 10.877 | 1 | 1.827 (1.277–2.615) | |
| HDL (mmol/L) | –0.303 | 0.408 | 0.550 | 1 | 0.458 | 0.739 (0.332–1.645) |
| Cr (µmol/L) | 0.064 | 0.019 | 11.924 | 1 | 1.066 (1.028–1.106) | |
| UA (µmol/L) | 0.016 | 0.003 | 35.017 | 1 | 1.016 (1.011–1.022) | |
| Urea (mmol/L) | 0.266 | 0.166 | 2.570 | 1 | 0.109 | 1.304 (0.943–1.805) |
1, p
The ROC curves shown in Fig. 2 indicated that the area under the curve of TG, Cr, and UA individually for predicting PE occurrence was 0.703 (95% CI = 0.658–0.747), 0.734 (95% CI = 0.691–0.777) and 0.822 (95% CI = 0.786–0.857) respectively, meanwhile that of the combination of these three markers was 0.864 (95% CI = 0.833–0.896). The sensitivity and specificity of the joint detection of TG, Cr and UA were 76.4% and 84.8%, showing a good predictive performance (Table 4).
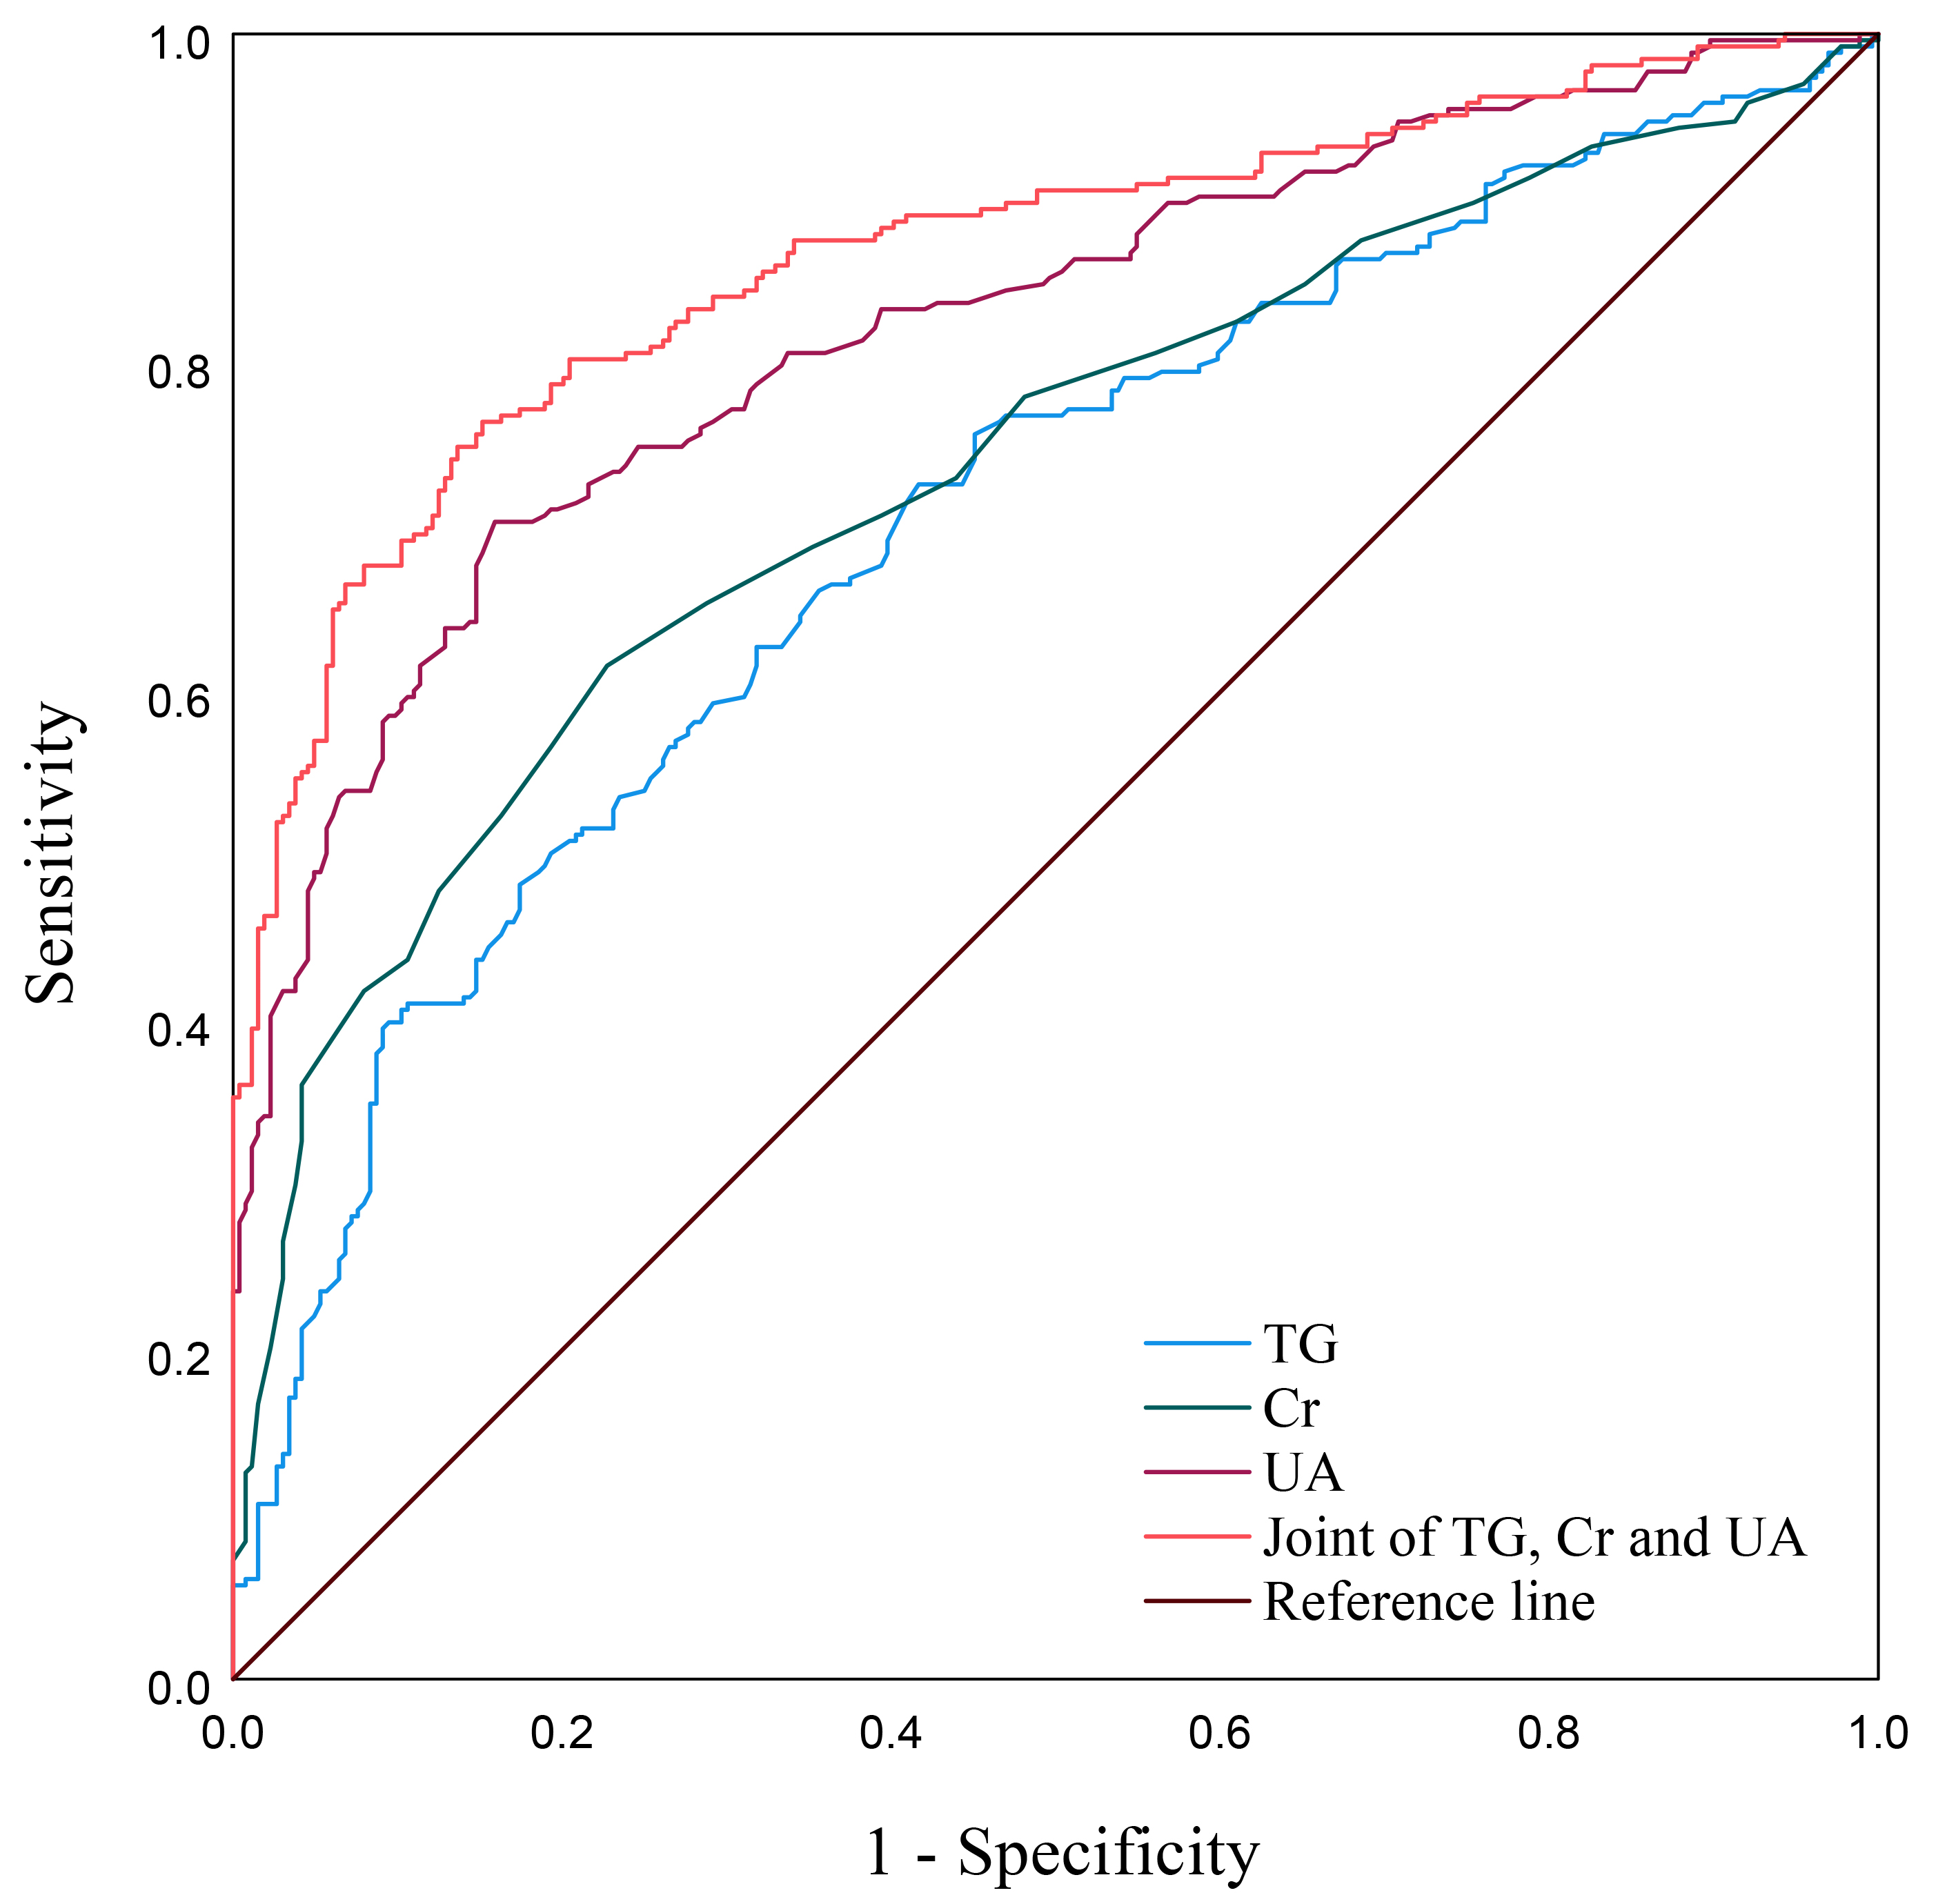 Fig. 2.
ROC curves of TG, Cr and UA for predicting PE. ROC, receiver operating characteristic; TG, triglycerides; Cr, creatinine; UA, uric acid; PE, preeclampsia.
| Indicators | AUC (95% CI) | Standard Error | p | Cutoff | Sensitivity (%) | Specificity (%) |
| TG (mmol/L) | 0.703 (0.658–0.747) | 0.023 | 0.000 | 3.07 | 72.6 | 58.3 |
| Cr (µmol/L) | 0.734 (0.691–0.777) | 0.022 | 0.000 | 51.50 | 61.6 | 77.3 |
| UA (µmol/L) | 0.822 (0.786–0.857) | 0.018 | 0.000 | 320.50 | 70.3 | 84.1 |
| Joint of TG, Cr and UA | 0.864 (0.833–0.896) | 0.016 | 0.000 | 0.498 | 76.4 | 84.8 |
PE, preeclampsia; TG, triglycerides; Cr, creatinine; UA, uric acid; AUC, area under the curves; 95% CI, 95% confidence interval.
Preeclampsia (PE), a prevalent pregnancy complication, frequently poses severe implications for both pregnant women and fetuses, and its occurrence is currently exhibiting a marked upward trend [12]. Currently, the precise pathogenesis of PE remains undefined, and an effective clinical cure has yet to be discovered [13]. The cornerstone of management revolves around early identification, prompt intervention, intensified monitoring and timely termination of pregnancy [14]. Therefore, it is necessary to explore an efficacious detection method to predict the occurrence and progression of PE in its initial stage, which holds paramount significance in tailoring individualized treatment strategies and enhancing the prognosis for PE patients with varying degrees of severity. The main findings of this study were that TG, Cr and UA demonstrated a predictive capacity as independent risk factors of PE, and the combination of these three biomarkers yields the higher predictive power.
This study showed higher levels of Cr, UA and urea within the PE group in comparison to the control group, which aligns with the outcomes reported in previous researches [15]. Notably, kidney damage often manifests in the early stage of PE, which could be promptly identified through laboratory testing, commonly characterized by the presence of urinary protein and abnormal serological markers [16, 17].
The precise mechanism underlying renal injury in PE remains elusive. Prior investigations have illuminated the key pathological and physiological alterations, including damage to glomerular endothelial cells, disruption of the interaction between endothelial cells and podocytes, basement membrane thickening, and mesangial cell proliferation [18, 19]. These changes are potentially linked to inadequate placental perfusion in PE, which triggers the release of significant amounts of placental factors that compromise the function of endothelial cells and podocytes [20]. Furthermore, immune dysregulation and deposition of immunoreactive substances may contribute to endothelial and basement membrane damage [21]. Multivariate analysis revealed that Cr and UA were independently risk factors for PE (AOR = 1.066, 1.016 respectively), which aligns closely with the findings reported in previous studies [22, 23].
Previous study indicated a potential association between abnormal serum lipid metabolism and the likelihood of PE [24]. Specifically, patients with PE exhibited significantly elevated levels of serum TG, TC, low-density lipoprotein cholesterol (LDL-c), and very low-density lipoprotein (VLDL) when compared to healthy pregnant women [25]. In this study, both univariate and multivariate statistical analyses revealed that the TG level of PE group were significantly elevated compared to control group (AOR = 1.827). But no statistically differences were identified in the levels of TC and HDL between the two groups.
Drawing upon previous research endeavors, abnormal lipid metabolism might be implicated in the pathogenesis of PE, encompassing diminished fatty acid oxidation capacity in the placenta [26], endothelial damage stemming from elevated levels of free fatty acids [27], potentiation of microcirculation coagulation function by lipoprotein-a [28], enhanced triglyceride synthesis, and the accumulation of triglyceride-rich lipoproteins [29]. However, the precise underlying mechanism remains poorly elucidated in existing literature.
In this study, ROC curves indicated that UA possessed the most substantial AUC among these three markers (AUC = 0.822), as reported by Dal et al. [30]. Remarkably, the joint of TG, Cr, and UA yielded an even larger AUC surpassing UA alone in predicting PE (AUC = 0.864) while maintaining satisfactory specificity and sensitivity (84.8% and 76.4% respectively). This signified that the joint of TG, Cr and UA held a certain predictive value for PE.
Additionally, this study uncovered a statistically significant increase of BMI in the PE group compared to the control group, which was consistent with the outcomes reported in a recent cohort study [31]. Despite both groups exhibiting baseline blood pressures that fell within the normal range, the systolic and diastolic blood pressures of the PE group were notably elevated compared to the control group. A possible explanation for these findings was that overweight pregnant individuals exhibit disruptions in lipid metabolism and abnormal vascular resistance in comparison to their normal-weight counterparts, potentially constituting the underlying pathological and physiological mechanisms that precede the subsequent development of PE [32, 33].
However, this study is retrospective and thus inherently bore limitations, including potential selection bias and incomplete data collection. For instance, individuals who terminated pregnancy before 28 weeks owing to the severity of the illness or those who failed to provide fasting blood samples during late pregnancy due to the rapid disease progression were excluded from this study. Additionally, this study is confined to a single center and suffers from a relatively modest sample size, which may limit the generalizability of the findings. Therefore, the findings of this research need to be further validated through multi-center, prospective studies with a larger sample size.
To sum up, patients with PE exhibit elevated levels of TG, Cr and UA compared to healthy pregnant women, which are recognized as independent risk factors for PE. And these three biomarkers individually possess predictive capabilities for PE, yet their combination significantly enhances the predictive efficiency, possessing satisfactory sensitivity and specificity. The results of this study may offer a promising new avenue in the early diagnosis and progression prediction of PE, potentially leading to more timely interventions and improved outcomes.
The datasets used and analyzed during this study are available from the corresponding author on reasonable request.
JL contributed to the study conception and design. Material preparation, data collection and analysis were performed by JZ and PW. The first draft of the manuscript was written by JZ. All authors contributed to editorial changes in the manuscript. All authors read and approved the final manuscript. All authors have participated sufficiently in the work and agreed to be accountable for all aspects of the work.
The study was conducted in accordance with the Declaration of Helsinki. The study was approved by the Ethics Committee of Hangzhou Women’s Hospital (Medical Ethics Review A: No.2024-096). This study employed biological samples and data from individuals without any identifying information for the purpose of research, adhering to rigorous measures to ensure the utmost protection of data security. Therefore, the ethics committee has granted an exemption from the requirement of informed consent.
Not applicable.
This research received no external funding.
The authors declare no conflict of interest.
References
Publisher’s Note: IMR Press stays neutral with regard to jurisdictional claims in published maps and institutional affiliations.