


 , Qing Jin 1, Xuerong Chen 1, Xiongtao Ma 1, Liqiong Zhang 1, Fei Xu 2
1 Obstetrics Department, Yan'an Hospital of Kunming City, 650051 Kunming, Yunnan, China
2 Department of Ultrasound, Affiliated Hospital of Yunnan University, 650031 Kunming, Yunnan, China
Abstract
Background: Pelvic organ prolapse seriously affect women’s physical and mental health. To quantitatively analyze the structure of the pelvic floor during pregnancy and delivery, we utilized transperineal three-dimensional ultrasound (TP-3DUS) imaging combined with real-time shear wave elastography (RT-SWE). This analysis aims to provide exploratory data on female pelvic floor parameters, such as the hardness and thickness of the levator ani muscle (LAM), and to offer personalized recommendations for the prevention and treatment of early clinical pelvic organ prolapse (POP). Methods: From March 2021 to August 2022, a study was conducted at the Affiliated Hospital of Yunnan University involving 150 pregnant patients at various gestational ages, 110 primiparas at 42–45 days post-delivery, and 55 healthy non-childbearing women. RT-SWE was used to quantitatively evaluate changes in the elasticity of the puborectalis muscle (PRM), while TP-3DUS imaging was used to measure various parameters of the pelvic floor. This study investigated changes in pelvic floor structure during pregnancy and postpartum. It evaluated the efficacy of PRM elasticity, levator hiatus (LH) area (LHA), and the thickness of the LAM, along with their combined application in diagnosing early postpartum POP. Results: As gestational weeks progress, the elasticity of PRM increased, while the thickness of LAM decreased. In the control group, cesarean section group, and vaginal delivery group, the elasticity of the PRM and the thickness of the LAM progressively decreased. The area, perimeter, LH anteroposterior (LHAP) diameter and LH lateral diameter (LHLD) increased sequentially in these groups. The combination of LHA, PRM elasticity, and thickness of the LAM in both vaginal delivery and cesarean section groups demonstrated the highest diagnostic efficiency for POP. Conclusions: The combination of TP-3DUS Imaging and RT-SWE represents a novel, effective, and convenient method for evaluating the structure and muscle elasticity of the pelvic floor during pregnancy and the early postpartum period. LHA, PRM hardness, and thickness of the LAM individually possess a diagnostic value for early postpartum POP. However, their combination yields the highest diagnostic efficiency.
Keywords
- transperineal three-dimensional ultrasound
- real-time shear wave elastography
- pregnancy
- postpartum
- pelvic organ prolapse
The anatomical structure of the female pelvic floor is complex and plays a pivotal role in maintaining the position, morphology, and function of pelvic organs. The levator ani muscle (LAM), consisting of the puborectalis muscle (PRM), pubococcygeal muscle, and iliococcygeal muscle, plays a pivotal role in the pelvic floor structure. The PRM, considered the most powerful component of the LAM, forms a robust “U-shaped” sling around the posterior side of the rectum, thereby exerting control over defecation. Pelvic floor dysfunction (PFD) refers to dysfunction resulting from degeneration or damage to the pelvic floor tissues and organs. It includes conditions such as pelvic organ prolapse (POP), stress urinary incontinence, fecal incontinence, and sexual dysfunction, all of which significantly affect the physical and mental health of women. Studies have indicated that the prevalence of PFD in women aged 20–39 years ranges from 19.7% to 50.3%, while in women aged 50–79 years, it ranges from is 41.0% to 77.2% [1].
Studies have identified pregnancy and delivery as independent risk factors for POP [2, 3, 4], with LAM damage being a primary cause. Injury to the PRM and dilation of the levator hiatus (LH) are closely associated with POP. During pregnancy, the biomechanical behavior of pelvic floor tissue is altered. Collagen, which plays a crucial role in determining the biomechanical characteristics and load-bearing capacity of muscles, is affected by the continuous increase in abdominopelvic pressure beyond the body’s physiological limit. This, in turn, impacts the functionality of the LAM. Alperin et al. [5] observed that as gestational weeks progress, the uterine volume in pregnant patients increases, altering its position and adding to the gravitational load on the pelvic floor support structure. This leads to a significant increase in the total collagen content and the number of muscle segments in the pelvic floor muscle, resulting in increased muscle fiber length and stiffness. Additionally, childbirth causes changes in LAM tension, and ischemia and hypoxia during delivery can reduce its contraction function, potentially leading to structural damage and the occurrence of POP. Approximately 50% of primiparas experience significant changes in PRM structure and function during vaginal delivery, particularly in the anterior part of the PRM. This is accompanied by a marked decrease in LAM contractility in the early postpartum period compared to healthy nulliparous women [6]. However, research on the biomechanical characteristics such as elasticity, stiffness, and swelling of pelvic floor muscles during and after pregnancy remains limited.
Advancements in ultrasound technology have diversified pelvic floor ultrasound examinations. Transperineal three-dimensional ultrasound (TP-3DUS) imaging, avoids the influence of pelvic floor bones and pelvic internal organs, providing clear imaging, comprehensive evaluation, dynamic and intuitive results, and stable stereoscopic images [7]. This makes it suitable for functional and morphological evaluations of pelvic floor structures and organ movements, thereby reflecting pelvic floor muscle function and improving the accuracy of PFD diagnosis [8].
Studies have established a correlation between the elastic characteristics of pelvic floor tissues and the risk of POP [9], highlighting the importance of analyzing these characteristics in predicting POP and guiding early clinical interventions. Due to the subjective nature of pelvic floor ultrasound examinations and variations in subject compliance of (e.g., during anal contractions and maximum Valsalva maneuvers), false negatives or positives may occur. Real-time shear wave elastography (RT-SWE) overcomes these limitations by offering non-invasively, quantitatively, and dynamically assessment of elasticity of both normal and diseased tissues. It displays tissue elasticity values for quantitative analysis, thereby providing insights into contractile functions based on these values [10]. Morin et al. [11] initially demonstrated the efficacy of RT-SWE in quantifying PRM hardness. Early detection of LAM injury through RT-SWE technology is beneficial for guiding PFD patients towards early pelvic floor rehabilitation training.
This study aims to utilize TP-3DUS combined with RT-SWE technology to measure the elastic modulus of the PRM and the thickness of LAM bilaterally during the first-, second-, and third-trimesters of pregnancy. The objective is to non-invasively evaluate changes in elasticity of the PRM and the thickness of LAM during pregnancy. This data offers an exploratory insight for clinical practice, aiding in the identification of high-risk pregnant patients, early detection of LAM damage, guidance on delivery methods, and personalized recommendtions for preventing perineal tears and postpartum PFD [12].
Furthermore, RT-SWE is employed to measure the elastic modulus of the PRM during the early postpartum period in primiparas, considering various delivery modes. This analysis introduces a novel indicator for predicting LAM injury. TP-3DUS is employed to measure pelvic floor parameters, facilitating comparison of variances in pelvic floor structure and muscle stiffness among primiparas who underwent different delivery modes. The effectiveness of PRM elasticity, LH area (LHA), the thickness of LAM, and their combined assessment among diagnosing early postpartum POP in primiparas is evaluated. This evaluation offers personalized treatment recommendations for early postpartum POP management.
This study was a hospital-based cohort study conducted at the Affiliated Hospital of Yunnan University between March 2021 and August 2022. We started the study by determining the sample size, considering the different number of groups (k) to be included. For k = 6, the sample size (n) was calculated to be 35.141; for k = 4, the sample size was n= 44.599; and for k = 3, the sample size was 52.40. Subsequently, the study enrolled 150 pregnant patients who underwent routine obstetric ultrasound examinations. Additionally, the study included 110 primiparas who underwent routine pelvic floor ultrasound examinations 42–45 days post-delivery. Additionally, a control group comprising 55 healthy nulliparous women, with no history of abortion, was included into the study. Ethical approval for this study was obtained from the Institutional Review Board of the Affiliated Hospital of Yunnan University (Ethics review No.: 2021164).
The study focused on first-time pregnant patients and primiparas who experienced a single full-term birth.
Participants were excluded if they presented a body mass index
(BMI)
Dietz et al. [13] analyzed and proposed the application of ultrasound in the quantification of female POP. The diagnosis utilized a horizontal reference line positioned behind the lower edge of the pubic symphysis. The vertical distance between the bladder neck and external cervical os to this reference line was measured during maximum Valsalva maneuvers. A diagnosis of cystocele was established if the bladder neck was at or below the reference line. Similarly, uterine prolapse was diagnosed when the external cervical os reached or was below this line. For rectocele, a straight line extending cephalad parallel to the ventral internal sphincter and anal canal served as the reference. A diagnosis was made if the anterior rectal wall bulged anteriorly beyond this line during maximum Valsalva maneuvers.
After bladder emptying, subjects assumed a lithotomy position. To minimize the impact of posture on examination results, consistent angles of hip abduction and knee flexion were maintained throughout the procedure. The examinations were conducted using a SuperSonic Aixplorer ultrasound diagnostic instrument (SuperSonic Imagine Company, Aix-en-Provence, Franch) with a 4–15 MHz high-frequency linear array probe. The probe, placed in the median sagittal plane of the perineum directly above the anus, was rotated approximately 10°–20° clockwise and counterclockwise to locate the left and right PRM. Once the two-dimensional ultrasound displayed complete bilateral PRM muscle bundles, the RT-SWE program was initiated. Young’s modulus for elastography was set to 180 kPa, and a rectangular sampling frame was used to cover the PRM maximally [14]. The region of interest (ROI) for measuring PRM’s elastic modulus was a 5.0 mm diameter circle. Tissue elasticity was expressed in kilopascals (kPa) using color-coded elastography. The mean elasticity (Emean) of PRM was calculated by repeating measurements three times on the anterior part of the bilateral PRM, as depicted in Fig. 1.
 Fig. 1.
Real-time shear wave elastography was used for Measurement of the anterior elastic modulus of both the left and right PRM. (A) left PRM Emean; 16.9 kPa, (B) right PRM Emean: 15.3 kPa. PRM, puborectalis muscle; Emean, mean elasticity; kPa; kilopascal.
Using the UGEO WS80A ultrasound diagnostic instrument (Samsung company, Seoul, Korea), a three-dimensional volume probe, coated with a sterile coupler and covered with a protective sleeve, was positioned in the median sagittal plane of the subject’s perineum. This setup ensured a clear and comprehensive display of the pelvic floor tissue structure. To visualize the LAM located behind the rectum, the probe was rotated 90° clockwise in the transverse plane. The thickness of LAM was then determined by averaging measurements taken three times, as depicted in Fig. 2. Patients were instructed to perform a maximum Valsalva maneuver to evaluate the occurrence of POP. During the examination, caution was exercised to prevent compressing of the bulge, which could potentially yield false negative results. Following clear visualization of the pelvic organs, the probe was stabilized, and the 3D imaging mode was activated to capture volumetric data. Measurements were subsequently obtained for the LH anteroposterior (LHAP) diameter, LH lateral diameter (LHLD), LHA, and LH circumference (LHC) during maximum Valsalva maneuver, as illustrated in Fig. 3.
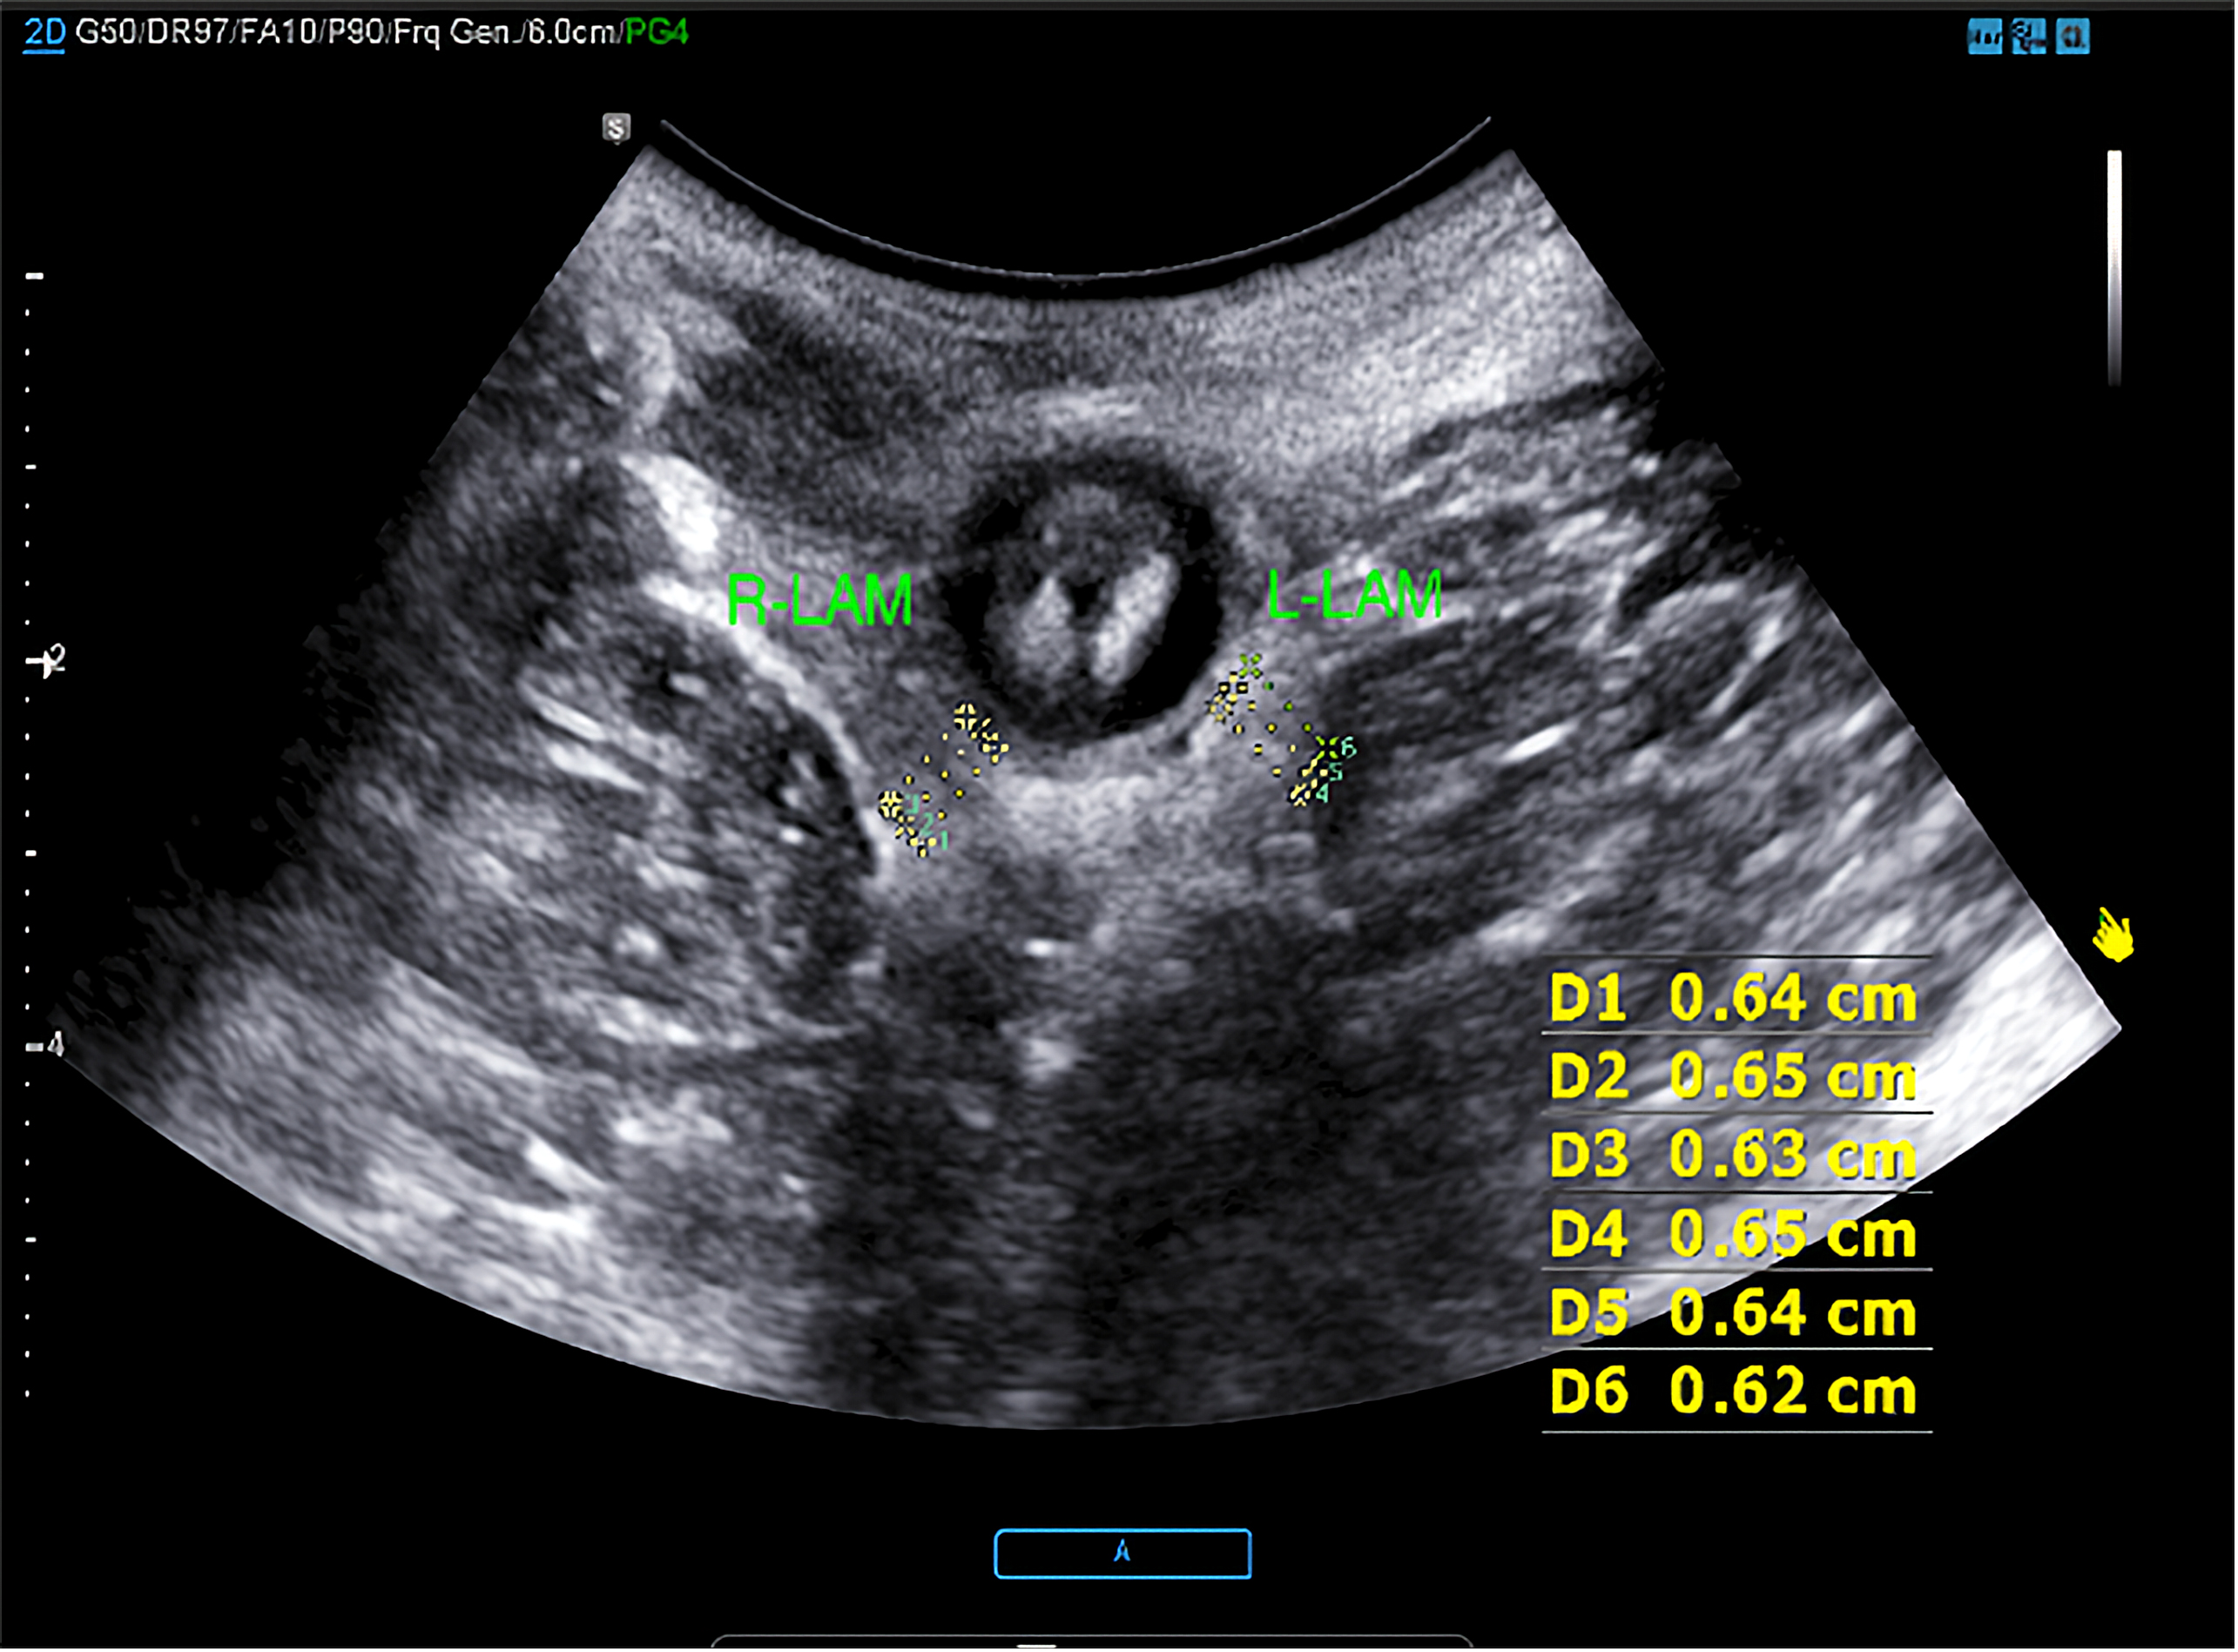 Fig. 2.
Measurement of the thickness of LAM of bilateral at rest. On the right side of the thickness of LAM including D1, D2, D3; On the left side of the thickness of LAM including D4, D5, D6 (D1: 0.64 cm, D2: 0.65 cm, D3: 0.63 cm; D4: 0.65 cm, D5: 0.64 cm, D6: 0.62 cm). LAM, levator ani muscle.
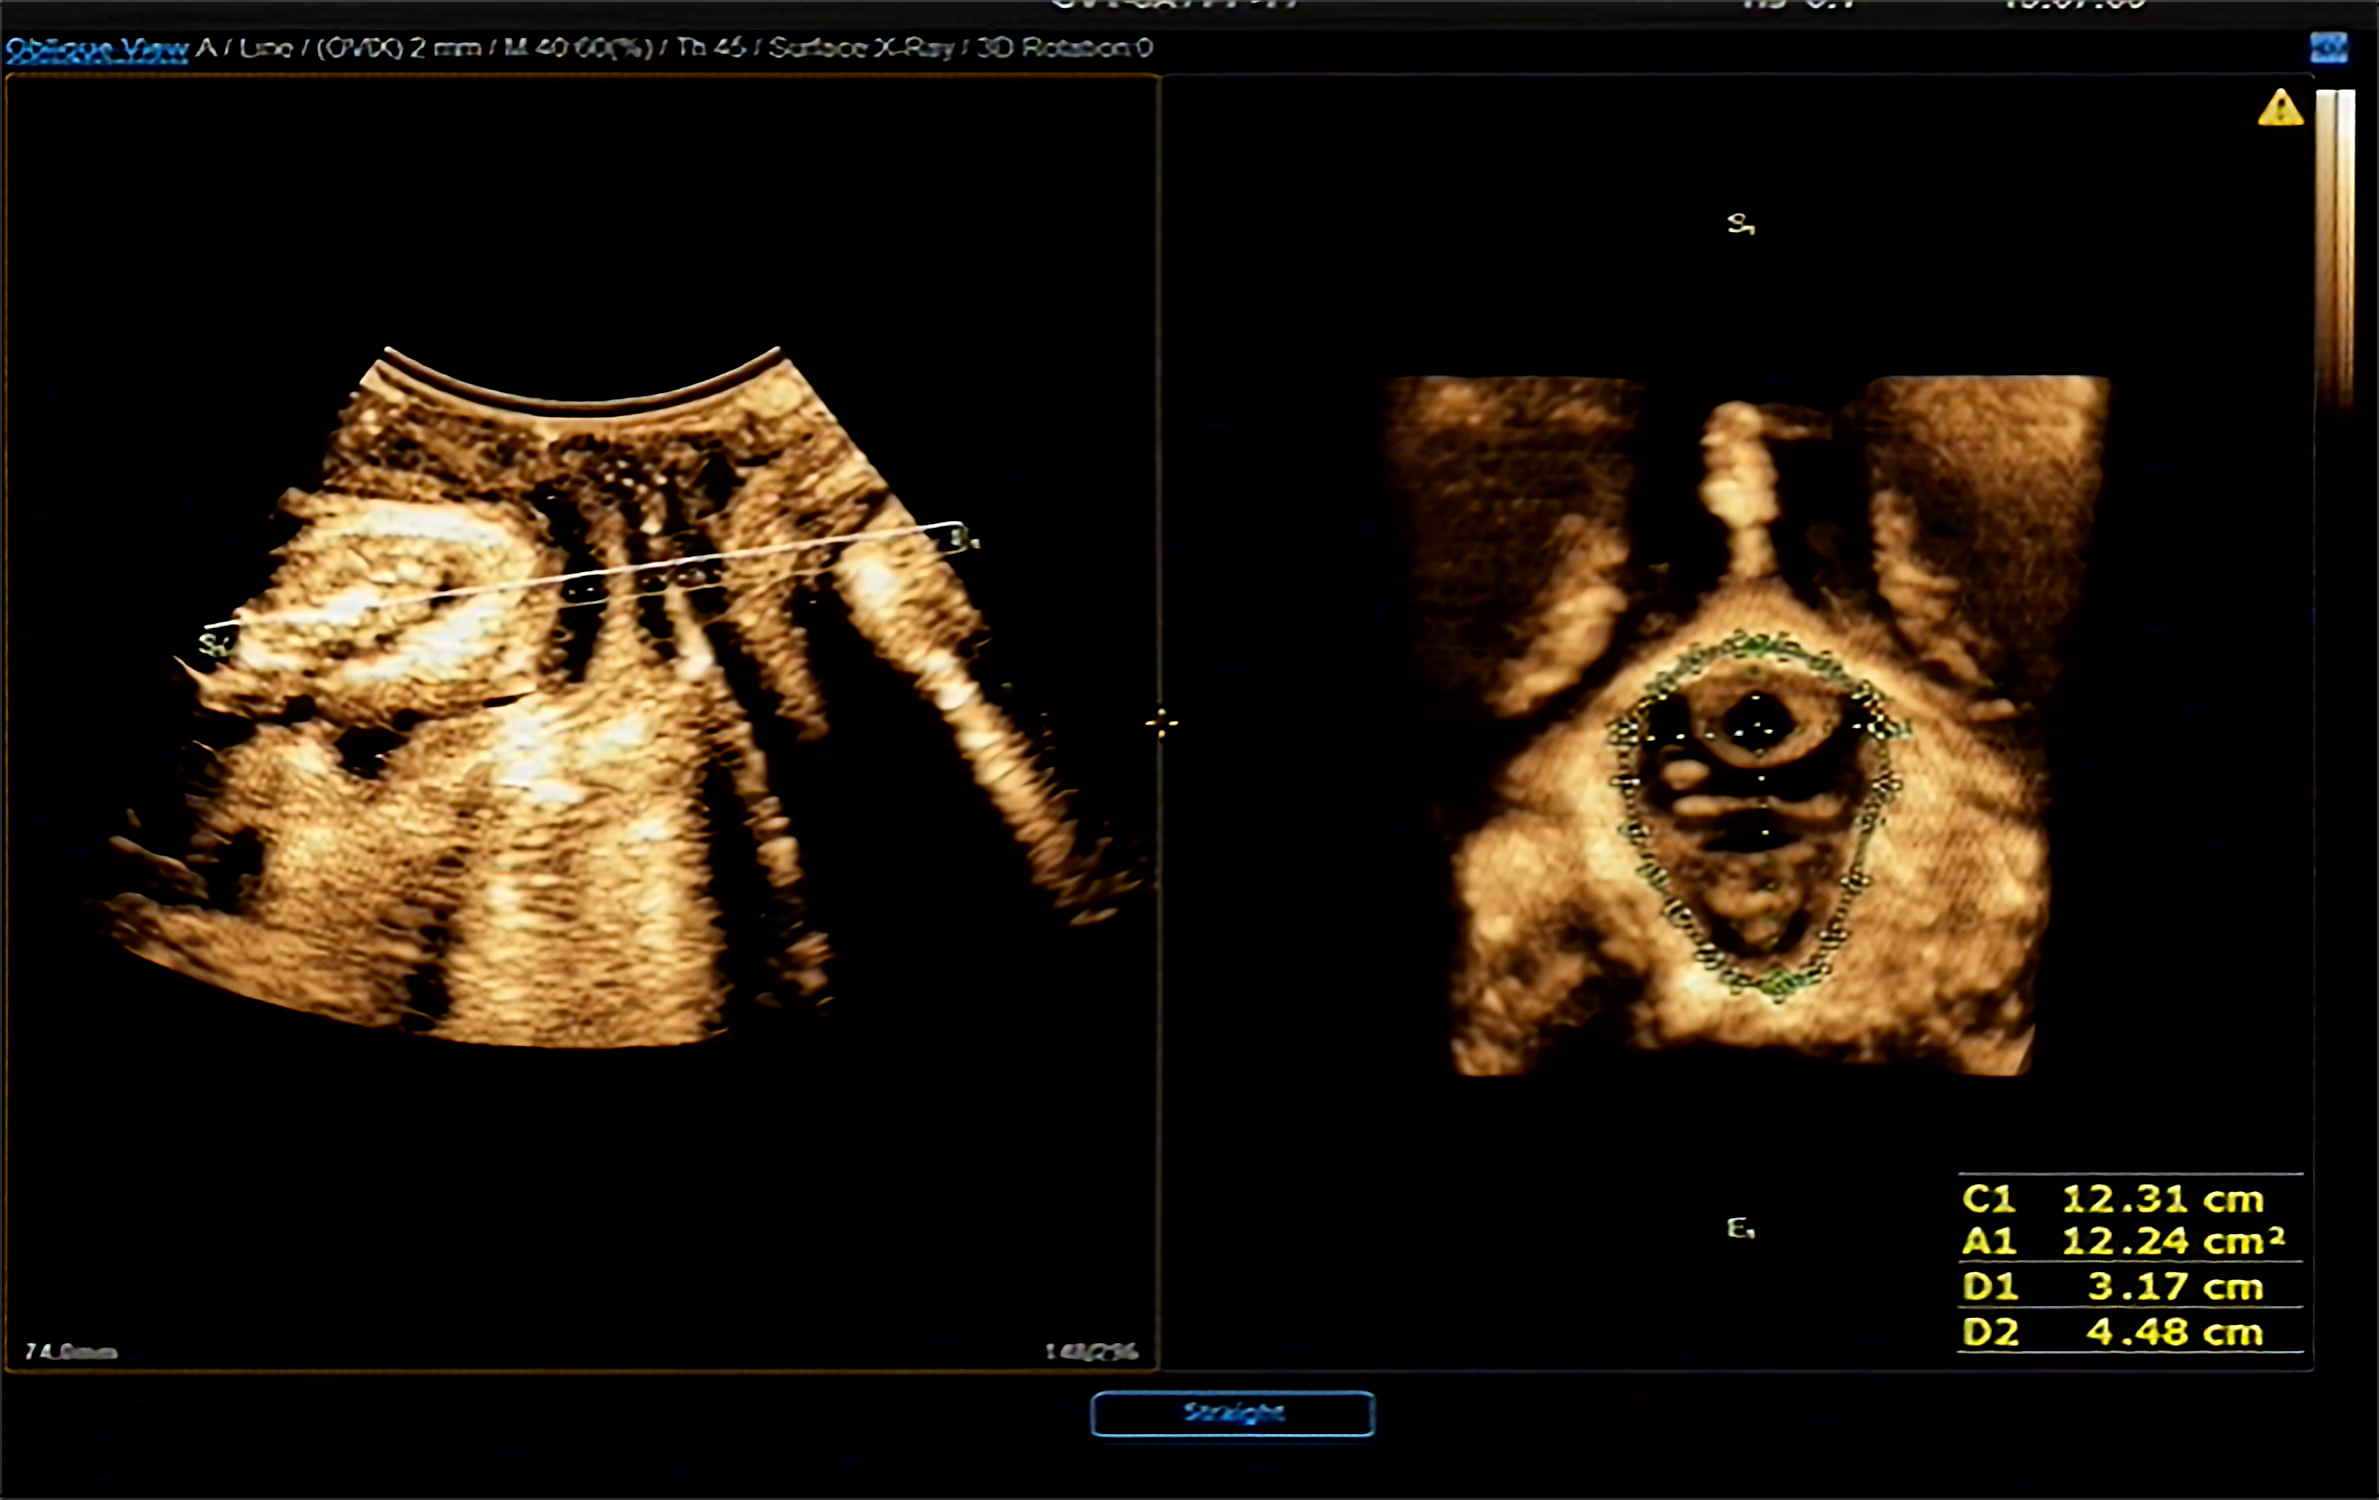 Fig. 3.
Measurement of LH parameters in maximum Valsalva condition (C1: LHC measurement; A1: LHA measurement; D1: LHLD measurement; D2: LHAP measurement). LH, levator hiatus; LHC, LH circumference; LHA, LH area; LHLD, LH lateral diameter; LHAP, LH anteroposterior.
For sample size calculation, the Power package in R language was employed.
Statistical analyses were conducted using SPSS version 21.0 (IBM Corp, Armonk, NY,
USA). Count data were represented by the number of cases (n) and analyzed using
the Chi-square (
The general clinical data of all participants included in the study are
presented in Table 1. The study comprised a total of 315 subjects. Statistically
significant differences were observed in height, weight, and BMI among the study
groups (p
| Parameters | Gestational period | Normal control | Postpartum | Statistical magnitude (F/ |
p-value | |||
| Early pregnancy | Middle pregnancy | Late pregnancy | Vaginal delivery | Cesarean section | ||||
| Cases (n) | 50 | 50 | 50 | 55 | 55 | 55 | —— | —— |
| Age | 26.48 |
26.98 |
27.32 |
26.30 |
27.25 |
27.05 |
1.138 | 0.343* |
| Weight (kg) | 52.02 |
58.0 |
65.17 |
51.40 |
56.15 |
56.58 |
34.066 | 0.000* |
| Height (cm) | 159 |
161 |
160 |
161 |
159 |
160 |
2.918 | 0.015* |
| BMI (kg/m |
20.90 |
22.75 |
26.12 |
19.74 |
22.03 |
22.01 |
58.813 | 0.000* |
| POP | —— | —— | —— | —— | 35/55 | 22/55 | 6.154 | 0.013 |
| Postpartum time (d) | —— | —— | —— | —— | 42.56 |
42.85 |
–1.599 | 0.113▲ |
Note: * p: The measurement data of three groups or more were analyzed by one-way analysis of variance or Welch’s ANOVA test.
▲: the comparison of postpartum time between the vaginal delivery group and the cesarean section group was analyzed by independent sample t test.
p
BMI, body mass index; POP, pelvic organ prolapse.
The study analyzed the thickness of LAM and the elasticity values of the
bilateral PRM among the control group, early pregnancy group, middle pregnancy
group, and late pregnancy group. This analysis was conducted using one-way ANOVA or Welch’s ANOVA test and the
results are detailed in Table 2. The findings revealed that with the progression
of gestational weeks, the elasticity values of the bilateral PRM increased, the
thickness of LAM decreased. This variation was statistically significant
(p
| Group | Left PRM-Emean (kPa) | Right PRM-Emean (kPa) | Thickness of Left LAM (cm) | Thickness of Right LAM (cm) |
| Normal control | 27.40 |
27.83 |
0.79 |
0.81 |
| Early pregnancy | 26.28 |
26.13 |
0.79 |
0.80 |
| Middle pregnancy | 30.72 |
31.50 |
0.70 |
0.72 |
| Late pregnancy | 41.93 |
42.96 |
0.55 |
0.56 |
| F | 54.369 | 52.559 | 267.597 | 255.879 |
| p-value | 0.000* | 0.000* | 0.000* | 0.000* |
Note: F, Statistics from one-way ANOVA or Welch’s ANOVA test. *
p
PRM, puborectalis muscle; LAM, levator ani muscle; Emean, mean elasticity; kPa; kilopascal.
This section of the study focused on comparing the thickness of LAM and the
elasticity values of the PRM among the three study groups: the vaginal delivery
group, the cesarean section group, and the control group. The comparative data is
presented in Table 3. The findings indicated that the thickness of LAM and the
elasticity value of the PRM in primiparas during the early postpartum period were
significantly lower compared to those in the control group. Moreover, within the
primipara group, those who had undergone vaginal delivery exhibited lower
thickness of LAM and elasticity values of the PRM compared to those who had
undergone cesarean sections. These differences were statistically significant
(p
| Group | Left PRM-Emean (kPa) | Right PRM-Emean (kPa) | Thickness of Left LAM (cm) | Thickness of Right LAM (cm) |
| Normal control | 27.40 |
27.84 |
0.80 |
0.81 |
| Vaginal delivery | 22.00 |
21.68 |
0.57 |
0.57 |
| Cesarean section | 23.81 |
23.81 |
0.62 |
0.62 |
| F | 58.919 | 71.658 | 177.987 | 168.285 |
| p-value | 0.000 | 0.000 | 0.000 | 0.000 |
Note: F, Statistics from one-way ANOVA or Welch’s ANOVA test. * p
This part of the study involved Welch’s ANOVA test of LHA, LHLD, LHAP and LHC in
primiparas with different delivery modes during the early postpartum period, as
demonstrated in Table 4. The results revealed that the LHA, LHLD, LHAP, and LHC
values in both the vaginal delivery group and the cesarean section group were
significantly higher than those in the control group (p
| Group | LHA (cm) | LHAP (cm) | LHLD (cm) | LHC (cm) |
| Normal control | 16.04 |
5.11 |
4.07 |
14.66 |
| Vaginal delivery | 24.57 |
6.29 |
5.16 |
18.21 |
| Cesarean section | 19.70 |
5.74 |
4.53 |
16.54 |
| F | 53.078 | 37.186 | 56.967 | 46.745 |
| p-value | 0.000 | 0.000 | 0.000 | 0.000 |
Note: F, Statistics from Welch’s ANOVA test. * p
| Index | Correlation coefficient (r |
p-value |
| LHA | 0.671 | 0.000 |
| LHAP | 0.476 | 0.000 |
| LHLD | 0.318 | 0.018 |
| LHC | 0.489 | 0.000 |
LHA, LH area; LHLD, LH lateral diameter; LHAP, LH anteroposterior; LHC, LH circumference; POP, pelvic organ prolapse.
| Index | Correlation coefficient (r |
p-value |
| LHA | 0.634 | 0.000 |
| LHAP | 0.539 | 0.000 |
| LHLD | 0.620 | 0.000 |
| LHC | 0.608 | 0.000 |
LHA, LH area; LHLD, LH lateral diameter; LHAP, LH anteroposterior; LHC, LH circumference; POP, pelvic organ prolapse.
This segment of the study focused on the early postpartum diagnosis of POP in
both the vaginal delivery and cesarean section groups. The incidence of POP was
significantly higher in the vaginal delivery group at 63.6% (35/55) compared to
40% (22/55) in the cesarean section group, with the difference being
statistically significant (p
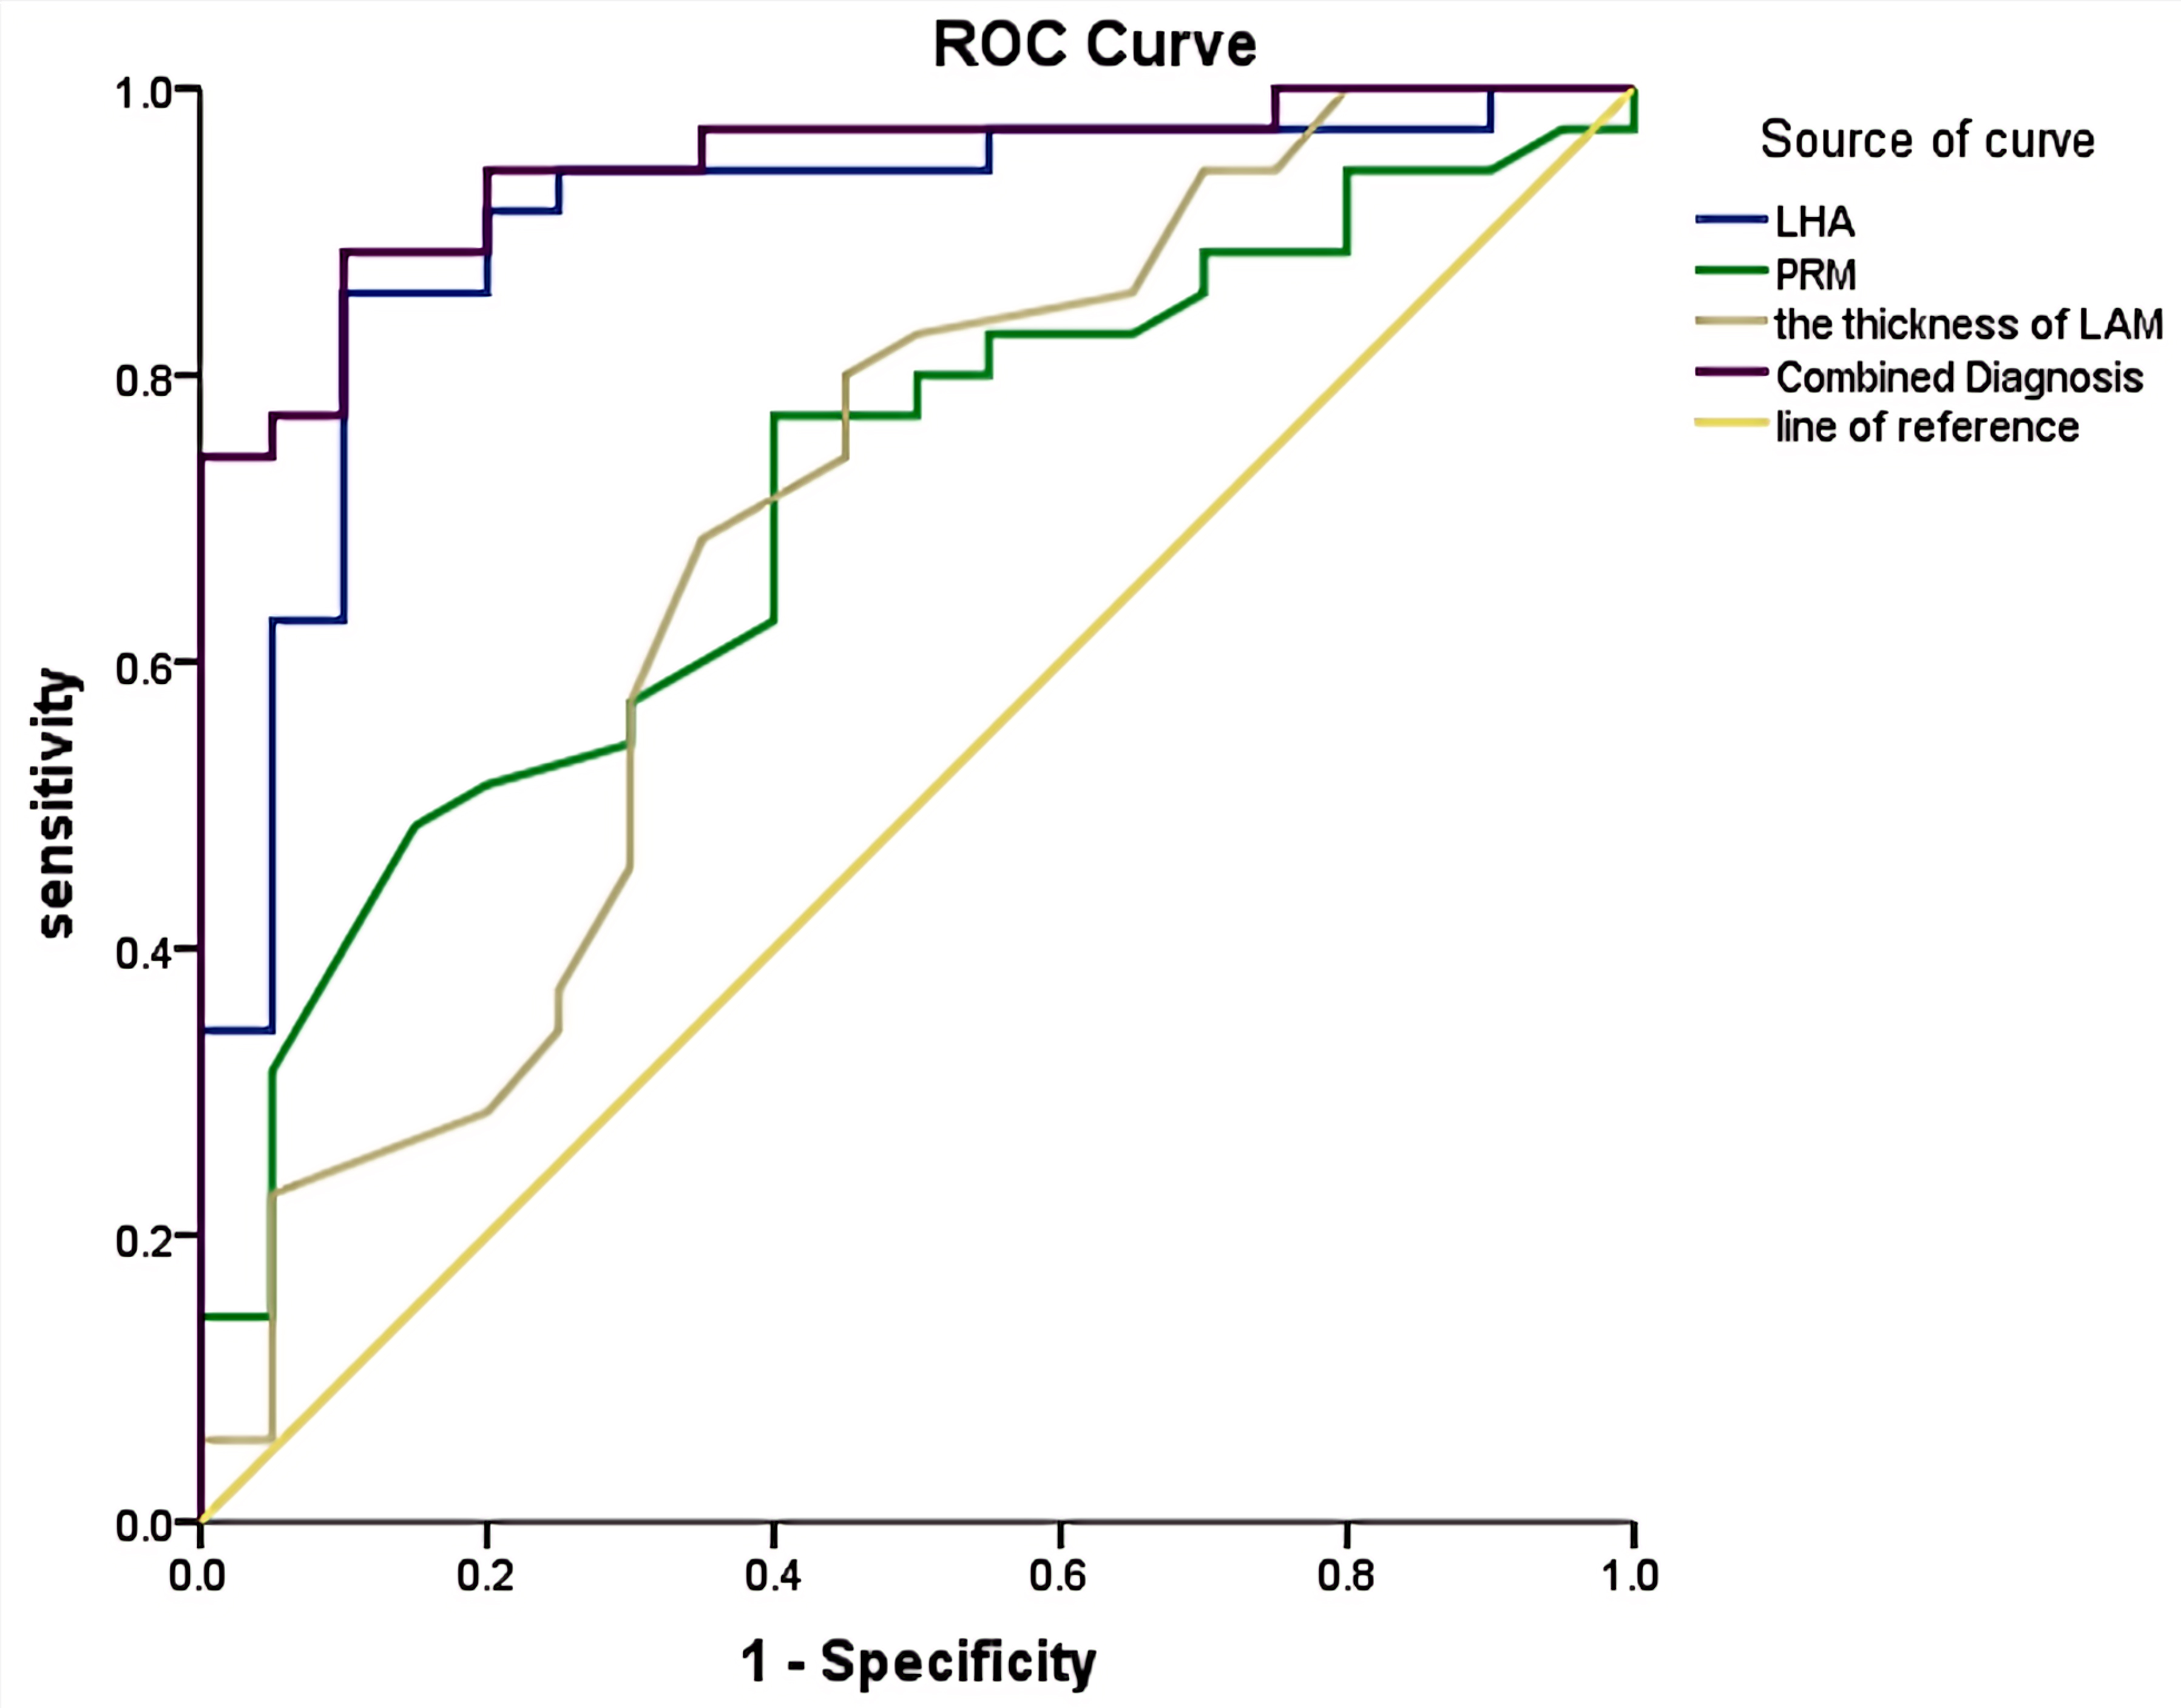 Fig. 4.
ROC curves of LHA, elastography of PRM, the thickness of LAM, and their combination for the diagnosis of POP in the vaginal delivery group. ROC, receiver operating characteristic; LHA, LH area; PRM, puborectalis muscle; LAM, levator ani muscle; POP, pelvic organ prolapse.
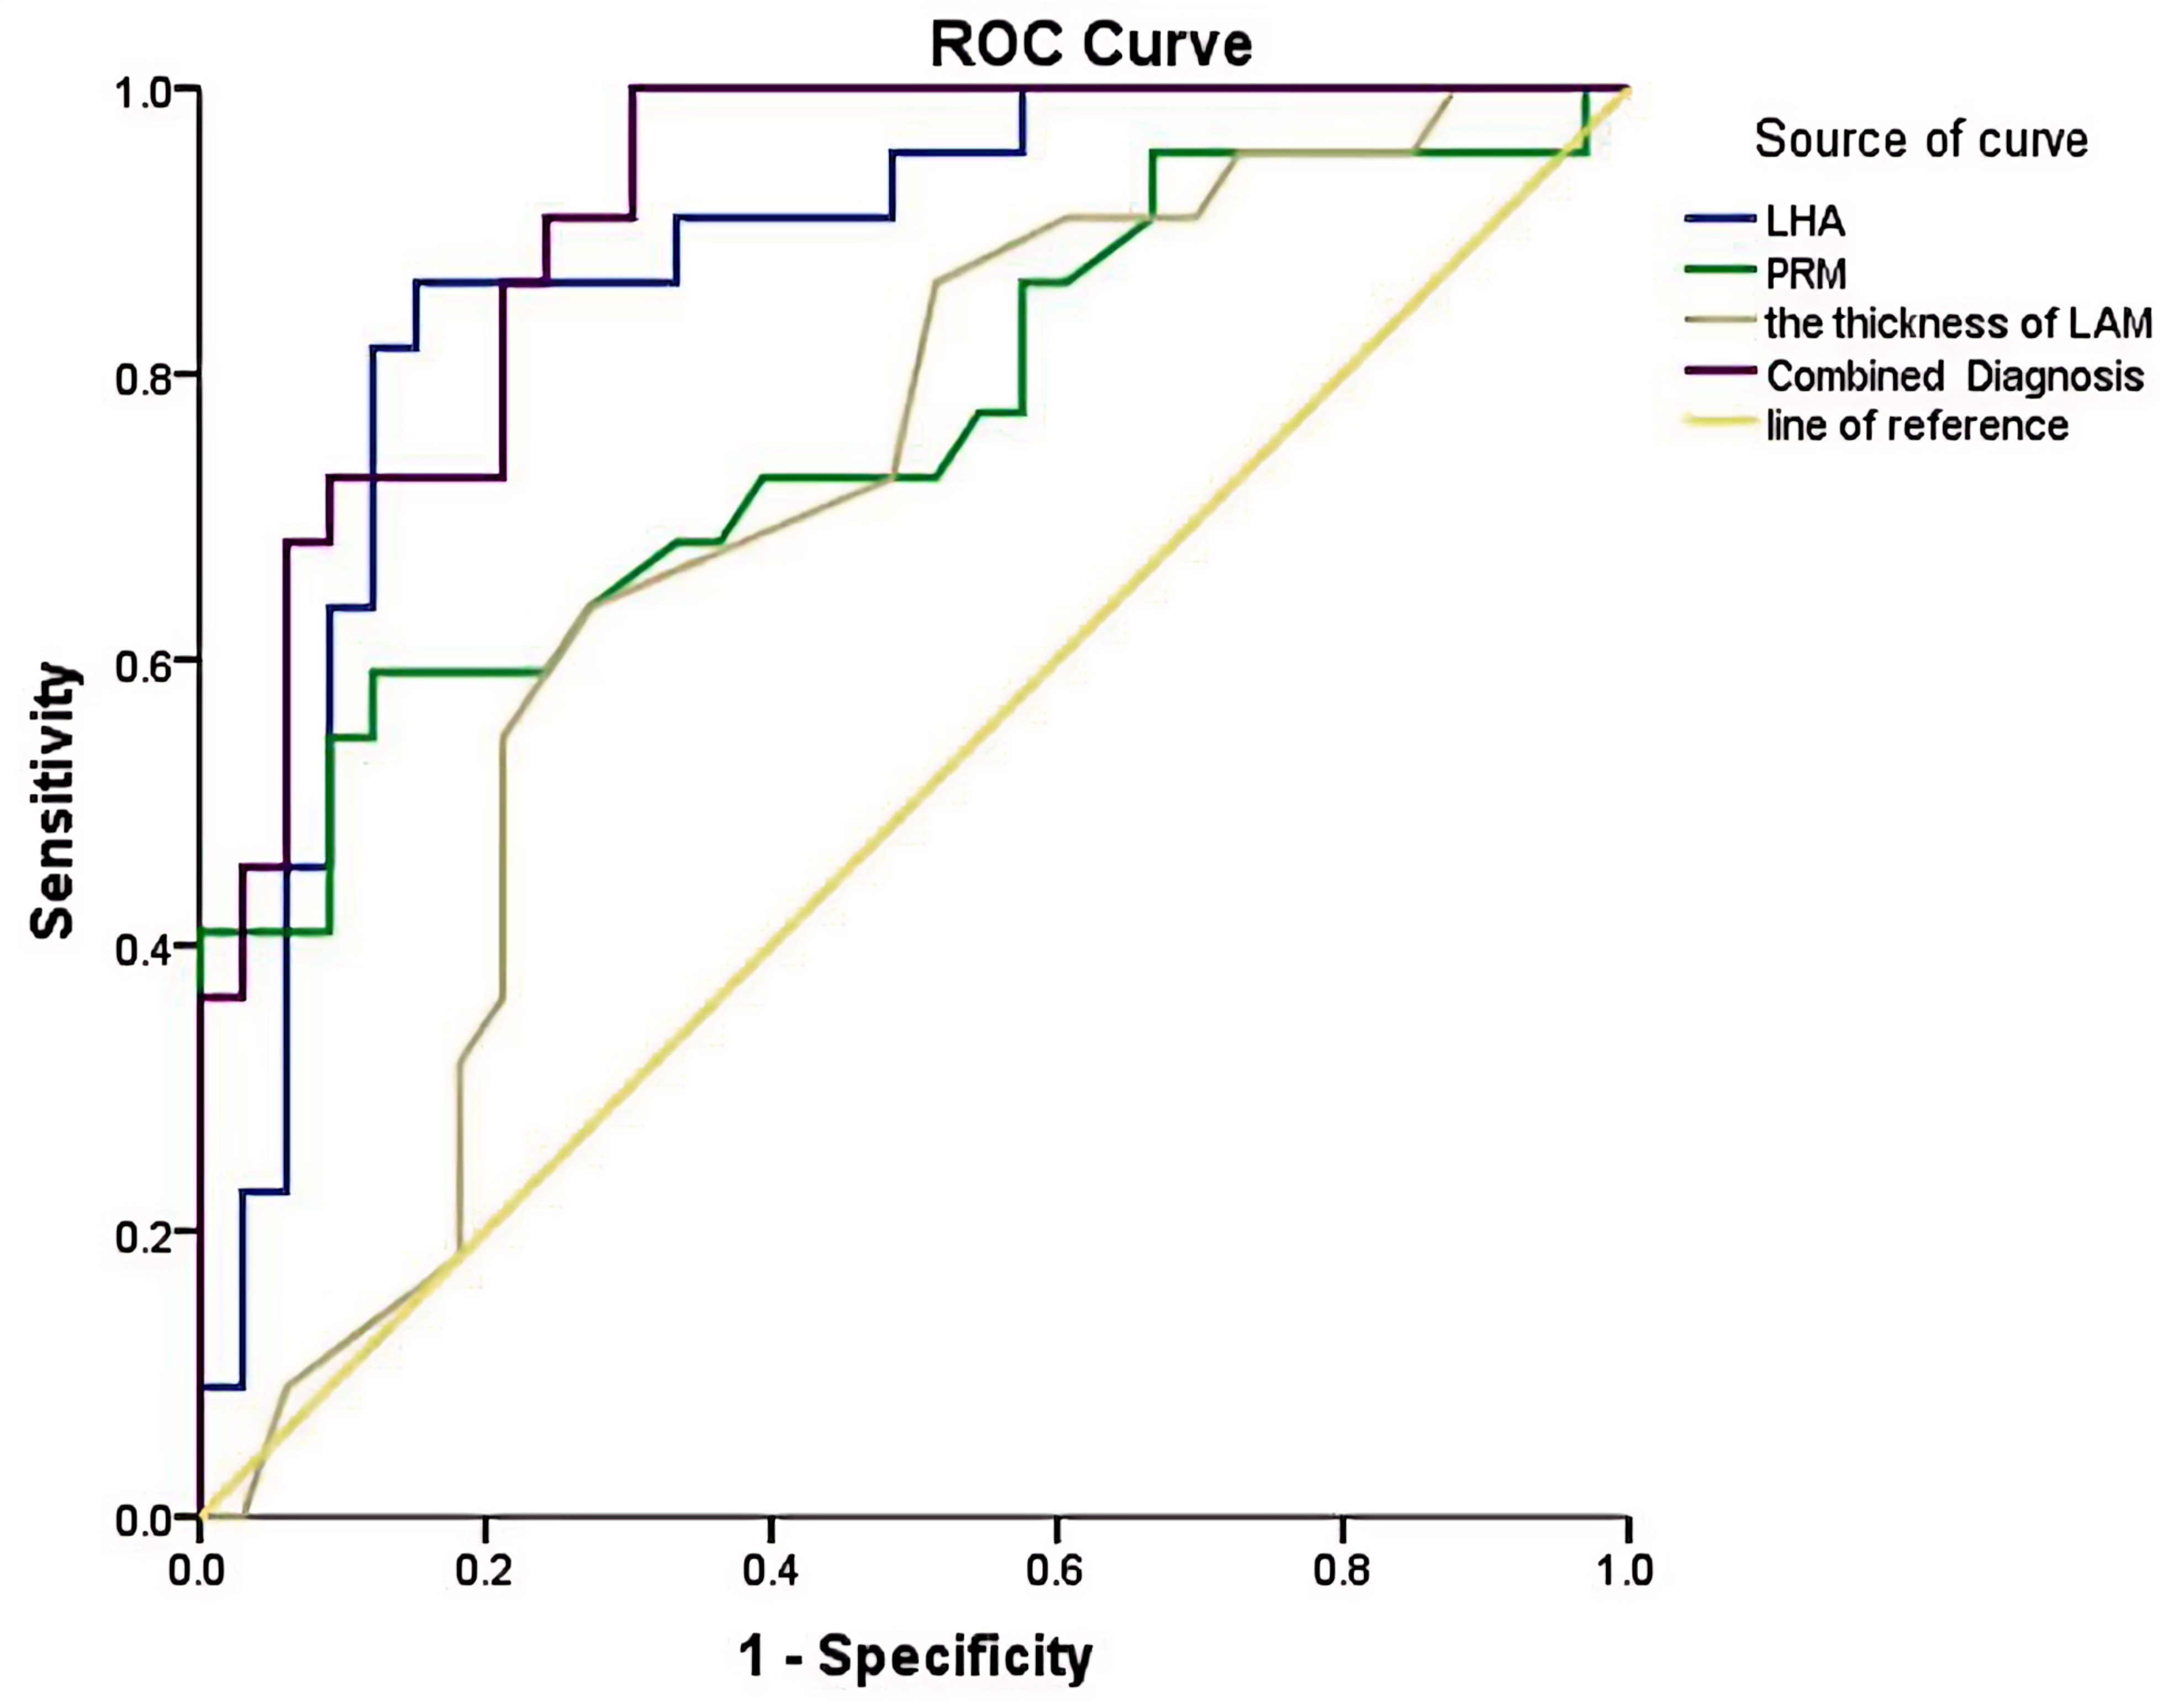 Fig. 5.
ROC curves of LHA, elastography of PRM, the thickness of LAM, and their combination in the diagnosis of POP in the cesarean section group. ROC, receiver operating characteristic; LHA, LH area; PRM, puborectalis muscle; LAM, levator ani muscle; POP, pelvic organ prolapse.
| Group | Index | AUC | p-value | Youden index | Cutoff values | Sensitivity | Specificity |
| Vaginal delivery | LHA | 0.903 | 0.000 | 0.757 | 23.945 | 85.7% | 90.0% |
| PRM elastography | 0.706 | 0.011 | 0.371 | 22.20 | 77.1% | 60.0% | |
| Thickness of LAM | 0.689 | 0.021 | 0.35 | 0.595 | 80.0% | 55.0% | |
| Combined diagnosis | 0.944 | 0.000 | 0.786 | —— | 88.6% | 90.0% | |
| Cesarean section | LHA | 0.873 | 0.000 | 0.712 | 19.465 | 86.4% | 84.8% |
| PRM elastography | 0.760 | 0.001 | 0.47 | 22.45 | 59.1% | 87.9% | |
| Thickness of LAM | 0.691 | 0.017 | 0.363 | 0.615 | 63.6% | 72.7% | |
| Combined diagnosis | 0.912 | 0.000 | 0.697 | —— | 100% | 69.7% |
LHA, LH area; PRM, puborectalis muscle; LAM, levator ani muscle; POP, pelvic organ prolapse; AUC, area under the curve.
In the vaginal delivery group, the AUC values for LHA,the thickness of LAM and the elasticity of PRM, and their combination were 0.903, 0.689, 0.706, and 0.944, respectively. Correspondingly, in the cesarean section group, the AUC values were 0.873, 0.691, 0.760, and 0.912, respectively. The combined diagnostic approach yielded the highest AUC in both groups.
The optimal cutoff values established for LHA, elasticity of PRM and
the thickness of LAM were 23.945 cm
Sensitivity analysis revealed that LHA was not much difference in detecting POP in the vaginal delivery group (85.7%) compared to the cesarean section group (86.4%). and the sensitivity of PRM elasticity was higher in the vaginal delivery group (77.1%) compared to the cesarean section group (59.1%). The thickness of LAM sensitivity was also found to be higher in the vaginal delivery group compared to the cesarean section group (80.0% vs. 59.1%). The combined diagnosis sensitivity of vaginal delivery (88.6%) and cesarean section (100%) was the highest.
In terms of specificity, the vaginal delivery group showed the highest for LHA and its combination (90.0% each), followed by the PRM elastography at 60.0%. In the cesarean section group, PRM elasticity showed the highest specificity (87.9%), followed by LHA (84.8%). The lowest specificity was observed for the combined approach at 69.7%.
With advancing age, repeated pregnancies, and deliveries, the number and diameter of LAM muscle fibers decrease, resulting in weakened elasticity of pelvic floor muscle and a decline in various pelvic floor functions. The TP-3DUS examination, coupled with RT-SWE technique used in this study, represents a novel, effective, and convenient method to evaluating the structure, function, and elasticity of the pelvic floor muscles of the pelvic floor during pregnancy and early postpartum period.
Pregnancy represents an independent risk factor for POP, as it leads to increased mechanical load on the pelvic floor and hormonal changes that affect the hardness of the LAM [15]. Pregnancy-induced changes in pelvic floor structure pose a potential risk for postpartum POP. Gachon et al. [16] suggested that women with higher ligament laxity were at higher risk of anal sphincter injury. The increase in pelvic floor muscle hardness during pregnancy is viewed as a protective physiologic mechanism against perineal trauma and muscle injury. This increase in muscle fiber length and change in muscle hardness occur specifically in the pelvic floor muscle group, including PRM, coccygeal muscle, iliococcygeal muscle, and pubococcygeal muscle. When there is an abnormal increase in PRM hardness, it is essential to be alert regarding potential damage of pelvic floor function [5]. The decrease in vaginal wall hardness during pregnancy may be a physiologic process to adapt to vaginal distension during delivery [17]. The increase of pelvic floor muscle hardness and the decrease of vaginal wall stiffness combined protect the pelvic floor structures and avoid muscle injuries during labor.
Our study observed no significant difference in PRM hardness and the thickness
of LAM between the left and right sides during pregnancy, suggesting an equal
effect of abdominal-pelvic pressure on bilateral LAM. In early pregnancy, the
hardness of PRM and the thickness of LAM were similar to the control group,
likely due to lower fetal pressure exerted on pelvic support structures, limited
uterine enlargement within the pelvic cavity, and cellular changes occurring in
pelvic floor muscles and ligaments under hormonal influence. As gestational weeks
progressed, there was a significant increase in the hardness of PRM, accompanied
by thinning of the LAM. By late pregnancy, PRM hardness peaked at its highest
values (L-PRM 41.93
The POP of 50 late pregnant women in this study was followed up for 42–45 days
after delivery. Among 20 pregnant women with PRM elastic modulus surpassing the
cutoff value of 43.45 kPa, the positive rate of POP was 85% (17/20). In
contrast, among the remaining 30 cases whose average elastic modulus was lower
than 43.45 kPa, the positive rate of POP was 26.7% (8/30) (
In this study, the hardness of bilateral PRM decreased and the LAM became thinner in the early postpartum period for primiparas. The change in PRM hardness and LAM thinness was more pronounced in vaginal deliveries compared to cesarean deliveries, indicating that different delivery modes exert varying impacts on pelvic floor muscles.
During vaginal delivery, the fetal head directly acts on the birth canal, resulting in the thinning and deformation of LAM after extreme stretching. Exceeding the maximum pressure threshold of the pelvic floor structure can result in irreversible damage or even tear of pelvic floor muscles and ligaments, ultimately leading to PFD. In addition, local ischemia and hypoxia occur after the vessels and nerves that feed LAM are affected during delivery, leading to reduced contractility of LAM. Xie et al. [19] suggested that changes in LAM function may occur earlier than structural abnormalities in POP. Vaginal delivery itself can impact the hardness of LAM. During the fetal head descent, the perineal distension peaks, causing the internal structure of LAM (e.g., the number and type of muscle fibers, the spatial arrangement of muscle bundles, and the actin-myosin isomers) to be irreversibly damaged. The biomechanical properties of LAM undergo changes, and its ability to resist abdominal pressure is weakened after Valsalva maneuver. This results in the occurrence of POP [19]. Studies have shown that even if 2D ultrasound does not detect obvious LAM damage, changes in the biomechanical properties of LAM will also affect the size of the LH, the expansibility, and the severity of POP [20].
In analyzing the PRM hardness and the thickness of LAM of the cesarean section patients, it was found that the PRM hardness of these patients was lower compared to healthy nulliparous women, and the LAM was thinner. The changes of PRM hardness and LAM thickness of patients who underwent cesarean section are mainly affected by pregnancy, and the delivery process has little effect on pelvic floor muscles. Cesarean section appears to offer some protective effect on the elasticity and contractile function of the PRM, whereas vaginal delivery causes more noticeable damage to the elasticity and contractile function of the PRM.
The rate of POP was found to be higher in the vaginal delivery group (63.4%) compared to the cesarean section group (40%). This suggests that vaginal delivery is more likely to result in POP. Béchard et al. [21] proposed that the mode of delivery significantly correlated with early postpartum POP. They found that primiparas who delivered vaginally had a prevalence of POP 5 times higher than that of those with cesarean delivery, with the symptoms affecting the anterior, middle, and posterior compartments, and a high proportion of urinary symptoms.
LH parameters can effectively evaluate postpartum pelvic floor function injury. In this study, all LH parameters of primiparas in the early postpartum period were higher than those of the healthy nulliparous group. For women who delivered vaginally, LH parameters were higher than those who delivered via cesarean section. The findings of this study suggest that the enlargement of the uterus and fetal growth exert mechanical pression on the pelvic floor structure, causing stretching, deformation, and relaxation of pelvic floor muscles and ligaments. The increase in progesterone and serum relaxin during pregnancy induces relaxation of pelvic floor muscle fibers and a decline in their contraction function, resulting in LH dilation.
The occurrence of POP and LH expansion in cesarean section is mainly affected by the increase of abdominal pelvic pressure and LH expansion during pregnancy. However, since the fetus does not pass through the birth canal and does not directly cause crush injury to the pelvic floor structures during cesarean delivery, the pelvic organ downward displacement distance and the degree of LH expansion are typically less than those in a vaginal delivery.
Women who delivered vaginally not only face increased mechanical load during pregnancy, but also endure mechanical compression from abdominal pressure and fetal head descent during delivery. This leads to extreme swelling of the perineum and potential injury or tearing of the pelvic floor muscles. During postpartum, due to irreversible tensile deformation of LAM, the shape of the LH changes, reducing support for pelvic organs and increasing the likelihood of POP. Therefore, symptoms of POP and LH expansion tend to be more pronounced in women with vaginal delivery than in those with cesarean delivery.
In both vaginal delivery and cesarean delivery primiparas during the early postpartum period, parameters such as LHA, LHAP, LHLD, LHC showed a positive correlation with POP. The correlation between LHA and POP in the two groups was the highest, and the correlation between LHA and POP in the vaginal delivery group was higher than that in the cesarean delivery group (0.671/0.634). This is consistent with the conclusion of Handa et al. [22]. In women with a vaginal delivery, the LAM relaxation expands to both sides, and the LH expansion reduces the support capacity of the pelvic organs. In addition, in women who undergo a vaginal delivery, the Valsalva maneuver tends to be more effective, and the sensitivity of POP increases when the abdominopelvic pressure increases. When the fetus bypasses the birth canal via cesarean section, the damage to LAM and pelvic floor structure is less severe, resulting in a lower correlation between LH parameters and POP than in a vaginal delivery. The current study found that LH parameters and muscle strength are potentially important markers for identifying women at higher risk of prolapse. Future research is still needed to determine whether interventions aimed at reducing hiatus size or increasing muscle strength could be effective preventive strategies to reduce the incidence of POP.
This study conducted a detailed analysis of the ROC curve and the diagnostic efficacy of LHA, PRM Elasticity, the thickness of LAM, and their combination in diagnosing POP in both vaginal delivery and cesarean section groups. It was found that the AUC for LHA in the vaginal delivery group was higher than in the cesarean section group (0.903 vs. 0.873). The thickness of LAM showed no significant difference between the two groups (0.689 vs. 0.691). The highest AUC was seen in the combined diagnosis of the three parameters (0.944 in the vaginal delivery group and 0.912 in the cesarean section group). Sensitivity was highest in the combined diagnosis approach (88.6% in the vaginal delivery group, and 100% in the cesarean section group).
Vaginal delivery leads to more evident dilation of the LH and weaker pelvic floor muscle strength, increasing the likelihood of POP compared to cesarean section. Although cesarean section theoretically protects the pelvic floor tissue structures, it entails iatrogenic trauma to the abdomen and uterus. The incision itself can negatively impact pelvic floor function and limit postpartum activities. Furthermore, complications such as incision infection, scar tissue formation at the incision site, and endometriosis can hinder the recovery of pelvic floor function.
Béchard et al. [21] found that 12 months after delivery, the pelvic floor function and quality of life of women who had delivered vaginally or by cesarean section were evaluated. They found that women who delivered vaginally scored higher than those who delivered by cesarean section (56:55), indicating a better quality of life. Schiavi et al. [23] reported that following natural vaginal tissue repair treatment in postpartum POP patients, improvements were observed in scores related to prolapse quality of life, pelvic floor disability index and pelvic floor impact questionnaire. These changes demonstrated that the quality of life was significantly improved after treatment, and the proportion of patients with regular sexual activity increased. Dyspareunia was reduced, indicating that those receiving the necessary reparative treatment after childbirth can significantly improve their quality of life.
In this study, TP-3DUS combined with RT-SWE was used to quantitatively and qualitatively evaluate the pelvic floor function of pregnant patients and primiparas in the early postpartum period. This evaluation encompassed parameters such as pelvic floor muscle strength, LAM thickness, LH size, POP and downward displacement distance. The aim was to provide exploratory data for clinical practice on the changes of PRM elasticity and LAM thickness during pregnancy. This data may help clinical identification of high-risk parturients, assisting in the guidance of delivery mode selection. It may also provide personalized suggestions for the prevention of postpartum PFD, such as considering episiotomy, choosing appropriate delivery mode, avoid the occurrence of perineal tears, POP, Stress Urinary Incontinence (SUI) and other forms of PFD. We evaluated the efficacy of PRM elasticity, LHA, the thickness of LAM, and the combination of the three parameters in the diagnosis of early postpartum POP by comparing the differences of pelvic floor structure and pelvic floor muscle stiffness in primiparas with different delivery modes, so as to provide personalized suggestions for the treatment of early postpartum POP.
• At present, there are few research reports on pelvic floor function during pregnancy. In this study, quantitative analysis of pelvic floor muscles during pregnancy was performed to provide clinical exploratory data on the changes of PRM elasticity and LAM thickness during pregnancy.
• In this study, the stiffness and thickness of pelvic floor muscles, the LHA and the combined diagnosis of POP were analyzed in the early postpartum period of women with vaginal delivery and cesarean section. By detecting the changes of PRM elasticity and the thickness of LAM, the adverse factors of poor cooperating women with Valsalva maneuver and the influence of subjective factors of examination were effectively compensated.
• The stiffness and thickness of pelvic floor muscle were only analyzed in the first-, second- and third-trimester of pregnancy, and the specific gestational weeks were not available.
• No prolonged follow-up.
• The pelvic floor function after pelvic floor rehabilitation training was not evaluated.
• Longitudinal studies are recommended to assess PRM hardness during pregnancy and to refine the gestational weeks for better prediction of prenatal LAM damage.
• Investigation into PFD-related genes could provide genetic insights into the occurrence of POP.
• Explore the potential relationship between genetic factors and ultrasound indicators to enhance understanding and diagnosis of POP.
TP-3DUS combined with RT-SWE is a novel, effective, and convenient method to evaluate the structure and function of the pelvic floor and the elasticity of pelvic floor muscles during pregnancy and early postpartum. LHA, PRM stiffness and the thickness of LAM all demonstrate diagnostic potential for early postpartum POP, and the combination of the three has the best diagnostic efficacy.
During the preparation of this work the authors used ChatGpt-3.5 in order to check spell and grammar. After using this tool, the authors reviewed and edited the content as needed and takes full responsibility for the content of the publication.
The datasets generated and/or analysed during the current study are available from the corresponding author upon reasonable request.
ATY and YLZ designed the research study. ATY, QJ, XRC, XTM, LQZ and FX performed the research. YLZ and XRC provided help and advice on the data collection. XTM, LQZ and FX analyzed the data. All authors contributed to editorial changes in the manuscript. All authors read and approved the final manuscript. All authors have participated sufficiently in the work and agreed to be accountable for all aspects of the work.
This study received approval from the Ethics Review Committee of the Affiliated Hospital of Yunnan University (Ethics review No.: 2021164). Informed consent was obtained from all participants.
We would like to express our gratitude to all those who helped us during the writing of this manuscript. Thanks to all the peer reviewers for their opinions and suggestions.
This research received no external funding.
The authors declare no conflict of interest.
References
Publisher’s Note: IMR Press stays neutral with regard to jurisdictional claims in published maps and institutional affiliations.