


 , Weiqin Lv 2,†, Jianfei Guo 1,†, Yun Shang 2, Fan Yang 3, Xiaomin Zhang 3, Keyuan Xiao 3, Liang Zong 3,4,*
 , Wenqing Hu 4,*
1 Department of Gynecology, Changzhi People's Hospital, The Third Clinical College of Changzhi Medical College, 046000 Changzhi, Shanxi, China
2 Department of Gynecology, Yuncheng Central Hospital, The Affiliated Hospital of Shanxi Medical University, 044000 Yuncheng, Shanxi, China
3 Department of Central laboratory, Changzhi People's Hospital, The Third Clinical College of Changzhi Medical College, 046000 Changzhi, Shanxi, China
4 Department of Gastrointestinal Surgery, Changzhi People's Hospital, The Third Clinical College of Changzhi Medical College, 046000 Changzhi, Shanxi, China
†These authors contributed equally.
Abstract
Background: Cancer prognoses have been indicated to be associated with Onodera’s prognostic nutritional index (OPNI), the neutrophil-to-lymphocyte ratio (NLR), the platelet-to-lymphocyte ratio (PLR), and the systemic immune-inflammatory index (SII). We investigated the prognostic value of the OPNI, NLR, PLR, and SII for serous ovary cancer (SOC). Methods: We retrospectively analyzed the cases of 133 patients with SOC treated at our institution from 2014 to 2021. The survival of the patients was assessed utilizing the Kaplan-Meier method to analyze overall survival (OS). Additionally, a multivariate analysis employing the Cox proportional hazard regression model was conducted to identify the independent prognostic factors for SOC. The positive event for the ROC diagnosis is mortality during follow-up. Results: The results revealed the following optimal cut-off points: OPNI, 45.5; NLR, 2.3; PLR, 224.4; and SII, 747.5. A comparative analysis demonstrated significant differences between high- and low-OPNI score groups in the treatment method, tumor stage, lymph node metastasis, albumin, NLR, PLR, and SII; other indicators are not irrelevant. We also observed that the OPNI, NLR, PLR, and SII were related to OS: the OPNI score was positively correlated with OS whereas the NLR, PLR, and SII values were negatively correlated with OS. These results identified the OPNI as the best prognostic indicator for SOC. Conclusions: Our findings demonstrate that the OPNI, NLR, PLR, and SII could be used as predictive and prognostic parameters for SOC.
Keywords
- serous ovary cancer
- neutrophil to lymphocyte ratio
- platelet to lymphocyte ratio
- systemic immune-inflammatory index
- Onodera's prognostic nutritional index
Among gynecological cancers, epithelial ovarian cancer (EOC) stands out with the highest mortality rate. Each year, nearly 295,000 females are diagnosed with EOC worldwide, and 185,000 die from this disease [1]. EOC is the main cause of cancer deaths among women in the United States and accounts for the first death of gynecological cancer [2, 3]. The mortality due to EOC is attributed primarily to the difficulty in its early detection and its resistance to treatment. Approximately 70% of patients with EOC are diagnosed as the International Federation of Gynecology and Obstetrics (FIGO) stage III or stage IV when their disease is identified [4]. Despite the use of radical first-line treatment, 70% of patients with EOC will experience a relapse in the first 3 years postdiagnosis.
Study of the mechanisms that underlie tumor progression have shown that some immune cells are part of the cell composition of the tumor microenvironment, playing crucial roles in tumor invasion including proliferation, evolution, and diffusion [5]. It has also been demonstrated that the immune/inflammatory cell composition is correlated with the tumorigenesis, development, and diffusion of EOC. The neutrophil-to-lymphocyte ratio (NLR) and the platelet-to-lymphocyte ratio (PLR) were shown to be significance prognosis indicators in non-small-cell lung cancer, digestive-system tumors, and EOC [6, 7, 8, 9, 10].
Onodera’s prognostic nutritional index (OPNI) has been used to assess patients
with digestive-system tumors; the OPNI = serum albumin (g/L) + 5
We gathered patient data from individuals diagnosed with SOC who underwent treatment at Changzhi People’s Hospital (Changzhi, Shanxi, China) and Yuncheng Central Hospital (Yuncheng, Shanxi, China) during the period 2014–2021. The following study inclusion criteria were used: (i) the patient’s diagnosis was verified by imaging techniques and postoperative pathology, (ii) the patient had no coeval tumors (no primary cancer at other locations), (iii) no evidence of infection was detected (including a normal body temperature and normal blood cell analysis results), and (iv) the patient had complete clinical and follow-up data. The exclusion criteria were: (i) the presence of hematologic illness, autoimmune disease, organ dysfunction, acute or chronic infection, and other diseases that may impact hematologic indexes; and (ii) history of other malignant tumors. A total of 133 high- or low-grade SOC cases were analyzed based on these criteria (high-grade: n = 87, low-grade: n = 6, no classification: n = 40).
All patients underwent a peripheral routine blood examination within 7 days
prior to their initial treatment, which involved either neoadjuvant chemotherapy
(NACT) or primary debulking surgery (PDS). The types of treatment included
neoadjuvant chemotherapy + interval debulking surgery + chemotherapy, or primary
debulking surgery + chemotherapy. The chemotherapy regimen was
paclitaxel-carboplatin 21-day therapy. Each patient’s tumor stage, histological
type, and presence/absence of lymph node metastases were based on her
postoperative pathology. The level of the tumor marker ‘cancer antigen 125’
(CA-125) was measured in all patients prior to their initial treatment. The four
indices were computed using the following formulas: OPNI = serum albumin (g/L) +
5
The patients’ clinicopathological characteristics were gathered, including age, lymph node metastasis, tumor stage, and laboratory test results. According to the FIGO stage, the patients were categorized by the FIGO classification into four stages: I, II, III, and IV.
The patients were followed periodically by imaging and hematological assessments to determine whether disease progression had occurred. Their follow-up data were obtained from the patients’ admission records or the patient herself or a family member.
The follow-up for each patient was as follows: visits every 3 months for the first 2 years after diagnosis, then every 6 months for 3 years, and then annually after 5 years. A physical exam including a pelvic exam was conducted as clinically indicated, as were chest/abdominal/pelvic computed tomography (CT), magnetic resonance imaging (MRI), positron emission tomography (PET)/CT, or PET (skull base to mid-thigh). The patients’ complete blood count (CBC) and chemistry profile were evaluated as indicated. CA-125 and/or other tumor markers were examined if they were initially elevated.
The end point of this study was the patients’ overall survival (OS).
IBM SPSS 20.0 Statistics software (IBM, Armonk, NY, USA) and GraphPad Prism ver.
8.0.2 (GraphPad Software, San Diego, CA, USA) were used for the statistical
analyses. Receiver operating characteristic (ROC) curves were created to identify
optimal cut-off points for the aforementioned variables. These cut-off points were
then applied to stratify the patients into high-value and low-value groups. The
patients’ OS was conducted using the Kaplan-Meier method and log-rank tests for
univariate analyses, while multivariate analyses were performed using Cox
regression analysis. The associations were evaluated through hazard ratios (HRs)
and 95% confidence intervals (95% CIs). The comparisons of the patients’ OPNI
data and their clinicopathological characteristics were carried out with either
the Pearson
We performed an analysis of 133 cases of patients with SOC. There were 69
(51.9%) patients aged
| Age; median, years | ||
| 64 (48.1%) | ||
| 69 (51.9%) | ||
| Tumor stage | ||
| FIGO I | 19 (14.3%) | |
| FIGO II | 19 (14.3%) | |
| FIGO III | 87 (65.4%) | |
| FIGO IV | 8 (6.0%) | |
| Lymph node metastasis | ||
| Negative | 89 (66.9%) | |
| Positive | 17 (12.8%) | |
| Uncertain | 27 (20.3%) | |
| Albumin | ||
| 17 (12.8%) | ||
| 116 (87.2%) | ||
| CA-125 | ||
| 20 (15.0%) | ||
| 108 (81.2%) | ||
| Uncertain | 5 (3.8%) | |
| OPNI | ||
| 34 (25.6%) | ||
| 99 (74.4%) | ||
| NLR | ||
| 49 (36.8%) | ||
| 84 (63.2%) | ||
| PLR | ||
| 82 (61.7%) | ||
| 51 (38.3%) | ||
| SII | ||
| 61 (45.9%) | ||
| 72 (54.1%) | ||
Data are n (%). CA-125, cancer antigen 125; OPNI, Onodera’s prognostic nutritional index; NLR, neutrophil-to-lymphocyte ratio; PLR, platelet-to-lymphocyte ratio; SII, systemic immune-inflammatory index; FIGO, the International Federation of Gynecology and Obstetrics.
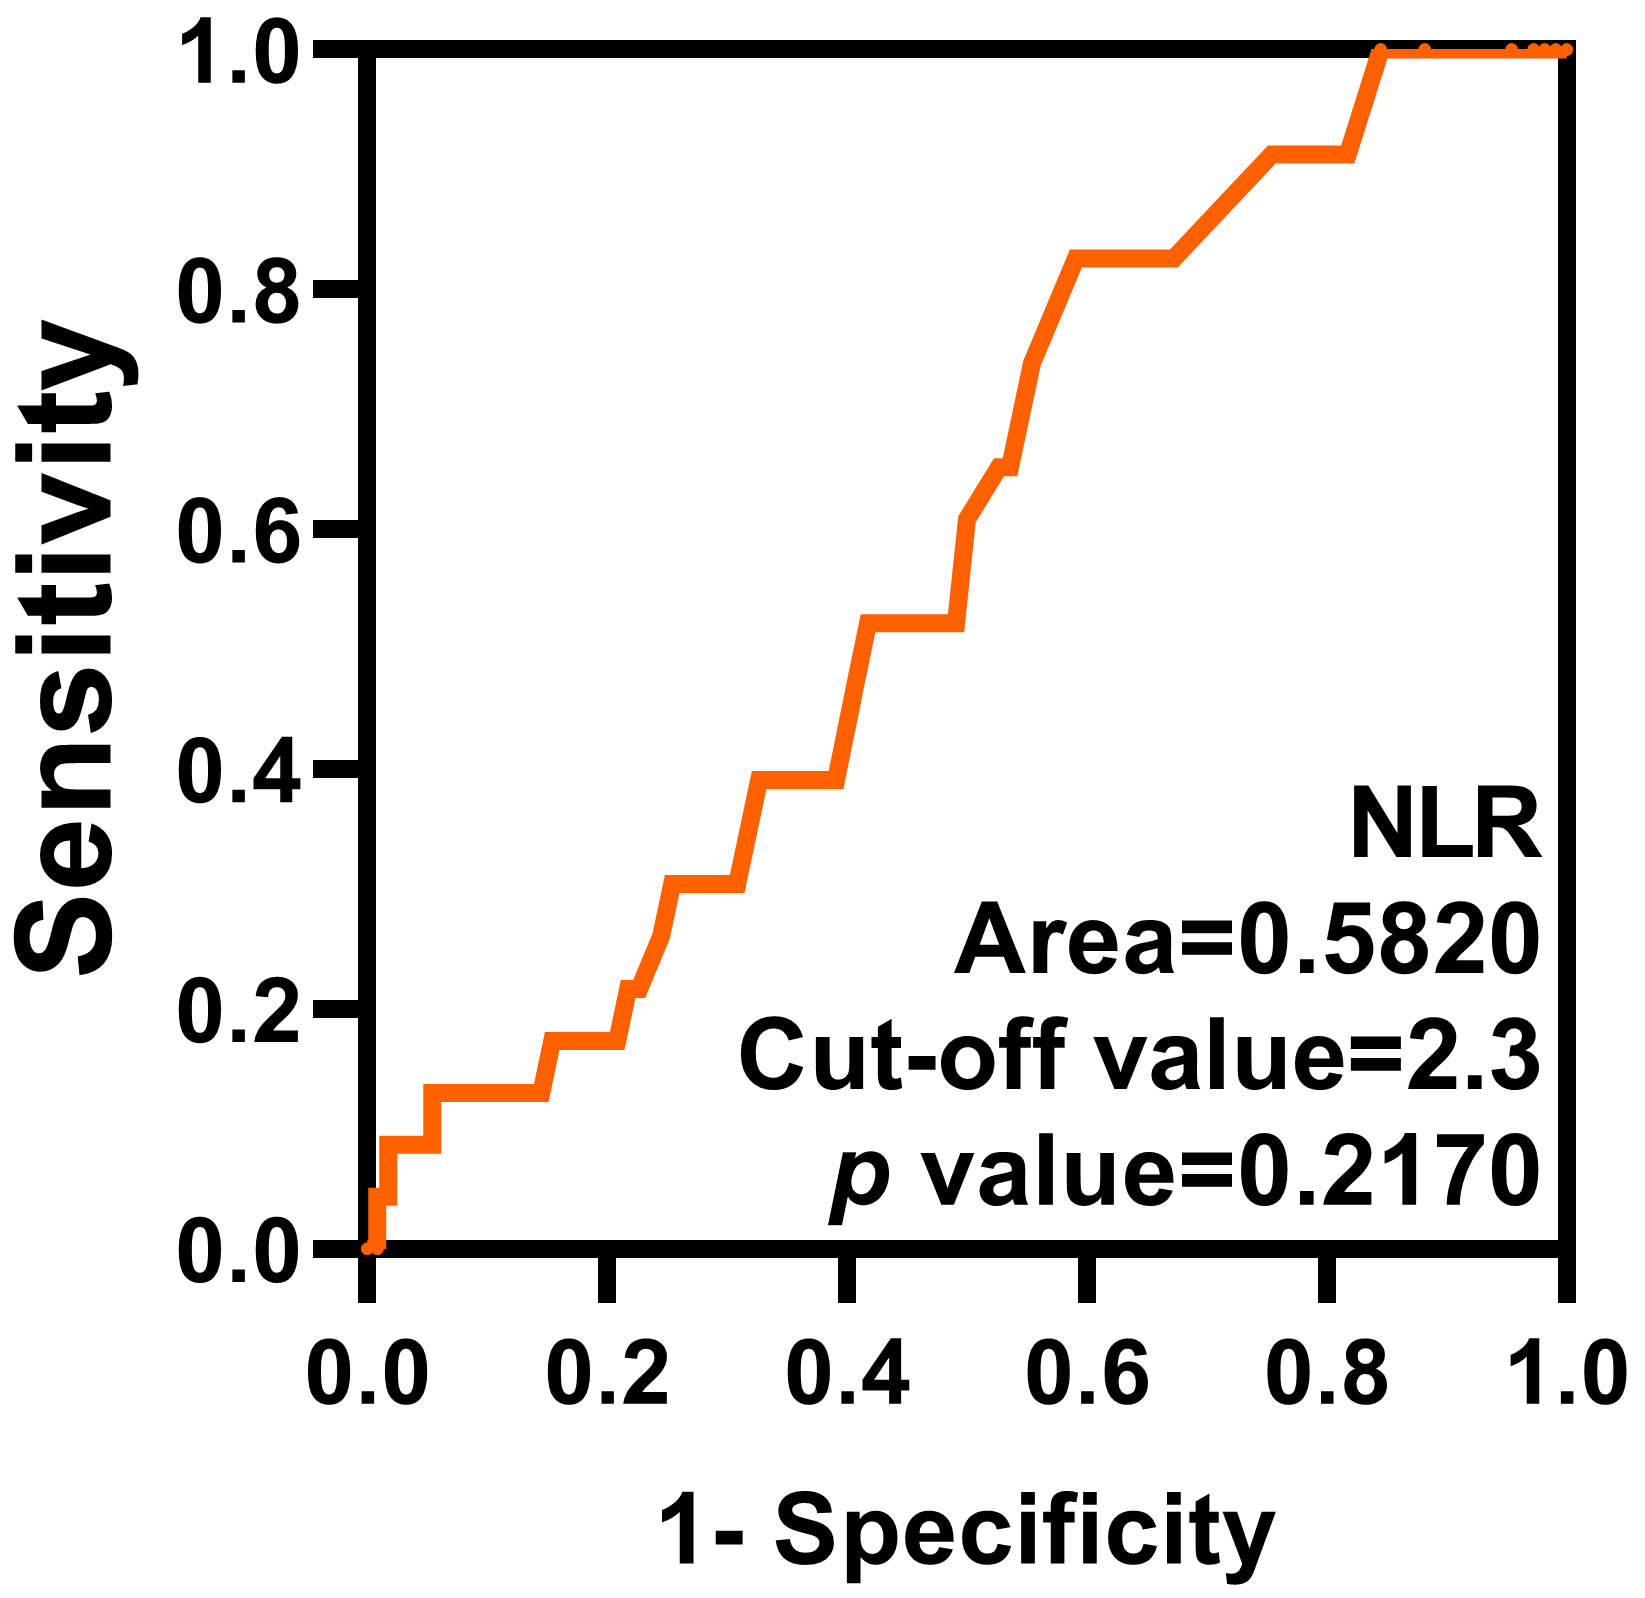 Fig. 1.
ROC curve of the NLR. The optimal cut-off value of the NLR is 2.3. ROC, receiver operating characteristic.
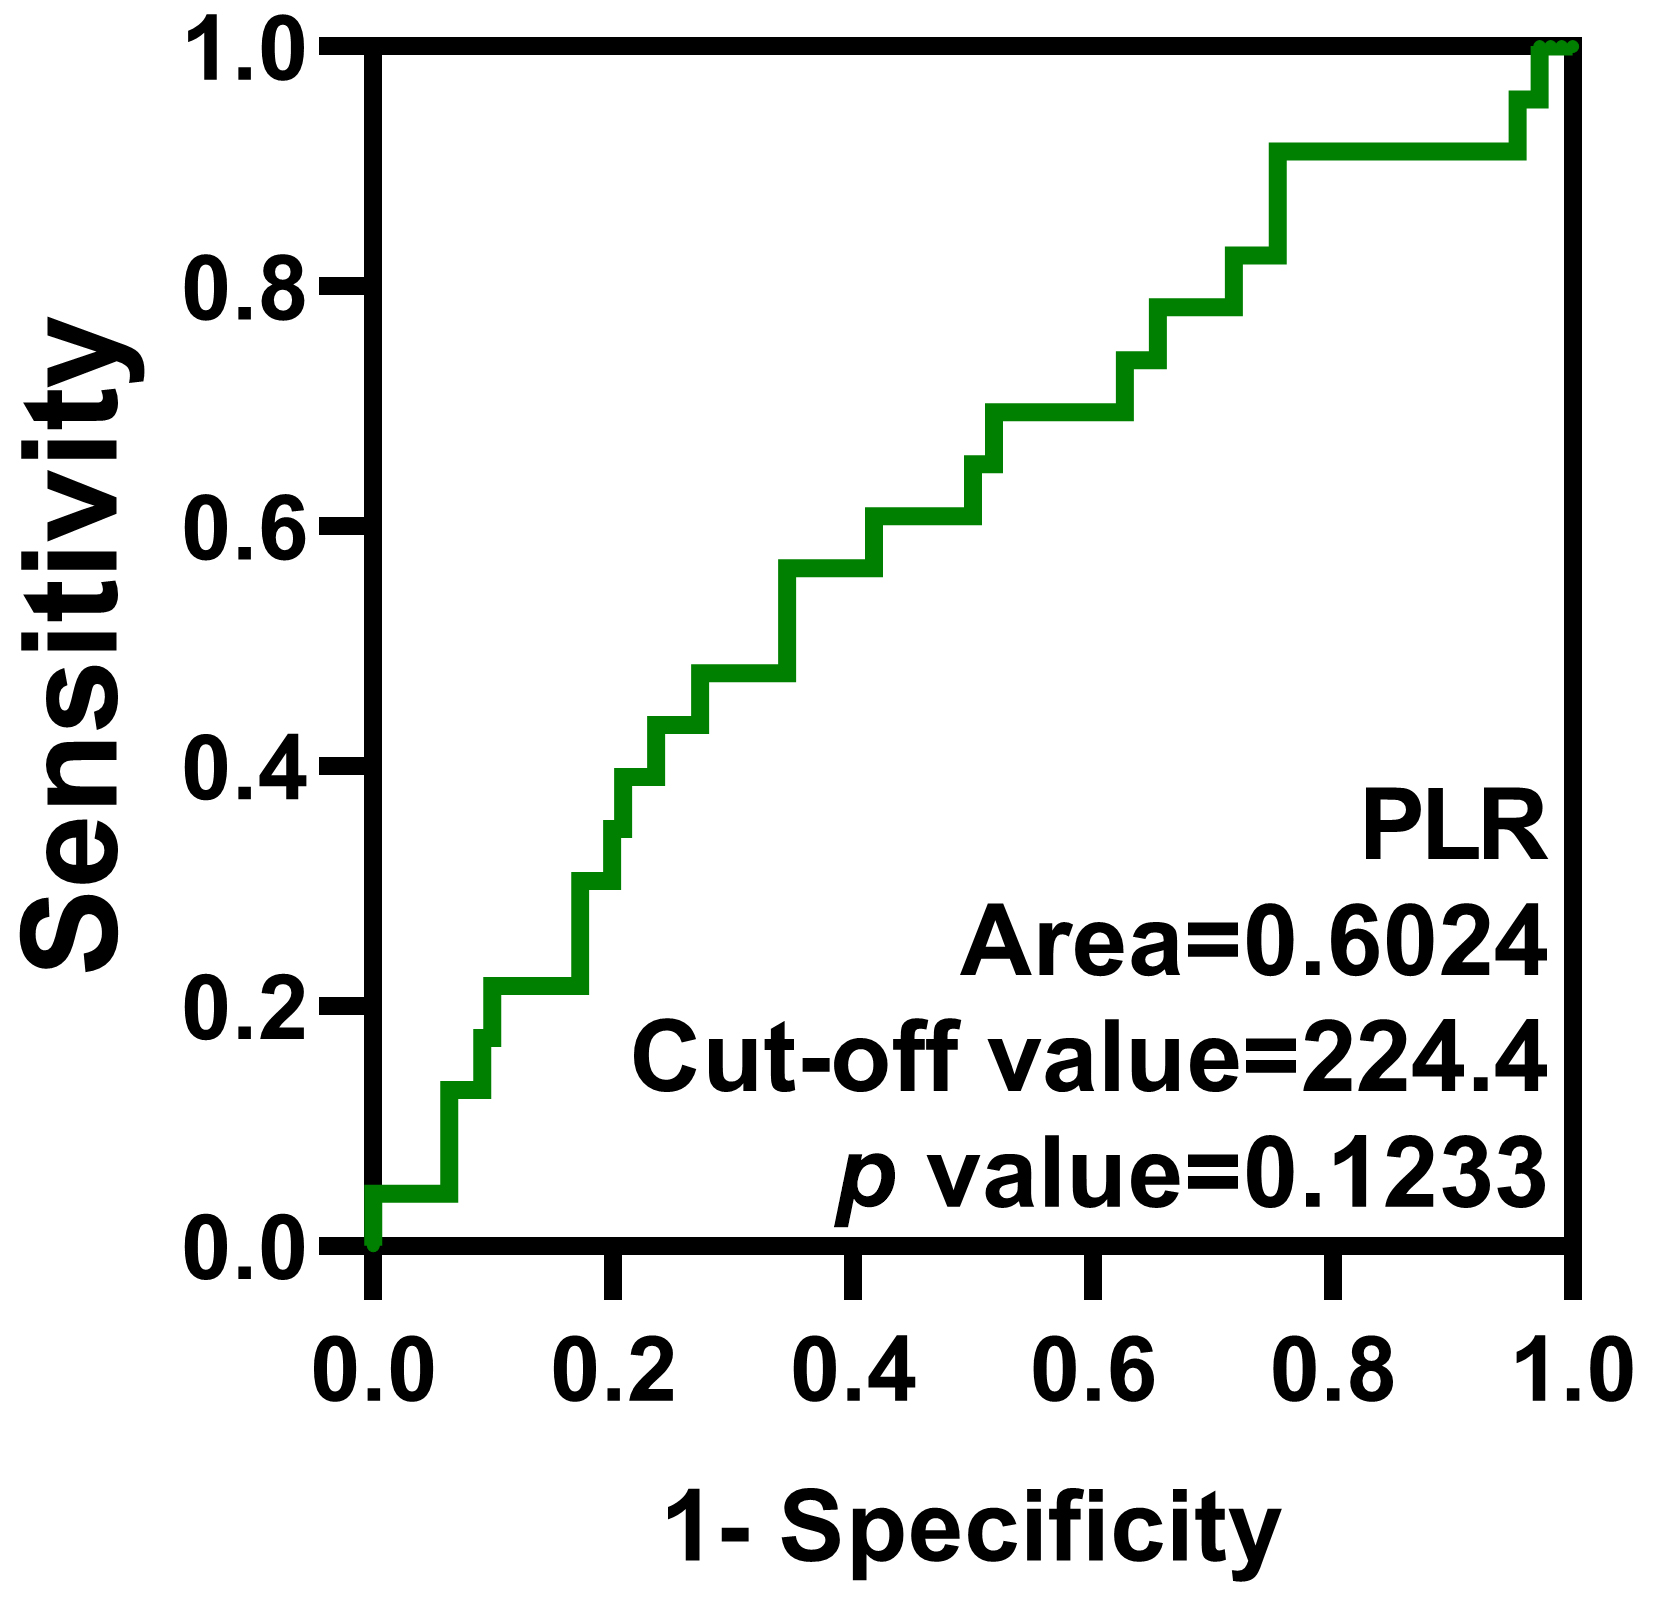 Fig. 2.
ROC curve of the PLR. The optimal cut-off value of the PLR is 224.4.
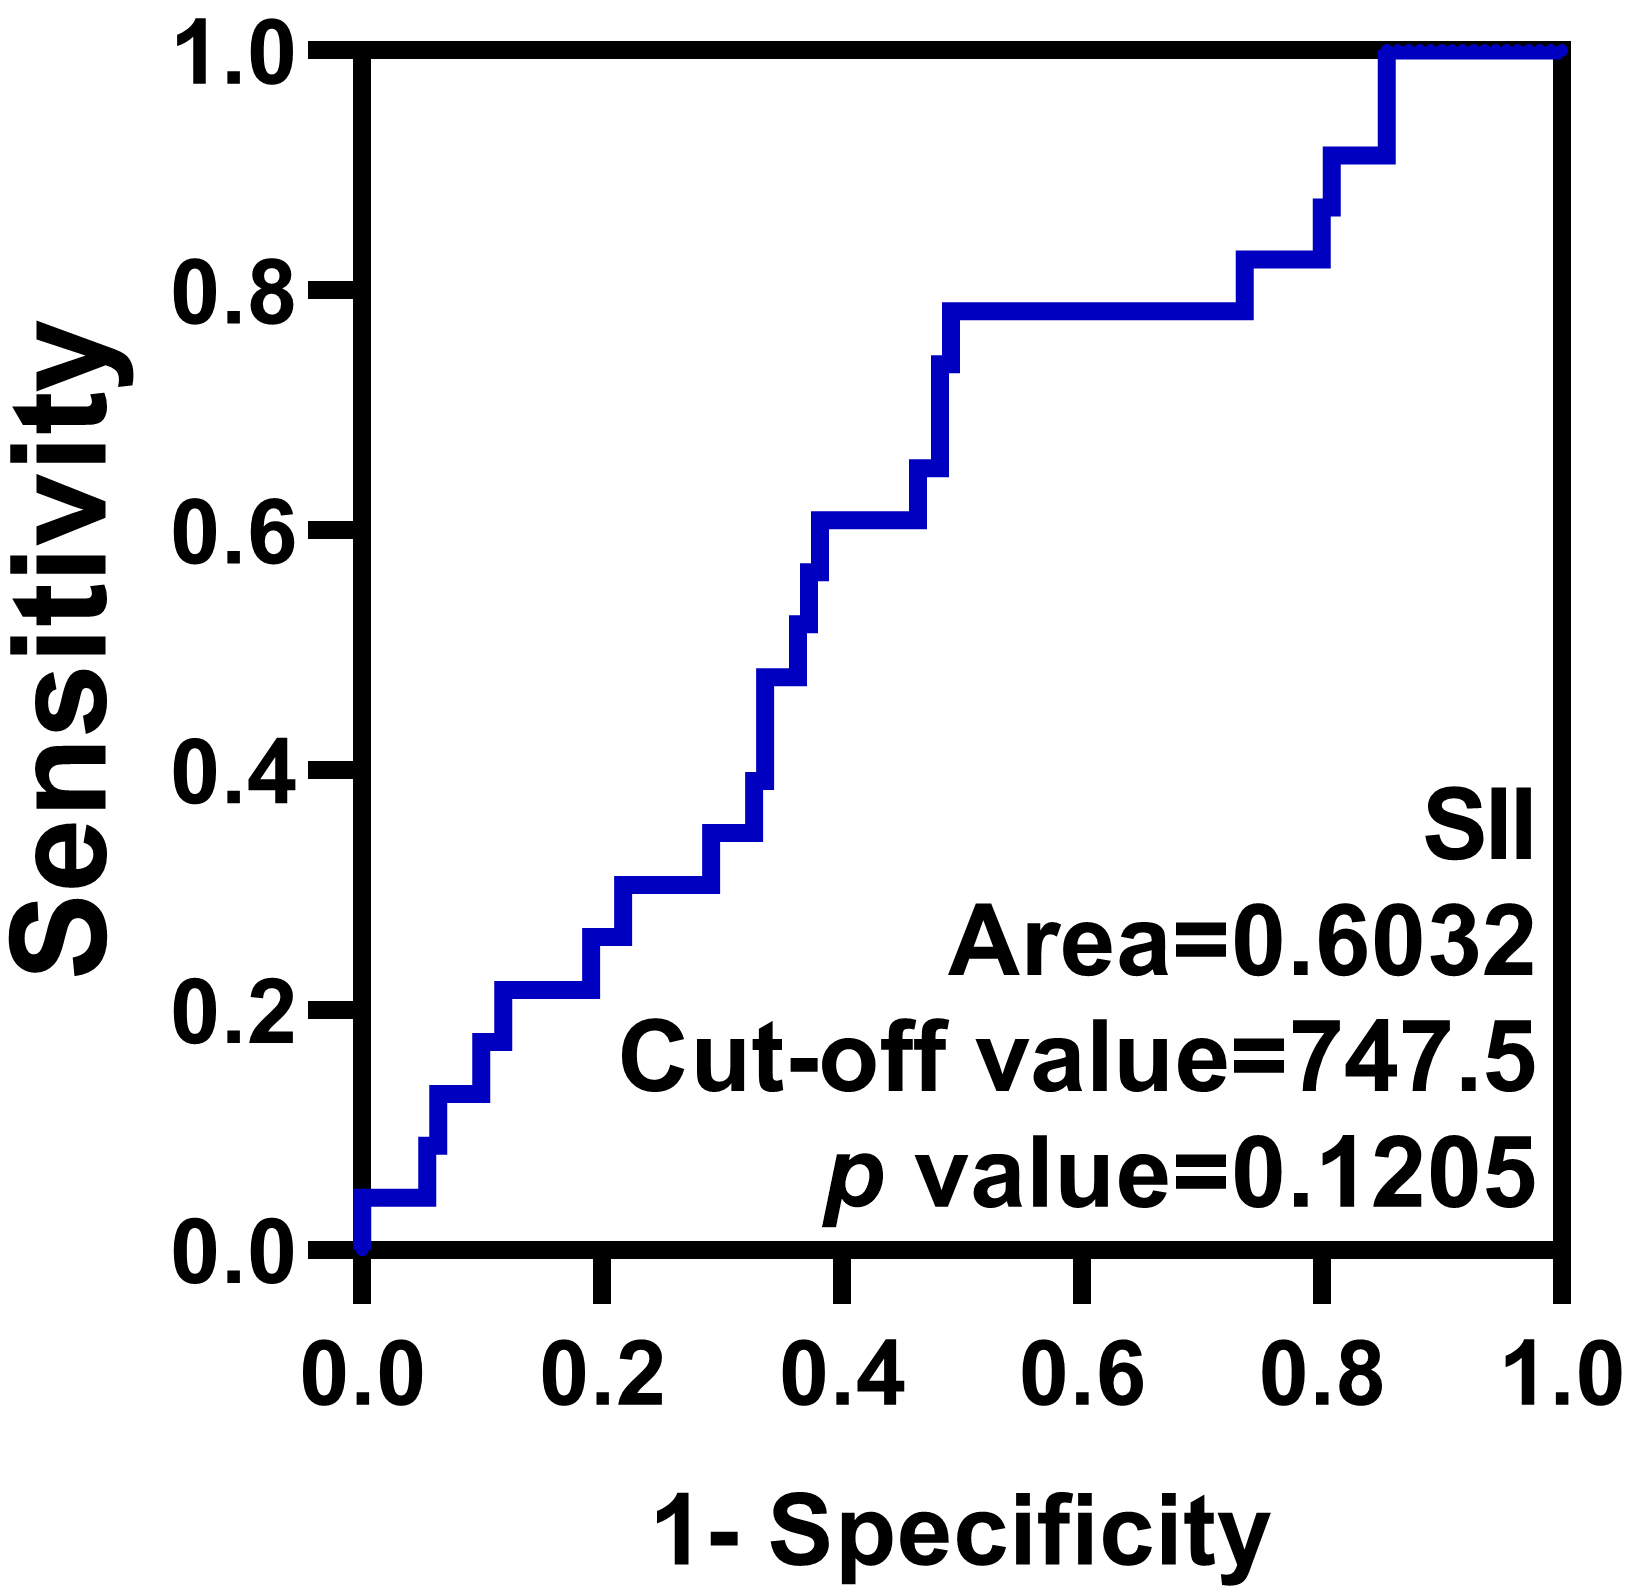 Fig. 3.
ROC curve of the SII. The optimal cut-off value of the SII is 747.5.
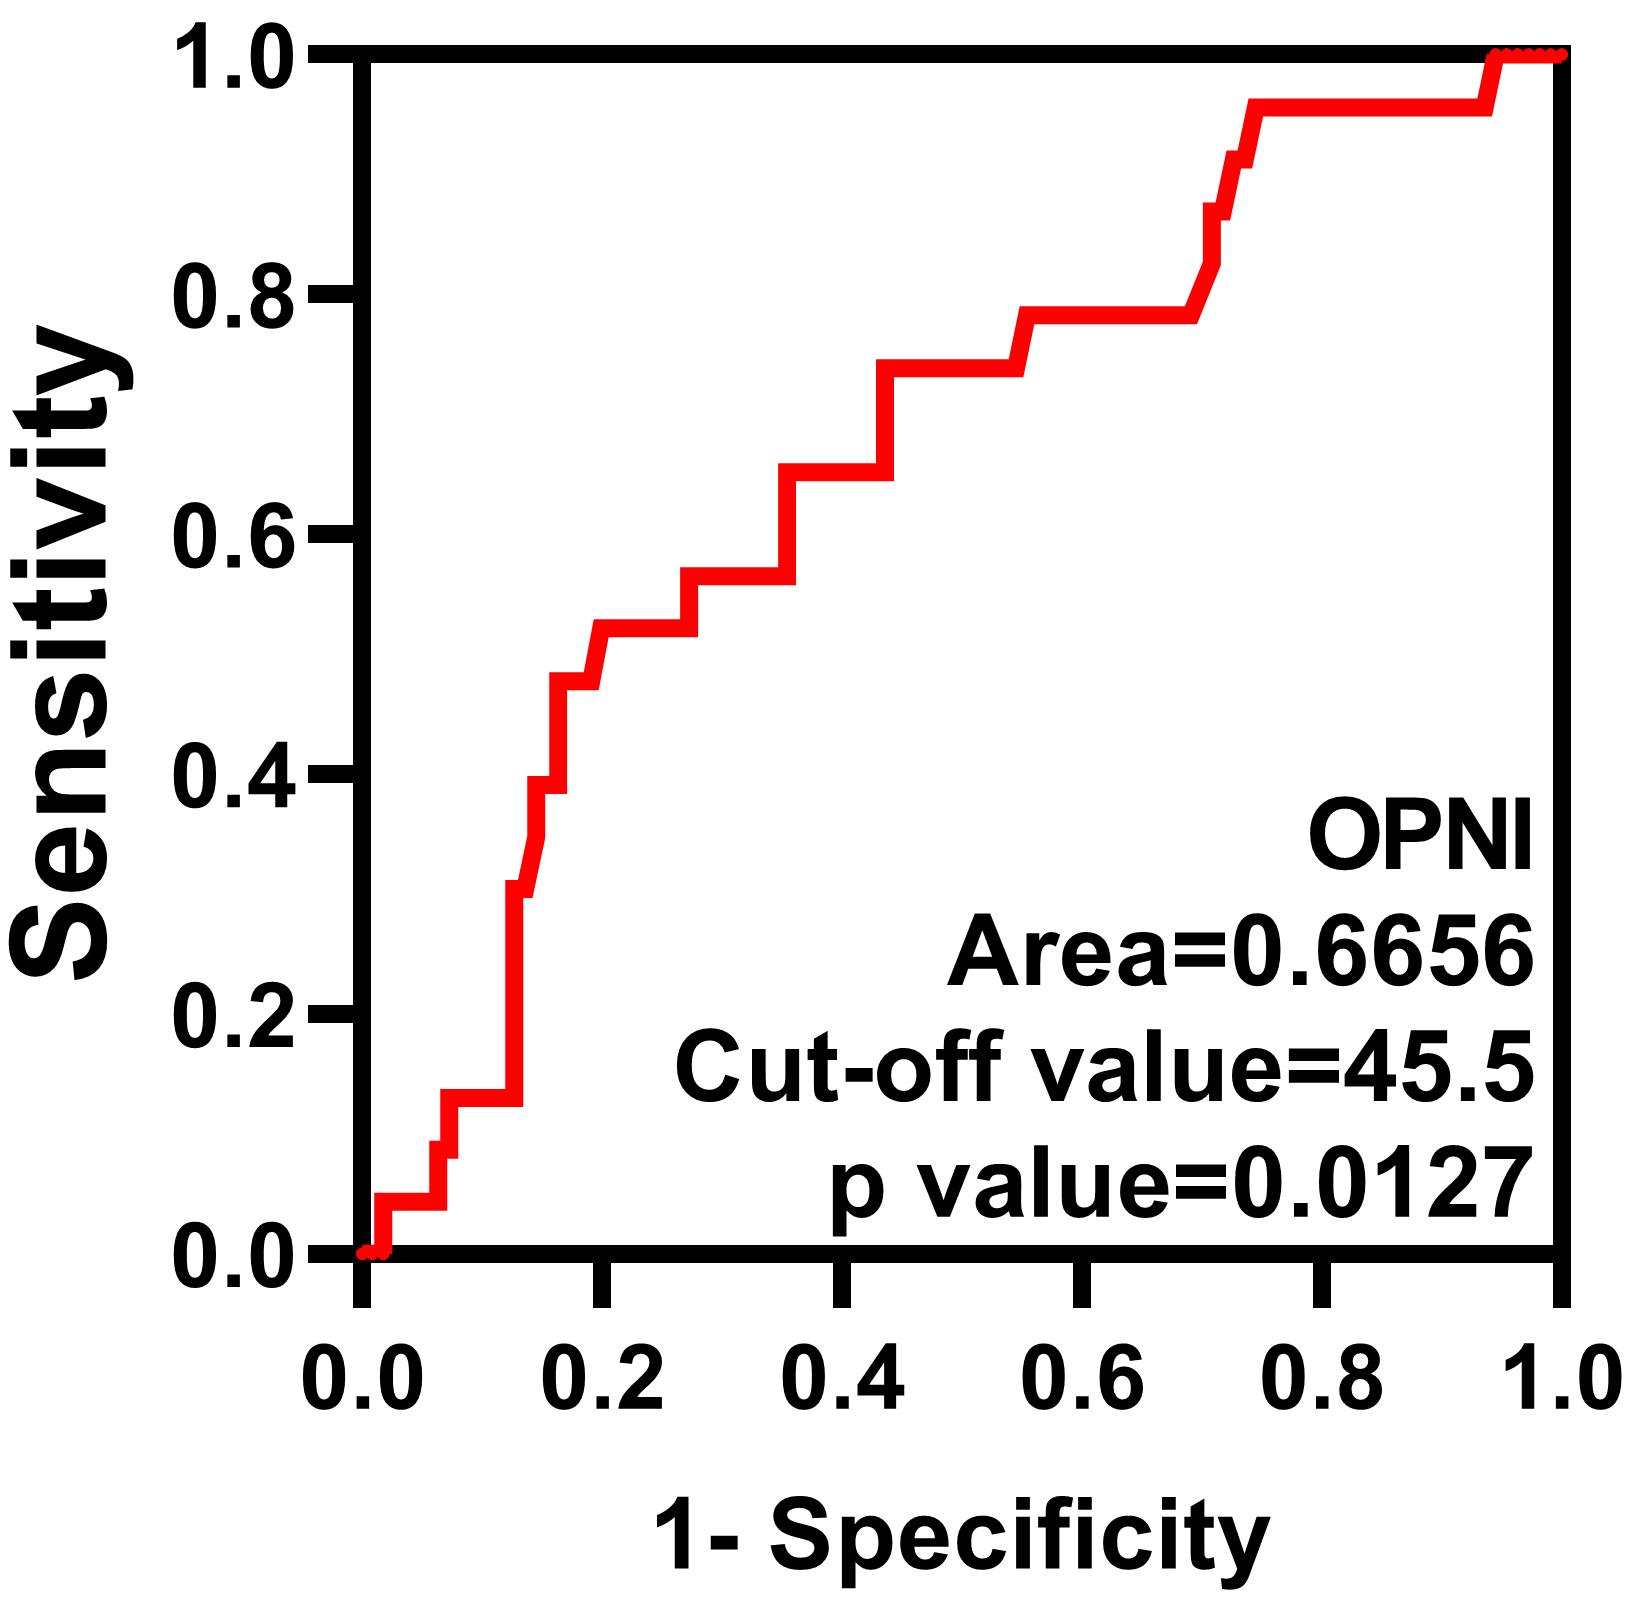 Fig. 4.
ROC curve of the OPNI. The optimal cut-off value of the OPNI is 45.5.
After the patients’ surgery and chemotherapy were completed, the CT and tumor marker examinations were performed. The median duration of follow-up was 26 months, ranging from 5 to 86 months. Among the 131 patients, 23 individuals (17.29%) passed away due to their SOC.
With regard to lymph node metastasis, 89 (66.9%) cases showed no metastasis, 17
(12.8%) patients presented positive lymph node metastasis, and 27 (20.3%) cases
were classified as ‘uncertain’. An albumin level
We used the AUC values to compare the predictive capabilities of the four
indices for the occurrence of death among the SOC patients. The results
demonstrated that among these indices, the OPNI had the largest area under the
ROC curve, signifying better predictive ability. The correlations between the
clinic pathological parameters and the OS are presented in Table 2. The results
of the univariate survival analyses indicated that the tumor stage (p =
0.0292), NLR (p = 0.0434), PLR (p = 0.0024), SII (p =
0.0089), and OPNI (p
| Variable | Univariate analysis | Multivariate analysis | |||||
| hazard ratio (HR) | 95% confidence interval (95% CI) | p-value | HR | 95% CI | p-value | ||
| Age, years | |||||||
| reference | |||||||
| 1.290 | 0.5697–2.922 | 0.5402 | |||||
| Tumor stage | |||||||
| FIGO I and II | reference | ||||||
| FIGO III and IV | 3.450 | 1.457–8.171 | 0.0292 | 2.684 | 0.494–14.571 | 0.253 | |
| Lymph node metastasis | |||||||
| Negative | reference | ||||||
| Positive | 2.012 | 0.3999–10.12 | 0.2708 | 1.363 | 0.322–5.776 | 0.674 | |
| Albumin | |||||||
| reference | |||||||
| 0.4758 | 0.1149–1.970 | 0.1623 | |||||
| CA-125 | |||||||
| reference | |||||||
| 1.185 | 0.3763–3.730 | 0.7825 | |||||
| OPNI | |||||||
| reference | |||||||
| 0.1966 | 0.06733–0.5742 | 0.244 | 0.063–0.947 | 0.041 | |||
| NLR | |||||||
| reference | |||||||
| 2.835 | 1.218–6.597 | 0.0434 | 0.491 | 0.046–5.232 | 0.556 | ||
| PLR | |||||||
| reference | |||||||
| 3.262 | 1.319–8.066 | 0.0024 | 1.204 | 0.230–6.298 | 0.826 | ||
| SII | |||||||
| reference | |||||||
| 3.426 | 1.513–7.761 | 0.0089 | 2.531 | 0.242–26.491 | 0.438 | ||
The survival curve analysis identified significant correlations between
the patients’ overall survival (OS) and the OPNI, the NLR, the PLR, and the SII,
respectively (high OPNI vs. low OPNI, p
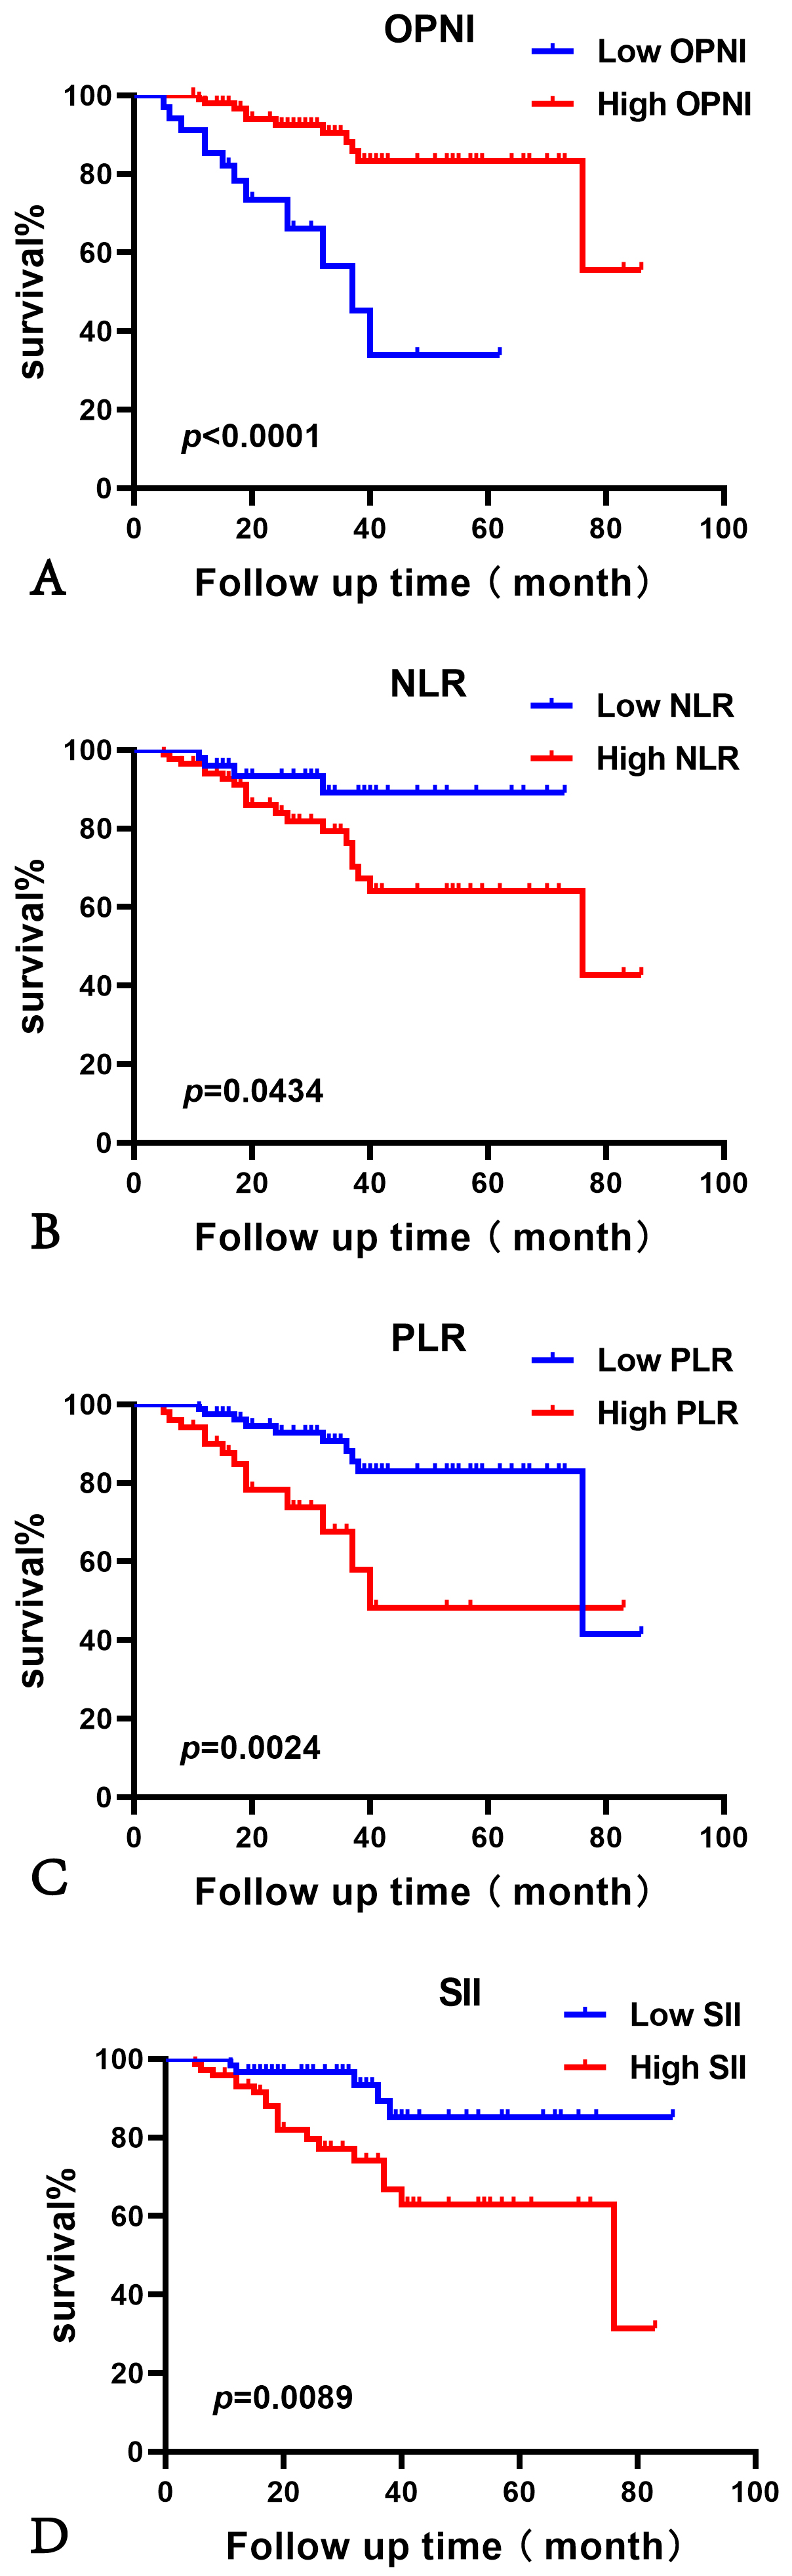 Fig. 5.
The overall survival (OS) analysis of patients with serous ovary cancer (SOC). The Kaplan–Meier curve analysis showed high OS rates in the patients who presented with a high OPNI (A) or a low NLR (B), low PLR (C), or low SII (D). (A) the number of cases for Low OPNI is 34; for High OPNI, it is 99. (B) the number of cases for Low NLR is 49; for High NLR, it is 84. (C) the number of cases for Low PLR is 82; for High PLR, it is 51. (D) the number of cases for Low SII is 61; for High SII, it is 72.
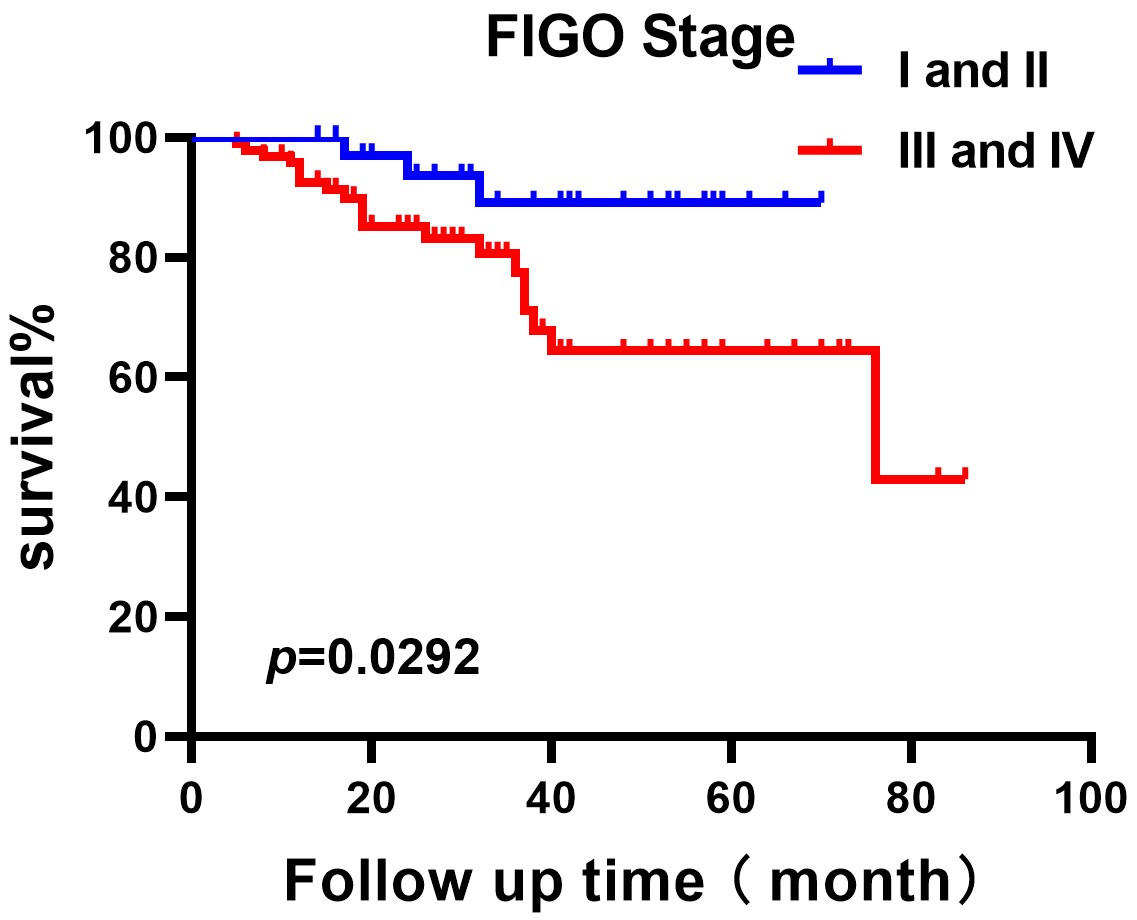 Fig. 6.
The OS analysis of patients with serous ovarian cancer (SOC) at different FIGO stages. The number of cases for FIGO Stage I and II is 38; and the number of cases for FIGO Stage III and IV is 95.
We conducted an additional analysis to explore the correlations between the OPNI
and various clinico-pathologic parameters, and the results revealed significant
correlations between a high OPNI value and FIGO I and II, negative lymph node
metastasis status, elevated serum albumin count, and CA-125
| Variable | Patients | p-value | ||
| OPNI |
OPNI |
|||
| Age, years | 0.886 | |||
| 16 (47.1%) | 48 (48.5%) | |||
| 18 (52.9%) | 51 (51.5%) | |||
| Tumor stage | 0.001 | |||
| FIGO I and II | 2 (5.9%) | 36 (36.4%) | ||
| FIGO III and IV | 32 (94.1%) | 63 (63.6%) | ||
| Lymph node metastasis | 0.038 | |||
| Negative | 14 (66.7%) | 75 (88.2%) | ||
| Positive | 7 (33.3%) | 10 (11.8%) | ||
| Albumin | ||||
| 17 (50.0%) | 0 (0.0%) | |||
| 17 (50.0%) | 99 (100.0%) | |||
| CA-125 | 0.021 | |||
| 1 (3.0%) | 19 (20.0%) | |||
| 32 (97.0%) | 76 (80.0%) | |||
| NLR | ||||
| 3 (8.8%) | 46 (46.5%) | |||
| 31 (91.2%) | 53 (53.5%) | |||
| PLR | ||||
| 7 (20.6%) | 75 (75.8%) | |||
| 27 (79.4%) | 24 (24.2%) | |||
| SII | ||||
| 4 (11.8%) | 57 (57.6%) | |||
| 30 (88.2%) | 42 (42.4%) | |||
Serous ovarian carcinoma (SOC) is a highly malignant disease, presenting ascites, hypoproteinemia, and subsequently malnutrition. When tumor cells cannot obtain the nutrition they require from their host’s body, the body’s destruction will be accelerated. Patients’ nutritional evaluations thus play a crucial role in the prediction of disease progression. As emphasized by Thompson et al. [17], the immune system plays a crucial role in aggravating the progression of a tumor.
The OPNI, which was first applied in 1984, can be used to evaluate the risk of post-surgery complications and mortality in individuals with gastrointestinal tumors, and the OPNI has been gradually used to assess the survival of various carcinoma types, especially digestive-system tumors [18, 19]. In our two-center retrospective research, we discovered that patients with SOC and a high OPNI value achieved better OS. In the present study’s univariate and multivariate survival analyses, the OPNI was a better independent prognostic marker compared to the NLR, PLR, and SII, which are important parameters representing both inflammatory and nutritional status.
Another study indicated that the OPNI is associated with nutritional and immune status [20], which led us to speculate that the OPNI might be potential prognostic marker in OC. Study has suggested that the OPNI holds potential for predicting postoperative complications and the duration of hospital stays in patients with esophageal carcinoma [21]. Additionally, a low OPNI score may adversely affect the OS of these patients [21]. Xu et al. [22] revealed that the OPNI had high utility in the prediction of the survival of patients with hepatocellular carcinoma; their analyses demonstrated that the patients with high OPNI scores had better OS. Wang et al. [23] reported that low OPNI scores were associated with worse recurrence-free survival (RFS), suggesting that the OPNI could be used as an independent prognostic marker for gastrointestinal stromal tumors.
The distribution of clinical characteristics, OS, and progression-free survival (PFS) of patients with metastatic non-small cell lung cancer were clearly different in the group of patients with high OPNI scores compared to those of the group of patients with low OPNI scores in a study by Bozkaya et al. [24]. Our present investigation revealed correlations between the OPNI and the clinicopathological characteristics of patients with SOC. We observed that the patients’ tumor stage, NLR, PLR, SII, and OPNI values were clearly associated with the overall survival of SOC patients in a univariate survival analysis. Although the NLR, PLR, and SII were not identified as independent prognostic markers for OS in our multivariate analyses, the OPNI was identified as such a marker and was closely related to the prognosis of serous ovarian cancer.
Most women with advanced ovarian cancer need repeated drainage for ascites, with a high amount of protein leakage. Protein loss often leads to patients’ malnutrition. It is thus understandable that low OPNI scores were observed to be associated with advanced-stage SOC cases in the present study. In addition, higher rates of postsurgery complications and mortality were documented in patients with malnutrition [25]. A reduction in serum albumin levels indicates a compromised nutritional status, signifying a state of malnutrition. A decline in nutritional well-being is directly proportional to weakened immunity, consequently contributing to the progression of disease [26]. Nutrition-support treatment can effectively improve the prognosis of cancer patients [27]. We thus propose that the OPNI should be applied routinely in clinical settings for predicting the prognoses of patients with cancer.
The PLR value reflects the body’s balance of inflammatory and immune responses
and has been widely studied in cancer research. The PLR values of lung cancer
patients are significantly higher than those of healthy individuals. Similarly,
in a study comparing benign ovarian tumors with ovarian cancer, the PLR was
significantly elevated in the malignant cases [28]. A meta-analysis revealed that
among patients with ovarian cancer, having an elevated PLR was associated with
significantly reduced OS, and the PLR could be used as an independent predictor
of prognosis in ovarian cancer. Our present findings demonstrated that the PLR
had a significant prognostic value for SOC in a univariate analysis and the
high-PLR group (PLR
The systemic immune-inflammation index (SII) is a novel inflammatory marker that incorporates neutrophil, platelet, and lymphocyte counts. Emerging research has shown that the SII holds promise in predicting the prognosis of various tumors, including lung, gastric, and esophageal cancers; the SII value is also believed to accurately reflect inflammatory status. The utility of the SII has been widely studied in cancer research [29, 30]. The SII is the ratio of platelets multiplied by the neutrophil and lymphocyte counts, and an elevated SII indicates a relative increase in the platelet and/or neutrophil counts or a relative decrease in the lymphocyte count. Platelets play a crucial role in the recruitment of neutrophils and macrophages to the tumor microenvironment, and increased platelet counts in the peripheral blood correlate with poor tumor prognosis. In ovarian cancer, it has been shown that the FIGO stage in high-SII patients was significantly later and more prone to lymph node metastasis compared to low-SII patients, and that low-SII patients had longer PFS and OS compared to high-SII patients.
The results of our present investigation demonstrated that the SII had a
significant prognostic value for OS in the univariate analysis, and the low-SII
group (SII
Neutrophils play a crucial role in tumor development and progression, being mechanistically attracted to the tumor microenvironment. Once there, they release factors that promote proliferation and inhibit T-lymphocyte activity, thus facilitating tumor angiogenesis, invasion, and metastasis [31, 32, 33, 34]. The neutrophil-to-lymphocyte ratio (NLR) acts as a reliable gauge of systemic inflammation, capturing the delicate balance between anti-tumor immune activity and pro-tumor inflammation. Moreover, NLR stands out as an autonomous prognostic indicator across a spectrum of malignancies [35, 36, 37, 38]. Kwon et al. [39] discovered a correlation between an elevated NLR and lymph node metastasis, ascites, and FIGO staging in ovarian cancer patients. Moreover, ovarian cancer patients with a high NLR experienced shortened PFS and an increased mortality rate.
An increasing number of studies have pointed out that the NLR is related to the diagnosis of patients with early-stage ovarian cancer, and some studies combined the NLR and CA-125 to explore the significance of the NLR in the diagnosis of ovarian cancer [40, 41]. The results of those studies revealed that the combined use of the NLR and CA-125 can increase the detection rate of early-stage ovarian cancer. Another study suggested that ovarian cancer patients with an elevated NLR are more prone to progress to an advanced stage, and the risks of metastasis and recurrence were also increased in these patients [42]. The results of these studies affirm that a heightened NLR is an important observation in the monitoring of ovarian cancer’s progression.
There are some study limitations to address. We did not obtain the patients’ progression-free survival data. In addition, since this was not a prospective study, the results could have been affected by unfounded clinical characteristics. Multi-center prospective studies with greater numbers of patients could help overcome these limitations.
Our data showed that the OPNI, NLR, PLR and SII can be used broadly as effective indices to assist the prognostic assessment of patients with serous ovarian cancer. Additionally, OPNI is the only independent prognostic indicator for SOC patients in our study. The applications and practical value of the OPNI, NLR, PLR and SII in clinical settings merit further investigation.
The datasets used and/or analyzed during the current study are available from the corresponding author on reasonable request.
LZ and WH contributed to the study’s conception and design. YH designed the study, wrote the manuscript text, and analyzed the data. Material preparation, data collection, and statistical analysis was performed by JG. Data collection was performed by WL and YS, FY, XZ, and KX. All authors revised the manuscript. All authors contributed to editorial changes in the manuscript. All authors read and approved the final manuscript. All authors have participated sufficiently in the work and agreed to be accountable for all aspects of the work.
All subjects gave their informed consent for inclusion before they participated in the study. The study was conducted in accordance with the Declaration of Helsinki, and the protocol was approved by the Ethics Committee of Changzhi People’s Hospital (Changzhi, China; No. 2024K009), and Yuncheng Central Hospital (Yuncheng, China; YXLL2022011-4).
Thanks for the gynecology colleagues of the Changzhi People’s Hospital and Yuncheng Central Hospital.
This research received no external funding.
The authors declare no conflict of interest.
References
Publisher’s Note: IMR Press stays neutral with regard to jurisdictional claims in published maps and institutional affiliations.