


1 Department of Obstetrics and Gynecology, Shengjing Hospital of China Medical University, 110004 Shenyang, Liaoning, China
2 Department of Health Management, Shengjing Hospital of China Medical University, 110004 Shenyang, Liaoning, China
Abstract
Background: This study aims to evaluate the effectiveness of the Naples
Prognostic Score (NPS), Systemic Inflammation Score (SIS), and Controlling
Nutritional Status Score (COUNT) in distinguishing benign from malignant ovarian
neoplasms. Additionally, a nomogram is developed utilizing these nutritional and
inflammatory indicators to enhance preoperative assessment of ovarian neoplasms.
Methods: Patients with ovarian neoplasms who underwent surgery at
Shengjing Hospital of China Medical University between June 2017 and June 2022
were retrospectively analyzed. Benign ovarian disease or epithelial ovarian
cancer (EOC) was diagnosed postoperatively by pathology. Patients were randomly
divided into training and test cohorts. Univariate and multivariate logistic
regression analyses were conducted to identify significant clinical and imaging
risk factors, along with NPS, SIS, and COUNT. Nomograms were constructed to
predict EOC and externally validated. Diagnostic accuracy was assessed using
decision curve analysis (DCA) and the area under the receiver operating
characteristic (ROC) curve (AUC). Results: A total of 2226 patients
(1788 benign and 438 EOC) were included. Factors such as age, multilocular
tumors, solid nodules, larger tumor diameter, ascites, and higher tumor marker
levels were associated with an increased risk of EOC. The AUC values for models
incorporating NPS, SIS, and COUNT were 0.907, 0.897, and 0.883, respectively,
indicating superior diagnostic ability compared to models without
nutritional/inflammatory indicators. The nomogram with NPS demonstrated the
highest diagnostic value and clinical utility based on DCA (p
Keywords
- ovarian neoplasms
- epithelial ovarian cancer
- Naples Prognostic Score
- nomogram
- prediction model
Ovarian cancer, ranking as the third most common malignancy in the female reproductive system globally, has the highest mortality rate among gynecological cancers [1]. Due to the ovaries’ anatomical depth, diagnoses often occur at advanced stages when symptoms manifest. Distinguishing early-stage malignant from benign ovarian tumors is challenging and relies heavily on gynecological exams, serum tumor markers like cancer antigen 125 (CA125) and human epididymis protein 4 (HE4), and imaging [2]. These markers, while valuable, have limitations due to factors like age and benign conditions that can elevate CA125 levels [3]. Consequently, models like the Copenhagen Index (CPH-I) [4], the Risk of Ovarian Malignancy Algorithm (ROMA) [5], and the Risk of Malignancy Index (RMI) [6] have been developed to improve ovarian malignancy prediction, emphasizing the need for objective indicators to enhance early detection.
Inflammation’s link to cancer, first noted by Rudolf Virchow in 1863 [7], is now a recognized factor in cancer progression [8]. Systemic inflammation is characterized by tissue inflammation and systemic responses that include changes in blood cell counts and levels of hemoglobin and albumin [9, 10]. Preoperative inflammatory biomarkers like lymphocyte-to-monocyte ratio (LMR), neutrophil-to-lymphocyte ratio (NLR), platelet-to-lymphocyte ratio (PLR), and Glasgow Prognostic Score (GPS) are prognostic in various cancers [11, 12, 13]. Nutritional status, as indicated by serum albumin [14] and cholesterol levels [15], is also prognostic, with markers like lymphocyte count reflecting immune competence [16].
Scoring systems like the Systemic Inflammation Score (SIS) [17], Naples Prognostic Score (NPS) [18], and Controlling Nutritional Status (CONUT) [19] have been developed to assess inflammation and nutrition in cancer patients. The SIS, combining albumin and LMR, aids in postoperative staging and prognosis in renal cell carcinoma. The NPS, which includes albumin, cholesterol, NLR, and LMR, predicts postoperative survival in colorectal cancer. The CONUT score, including albumin, lymphocyte count, and cholesterol, screens for malnutrition in hospitalized patients and is used to evaluate cancer patients’ nutritional status [20]. Despite these advancements, their application in early ovarian neoplasm diagnosis has been limited. This study aims to integrate SIS, NPS, and CONUT into a diagnostic model to predict epithelial ovarian cancer (EOC) based on clinical and tumor marker data, filling a critical gap in early diagnosis.
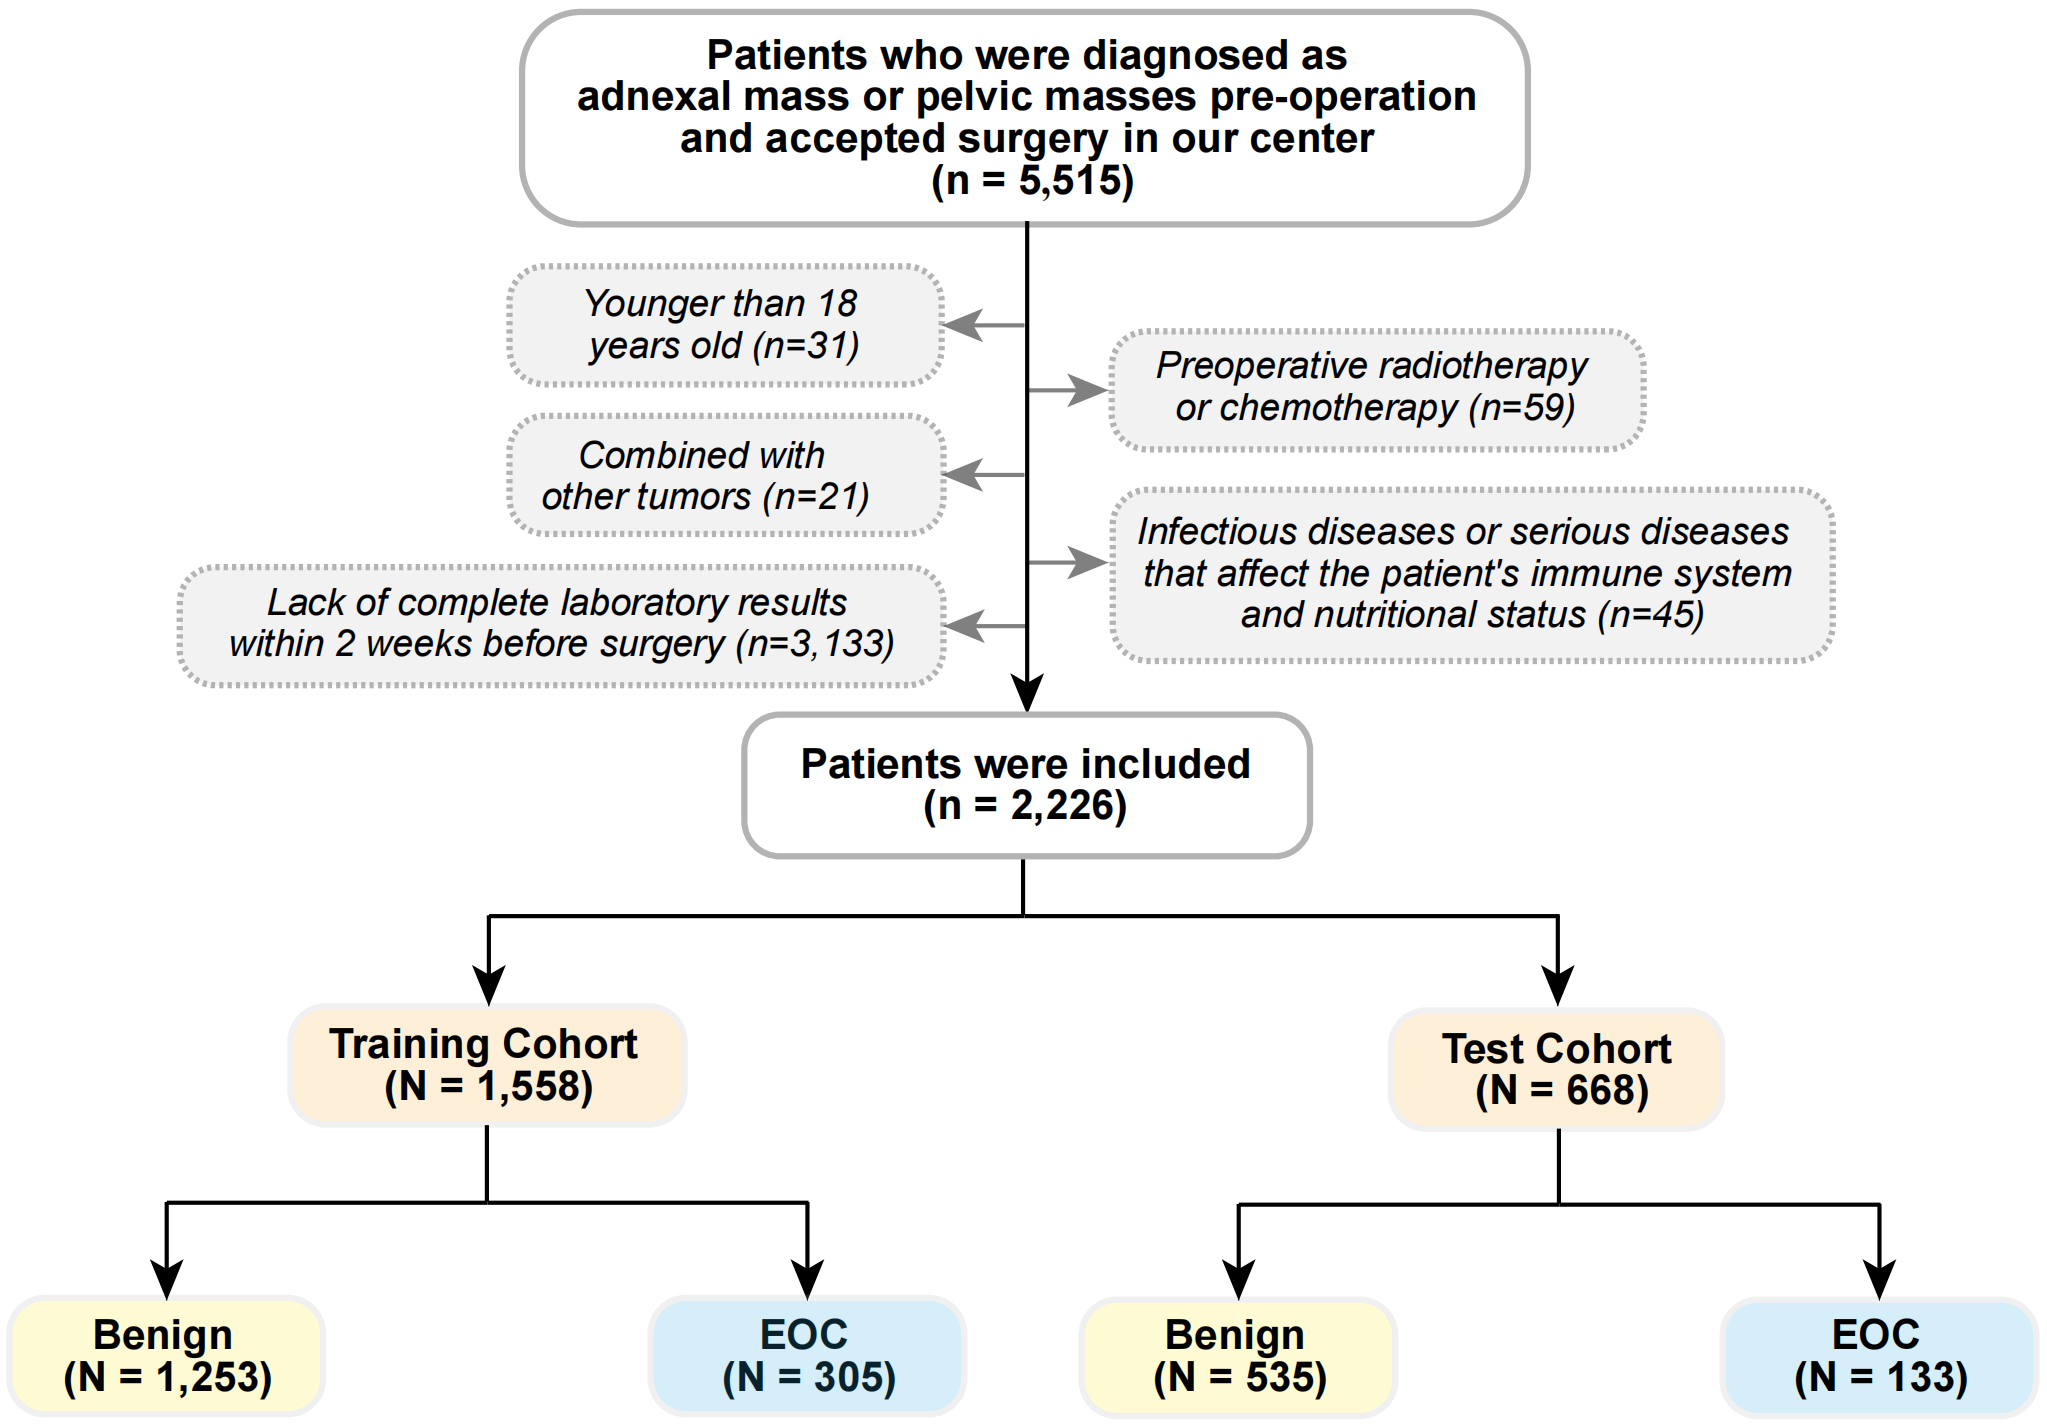
This study was a retrospective observational analysis of women diagnosed with ovarian cysts or pelvic masses and who underwent surgery at Shengjing Hospital of China Medical University from June 2017 to June 2022. Inclusion criteria were limited to women with pelvic masses or ovarian cysts detected through preoperative imaging (ultrasound, computed tomography (CT) scan, or magnetic resonance imaging (MRI)), which were reviewed and confirmed by two independent radiologists, and whose postoperative pathological findings were verified as benign ovarian disease or EOC by two independent pathologists. Exclusion criteria included women under 18 years of age, those with concomitant tumors, preoperative radiotherapy or chemotherapy, individuals with infections or severe diseases affecting the immune system and nutritional status (e.g., hematological, liver, or immune system disorders), and patients lacking complete laboratory results within two weeks prior to surgery. A flow chart detailing patient selection is provided in Fig. 1. Participants were randomly assigned to a training cohort and a test cohort in a 7:3 ratio. The study protocol was approved by the Ethics Committee of Shengjing Hospital (approval number: 2022PS134K). All participants provided informed consent after being informed of the study’s details.
 Fig. 1.
Flowchart of the patient selection. EOC, epithelial ovarian cancer.
Clinical characteristics, including age, menopausal status, parity, hypertension, and diabetes, were extracted from the Shengjing Hospital Information System’s electronic medical records. Imaging features, such as tumor multicolarity, solid components, laterality, maximum diameter (with the largest side’s diameter taken for bilateral tumors), and ascites presence, were gathered from the Shengjing Hospital’s picture archiving and communication system (PACS). Tumor markers (CA125 and HE4), lymphocyte, neutrophil, and monocyte counts, serum albumin, and plasma cholesterol levels were collected two weeks before surgery. Based on prior research, a CA125 upper limit of 35 U/mL and a HE4 upper limit of 140 pmol/L were considered normal [5, 21].
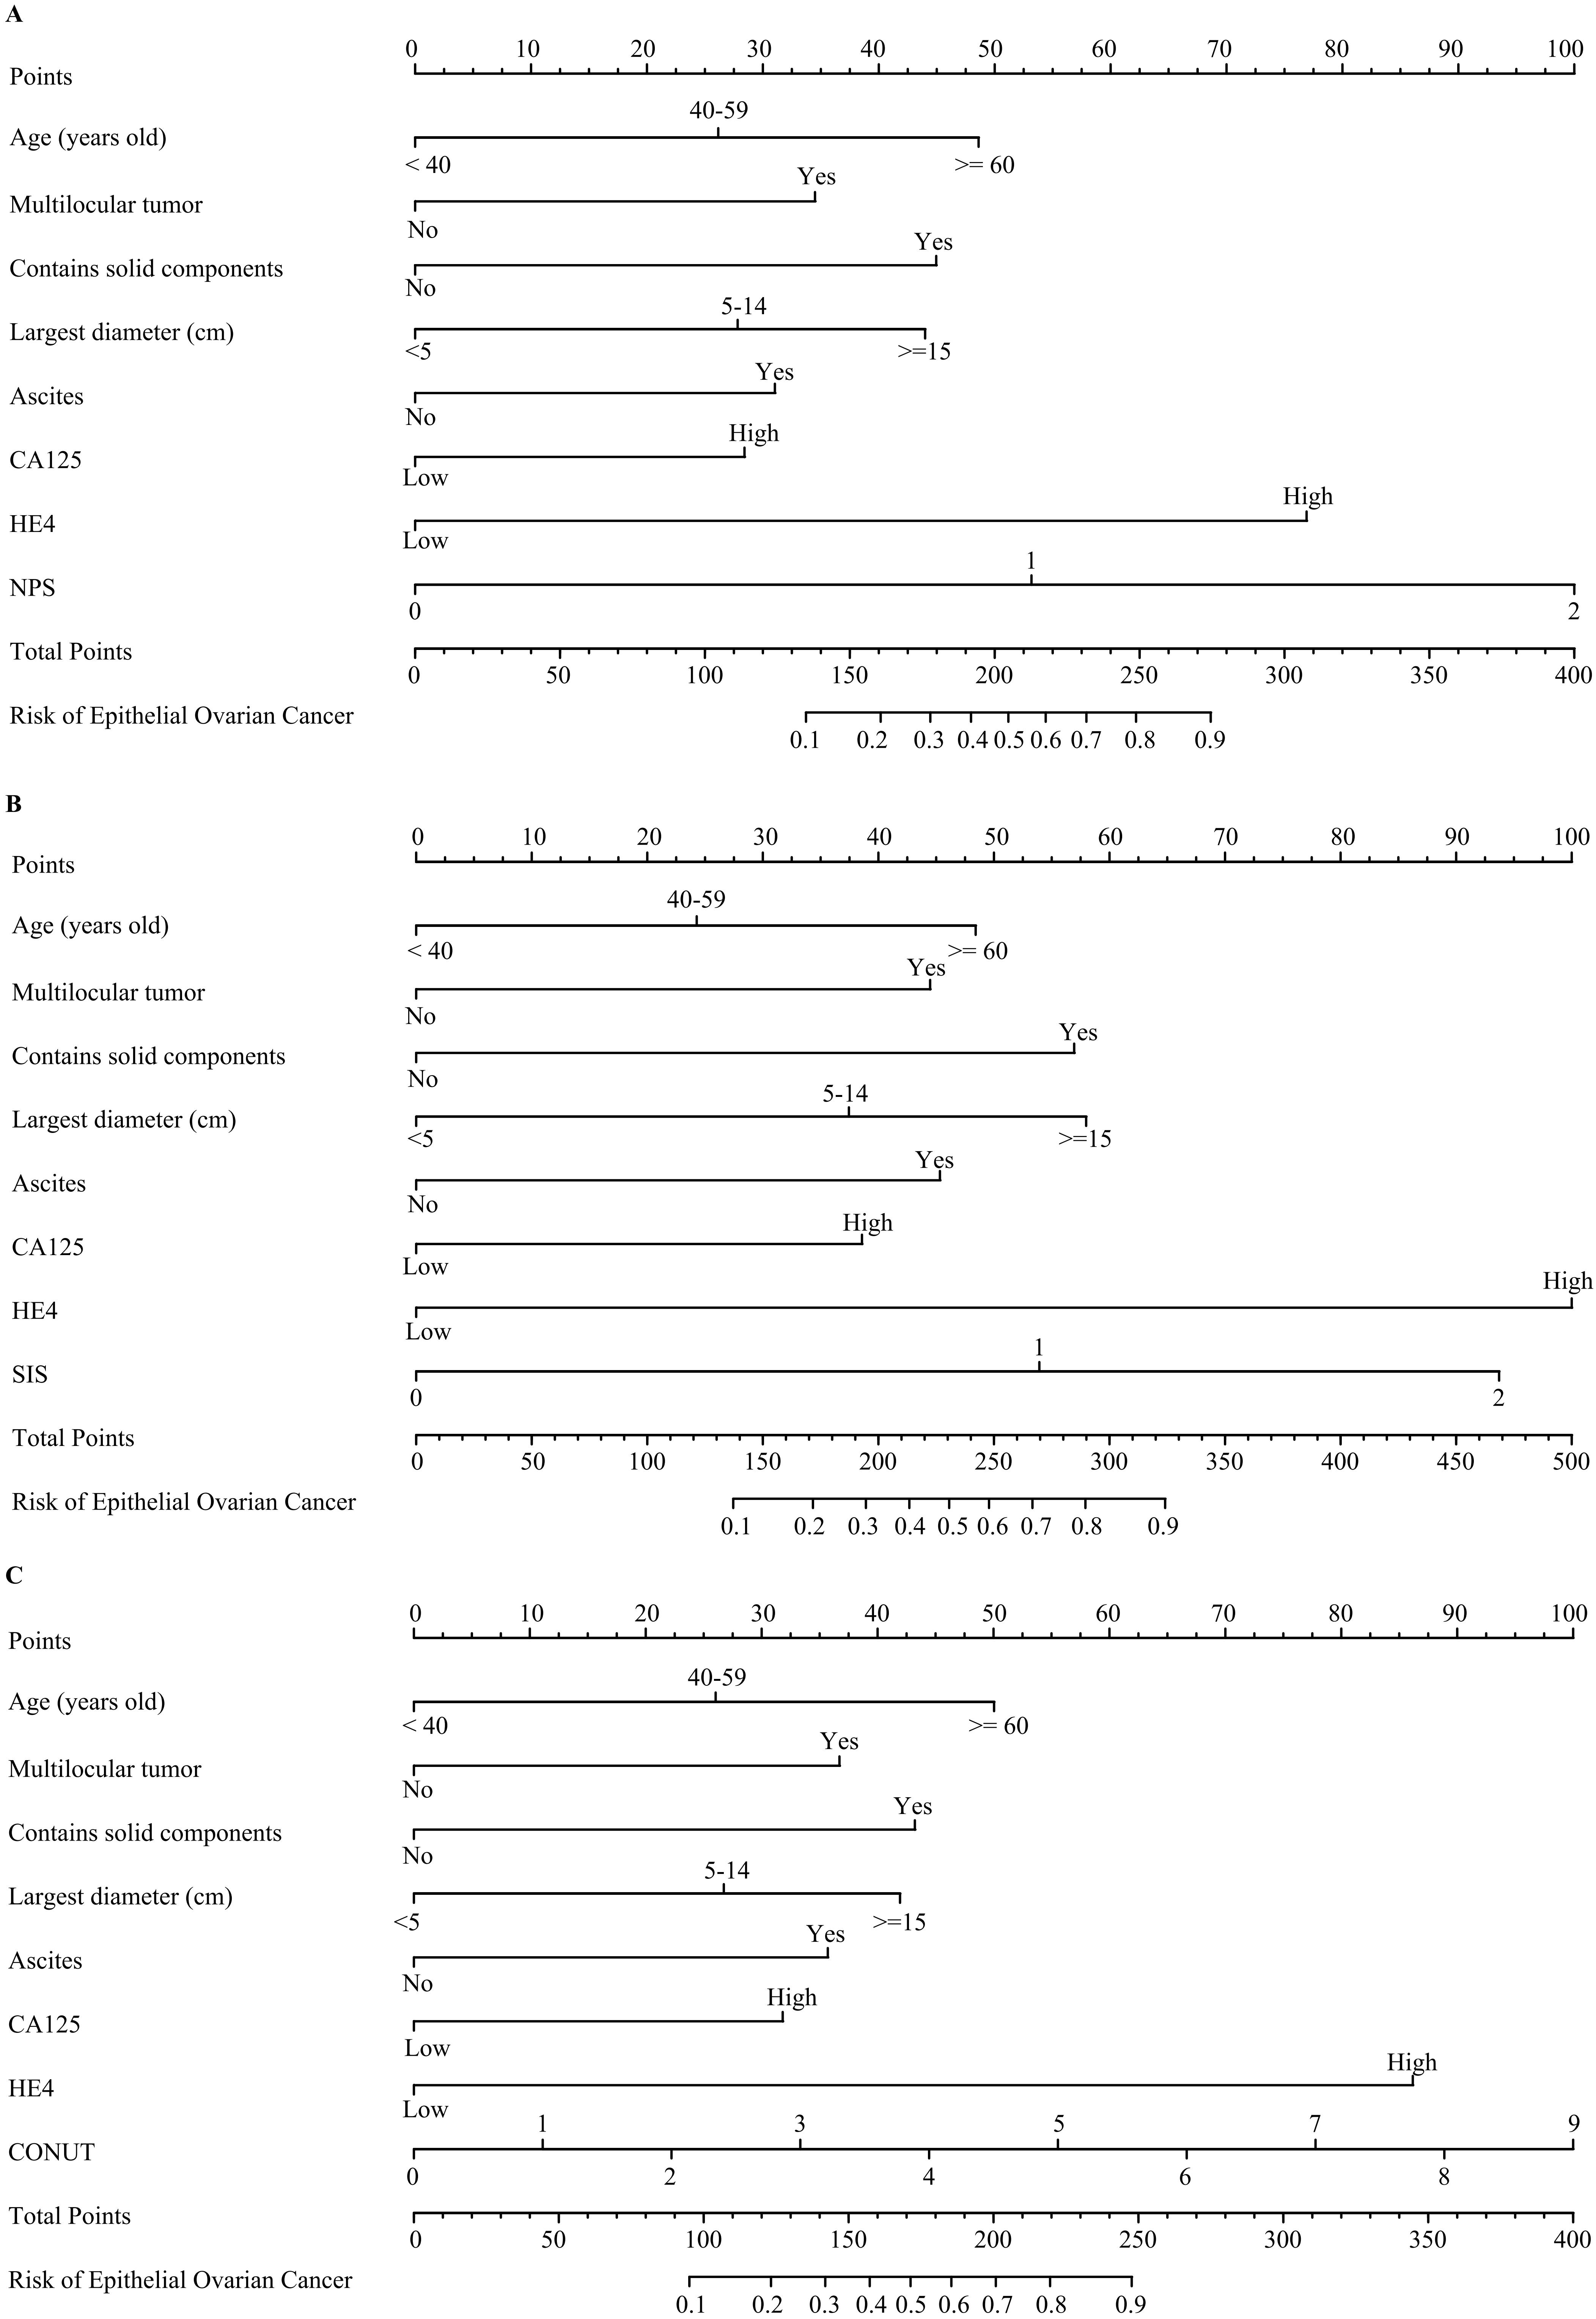
The NPS was determined using plasma albumin and cholesterol levels, as well as NLR and LMR. The SIS was derived from albumin and LMR, while the CONUT score was based on serum albumin, total cholesterol concentration, and the total peripheral lymphocyte count, as depicted in Fig. 2 [17, 22, 23]. Each scoring system served as a risk factor in the predictive model, with risk factor cut-off values established according to each system’s scoring methodology.
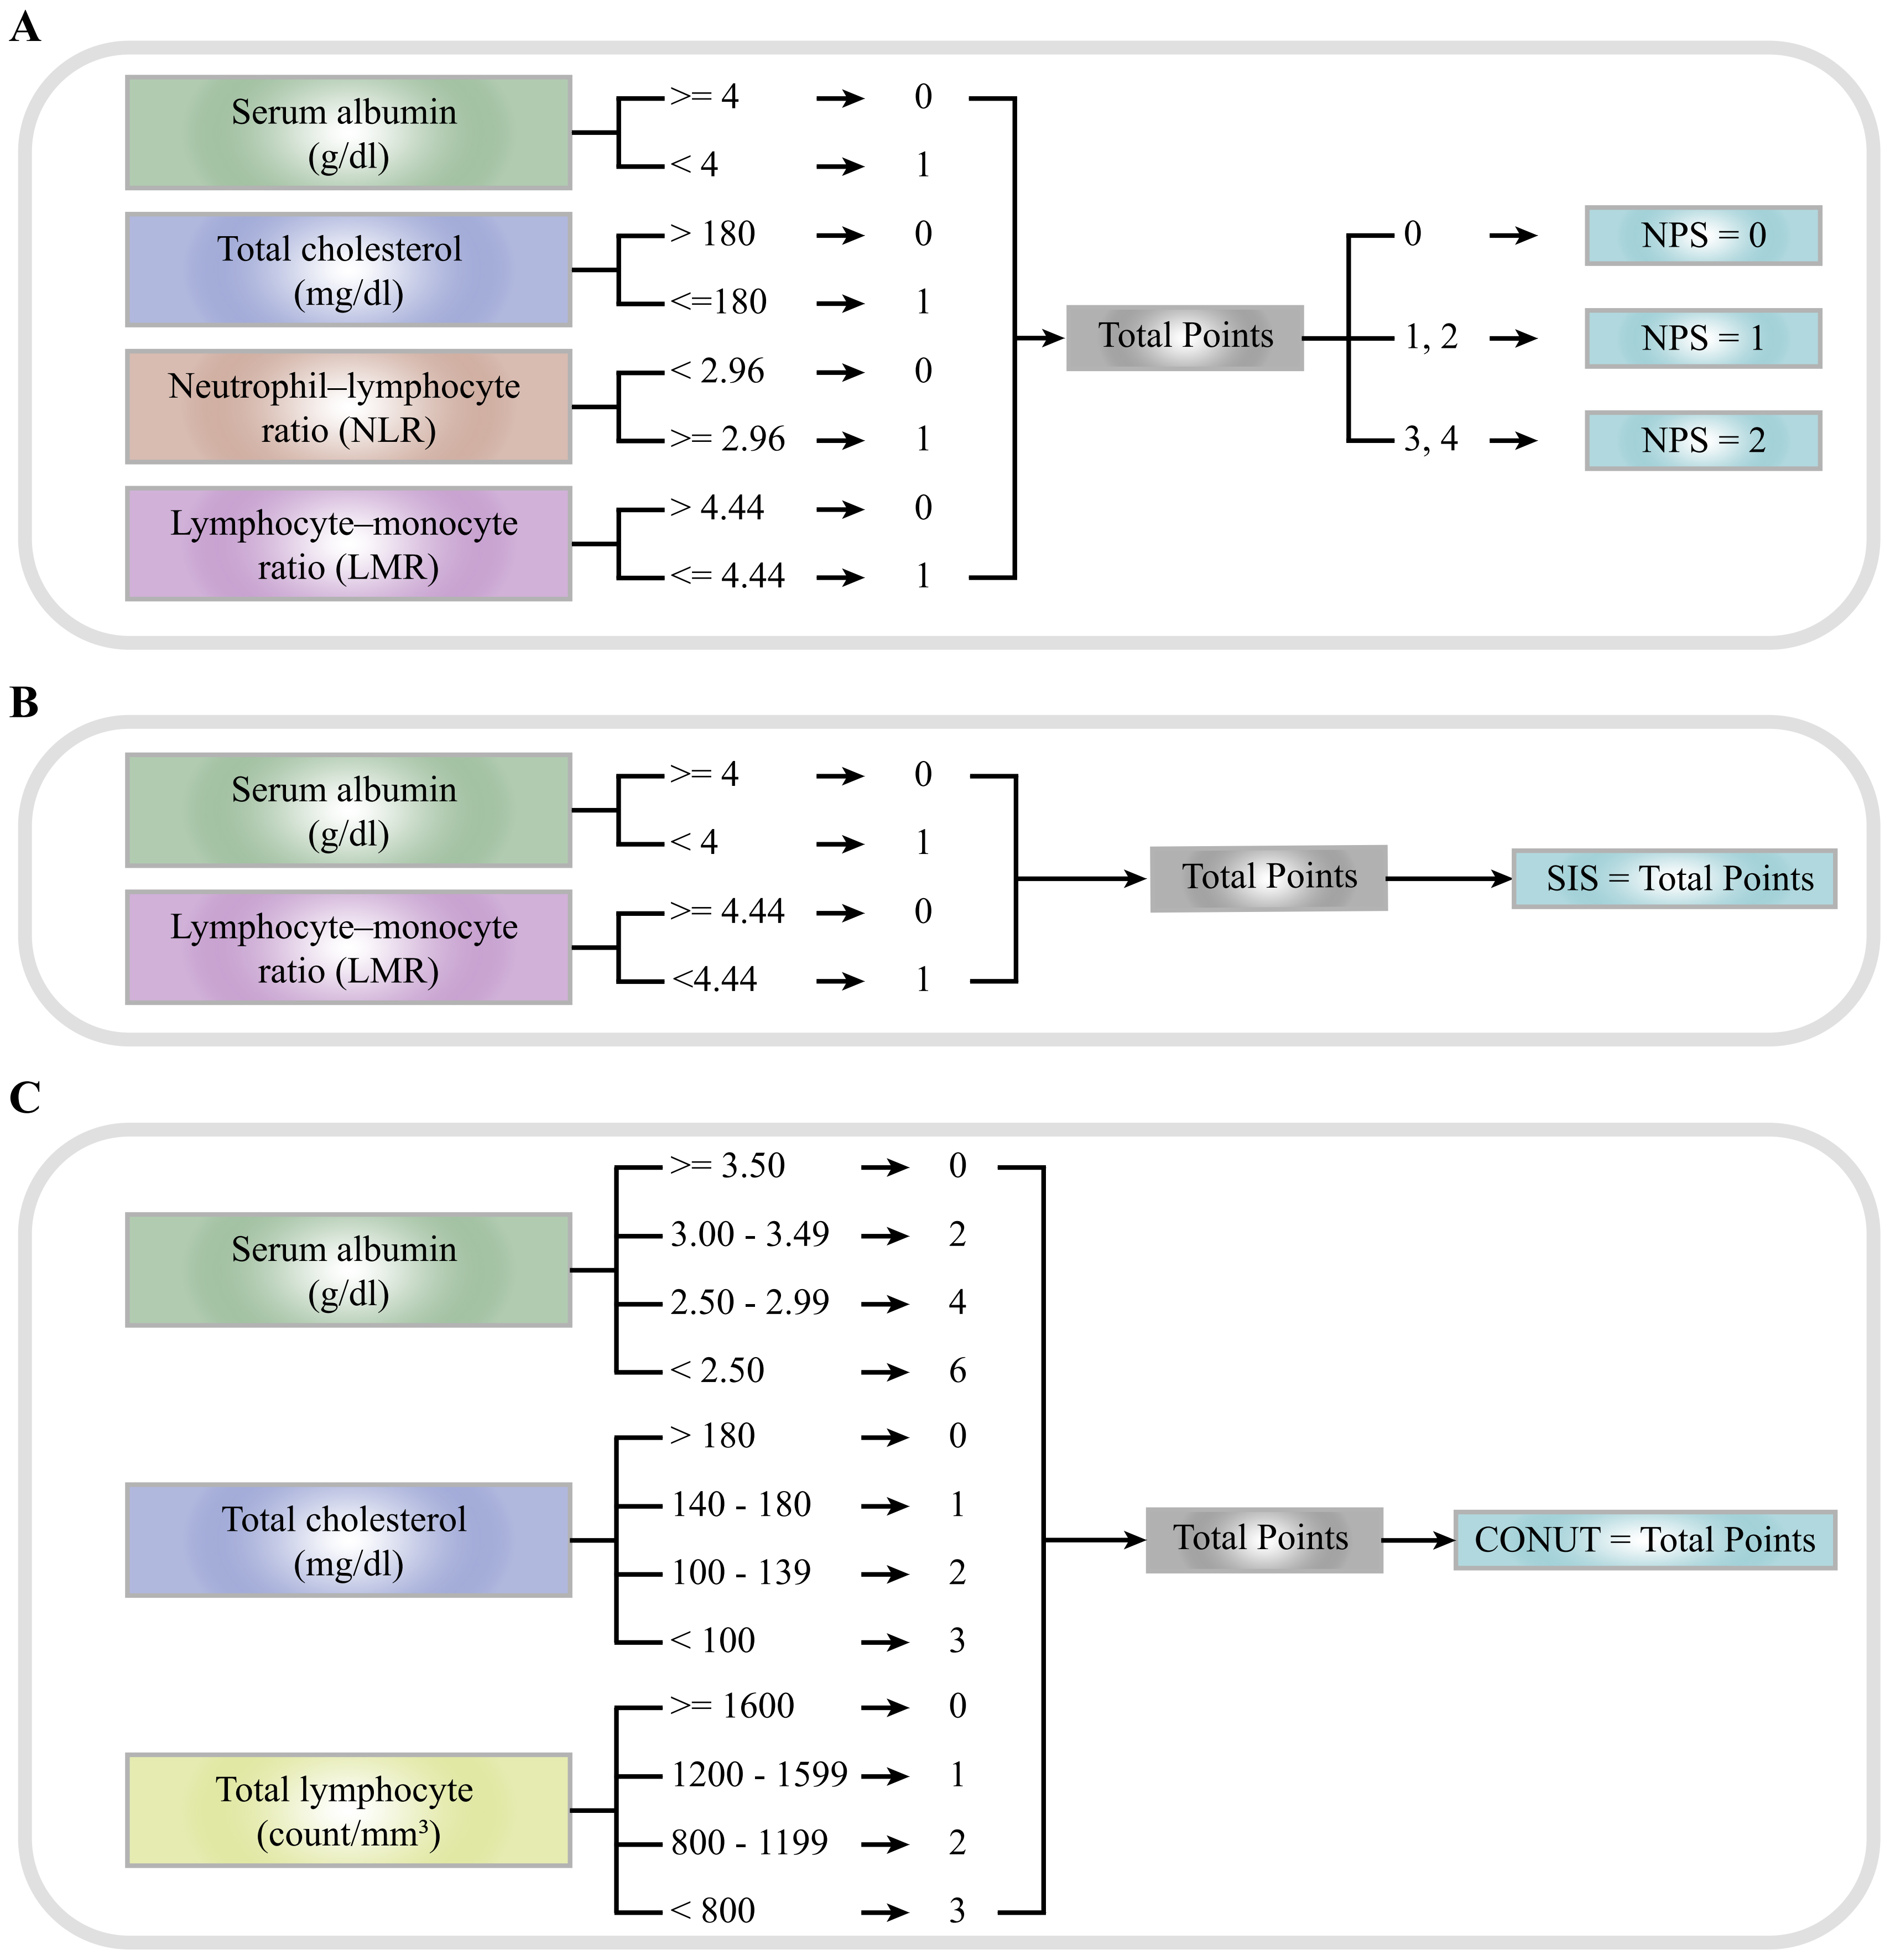 Fig. 2.
Definition of NPS, SIS, and CONUT score. (A) NPS. (B) SIS. (C) CONUT. NPS, Naples Prognostic Score; SIS, Systemic Inflammation Score; COUNT, Controlling Nutritional Status Score.
Data analysis was performed using R Studio with R Version 3.6.3 (R Foundation
for Statistical Computing, Vienna, Austria). Clinical data, imaging indicators,
and laboratory findings were analyzed using univariate logistic regression.
Significant variables from the univariate analysis were selected for inclusion in
multivariate analysis, combined with NPS, SIS, and CONUT, respectively. The
significant risk factors for EOC incidence were then used to construct the model,
with odds ratios (OR) and 95% confidence intervals (CIs) calculated. A
p-value
Between June 2017 and June 2022, Shengjing hospital performed surgical treatments on 5515 patients diagnosed with ovarian cysts or pelvic masses based on preoperative imaging. After applying the exclusion criteria, 2226 cases were included in the analysis. Postoperative pathology identified 1788 benign cases and 438 cases of EOC. Participants were randomly assigned to a training group (n = 1558) and a test group (n = 668), with specific characteristics detailed in Table 1.
| Variables | Training Cohort (N = 1558) | Test Cohort (N = 668) | Total (N = 2226) | ||||
| Benign (N = 1253) | EOC (N = 305) | Benign (N = 535) | EOC (N = 133) | Benign (N = 1788) | EOC (N = 438) | ||
| Age (years) | |||||||
| 754 (60%) | 70 (23%) | 321 (60%) | 37 (28%) | 1075 (60%) | 107 (24%) | ||
| 40–59 | 402 (32%) | 154 (50%) | 169 (32%) | 68 (51%) | 571 (32%) | 222 (51%) | |
| 97 (7.7%) | 81 (27%) | 45 (8.4%) | 28 (21%) | 142 (7.9%) | 109 (25%) | ||
| Postmenopausal | |||||||
| No | 966 (77%) | 133 (44%) | 419 (78%) | 65 (49%) | 1385 (77%) | 198 (45%) | |
| Yes | 287 (23%) | 172 (56%) | 116 (22%) | 68 (51%) | 403 (23%) | 240 (55%) | |
| Parity | |||||||
| 0 | 367 (29%) | 34 (11%) | 149 (28%) | 17 (13%) | 516 (29%) | 51 (12%) | |
| 1 | 782 (62%) | 245 (80%) | 353 (66%) | 105 (79%) | 1135 (63%) | 350 (80%) | |
| 104 (8.3%) | 26 (8.5%) | 33 (6.2%) | 11 (8.3%) | 137 (7.7%) | 37 (8.4%) | ||
| Hypertension | |||||||
| No | 1085 (87%) | 222 (73%) | 457 (85%) | 103 (77%) | 1542 (86%) | 325 (74%) | |
| Yes | 168 (13%) | 83 (27%) | 78 (15%) | 30 (23%) | 246 (14%) | 113 (26%) | |
| Diabetes | |||||||
| No | 1119 (89%) | 246 (81%) | 493 (92%) | 109 (82%) | 1612 (90%) | 355 (81%) | |
| Yes | 134 (11%) | 59 (19%) | 42 (7.9%) | 24 (18%) | 176 (9.8%) | 83 (19%) | |
| Multilocular tumor | |||||||
| No | 891 (71%) | 107 (35%) | 384 (72%) | 53 (40%) | 1275 (71%) | 160 (37%) | |
| Yes | 362 (29%) | 198 (65%) | 151 (28%) | 80 (60%) | 513 (29%) | 278 (63%) | |
| Contains solid components | |||||||
| No | 1016 (81%) | 124 (41%) | 439 (82%) | 61 (46%) | 1455 (81%) | 185 (42%) | |
| Yes | 237 (19%) | 181 (59%) | 96 (18%) | 72 (54%) | 333 (19%) | 253 (58%) | |
| Bilateral tumor | |||||||
| No | 1091 (87%) | 236 (77%) | 481 (90%) | 102 (77%) | 1572 (88%) | 338 (77%) | |
| Yes | 162 (13%) | 69 (23%) | 54 (10%) | 31 (23%) | 216 (12%) | 100 (23%) | |
| Largest diameter (cm) | |||||||
| 293 (23%) | 31 (10%) | 117 (22%) | 19 (14%) | 410 (23%) | 50 (11%) | ||
| 5–14 | 809 (65%) | 172 (56%) | 347 (65%) | 75 (56%) | 1156 (65%) | 247 (56%) | |
| 151 (12%) | 102 (33%) | 71 (13%) | 39 (29%) | 222 (12%) | 141 (32%) | ||
| Ascites | |||||||
| No | 1163 (93%) | 225 (74%) | 500 (93%) | 98 (74%) | 1663 (93%) | 323 (74%) | |
| Yes | 90 (7.2%) | 80 (26%) | 35 (6.5%) | 35 (26%) | 125 (7.0%) | 115 (26%) | |
| CA125 (cutoff: 35 U/mL) | |||||||
| Low | 822 (66%) | 95 (31%) | 340 (64%) | 56 (42%) | 1162 (65%) | 151 (34%) | |
| High | 431 (34%) | 210 (69%) | 195 (36%) | 77 (58%) | 626 (35%) | 287 (66%) | |
| HE4 (cutoff: 70 pmol/L) | |||||||
| Low | 1241 (99%) | 203 (67%) | 531 (99%) | 93 (70%) | 1772 (99%) | 296 (68%) | |
| High | 12 (1.0%) | 102 (33%) | 4 (0.7%) | 40 (30%) | 16 (0.9%) | 142 (32%) | |
| NPS | |||||||
| 0 | 330 (26%) | 23 (7.5%) | 144 (27%) | 10 (7.5%) | 474 (27%) | 33 (7.5%) | |
| 1 | 802 (64%) | 145 (48%) | 335 (63%) | 69 (52%) | 1137 (64%) | 214 (49%) | |
| 2 | 121 (9.7%) | 137 (45%) | 56 (10%) | 54 (41%) | 177 (9.9%) | 191 (44%) | |
| SIS | |||||||
| 0 | 699 (56%) | 60 (20%) | 293 (55%) | 27 (20%) | 992 (55%) | 87 (20%) | |
| 1 | 471 (38%) | 142 (47%) | 209 (39%) | 67 (50%) | 680 (38%) | 209 (48%) | |
| 2 | 83 (6.6%) | 103 (34%) | 33 (6.2%) | 39 (29%) | 116 (6.5%) | 142 (32%) | |
| CONUT | 1 (0, 2) | 2 (1, 3) | 1 (0, 2) | 2 (1, 3) | 1 (0, 2) | 2 (1, 3) | |
Statistics presented: Median (interquartile range [IQR]), n (%); EOC, epithelial ovarian cancer; NPS, Naples Prognostic Score; SIS, Systemic inflammation score; CONUT, Controlling Nutritional Status Score; CA125, carbohydrate antigen 125; HE4, human epididymis protein.
Univariate regression analysis of EOC risk factors within the training group is presented in Table 2. The findings indicated that increased age, menopausal status, higher parity, hypertension, and diabetes were correlated with a heightened risk of EOC. Imaging findings of multilocular tumors, solid nodules, bilaterality, larger tumor diameter, and ascites were also associated with an elevated EOC risk. Tumor marker analysis revealed that elevated CA125 and HE4 levels were indicative of a higher EOC risk. Nutritional factor analysis showed that higher scores for NPS, SIS, and CONUT were linked to an increased EOC risk.
| Variables | OR | 95% CI | p-value | |
| Age (years) | ||||
| Reference | ||||
| 40–59 | 4.13 | 3.05, 5.64 | ||
| 8.99 | 6.14, 13.2 | |||
| Postmenopausal | ||||
| No | Reference | |||
| Yes | 4.35 | 3.35, 5.66 | ||
| Parity | ||||
| 0 | Reference | |||
| 1 | 3.38 | 2.34, 5.02 | ||
| 2.70 | 1.54, 4.69 | |||
| Hypertension | ||||
| No | Reference | |||
| Yes | 2.41 | 1.78, 3.25 | ||
| Diabetes | ||||
| No | Reference | |||
| Yes | 2.00 | 1.42, 2.79 | ||
| Multilocular tumor | ||||
| No | Reference | |||
| Yes | 4.55 | 3.50, 5.95 | ||
| Contains solid components | ||||
| No | Reference | |||
| Yes | 6.26 | 4.79, 8.20 | ||
| Bilateral tumor | ||||
| No | Reference | |||
| Yes | 1.97 | 1.43, 2.69 | ||
| Largest diameter (cm) | ||||
| Reference | ||||
| 5–14 | 2.01 | 1.36, 3.06 | ||
| 6.38 | 4.13, 10.1 | |||
| Ascites | ||||
| No | Reference | |||
| Yes | 4.59 | 3.29, 6.41 | ||
| CA125 (cutoff: 35 U/mL) | ||||
| Low | Reference | |||
| High | 4.22 | 3.23, 5.54 | ||
| HE4 (cutoff: 70 pmol/L) | ||||
| Low | Reference | |||
| High | 52.0 | 29.2, 101 | ||
| NPS | ||||
| 0 | Reference | |||
| 1 | 2.59 | 1.67, 4.20 | ||
| 2 | 16.2 | 10.1, 27.0 | ||
| SIS | ||||
| 0 | Reference | |||
| 1 | 3.51 | 2.55, 4.88 | ||
| 2 | 14.5 | 9.82, 21.5 | ||
| CONUT | 1.53 | 1.40, 1.67 | ||
*: p
Significant variables identified through univariate analysis of clinical data, imaging data, and tumor markers were subjected to multivariate logistic regression analysis, alongside the three distinct nutritional/inflammatory (NI) indicators. The findings are summarized in Table 3. Multivariate analysis confirmed that older age, multilocular tumors, solid nodules, larger tumor diameter, ascites, and elevated tumor marker levels were associated with a higher EOC risk, irrespective of nutritional indicator inclusion. Additionally, elevated NI indicators, including NPS, SIS, and CONUT, were found to increase EOC risk.
| Variables | Within NPS | Within SIS | Within CONUT | No-NI indicators | |||||||||
| OR | 95% CI | p-value | OR | 95% CI | p-value | OR | 95% CI | p-value | OR | 95% CI | p-value | ||
| Age (years) | |||||||||||||
| Reference | Reference | Reference | Reference | ||||||||||
| 40–59 | 1.8 | 1.08, 3.01 | 0.025* | 1.54 | 0.93, 2.54 | 0.091 | 1.67 | 1.02, 2.73 | 0.041* | 1.75 | 1.07, 2.84 | 0.024* | |
| 3.57 | 1.50, 8.53 | 0.004* | 2.89 | 1.26, 6.67 | 0.012* | 3.17 | 1.41, 7.14 | 0.005* | 3.24 | 1.47, 7.16 | 0.004* | ||
| Postmenopausal | |||||||||||||
| No | Reference | Reference | Reference | Reference | |||||||||
| Yes | 1.33 | 0.77, 2.29 | 0.301 | 1.16 | 0.68, 1.99 | 0.585 | 1.36 | 0.81, 2.29 | 0.241 | 1.28 | 0.77, 2.14 | 0.334 | |
| Parity | |||||||||||||
| 0 | Reference | Reference | Reference | Reference | |||||||||
| 1 | 1.52 | 0.88, 2.66 | 0.137 | 1.40 | 0.82, 2.41 | 0.222 | 1.41 | 0.84, 2.41 | 0.194 | 1.37 | 0.83, 2.31 | 0.226 | |
| 1.23 | 0.53, 2.79 | 0.621 | 1.07 | 0.47, 2.35 | 0.871 | 1.12 | 0.51, 2.40 | 0.775 | 1.15 | 0.53, 2.43 | 0.717 | ||
| Hypertension | |||||||||||||
| No | Reference | Reference | Reference | Reference | |||||||||
| Yes | 0.83 | 0.47, 1.45 | 0.526 | 0.85 | 0.49, 1.45 | 0.553 | 0.87 | 0.51, 1.46 | 0.600 | 0.89 | 0.53, 1.47 | 0.648 | |
| Diabetes | |||||||||||||
| No | Reference | Reference | Reference | Reference | |||||||||
| Yes | 0.89 | 0.51, 1.55 | 0.695 | 0.86 | 0.49, 1.48 | 0.592 | 0.95 | 0.56, 1.59 | 0.846 | 0.92 | 0.54, 1.52 | 0.742 | |
| Multilocular tumor | |||||||||||||
| No | Reference | Reference | Reference | Reference | |||||||||
| Yes | 2.96 | 2.07, 4.23 | 2.84 | 2.01, 4.03 | 2.89 | 2.06, 4.07 | 2.91 | 2.09, 4.07 | |||||
| Contains solid components | |||||||||||||
| No | Reference | Reference | Reference | Reference | |||||||||
| Yes | 4.01 | 2.76, 5.84 | 3.74 | 2.60, 5.38 | 3.37 | 2.38, 4.78 | 3.3 | 2.34, 4.64 | |||||
| Bilateral tumor | |||||||||||||
| No | Reference | Reference | Reference | Reference | |||||||||
| Yes | 1.29 | 0.79, 2.07 | 0.308 | 1.38 | 0.85, 2.20 | 0.187 | 1.34 | 0.84, 2.11 | 0.208 | 1.34 | 0.85, 2.10 | 0.202 | |
| Largest diameter (cm) | |||||||||||||
| Reference | Reference | Reference | Reference | ||||||||||
| 5–14 | 2.39 | 1.38, 4.33 | 0.003* | 2.41 | 1.40, 4.33 | 0.002* | 2.15 | 1.28, 3.74 | 0.005* | 2.21 | 1.33, 3.83 | 0.003* | |
| 4.10 | 2.18, 7.96 | 4.03 | 2.17, 7.70 | 3.42 | 1.89, 6.33 | 3.61 | 2.02, 6.64 | ||||||
| Ascites | |||||||||||||
| No | Reference | Reference | Reference | Reference | |||||||||
| Yes | 2.60 | 1.56, 4.32 | 2.89 | 1.75, 4.73 | 2.74 | 1.71, 4.35 | 2.8 | 1.77, 4.38 | |||||
| CA125 (cutoff: 35 U/mL) | |||||||||||||
| Low | Reference | Reference | Reference | Reference | |||||||||
| High | 2.42 | 1.69, 3.50 | 2.43 | 1.71, 3.47 | 2.47 | 1.75, 3.51 | 2.78 | 1.98, 3.91 | |||||
| HE4 (cutoff: 70 pmol/L) | |||||||||||||
| Low | Reference | Reference | Reference | Reference | |||||||||
| High | 10.5 | 5.26, 22.8 | 9.93 | 5.04, 21.0 | 11.0 | 5.68, 23.0 | 12.9 | 6.70, 26.9 | |||||
| NPS | |||||||||||||
| 0 | Reference | - | - | - | - | - | - | - | - | - | |||
| 1 | 5.44 | 3.04, 10.3 | - | - | - | - | - | - | - | - | - | ||
| 2 | 23.8 | 12.5, 47.7 | - | - | - | - | - | - | - | - | - | ||
| SIS | |||||||||||||
| 0 | - | - | - | Reference | - | - | - | - | - | - | |||
| 1 | - | - | - | 3.59 | 2.41, 5.42 | - | - | - | - | - | - | ||
| 2 | - | - | - | 9.09 | 5.38, 15.5 | - | - | - | - | - | - | ||
| CONUT | - | - | - | - | - | - | 1.39 | 1.23, 1.56 | - | - | - | ||
*: p
Models incorporating and excluding nutritional indicators were developed based
on multivariate analysis outcomes. The accuracy of these models was assessed
using ROC curves, as depicted in Fig. 3. The DeLong test was applied to compare
the AUC of the various models. The results indicated that models including NPS
demonstrated superior predictive accuracy compared to other models (p
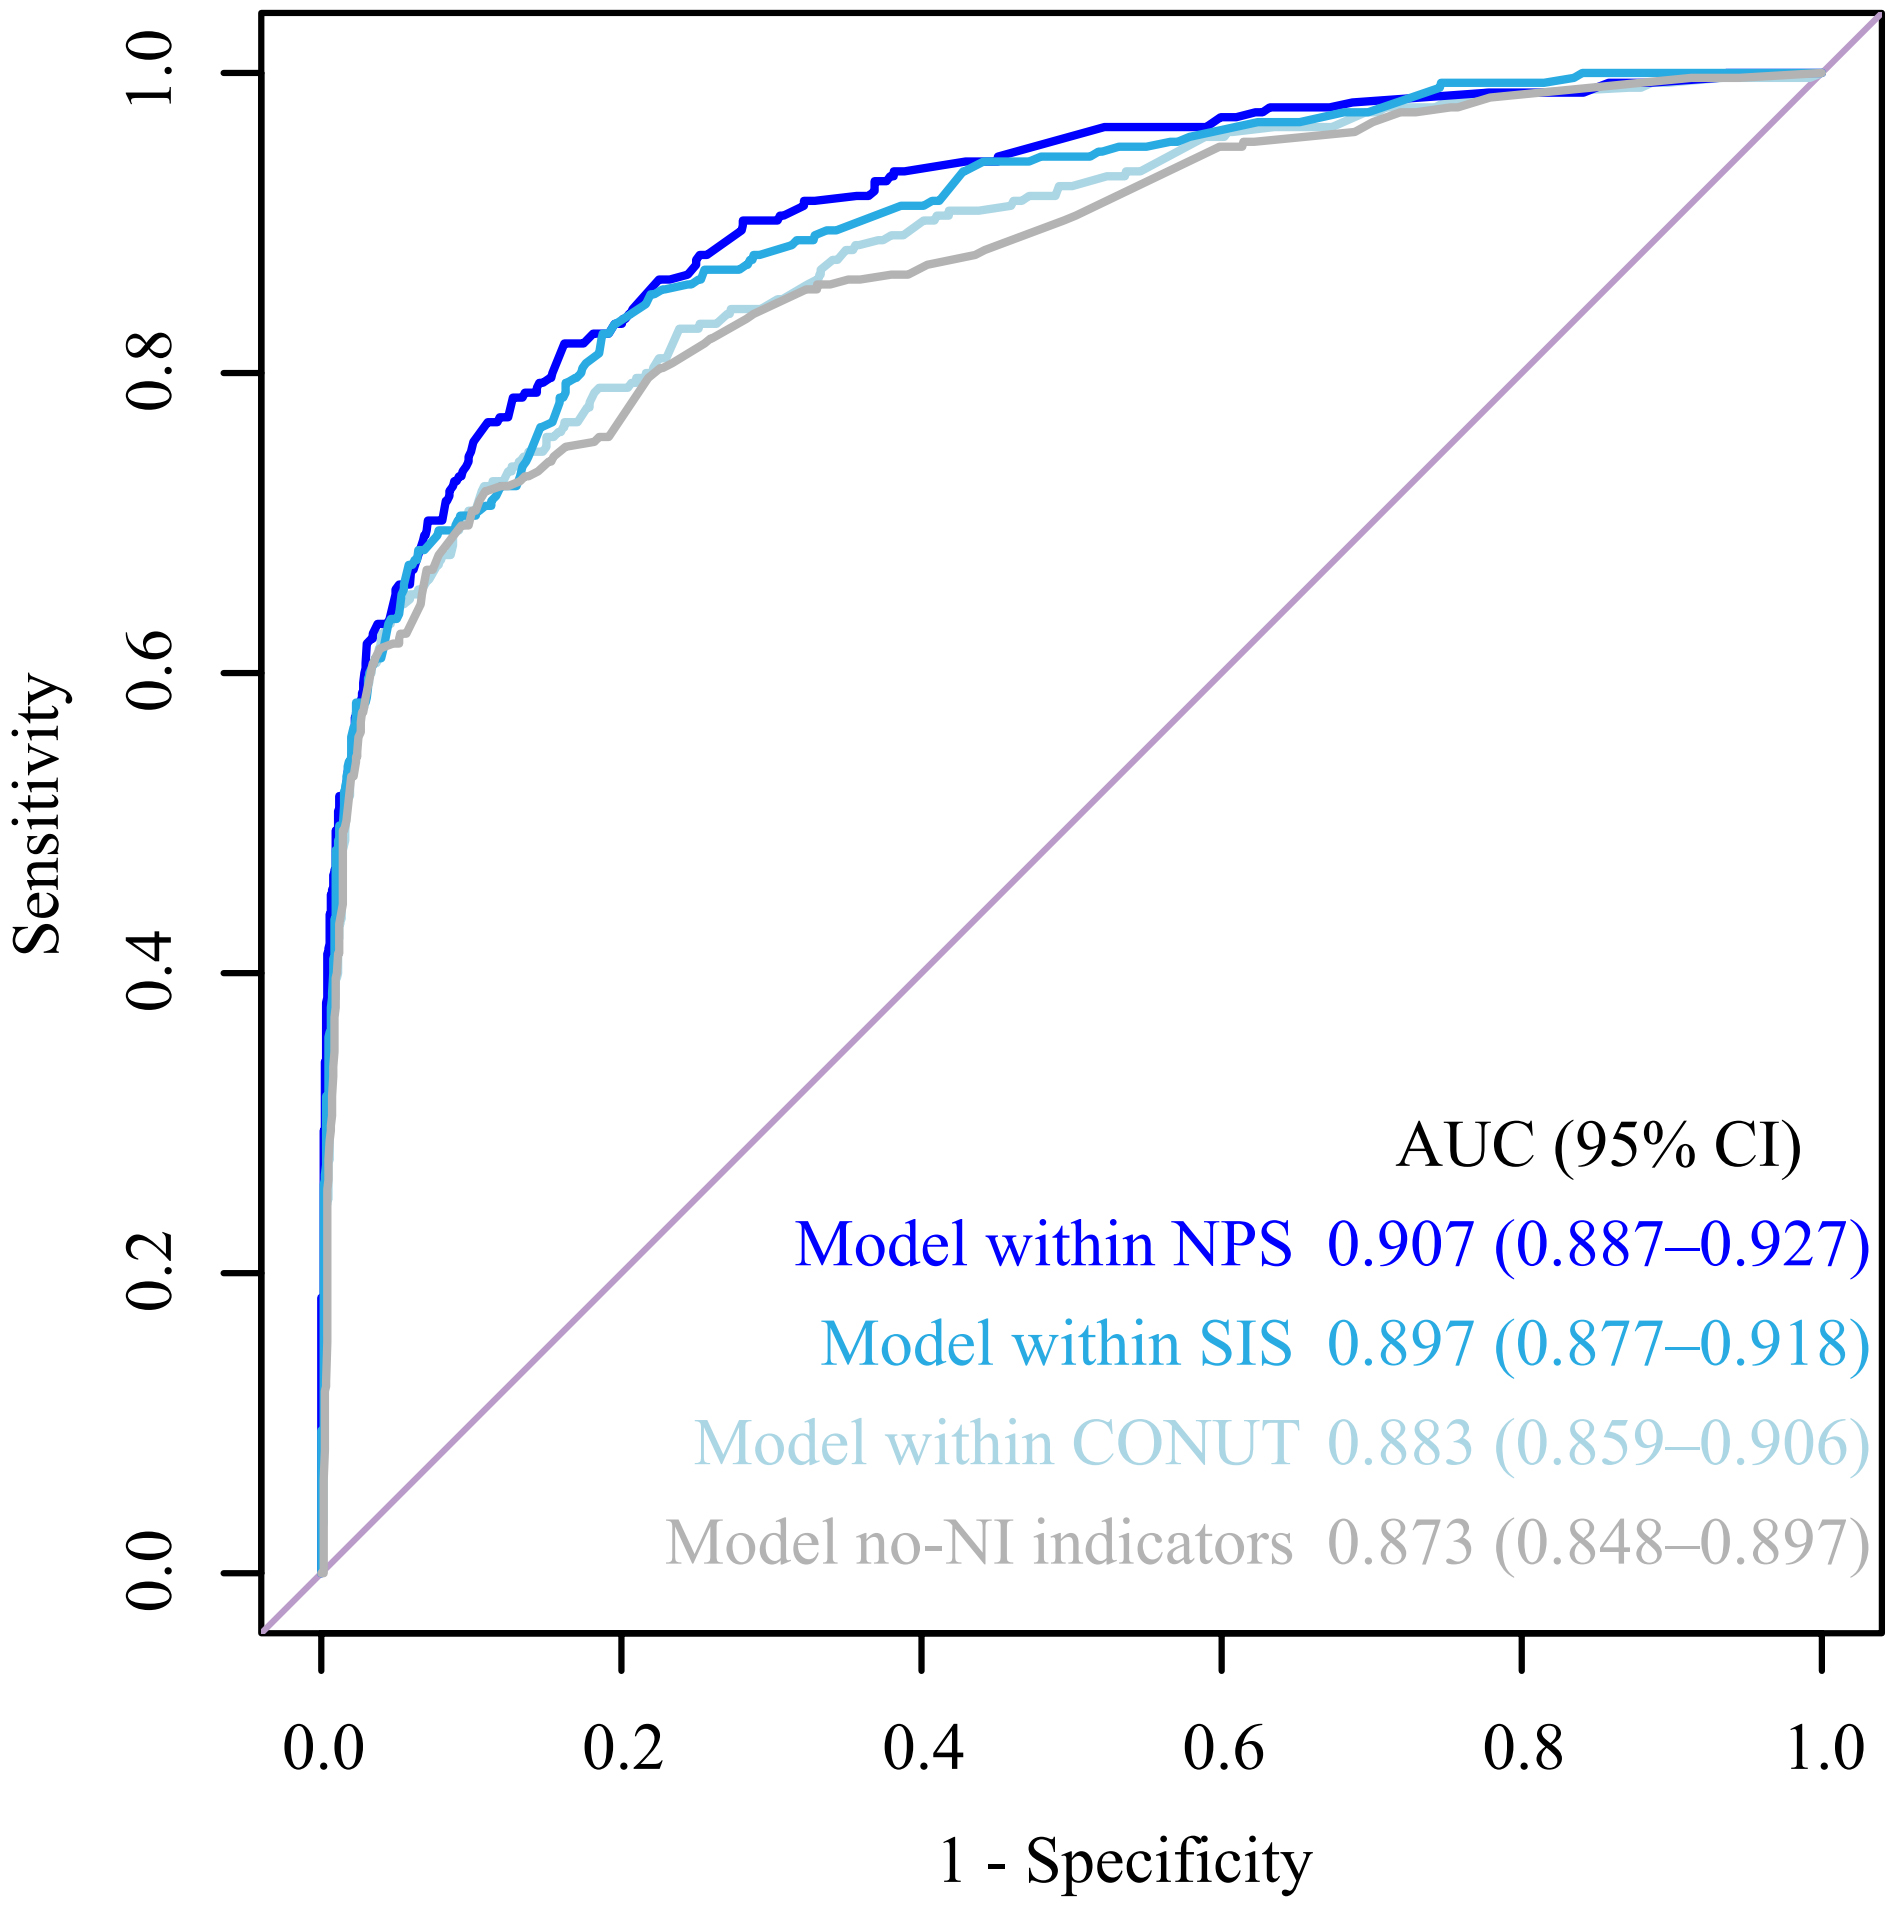 Fig. 3.
Receiver operating characteristic (ROC) curve for different models. AUC, the area under the receiver operating characteristic curve; no-NI, no nutritional/inflammatory; CI, confidence interval.
DCA curve was used to evaluate the clinical effect of different models. The results showed that the clinical effect of the model containing NI indicators was slightly better than that of the no-NI indicators model, and the clinical effect of the model containing NPS was slightly better than that of other models with/without NI indicators (Fig. 4).
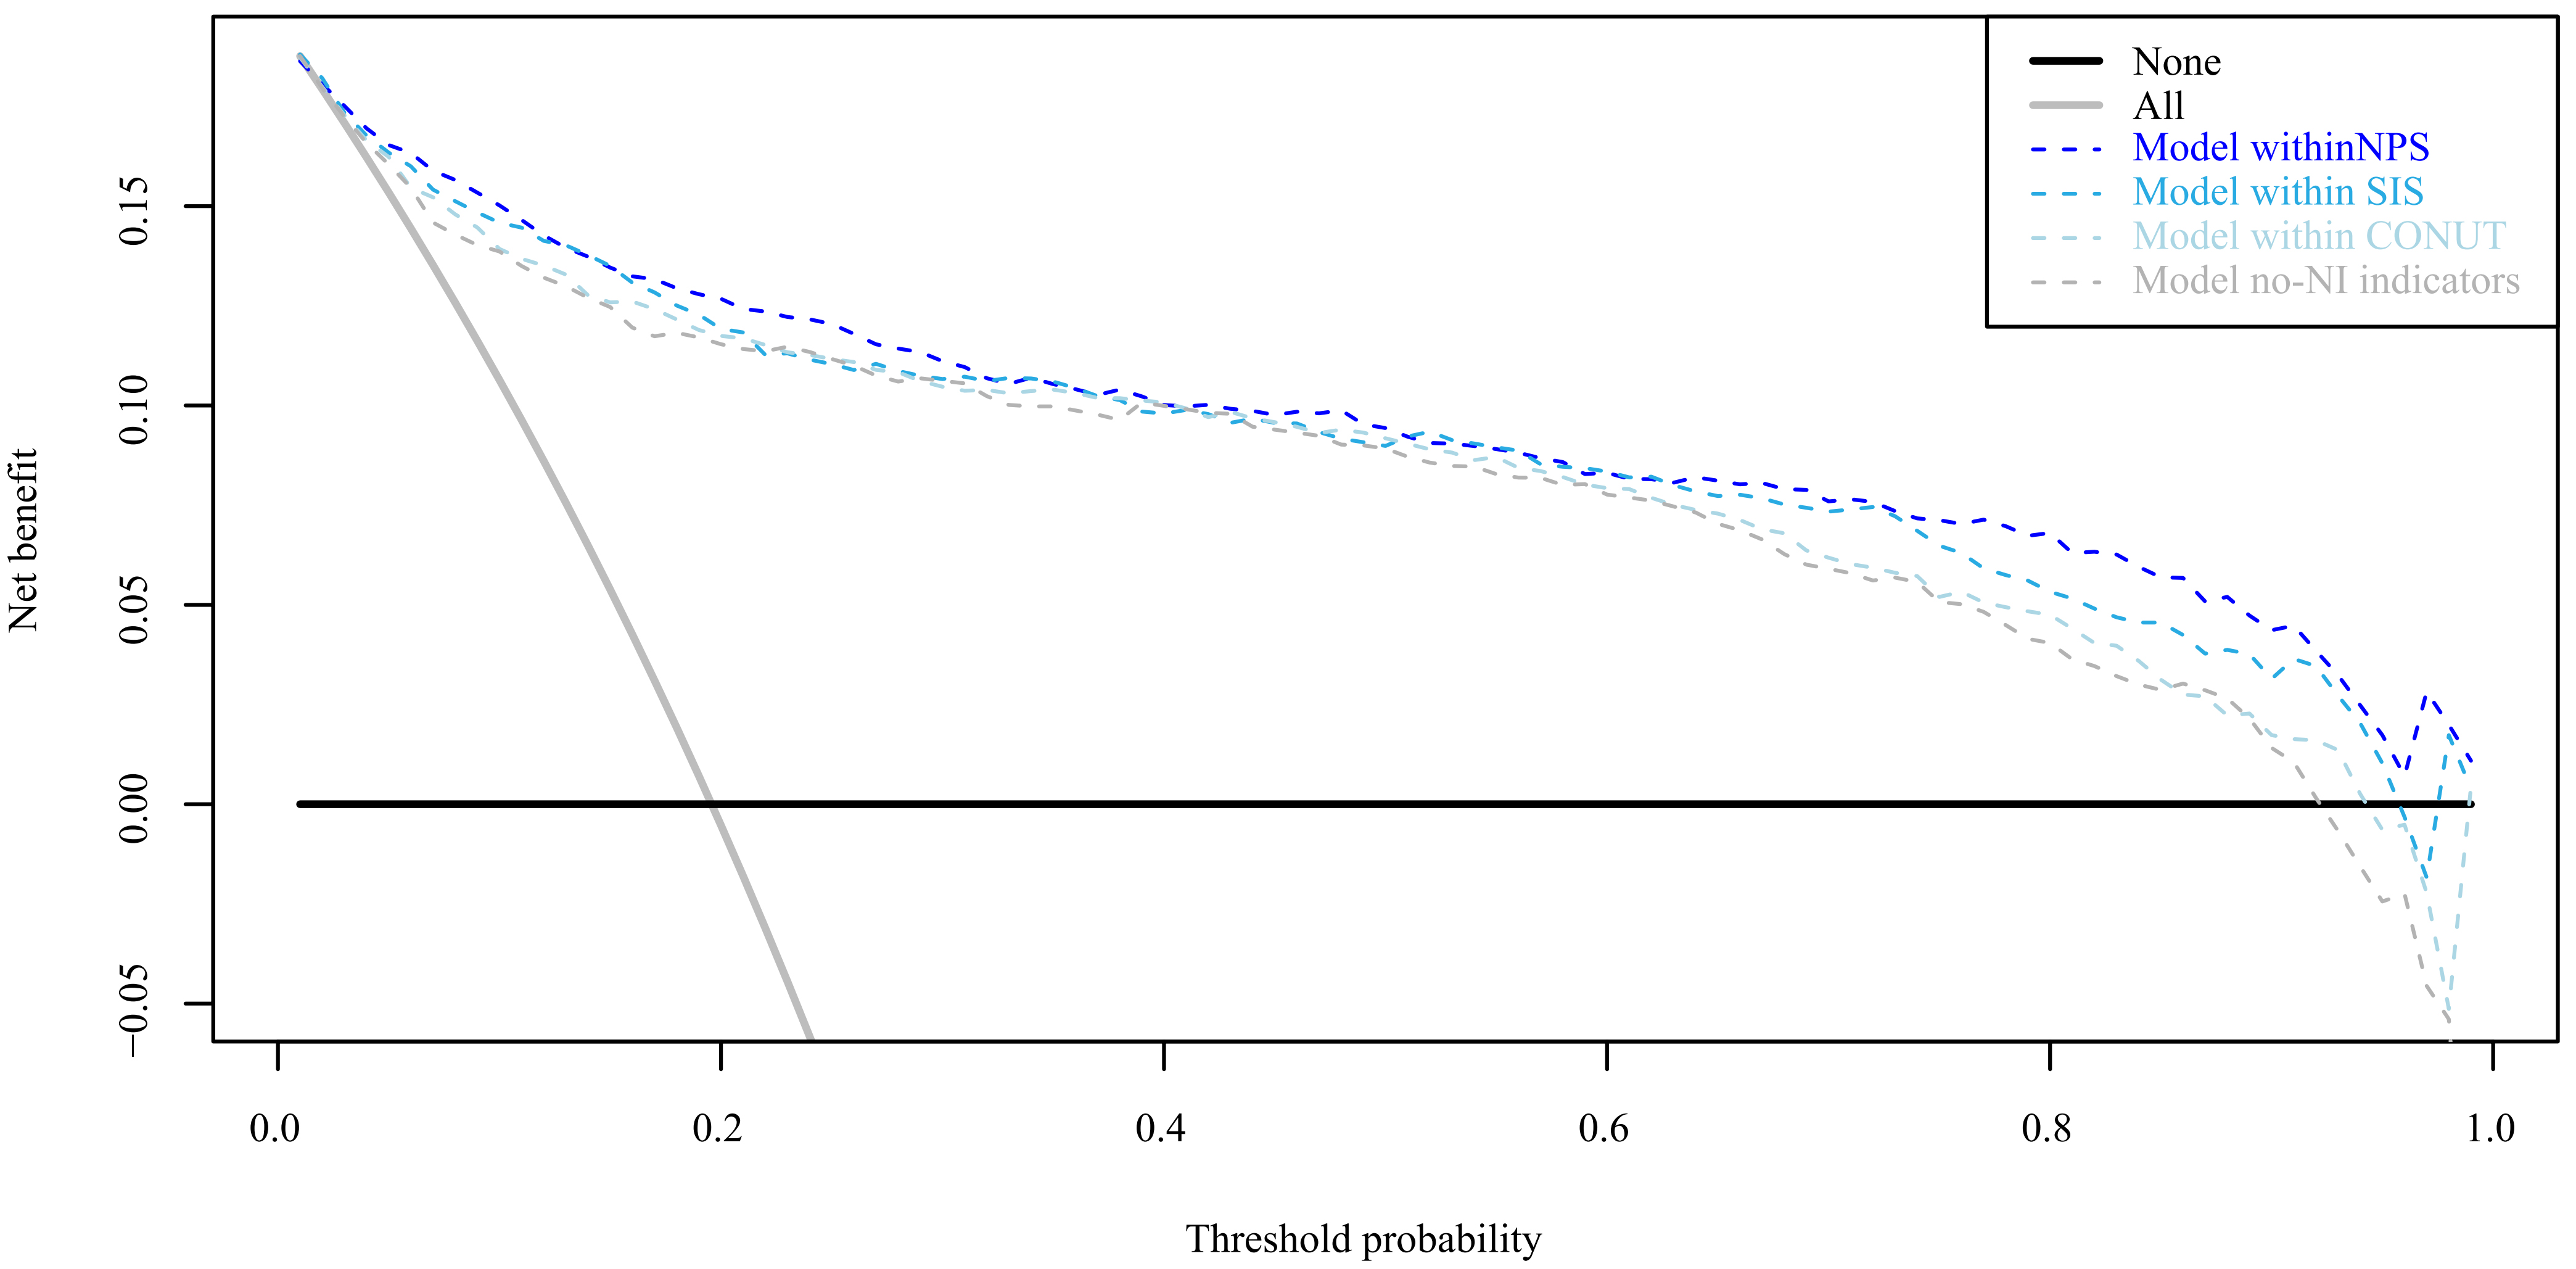 Fig. 4.
Decision curve analysis (DCA) curve for different models.
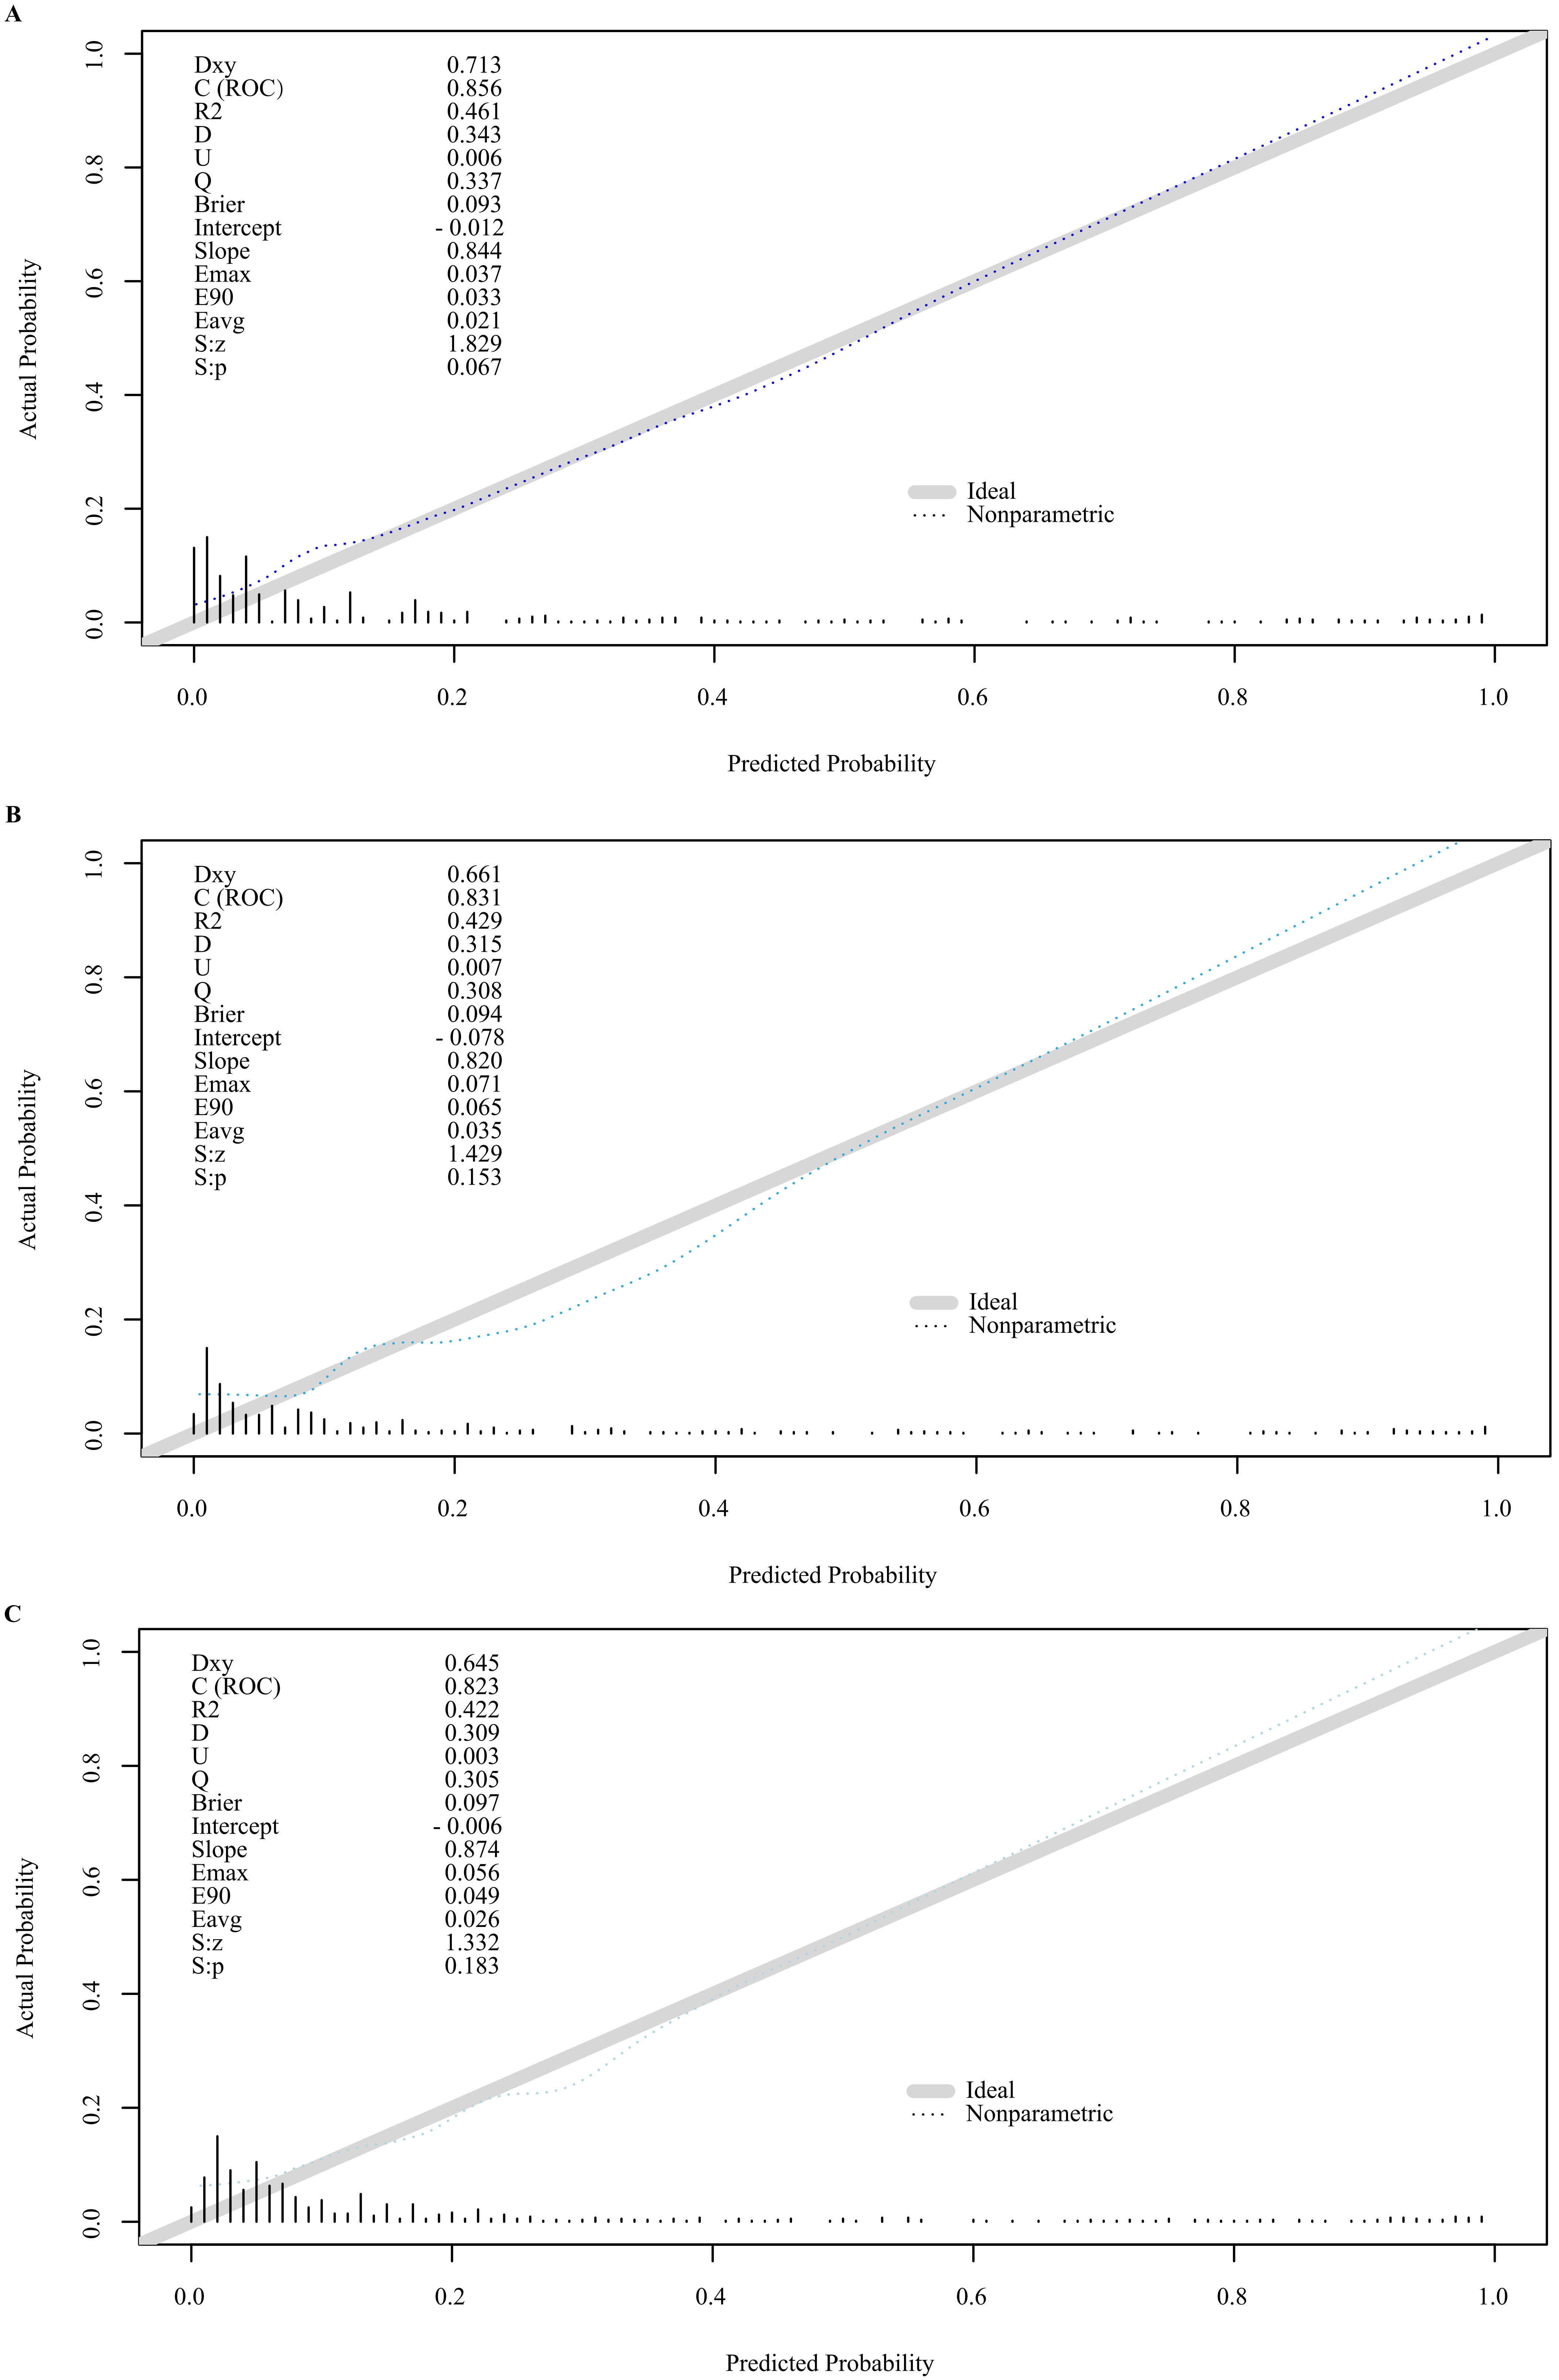
For clinical application, nomograms were developed using models that included nutritional indicators (Fig. 5). External validation of the three nomograms, each based on different nutritional indices and applied to the test cohort, revealed calibration curves closely aligned with the 45-degree line, indicating strong concordance with predicted values (Fig. 6).
 Fig. 5.
Nomograms of epithelial ovarian cancer. (A) Nomograms with NPS. (B) Nomograms with SIS. (C) Nomograms with CONUT.
 Fig. 6.
External verification plots of nomograms. (A) Nomograms with NPS. (B) Nomograms with SIS. (C) Nomograms with CONUT.
The Global Cancer Data Report indicates that ovarian cancer incidence ranked eighth globally in 2020, with approximately 310,000 new cases and 210,000 deaths [27]. The 5-year survival rate for early-stage ovarian cancer can be as high as 93%, while the prognosis for advanced-stage disease remains grim, with a 5-year survival rate of less than 30% [28]. Thus, the accurate identification of malignant epithelial ovarian tumors is crucial for improving patient outcomes. Tumor markers, such as CA125 and HE4, are vital for early diagnosis, treatment efficacy assessment, and recurrence monitoring in patients with suspected tumors. However, relying solely on tumor markers for diagnosing epithelial ovarian tumors has limitations due to factors like age, smoking, and the potential for elevated levels in benign conditions like endometriosis and tuberculosis [29], which can reduce diagnostic specificity. To enhance the detection of early EOC, imaging examinations, particularly color Doppler ultrasound, are essential. Despite the subjectivity in interpreting imaging results, various scoring systems have been developed to aid in the diagnosis of benign and malignant ovarian tumors, such as the Finkler [30], Ferrazzi [31], and Caruso [32] scores, as well as the International Ovarian Tumor Analysis (IOTA) logistic regression model and the Gynecologic Imaging-Reporting and Data System (GI-RADS), which is based on the Breast Imaging Reporting and Data System (BI-RADS) [33]. These systems, while beneficial, can still be subject to interpretation variability among physicians of different expertise levels, underscoring the need for additional diagnostic tools, such as those based on peripheral blood results, to improve preoperative diagnosis of malignant tumors.
The SIS, derived from serum albumin and LMR levels, was initially proposed to predict the prognosis of esophageal cancer post-neoadjuvant chemotherapy [34]. Serum albumin, synthesized by the liver, reflects nutritional status and systemic inflammation [35]. A low serum albumin level is correlated with poor prognosis in various cancers [36], and lymphocytes play a role in immune surveillance against tumor progression [37]. Monocytes, which differentiate into tumor-associated macrophages (TAMs), have been implicated in tumor invasion, metastasis, and therapeutic resistance [38, 39]. The SIS, which reflects the patient’s nutritional and inflammatory status, has been associated with cancer prognosis and is considered a link between host inflammation and carcinogenesis [40, 41]. In this study, SIS was a risk factor for both benign and malignant ovarian tumors, potentially related to the compromised immune and nutritional status of tumor patients.
The CONUT score, which includes serum albumin, total cholesterol, and lymphocyte count, has been linked to tumor prognosis. High CONUT scores correlate with reduced levels of these parameters, reflecting poor nutritional status. Cholesterol is crucial for cell maintenance, and low levels can impair immune cell function against tumor cells [42, 43], while lymphocytes can induce cytotoxic cell death, exhibiting antitumor effects [44]. The CONUT score, more detailed in its serum albumin cutoff than the SIS, may be influenced by individual differences when using lymphocyte count rather than proportion. In this study, the AUC of the CONUT-combined prediction model was lower than that of the SIS-combined model, and its DCA-reflective accuracy was also inferior, yet both outperformed models without nutritional/inflammatory indicators.
The NPS, incorporating serum albumin, total cholesterol, NLR, and LMR, offers a more comprehensive assessment of the host’s inflammation and nutritional status. The NPS has been significantly associated with the prognosis of various cancers, including colorectal, pancreatic, lung, gastric, and osteosarcoma [18, 45, 46, 47]. The addition of NLR to the NPS score enhances its prognostic accuracy [45, 48]. Neutrophils and lymphocytes play critical roles in the tumor microenvironment, with lymphocytosis indicating a favorable prognosis and lymphocytopenia, increased NLR, and decreased LMR being associated with poor outcomes in solid tumors [49]. TAMs, derived from monocytes, can influence tumor cell characteristics and promote metastasis [50]. This study’s model, containing NPS, had the highest AUC, and its calibration and clinical utility surpassed those of other models, affirming NPS’s potential in tumor prediction.
This study pioneers the application of SIS, COUNT, NPS, and other inflammatory/nutritional scores for the preoperative diagnosis and prediction of benign and malignant ovarian tumors, establishing a nomogram prediction model based on clinical, imaging, and prognostic factors. These biomarkers are objective, widely available, and cost-effective, mitigating measurement and reporting biases. However, as a single-center retrospective study, patient selection and data collection may be biased. The high proportion of advanced-stage patients in the EOC group may have affected nutritional and immune status. Additionally, the study lacks detailed histological typing and grading of EOC, and there is no discussion on the prediction of borderline tumors [51], which are also a significant category of ovarian neoplasms requiring predictive modeling. Furthermore, the cutoff values and scoring criteria vary across the different scoring systems used. Future research could refine the nomogram for diagnostic prediction models based on inflammation/nutrition indicators, enhancing their understanding and application by clinicians and patients.
This research successfully developed a nomogram for the preoperative diagnosis and prognostic assessment of EOC, integrating clinical features, imaging indicators, and novel inflammatory and nutritional scores, including the SIS, COUNT, and NPS. To our knowledge, this is the first report detailing the creation of a comprehensive clinical prediction model that incorporates inflammation and nutritional scores for EOC diagnosis. The integration of these scores into the predictive model enhances the preoperative diagnostic accuracy beyond what can be achieved with clinical and imaging factors alone. Among the scores utilized, the nomogram developed using the NPS demonstrated superior diagnostic accuracy and efficiency, making it a valuable tool for clinicians in preoperative EOC risk stratification and management. The findings of this study pave the way for future research and potential clinical applications, with the aim of improving early detection and overall outcomes for patients with ovarian cancer.
The data that support the findings of this study are available from the corresponding author upon reasonable request.
ZS and DZ designed the study and drafted the manuscript. XW, XC and YW designed the statistical analysis plan. DZ reviewed the manuscript. All authors take responsibility for the appropriateness of the content. All authors contributed editorial changes in the manuscript and approved the final version.
The study was approved by the Ethics Committee of Shengjing Hospital of China Medical University (No. 2022PS134K). All participants provided informed consent.
We would like to express our gratitude to all those who helped us during the writing of this manuscript. Thanks to all the peer reviewers for their opinions and suggestions.
This study was supported in part by grants from 345 Talent Project of Shengjing Hospital of China Medical University (No. M0946), and Medical Education Research Project of Liaoning Province (No. 2022-N005-03).
The authors declare no conflict of interest.
References
Publisher’s Note: IMR Press stays neutral with regard to jurisdictional claims in published maps and institutional affiliations.