


 , Magdalena Wilk 2,3, Magdalena Kwiatkowska 3, Marianna Kopka 3, Przemysław Witek 2,3, Magdalena Krawczyk 3, Katarzyna Cyganek 2,3, Magdalena Szopa 2,3,*
1 Doctoral School of Medical and Health Sciences, Jagiellonian University Medical College, 31-008 Krakow, Poland
2 Department of Metabolic Diseases, Jagiellonian University Medical College, 30-688 Krakow, Poland
3 Department of Metabolic Diseases and Diabetology, University Hospital in Krakow, 30-688 Krakow, Poland
Abstract
Nutritional therapy is the basis of diabetes treatment. Non-compliance with dietary recommendations is a common obstacle in the treatment of diabetes, with attenuated taste perception being one of many potential responsible factors. We investigated the impact of gestational diabetes mellitus (GDM) and type 1 diabetes (T1D) on two sensory modalities—saccadic eye movement and gustatory sense.
In this prospective cohort study, we included 91 participants—28 women with GDM, 26 nonpregnant women with T1D and 37 non-diabetic non-pregnant women. We performed gustatory sense examination (GSE) with test strips for taste modalities and saccadic eye movement examination (SEME) and compared obtained results between study groups. This study was started prior to the requirement for registration of interventional cohort studies.
The mean age of participants was 29.4 ± 5.2 years. Women from the GDM group were older (31.0 [interquartile ranges (IQR): 29.0–35.8] vs. 28.0 [IQR: 22.5–34.8] and 28.0 [IQR: 25.3–30.0] years, p = 0.003) and had higher pre-pregnancy body mass index (BMI) compared to women with T1D and controls (26.2 [IQR: 20.8–28.5] vs. 22.6 [IQR: 20.9–24.4] and 20.9 [IQR: 19.1–22.3] kg/m2, p = 0.001). The total gustatory score was lower in women with GDM and T1D than controls with no significant difference between the GDM and T1D groups (68.8% [56.3%–75.0%], 67.5% [55.0%–76.3%], and 80.0% [70.0%–85.0%], respectively, p < 0.001). Saccadic latency was borderline higher in GDM than in the control group (189.5 ms [162.8–214.3] vs. 167.5 ms [154.5–186.3], p = 0.054) and duration was shorter in GDM than in T1D group (50.0 ms [47.0–53.0] vs. 54.5 ms [48.0–60.3], p = 0.041), with no differences in saccadic amplitude, mean and peak velocity between the studied groups.
The gustatory sense was attenuated to a similar degree in nonpregnant women with T1D and those with GDM, when compared to non-diabetic non-pregnant women. This partially explains the phenomenon of cravings and affects compliance to dietary recommendations. Gustatory testing could be a potential measure to improve the metabolic control of diabetes and reducing the risk of maternal and neonatal complications of pregnancy. More studies in diverse populations of T1D patients are needed to assess the effectiveness of saccadometry in screening for diabetic neuropathy.
Keywords
- GDM
- T1D
- gustatory sense
- saccadometry
- saccades
- taste
- diabetic neuropathy
Pregnancy, when accompanied by developed diabetes, may carry significant burdens
[1]. Gestational diabetes mellitus (GDM) specifically is defined as any degree of
glucose intolerance with onset or first recognition during pregnancy [1]. Current
treatment options for GDM include lifestyle changes as well as both
implementation of an appropriate diet and—when insufficient on its
own—insulin therapy [1]. Type 1 diabetes (T1D), meanwhile, develops as a result
of an autoimmune response directed against insulin-producing
Diabetes’ effects on the microvasculature create a wide spectrum of complications, ranging from changes in the cardiovascular system to alterations in the functioning of the nervous tissue, leading to diabetic sensory polyneuropathy and cardiovascular autonomic neuropathy (CAN) [2]. Screening for signs and symptoms of diabetic neuropathy is critical in clinical practice, as it gives a chance to detect the earliest stages of neuropathy, enabling early intervention. Standard methods of screening include dedicated questionnaires and physical examination with of either temperature or pinprick sensation with a monofilament and vibration sensation using a tuning fork. Standard CAN screening requires more elaborate equipment and is time consuming [1, 3]. There is a need to develop simple and cost-effective methods of early identification of patients at risk of developing diabetes complications, as diabetic neuropathy and CAN are strongly associated with increased cardiovascular risk [4]. The saccadic or eye movement system is the ocular motor system that allows the eyes to rapidly fixate a target on the fovea. Saccadic eye movement examination (SEME) is a simple tool that may be a promising new screening method for asymptomatic diabetic neuropathy [5].
Nerves carrying impulses from taste buds can also be affected by diabetic neuropathy in T1D. In young people with T1D, without developed complications and characterized by good metabolic control, in whom typical complications may not be yet detected with standard methods of investigation, gustatory sense can be altered [6]. Nevertheless, this aspect has been rarely studied to date. GDM usually does not cause long-term neurological complications, though some studies indicate that pregnancy and diabetes affect gustatory sense [6, 7]. These reports are, however, often conflicting. Nutritional therapy is the basis of diabetes treatment for both pregnant and non-pregnant patients. Should pregnancy’s effect on gustatory sense be definitively proven, the attenuated taste perception could be a potential explanation for non-compliance with dietary recommendations in GDM patients, a commonly presenting obstacle in their treatment [8]. As gustatory sense examination (GSE) is relatedly rarely studied and, according to some authors it may lack objectivity [7], by joining it with SEME, its value in screening for diabetic neuropathy could be increased.
The aim of this study was to investigate the impact of GDM and T1D on two sensory modalities—saccadic eye movement and gustatory sense, and to compare the extent of any potential changes to non-pregnant and nondiabetic women.
In this prospective cohort study we included 91 participants—28 women with
GDM, 26 nonpregnant women with T1D and 37 non-diabetic non-pregnant women as the
control group. The recruitment took place between June 2022 and July 2024. Women
with diabetes were recruited from the Diabetes Outpatient Clinic in Department of
Metabolic Diseases, University Hospital in Krakow, Poland, a tertiary reference
center for pregnant women with diabetes in the Lesser Poland region. Patients who
met the inclusion criteria were offered to participate in the study. The
inclusion criteria were: age between 18 and 45 years old, diagnosis of GDM or T1D
(for T1D—diagnosed at least 1 year before screening) according to the World Health Organization (WHO)
recommendations, depending on the study group, and signed patient’s consent to
participate in the study. The exclusion criteria were: pregnancy for T1D group,
obesity (body mass index [BMI]
Data on age, comorbidities, drugs, diabetes duration (on the day of screening),
insulin therapy and its mode, total daily dose of insulin (on the day of
screening), weight, height and BMI (on the day of screening or before pregnancy
in GDM study group), glycated hemoglobin (HbA1c%), serum creatinine, total,
low-density lipoprotein (LDL) and high-density lipoprotein (HDL) cholesterol,
triglycerides and albumin-to-creatinine ratio were extracted from the medical
records. HbA1c% levels were measured using high-performance liquid
chromatography. Additionally, for T1D and GDM participants, continuous glucose
monitoring metrics were gathered, including time in range (TIR, for GDM women
regarded as 63–140 mg/dL [3.5–7.8 mmol/L], for T1D women as 70–180 mg/dL
[3.9–10.0 mmol/L]), time below range (TBR,
The examination employed the Saccadometer Advanced system with proprietary data analysis software (Ober Consulting, Warsaw, Poland) [11]. This device allows the evaluation of saccadic eye movement (SEM) parameters using handy and easy-to-use equipment. The Saccadometer Advanced system measures eye movements in the horizontal axis with adequate temporal and spatial resolution. The cue for saccades is projected with miniature laser projectors mounted on the forehead plate with sensors below it directed against the eyes of the examinee [11]. We assessed the saccadic latency, duration amplitude, and mean and peak velocities.
GSE was carried out using validated tests designed for research (ODOFIN, Sense Trading BV, Groningen, Netherlands) [12]. Sweet, salty, sour, umami and bitter modalities were assessed (bitter taste was not assessed in GDM women). The GSE kit consists of strips covered with a microcellulose coating saturated with substances in four increasing concentrations, respectively: for sweet modality with sucrose, for salty modality with natrium chloride, for sour modality with citric acid, for umami modality with monosodium glutamate, for bitter modality with caffeine [12]. The GSE protocol began with the presentation of all the modalities using strips with the highest concentration of the substance. Then, during the actual GSE, the test strips were presented to the participant in random order with the proband giving her answer noted by the examinator. On this basis, the lowest concentration of the substance at which the proband had been able to recognize the taste was determined. The summary result for each modality was recorded as well as the total number of correctly recognized tastes given as a whole number and fraction X/20 (X indicating the sum of all tastes of a proband, in the case of GDM women ([the sum of all tastes of a proband]/16)).
Analyses encompassed comparisons between the three study groups: patients with T1D, patients with GDM and control group of non-diabetic non-pregnant participants. Baseline demographic characteristics, data specific to diabetes (diabetes duration, insulin dose, OGTT results), SEME results—latency, duration amplitude, mean and peak velocity, and GSE results—individual modalities scores, total score (whole number and a fraction) were analyzed between the study groups. Additionally, within the study groups, we performed correlation analyses between selected demographic and diabetes-specific variables, SEME and GSE results.
The sample size calculation was based on data concerning SEM latency and peak velocity in saccadometric examination in people with T1D and healthy controls [5]. Designing a study comparing means of saccadometric examination parameters between two groups (effect size 0.83) a minimum of 24 patients per group would provide 80% power to detect a true difference in means between the test and the reference group by alpha set at 0.05.
Normality of the continuous variable distribution was assessed using the Shapiro–Wilk test. Analysis of participants’ baseline data for quantitative variables was performed using Student’s t-test and analysis of variance (ANOVA) for normally distributed data, and Mann-Whitney’s and Kruskall-Walis tests for non-normally distributed data. The Chi-square test was used for the analysis of qualitative variables. In post-hoc analyses of the Kruskall-Walis test the Dunn’s test was used with the Bonferroni correction for multiple analyses. Analysis of correlations between qualitative variables was conducted utilizing Pearson’s and Spearman’s methods. A complete case selection approach was used in the case of missing data. The PS Imago Pro ver. 10.0 (IBM, Armonk, NY, USA) was used for statistical analyses. G-power ver. 3.1 (HHU, Dusseldorf, Germany) was used for sample size calculations [13].
We analyzed the data of 28 women with GDM, 26 nonpregnant women with T1D and 37
non-diabetic non-pregnant women. The mean age of participants was 29.4
| GDM | T1D | Control group | Adjusted p value | |
| N = 28 | N = 26 | N = 37 | ||
| Age [years] | 31.0 (29.0–35.8)&# | 28.0 (22.5–34.8)& | 28.0 (25.3–30.0)# | 0.003* |
| BMI [kg/m2]$ | 26.2 (20.8–28.5)† | 22.6 (20.9–24.4)‡ | 20.9 (19.1–22.3)†‡ | 0.001* |
| Hypothyroidism [N (%)] | 5 (17.9%) | 9 (34.6%) | 3 (8.8%) | NA |
| Hypertension [N (%)] | 3 (10.7%) | 0 | 1 (3.0%) | NA |
| CGM use [N (%)] | 19 (67.9%) | 19 (73.1%) | 0 | NA |
Data are presented as medians (interquartile range).
T1D, type 1 diabetes; GDM, gestational diabetes mellitus; BMI, body mass index; CGM, continuous glucose monitoring; NA, not assessed; N, number of participants.
*, adjusted p value
In the GDM group, the mean week of pregnancy of first visit in the clinic was
30.0
In the T1D group, the mean duration of T1D was 10.7
There were significant differences in the total gustatory score between the
study groups, with women with GDM and T1D scoring lower than healthy controls,
with no significant difference between the GDM and T1D groups (p
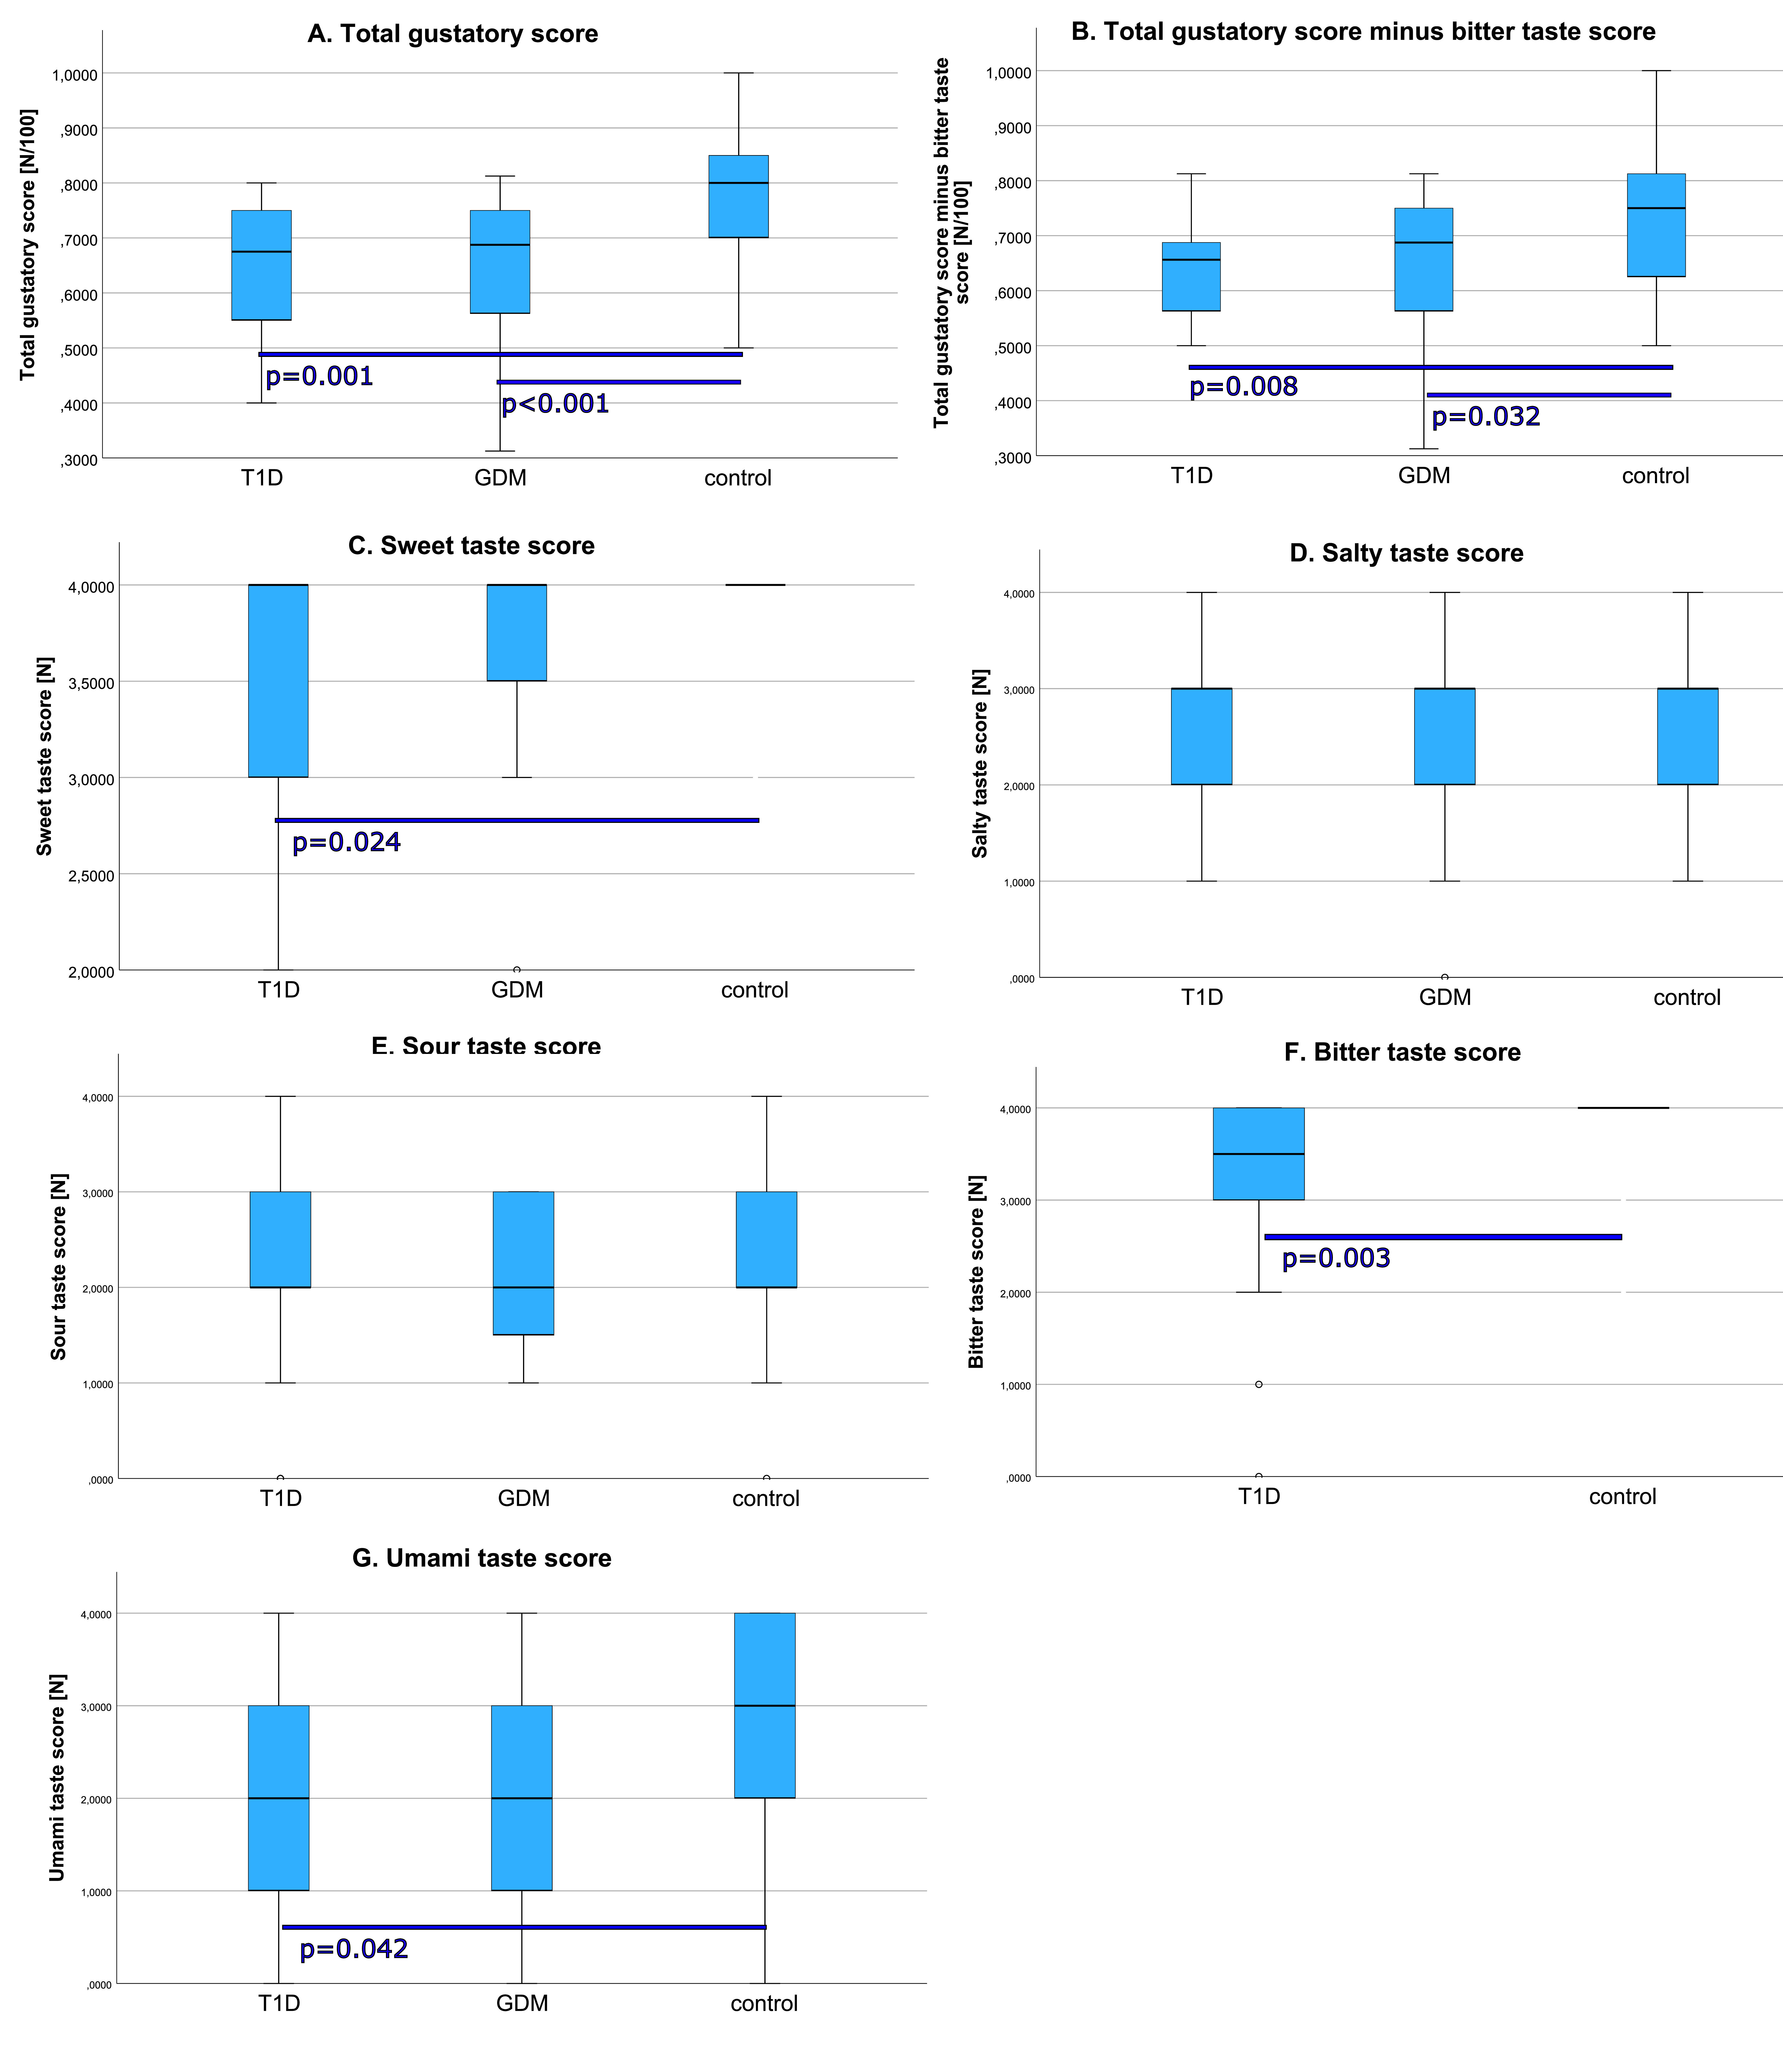 Fig. 1.
Comparison of taste scores (box plots with medians and IQRs). (A) Total gustatory score (%). (B) Total gustatory score minus bitter taste score (%). (C) Sweet taste score. (D) Salty taste score. (E) Sour taste score. (F) Bitter taste score. (G) Umami taste score. Circles mark outliers. Significant differences are marked with p values. T1D, type 1 diabetes; GDM, gestational diabetes mellitus; IQRs, interquartile ranges.
| Gustatory sense examination | GDM | T1D | Control group | Adjusted p value |
| n = 28 | n = 26 | n = 37 | ||
| Total score [N] | 11.0 (9.0–12.0)$ | 13.5 (11.0–15.3)# | 16.0 (14.0–17.0)$# | |
| Total score [%] | 68.8 (56.3–75.0)$ | 67.5 (55.0–76.3)# | 80.0 (70.0–85.0)$# | |
| Total score minus bitter score [N] | 11.0 (9.0–12.0)† | 10.5 (8.8–11.3)‡ | 12.0 (10.0–13.0)†‡ | 0.004* |
| Total score minus bitter score [%] | 68.8 (56.3–75.0)† | 65.6 (54.7–70.3)‡ | 75.0 (62.5–81.3)†‡ | 0.004* |
| Sweet [N] | 4.0 (3.3–4.0) | 4.0 (3.0–4.0)§ | 4.0 (4.0–4.0)§ | 0.030* |
| Sour [N] | 2.0 (1.3–3.0) | 2.0 (1.8–3.0) | 2.0 (2.0–3.0) | NS |
| Salty [N] | 2.0 (2.0–3.0) | 3.0 (2.0–3.0) | 3.0 (2.0–3.0) | NS |
| Bitter [N] | NA | 3.5 (2.8–4.0)ǁ | 4.0 (4.0–4.0)ǁ | 0.003* |
| Umami [N] | 2.0 (1.0–3.0) | 2.0 (1.0–3.0)ª | 3.0 (2.0–4.0)ª | 0.033* |
Data are presented as medians (interquartile range).
GSE, gustatory sense examination; T1D, type 1 diabetes; GDM, gestational diabetes mellitus; NA, not assessed; NS, not significant; N, number of score points; n, number of participants.
*, adjusted p value
Analysis showed that there were significant differences in SEM latency and duration between the study groups (p = 0.050 and 0.046, respectively). Latency was borderline higher (p = 0.054) in GDM than in the control group and duration was shorter in GDM than in T1D group (p = 0.041). There were no differences in SEM amplitude, mean and peak velocity between the studied groups (Table 3, Fig. 2).
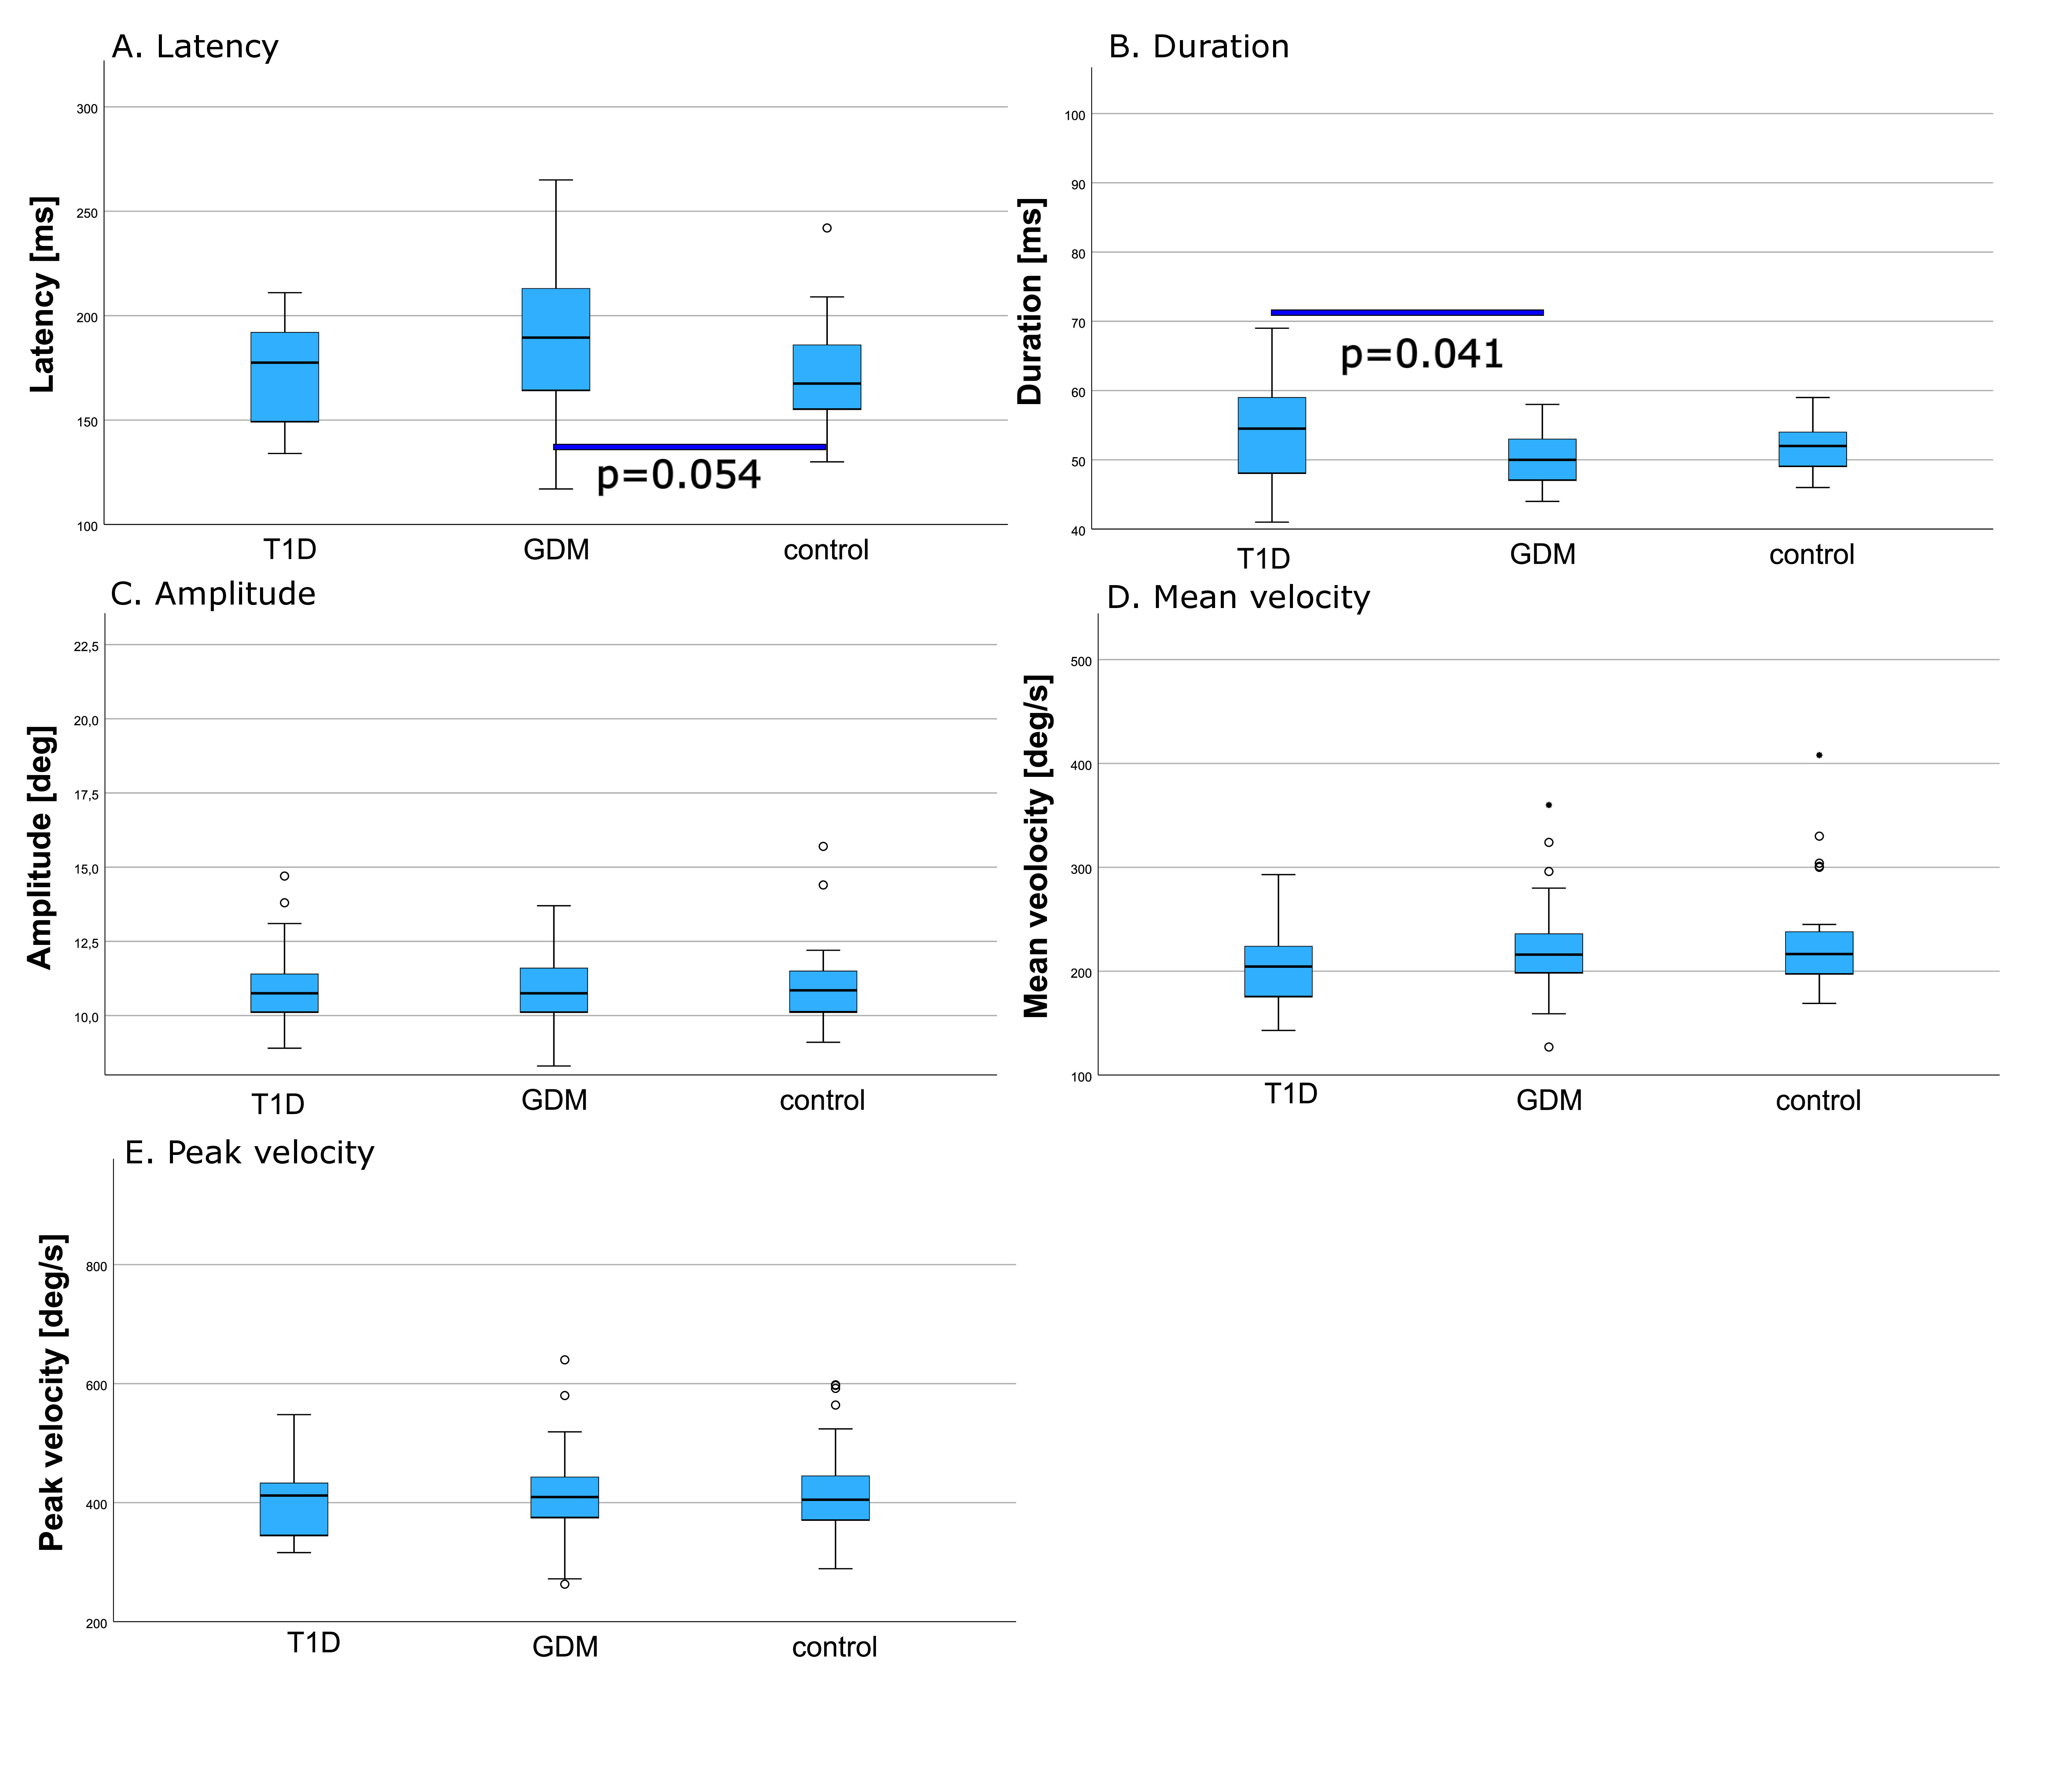 Fig. 2.
Comparison of saccadic eye movement parameters ((box plots with medians and IQRs). (A) Latency. (B) Duration. (C) Amplitude. (D) Mean velocity. (E) Peak velocity. Circles mark outliers. Significant differences are marked with p values. T1D, type 1 diabetes; GDM, gestational diabetes mellitus; IQRs, interquartile ranges.
| Saccadic eye movement examination | GDM | T1D | Control group | Adjusted p value |
| n = 28 | n = 26 | n = 37 | ||
| Latency [ms] | 189.5 (162.8–214.3)# | 177.5 (148.3–192.5) | 167.5 (154.5–186.3)# | 0.050* |
| Duration [ms] | 50.0 (47.0–53.0)$ | 54.5 (48.0–60.3)$ | 52.0 (49.0–54.0) | 0.046* |
| Amplitude [deg] | 10.8 (10.1–11.8) | 10.8 (10.1–11.5) | 10.9 (10.2–11.5) | NS |
| Mean velocity [deg/s] | 216.0 (197.8–233.5) | 204.5 (174.8–227.5) | 216.5 (195.0–238.3) | NS |
| Peak velocity [deg/s] | 409.5 (373.3–453.0) | 412.0 (342.5–438.8) | 405.0 (369.0–445.0) | NS |
Data are presented as medians (interquartile range).
SEME, saccadic eye movement examination; T1D, type 1 diabetes; GDM, gestational diabetes mellitus; NS, not significant; n, number of participants.
*, adjusted p value equal or
To identify factors that could affect the total gustatory score we also
performed additional analyses within the study groups. There were no significant
differences in GSE and SEME results between women with BMI
There were no correlations between age, duration of diabetes, total daily dose (TDD) of insulin, MNSI score, HbA1c%, CGM metrics, and SEME and GSE results in T1D women with the exception for a negative correlation between age and salty taste score (–0.408, p = 0.039), a positive correlation between SEM latency and TBR (0.557, p = 0.039), a positive correlation between SEM duration, HbA1c% and TAR (0.515, p = 0.008 and 0.546, p = 0.044), a negative correlation between SEM duration and TIR (–0.522, p = 0.038) and a positive correlation between SEM amplitude and MNSI score (0.462, p = 0.047, Supplementary Fig. 1).
There were no correlations between age, prepregnancy BMI, TDD of insulin, OGTT results, CGM metrics, SEME and GSE results in GDM women. There was a negative correlation between age and sweet taste score (–0.554, p = 0.002), a positive correlation age and sour taste score (0.472, p = 0.011), a positive correlation between FPG in the first trimester of pregnancy, total gustatory score and sweet taste score (0.512, p = 0.043 and 0.696, p = 0.008, Supplementary Fig. 2).
Apart from a positive correlation between BMI and total gustatory score (0.481, p = 0.032) and a negative correlation between BMI and SEM latency (–0.576, p = 0.008), there were no significant correlations in the control group, (Supplementary Fig. 3).
Correlation analyses between SEME and GSE results showed that in women with T1D, total gustatory score was negatively correlated with SEM latency (–0.392, p = 0.047) and salty taste score was negatively correlated with SEM amplitude (–0.441, p = 0.024, Supplementary Fig. 1. In GDM group sour taste score was positively correlated with SEM latency (0.420, p = 0.032, Supplementary Fig. 2). In the control group there were negative correlations between salty taste score and SEM peak and mean velocity (–0.471, p = 0.006 and –0.372, p = 0.033, Supplementary Fig. 3).
In this study we showed that gustatory sense is attenuated to similar extent in nonpregnant women with T1D and those with GDM, when compared to non-diabetic non-pregnant women. This resemblance is surprising, as it seems that even short duration of relatively mild hyperglycemia in GDM may more significantly that suspected impact gustatory sense. Importantly, these differences in GDM women were independent of typical characteristics of this population, that is older age and higher BMI.
Some changes have been demonstrated regarding the sense of taste in pregnant women [7]. The most frequently studied modality in pregnancy was sweet taste, but the results obtained are inconclusive, showing either decrease [14, 15, 16] or increase [17] in the intensity of sensation of this modality, with some reporting no changes [18, 19, 20, 21]. Additionally, some studies showed trajectories of changes to be dependent on the trimester of pregnancy [14, 15, 16, 17]. Sour taste perception during pregnancy remained unchanged [18, 19, 22] or was reduced [14, 15], similarly to a decrease in the intensity of salty taste sensation. The authors linked changes in these modalities to the promotion of electrolyte replenishment [18, 20]. Some researchers have shown greater sensitivity of pregnant women to bitter taste, postulating that this is a protective mechanism against harmful substances—usually bitter in taste [17, 18], with others reporting impairment in the perception of bitter taste [14, 19, 22].
We identified only singular studies that assessed changes in taste in women with GDM [16, 23] but, again, they were inconclusive due to lacking thorough gustatory sense testing. In one study, the evaluation was conducted using a strawberry-flavored beverage sweetened in varying concentrations. Women with GDM in the third trimester of pregnancy rated sweeter drinks as tastier than women without GDM [16]. This is a more natural way of taste testing, however it comes at a cost of objectivity. Moreover, it focuses on assessing rather the hedonic response to sweet taste and the modality of taste itself.
A potential source of such a wide variety of inconclusive results may be the methodology of gustatory testing [7]. In some studies women subjectively, retrospectively described changes in their sense of taste during pregnancy [7, 15]. The design of the remaining studies was based on comparing pregnant women (in different trimesters) with non-pregnant women as a control group [14, 16, 17, 18, 19]. Only one study tracked the sensory changes of the same group of women before pregnancy and at each trimester of pregnancy, as well as at corresponding time intervals in the control group [18].
Similar attenuation of taste function that was observed in our study could have been caused by low-grade inflammation that was reported to be present in patients with T1D and GDM [24, 25]. Immunological factors, such as interleukin-10 (IL-10) and tumor necrosis factor alpha (TNF-alpha), were proved to affect the gustatory sense function [24]. Multiple cytokine levels are increased in pregnanciec complicated by GDM, including interleukin-6 (IL-6) and human chitinase-3-like protein 1 [26, 27]. One interesting finding from mice models was the presence of a local production of TNF-alpha and sensitivity to it in taste bud cells containing the taste-1-receptor-3 (T1R3) subunit. Mice lacking the TNF-alpha gene had a significantly elevated threshold for detecting bitter taste [28].
Endocrine factors affect the gustatory sense in a major way. Receptors for many hormones have been discovered on taste bud cells, including those for estrogen, progesterone and oxytocin [29, 30]. Studies on mice lacking the oxytocin gene suggest that it led to the reduction of intensity of sweet taste perception [31, 32]. During pregnancy, oxytocin concentrations are increased but its action is locally blocked in the myometrium until delivery. Another potential modulator of taste is leptin as its receptors have also been discovered on taste buds. Leptin, a satiety hormone secreted by white adipose tissue cells, inhibits the sensation of sweet taste in mice [33, 34]. Leptin levels gradually increase during pregnancy as body fat increases. In one study of GDM women, fasting leptin and insulin concentration were positively correlated with higher with the liking scores of sweet solutions [23]. Thus, leptin may be another factor in the downward modulation of sweet taste sensation. Finally, angiotensin II receptors can also be found on taste bud cells containing the T1R3 subunit. In an animal model, administration of angiotensin II increased the frequency of potentials in nerve endings conducting sweet taste sensation and decreased the frequency for salty taste [35]. Pregnant women experience an increase in all components of the renin-angiotensin-aldosterone system [36], which may thus lead to the increase in intensity of sweet taste sensation [17] and decrease gustatory sensation for salty taste [18, 20] as was reported in some studies.
The total gustatory score was higher in women treated with insulin but all women with diabetes in our study (either with GDM or T1D) were using insulin. Still, insulin has been reported to downregulate in the proliferation of taste bud cells in vitro [37], potentially leading to attenuation of taste perception as observed in our study. This concept warrants further clinical investigation.
Finally, our study is the first one to report on umami taste perception in GDM women, showing no differences between them and non-pregnant non-diabetic controls. Previous studies in patients with diabetes [38] and metabolic syndrome [39] showed lower sensitivity to this modality. One study in patients with diabetes attributed this to the vicious cycle of deterioration of the oral environment causing taste disorders that lead to non-compliance to dietary recommendations and poor glycemic control [38]. Products rich in umami taste have also been linked to an increased risk of obesity and metabolic syndrome but the mechanism responsible is still poorly understood [39]. Strikingly, we also did not identify any studies in pregnant women. This scarcity of evidence calls for a larger research effort.
In summary, women with GDM two factors potentially affecting the gustatory sense are present—hyperglycemia and pregnancy, and the combined effects of these two states seem to results in similar attenuation of taste as is observed in non-complicated T1D. Hormonal changes, such as leptin and insulin, have been suggested to affect gustatory sense in GDM but their levels are also secondary to both diabetes and pregnancy [23], justifying investigation of these two states together. Our findings, which support diminished gustatory sense in GDM women, somewhat explain the phenomenon of, and enable giving more accurate feedback for, cravings and other dietary preferences that may emerge during GDM—complicated pregnancy. This in turn should lead to improved control of glycemia and reducing the risk of maternal and neonatal complications of pregnancy. GSE in people with diabetes can be treated as a non-invasive, low-cost but effective example of personalized medicine, an approach that has been gaining extensive attention recently.
T1D women in our study had lower sensitivity to sweet and umami tastes than non-diabetic controls. Several studies have unanimously shown a decrease in sensitivity to the primary modalities of taste—sweet, salty, sour and bitter [6, 40, 41, 42] but only a few investigated umami taste [38]. One study linked these gustatory changes to polyneuropathy and factors that predispose to diabetes development, smoking and alcohol consumption [6]. It has been suggested that these predisposing factors may affect dietary choices and preference for sweet foods, which exacerbates hyperglycemia [42]. Contradicting these findings, however, is an another study of patients with T1D but no developed diabetic complications, that found no significant changes in the sensitivity of the senses of taste and smell [43]. Our study falls in support of diabetes causing a change in gustatory sensation, as differences in sensation were seen when compared to non-diabetic non-pregnant women, despite moderately short duration of diabetes and no history of diagnosed diabetes complications.
Contrary to our expectations and previous research [5, 44, 45, 46], there were no statistically significant differences in SEME results between women with T1D and healthy controls. Our results may be explained by moderately short duration of diabetes in T1D women and their relatively good metabolic control [47]. The above mentioned studies [5, 44] included cohorts of patients treated in the 1990s when most current therapies for T1D had not been available, possibly resulting in unsatisfactory metabolic control. A recent study, that excluded patients with developed T1D complications, reported some abnormalities in the function of oculomotor system in this population [46]. However, it used a different type of computer-assisted eye-tracking-based system, thus limiting the extrapolation these results to ours. In our population, the MNSI questionnaire seemed to be more effective in the early stages of the development of diabetic neuropathy. Despite this, we believe that SEME may be a promising tool in screening for diabetic neuropathy due to its objectivity. For this reason, in future we plan to focus solely on T1D patients with a wide spectrum of metabolic control, diabetes duration and different stages of diabetic neuropathy. Finally, our finding that GDM affects SEME latency and duration is novel and noteworthy as we were not able to identify any studies investigating saccades in pregnancy, GDM or new-onset diabetes of any type. We suspect that the longer SEM latency in GDM women in our study should not be attributed to hyperglycemia, usually mild and transient. Other factors, such as hormonal changes or diabetic distress could be the culprits. The shorter saccadic duration observed in our study could be secondary to longer latency.
An intriguing explanation of discrepancy between GSE and SEME results in T1D patients could be an early and selective damage due to hyperglycemia to taste bud cells and/or nerve fibers carrying impulses from the taste buds to the central nervous system. Moreover, as taste sensation can be affected by neuropathy, we searched for correlations between SEME and GSE results and found a negative correlation between the total gustatory score and SEM latency. This is logical, as better gustatory sense may indicate a better condition of nerves, thus shorter causing (“more normal”) SEM latency.
We acknowledge some limitations of our study. First, the number of participants was relatively small. Based on the sample size calculation it was adequate to detect a difference in SEME parameters reported previously. However, the only studies on SEM in people with T1D included distinctively different population than ours. Second, we did not include comparisons between pregnant women with T1D, women with GDM and non-diabetic pregnant controls. This would add to our study, however it would also require a much larger study group to achieve adequate power of statistical analysis. Third, we did not include people with T1D and diabetic neuropathy. Finally, there is no universally accepted methodology of gustatory sense testing, potentially limiting extrapolation of our results to wider cohorts. Still, it should be noted that the advantage of our study is the use of a control group of non-diabetic, non-pregnant women. Moreover, our study is the first one thoroughly assess the gustatory sense and SEM in GDM women.
In this study, we showed that gustatory sense is attenuated to similar extent in nonpregnant women with T1D and those with GDM, when compared to non-diabetic non-pregnant women, potentially affecting dietary choices, compliance to dietary recommendations and, finally, the metabolic control of diabetes. This finding may partially explain the phenomenon of cravings and enable giving more accurate dietary feedback during GDM. Gustatory testing could be a potential measure to improve the metabolic control of diabetes and reducing the risk of maternal and neonatal complications of pregnancy. There were however no differences in the quantitative parameters of SEM between the compared groups. More studies in T1D patients with longer duration of diabetes are needed to assess the effectiveness of saccadometry in screening for diabetic neuropathy.
The data analyzed in the paper is available from the corresponding author upon reasonable request.
MiK and MS designed the study. MiK, MW, MagKw, MarK, PW and MagKr qualified the patients and performed the study procedures. MiK and MW were responsible for the data curation, MiK performed statistical analysis, validated and visualized the study results. MiK and MS acquired finding for the study. MiK, KC and MS designed the methodology of the study. MiK and MS were responsible for the project administration. MagKw, MarK, PW, MagKr, PW and KC provided resources for the study. MiK wrote the original draft of the manuscript. All authors contributed to editorial changes in the manuscript. All authors read and approved the final manuscript. All authors have participated sufficiently in the work and agreed to be accountable for all aspects of the work.
The study was conducted in accordance with the Declaration of Helsinki. This study was approved by the Jagiellonian University Bioethics Committee (Komisja Bioetyczna Uniwersytetu Jagiellońskiego), approval number 1072.6120.126.2021. The study was conducted in accordance with local legislation and institutional requirements. All the participants provided written informed consent to participate in this study. This study was started prior to the requirement for registration of cohort studies. The present study reported in accordance with the STrengthening the Reporting of OBservational Studies in Epidemiology (STROBE) guidelines (Supplementary File 2).
The authors acknowledge the editorial assistance of Ms. Joana Mielko, School of Medicine in English, Jagiellonian University Medical College.
This study was funded Jagiellonian University Medical College (grant number N41/DBS/001196).
The authors declare no conflict of interest.
Supplementary material associated with this article can be found, in the online version, at https://doi.org/10.31083/j.ceog5112277.
References
Publisher’s Note: IMR Press stays neutral with regard to jurisdictional claims in published maps and institutional affiliations.