


1 Department of Obstetrics and Gynecology Rehabilitation, West China Second Hospital, Sichuan University, 610041 Chengdu, Sichuan, China
2 Department of Obstetrics and Gynecology Rehabilitation, Key Laboratory of Obstetric & Gynecologic and Pediatric Diseases and Birth Defects of Ministry of Education, 610041 Chengdu, Sichuan, China
Abstract
Postpartum women often show depression and anxiety, abnormal memory and cognitive function, and pelvic floor function problems. Brain function test is also a new research direction generated combining life science and computer science. This study aimed to observe the brain function status of postpartum women and analyze the correlation between brain function and pelvic floor function and gestational weight.
A cross-sectional study of women with medical record in our hospital. A total of 88 outpatient postpartum women with pelvic floor dysfunction including 48 cases of cesarean section and 40 cases of vaginal delivery who underwent brain function tests from August 2022 to September 2023 and met the inclusion criteria were included. Basic demographic information, brain function tests, pelvic floor examination, and pregnancy-related data were extracted. The brain function status of women after vaginal delivery and cesarean section was analyzed statistically, and analysis of the relationship between pelvic floor assessment and brain function.
Of the 88 postpartum women, >50% showed abnormal findings in the hypoxia index, emotional resistance, sleep index, outside focus, brain fatigue, brain emptying, and reaction speed. Statistical differences in brain fatigue (p < 0.001) and brain emptying (p = 0.002) were observed between postpartum women with vaginal delivery and cesarean section. Correlation analysis results revealed that prolapse was correlated with brain emptying (p < 0.001), and weakly correlated anxiety tendency (p = 0.05), sleep index (p = 0.02), introverted brain (p = 0.05), brain fatigue (p = 0.02). Pelvic floor muscle strength was associated with emotional resistance (p = 0.03), brain inhibition (p = 0.04), and brain stability (p = 0.03) weakly. Weight gain during pregnancy was related to inner focus (p = 0.001), and weakly related to oxygen deficiency index (p = 0.04), brain stability (p = 0.03), brain coordination (p = 0.01), brain emptying (p = 0.04), and reaction speed (p = 0.01).
This study observed that most postpartum women have abnormal brain function, including mood, sleep, fatigue, cerebral oxygen metabolism, concentration, and information processing ability, and showed that postpartum brain function problems might correlated with pelvic floor function and pregnancy weight gain.
Keywords
- pelvic floor dysfunction
- postpartum women
- brain function
- pregnancy weight gain
During pregnancy and postpartum, women experience significant changes in brain function, and clinical studies have shown that women’s postpartum memory may decline, cognitive ability changes, and even anxiety, depression, and other mental problems may develop. Most of these changes are mainly investigated through neurological and psychopsychological tests [1, 2, 3, 4]. With the advancement in the detection and research of brain neural structure and function including the use of functional magnetic resonance imaging, studies have revealed that the neural matrix changes in postpartum women’s cognitive network during the working memory process and resting state and that pregnancy will cause significant changes in brain structure and function [5, 6, 7]. However, few studies have observed the changes in a postpartum woman’s brain function by electroencephalogram (EEG).
Postpartum women frequently experience pelvic floor functional problems as a result of uterine enlargement during pregnancy, fetal pressure on the pelvic floor, and damage incurred during childbirth. Additionally, the pelvic floor plays a crucial role in respiratory movements, thereby impacting postpartum respiratory function [8]. In addition to affecting breathing, several studies have indicated that older adult women with pelvic floor dysfunction are more likely to develop anxiety, depression, and cognitive impairment [9, 10]. Studies have confirmed that obesity is a significant risk factor for cognitive impairment, particularly during pregnancy when women experience the most pronounced changes in weight [11, 12]. Furthermore, research has suggested that maternal weight gain during pregnancy can impact the cognitive function of offspring [13]; however, limited studies have explored the effects of weight fluctuations on postpartum women’s brain health. EEG can be used for brain function detection through analysis and transformation. Currently, studies based on EEG analysis of pain, anxiety, depression, psychological, and cognitive have been conducted [14, 15]. Brain function test is also a new research direction generated combining life science and computer science. By analyzing data from postpartum women who underwent brain function tests, this study aimed to investigate brain function changes associated with pelvic floor dysfunction and analyze the correlation between brain function and pregnancy weight, exercise, and other factors.
This study was a retrospective study, included postpartum women with pelvic floor dysfunction who underwent brain function tests and met the inclusion criteria in Obstetrics and Gynecology Rehabilitation Center of West China Second Hospital of Sichuan University from August 2022 to September 2023. Overall, 88 postpartum women were included, including 48 and 40 cases of cesarean section and vaginal delivery, respectively. The ethics committee of West China Second Hospital of Sichuan University approved this study, the ethics approval number is 2023(176). Apply for and obtain exemption from informed consent from the Ethics committee for this study, and compliance with the Declaration of Helsinki.
The following were the inclusion criteria: postpartum women with pelvic floor dysfunction who underwent brain function tests and who were 20–50 years old. The following were the exclusion criteria: those who underwent postpartum rehabilitation within 3 months after delivery; with incomplete and missing records of indicators to be observed; with a history of psychiatric or neurological disorders, including depression and stroke; with history of thoracic, abdominal and visceral malignancies; pregnancy with diabetes, hypertension, and other complications; and brain function tests after treatment.
Basic demographic information, brain function test data, pelvic floor examination records, and pregnancy-related data of patients were extracted. Pelvic organ prolapse quantification (POP-Q) evaluation, manual muscle strength examination, and evaluation data were collected, which was completed by the professional outpatient physician. During the POP-Q examination, the patient’s position is (lithotomy, supine, standing), and the patient is instructed to hold his breath downward, and the location of the prolapse is recorded by calculating the most distal part of the prolapse when it is fully presented. Using the hymen as a reference, the position of the hymen relative to the hymen was recorded at 6 indicator points such as the anterior wall, the posterior wall, and the top of the vagina. The outcome measure of prolapse was assessed according to the location parameters of the test, which were divided into five degrees (including normal grades), which is also an international standard [16].
To measure muscle strength, the patient is placed in a supine position, the legs are bent apart, and the examiner places the lubricated index and middle fingers deep into the vagina, and asks the patient to contract the pelvic floor muscles vigorously and feel the pressure on the fingers. The modified Oxford Strength Grading Scale is used on a scale of 0 to 5, with grade 0 being no muscle contraction felt at all and grade 5 resisting resistance to posterior vaginal wall elevation and squeezing the index and middle fingers together [17].
Relevant indicators included the following: anterior wall Aa, Ba; posterior wall Ap, Bp; cervix or cuff (point C); posterior fornix (point D); genital hiatus; perineal body; total vaginal length; anterior and posterior wall prolapse; and classes I and II muscle strength [18]. Pregnancy weight and exercise-related data included occupation, labor intensity, exercise frequency (per week), weight gain during pregnancy, and newborn weight.
A multifunctional combined monitor (HXD-I., Heilongjiang Huaxiang Technology Development Co., Ltd., Harbin, Heilongjiang, China; Beijing Yifei Huatong Technology Development Co., Ltd., Beijing, China) was used for measuring brain function. Data on brain function were collected after the patient’s visit but before treatment. EEG signal measurement was started after a 2-min rest, and effective EEG signals were continuously collected for 6 min, which included EEG data such as eye opening, eye closing, eye opening for the second time, and staying focused under the real-time voice prompts of the system’s specified tasks (Fig. 1) [19]. The software V5.0 of Beijing Yifei Huatong Technology Development Co., Ltd. (Beijing, China) was used to process the collected EEG signals, and the index data included in this study were hypoxia index, emotional resistance, anxiety tendency, depressive tendency, sleep index, introverted brain, brain inhibition, brain stability, brain coordination, memory processing, outside focus, inner focus, brain fatigue, brain emptying, and reaction speed (Supplementary Table 1).
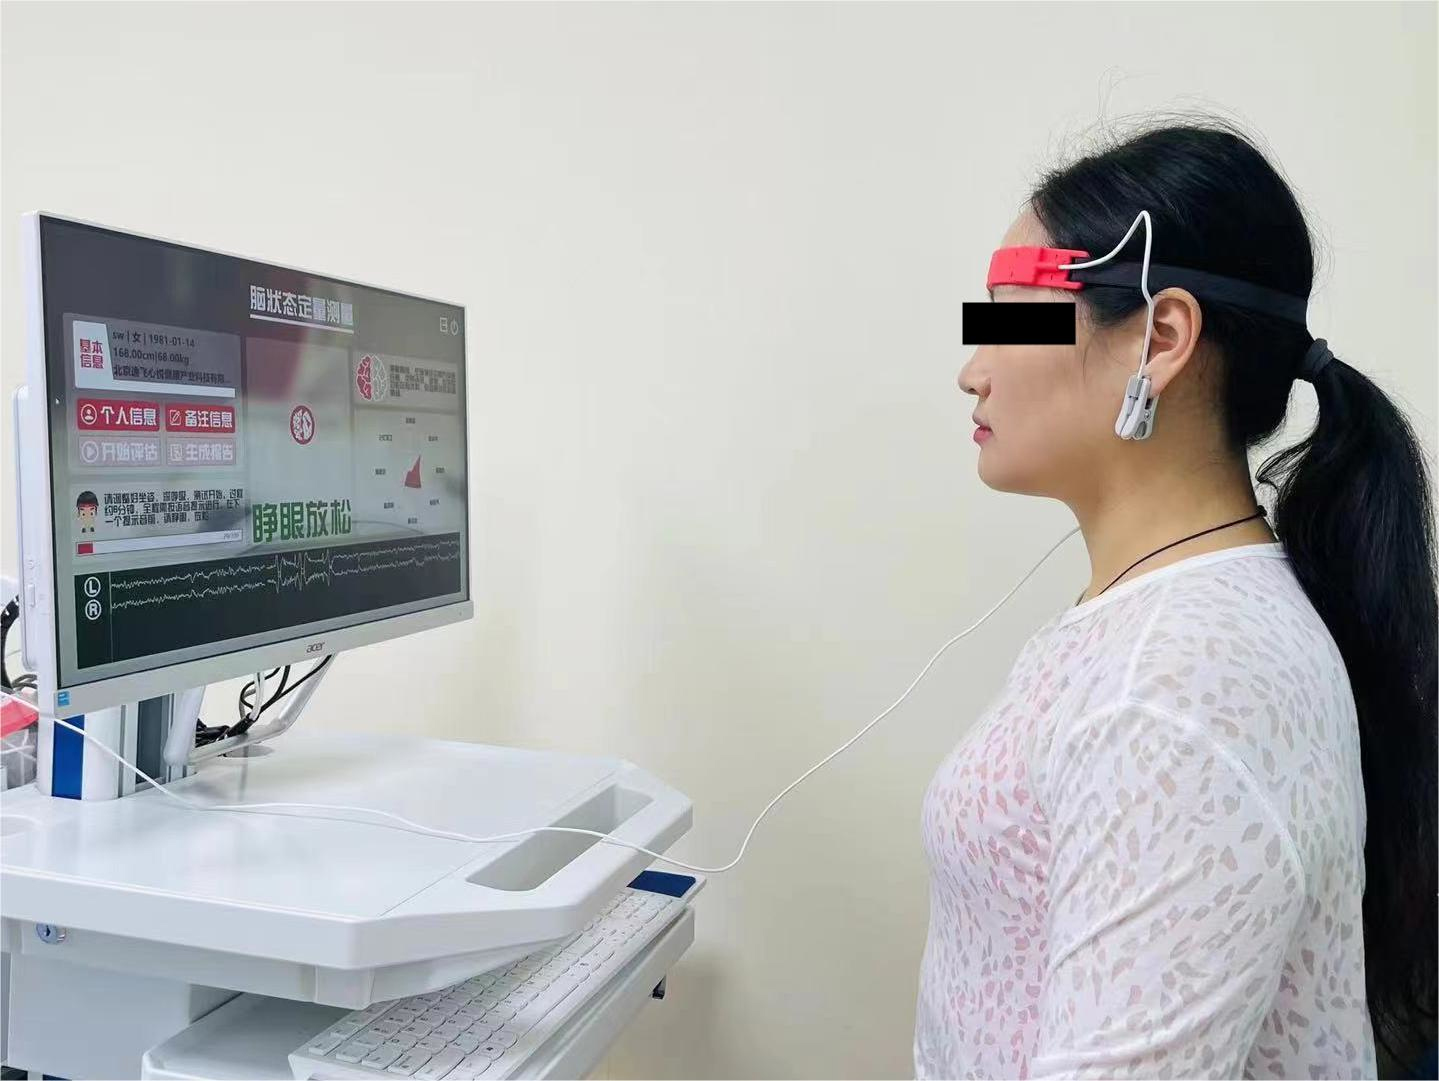 Fig. 1.
Method of wearing noninvasive electroencephalogram (EEG) electrodes.
A SPSS.25.0 statistical software (version 25.0, IBM Corp., Chicago, IL, USA) was
used for all statistical analyses. Independent samples t-test was
applied to analyze the differences in pelvic floor and brain function between
patients with vaginal delivery and cesarean section if the statistical test was
normally distributed; otherwise, the Wilcoxon signed-rank test was used. The
Shapiro–Wilk test was used to analyze the normality of the data. Categorical
variables such as the number of deliveries, the number of pregnancies, and the
severity of brain function were statistically analyzed by Chi-square test, the
Fisher exact test method was used if a single
category count was less than 1. Spearman’s rank correlation was also used for
correlation analysis between brain function, pelvic floor, and weight
variable. The statistical values r
Of the 88 postpartum women included in this study, 40 (45.45%) and 48 (54.55%) underwent vaginal delivery and cesarean section, respectively, and trial delivery failed in 18 (20.40%) women with cesarean section. 67 (76.10%) were primipara, and 4 (4.55%) delivered prematurely. The minimum age of the participants was 24 years and the maximum was 49 years; the minimum body mass index (BMI) was 14.95 kg/m2 and the maximum was 29.62 kg/m2 (Tables 1,2).
| Variable | Min, Max | Mean | |
| Age (years) | 24, 49 | 32.82 | |
| Height (cm) | 148, 172 | 159.84 | |
| Weight (kg) | 35, 76 | 55.93 | |
| BMI (kg/m2) | 14.95, 29.62 | 21.86 | |
| Postpartum time | 603, 9585 | 4260.57 | |
| 45, 150 | 74.62 | ||
| Variable | Quantity | Percent | |
| The way of delivery | Vaginal delivery | 40 | 45.45 |
| Cesarean section | 48 | 54.55 | |
| Number of pregnancies | 1 | 45 | 51.10 |
| 2 | 24 | 27.30 | |
| 19 | 21.60 | ||
| Number of deliveries | 1 | 67 | 76.10 |
| 2 | 21 | 23.90 | |
| Premature delivery | Yes | 4 | 4.55 |
| No | 84 | 95.45 | |
BMI, body mass index; SD, standard deviation; Min, minimum; Max, maximum.
| Variable | Vaginal delivery (n = 40) | Cesarean section (n = 48) | t/χ2 | p | |
| Age (years) | 32.40 |
33.17 |
0.796 | 0.428 | |
| Height (cm) | 160.90 |
159.00 |
1.854 | 0.067 | |
| Weight (kg) | 57.08 |
54.97 |
1.274 | 0.206 | |
| BMI (kg/m2) | 22.01 |
21.74 |
0.456 | 0.649 | |
| Number of pregnancies | 1 | 19 | 26 | 1.010 | 0.603 |
| 2 | 13 | 11 | |||
| 8 | 11 | ||||
| Number of deliveries | 1 | 28 | 39 | 1.520 | 0.218 |
| 2 | 12 | 9 | |||
POP-Q examination results showed that statistically significant differences were observed between postpartum women with vaginal delivery and cesarean section in the variables of Aa, Ba, Ap, Bp, genital hiatus, and total vaginal length; however, no statistical difference was noted in the assessment of prolapse. No significant difference in the results of muscle strength assessment was noted between the two groups with different modes of delivery (Table 3).
| Variables | Vaginal delivery (n = 40) | Cesarean section (n = 48) | Z/t/χ2 | p | |
| Anterior wall Aa | –0.82 |
–1.17 |
4.278 | ||
| Anterior wall Ba | –0.80 |
–1.21 |
4.260 | ||
| Posterior wall Ap | –1.82 |
–1.98 |
2.696 | 0.007 | |
| Posterior wall Bp | –1.81 |
–2.01 |
3.024 | 0.003 | |
| Genital hiatus | 3.28 |
2.71 |
4.027 | ||
| Perineal body | 3.55 |
3.44 |
1.034 | 0.301 | |
| Cervix or cuff | –4.48 |
–4.45 |
0.212 | 0.833 | |
| Posterior fornix | (–5.90, –5.20) | (–5.98, –5.20) | –0.423 | 0.672 | |
| Total vaginal length | 7.65 |
7.52 |
2.054 | 0.040 | |
| Class I muscle strength | 0 | 1 | 5 | 2.158 | 0.340 |
| I | 32 | 35 | |||
| II | 7 | 8 | |||
| Class II muscle strength | 0 | 1 | 6 | - | 0.364 |
| I | 26 | 23 | |||
| II | 13 | 18 | |||
| III | 0 | 1 | |||
| Anterior wall prolapse | Normal | 5 | 8 | 5.651 | 0.071 |
| I | 10 | 22 | |||
| II | 25 | 18 | |||
| Posterior wall prolapse | Normal | 17 | 12 | 3.126 | 0.210 |
| I | 22 | 35 | |||
| II | 1 | 1 | |||
Brain function assessment of the 88 postpartum women revealed that
| Variables n (%) | Groups | Normal | Mild | Moderate | Severe | χ2 | p |
|---|---|---|---|---|---|---|---|
| Hypoxia index | All (n = 88) | 29 (33.0) | 48 (54.5) | 11 (12.5) | 0 | ||
| Vaginal delivery (n = 40) | 14 (35.0) | 20 (50.0) | 6 (15.0) | 0 | 0.738 | 0.692 | |
| Cesarean section (n = 48) | 15 (31.3) | 28 (58.3) | 5 (10.4) | 0 | |||
| Emotional resistance | All (n = 88) | 36 (40.9) | 13 (14.8) | 33 (37.5) | 6 (6.8) | ||
| Vaginal delivery (n = 40) | 16 (40.0) | 5 (12.5) | 16 (40.0) | 3 (7.5) | 0.443 | 0.931 | |
| Cesarean section (n = 48) | 20 (41.7) | 8 (16.7) | 17 (35.4) | 3 (6.3) | |||
| Anxiety tendency | All (n = 88) | 63 (71.6) | 11 (12.5) | 11 (12.5) | 3 (3.4) | ||
| Vaginal delivery (n = 40) | 27 (67.5) | 5 (12.5) | 7 (17.5) | 1 (2.5) | 1.816 | 0.611 | |
| Cesarean section (n = 48) | 36 (75.0) | 6 (12.5) | 4 (8.3) | 2 (4.2) | |||
| Depressive tendency | All (n = 88) | 69 (78.4) | 15 (17.0) | 4 (4.5) | 0 | ||
| Vaginal delivery (n = 40) | 32 (80.0) | 5 (12.5) | 3 (7.5) | 0 | 2.321 | 0.313 | |
| Cesarean section (n = 48) | 37 (77.1) | 10 (20.8) | 1 (2.1) | 0 | |||
| Sleep index | All (n = 88) | 31 (35.2) | 26 (29.5) | 20 (22.7) | 11 (12.5) | ||
| Vaginal delivery (n = 40) | 18 (45.0) | 9 (22.5) | 9 (22.5) | 4 (10.0) | 3.589 | 0.309 | |
| Cesarean section (n = 48) | 13 (27.1) | 17 (35.4) | 11 (22.9) | 7 (14.6) | |||
| Introverted brain | All (n = 88) | 44 (50.0) | 25 (28.4) | 18 (20.5) | 1 (1.1) | ||
| Vaginal delivery (n = 40) | 18 (45.0) | 10 (25.0) | 11 (27.5) | 1 (2.5) | - | 0.297 | |
| Cesarean section (n = 48) | 26 (54.2) | 15 (31.3) | 7 (14.6) | 0 | |||
| Brain inhibition | All (n = 88) | 52 (59.1) | 26 (29.5) | 7 (8.0) | 3 (3.4) | ||
| Vaginal delivery (n = 40) | 25 (62.5) | 10 (25.0) | 4 (10.0) | 1 (2.5) | 1.221 | 0.748 | |
| Cesarean section (n = 48) | 27 (56.3) | 16 (33.3) | 3 (6.3) | 2 (4.2) | |||
| Brain stability | All (n = 88) | 48 (54.5) | 21 (23.9) | 15 (17.0) | 4 (4.5) | ||
| Vaginal delivery (n = 40) | 21 (52.5) | 13 (32.5) | 4 (10.0) | 2 (5.0) | 4.517 | 0.211 | |
| Cesarean section (n = 48) | 27 (56.3) | 8 (16.7) | 11 (22.9) | 2 (4.2) | |||
| Brain coordination | All (n = 88) | 82 (93.2) | 6 (6.8) | 0 | 0 | ||
| Vaginal delivery (n = 40) | 38 (95.0) | 2 (5.0) | 0 | 0 | 0.037 | 0.847 | |
| Cesarean section (n = 48) | 44 (91.7) | 4 (8.3) | 0 | 0 | |||
| Memory processing | All (n = 88) | 51 (58.0) | 19 (21.6) | 10 (11.4) | 8 (9.1) | ||
| Vaginal delivery (n = 40) | 23 (57.5) | 9 (22.5) | 3 (7.5) | 5 (12.5) | 1.932 | 0.587 | |
| Cesarean section (n = 48) | 28 (58.3) | 10 (20.8) | 7 (14.6) | 3 (6.3) | |||
| Outside focus | All (n = 88) | 30 (34.1) | 22 (25.0) | 26 (29.5) | 10 (11.4) | ||
| Vaginal delivery (n = 40) | 13 (32.5) | 7 (17.5) | 17 (42.5) | 3 (7.5) | 6.833 | 0.077 | |
| Cesarean section (n = 48) | 17 (35.4) | 15 (31.3) | 9 (18.8) | 7 (14.6) | |||
| Inner focus | All (n = 88) | 51 (58.0) | 24 (27.3) | 8 (9.1) | 5 (5.7) | ||
| Vaginal delivery (n = 40) | 25 (62.5) | 9 (22.5) | 5 (12.5) | 1 (2.5) | 3.118 | 0.374 | |
| Cesarean section (n = 48) | 26 (54.2) | 15 (31.3) | 3 (6.3) | 4 (8.3) | |||
| Brain fatigue | All (n = 88) | 24 (27.3) | 42 (47.7) | 15 (17.0) | 7 (8.0) | ||
| Vaginal delivery (n = 40) | 6 (15.0) | 16 (40.0) | 12 (30.0) | 6 (15.0) | 16.764 | 0.001 | |
| Cesarean section (n = 48) | 18 (37.5) | 26 (54.2) | 3 (6.3) | 1 (2.1) | |||
| Brain emptying | All (n = 88) | 41 (46.6) | 33 (37.5) | 3 (3.4) | 11 (12.5) | ||
| Vaginal delivery (n = 40) | 17 (42.5) | 18 (45.0) | 2 (5.0) | 3 (7.5) | 3.375 | 0.337 | |
| Cesarean section (n = 48) | 24 (50.0) | 15 (31.3) | 1 (2.1) | 8 (16.7) | |||
| Reaction speed | All (n = 88) | 39 (44.3) | 30 (34.1) | 15 (17.0) | 4 (4.5) | ||
| Vaginal delivery (n = 40) | 18 (45.0) | 11 (27.5) | 9 (22.5) | 2 (5.0) | 2.255 | 0.521 | |
| Cesarean section (n = 48) | 21 (43.8) | 19 (39.6) | 6 (12.5) | 2 (4.2) |
| Variables M (IQR); |
Vaginal delivery (n = 40) | Cesarean section (n = 48) | Z/t | p |
| Hypoxia index | (19.25, 28) | (18.25, 28.75) | –0.285 | 0.775 |
| Emotional resistance | (8.25, 35.75) | (6, 30.75) | –1.137 | 0.256 |
| Anxiety tendency | (6, 32.5) | (6, 20.5) | –1.028 | 0.304 |
| Depressive tendency | (31.25, 48.75) | (24, 48.75) | –1.136 | 0.256 |
| Sleep index | (68.25, 80.75) | (67.25, 76.75) | –1.817 | 0.069 |
| Introverted brain | 39.05 |
40.31 |
0.548 | 0.585 |
| Brain inhibition | (44.25, 60) | (43.5, 61) | –0.310 | 0.756 |
| Brain stability | 49.40 |
51.98 |
1.340 | 0.184 |
| Brain coordination | (93, 96.75) | (93, 96) | –1.267 | 0.205 |
| Memory processing | (3, 7) | (3, 11) | –0.218 | 0.827 |
| Outside focus | 18.98 |
17.67 |
0.736 | 0.464 |
| Inner focus | (8, 22.25) | (9, 26) | –1.385 | 0.166 |
| Brain fatigue | (27, 49) | (15, 31) | –3.794 | |
| Brain emptying | 45.40 |
60.38 |
3.200 | 0.002 |
| Reaction speed | (6, 19.75) | (8, 18.75) | –0.327 | 0.743 |
M (IQR), median (interquartile);
The correlation between brain function variables and pelvic floor examination
indicators was analyzed, and the results showed that anterior wall prolapse
was weakly correlated with anxiety tendency
(p = 0.05), and posterior wall prolapse was weakly associated with sleep
index (p = 0.02), introverted brain (p = 0.05), brain fatigue
(p = 0.02),
and had a better positively
correlated with brain emptying (r = 0.37, p
| Variables | Aa | Ba | Ap | Bp | GH | PB | C | D | TVL | MS-C I | MS-C II | AWP | PWP | |
| HI | rs | 0.03 | 0.06 | 0.11 | 0.12 | 0.08 | 0.08 | –0.13 | 0.05 | –0.17 | –0.01 | 0.06 | 0.09 | –0.00 |
| p | 0.81 | 0.56 | 0.33 | 0.26 | 0.47 | 0.46 | 0.24 | 0.66 | 0.11 | 0.92 | 0.58 | 0.41 | 0.97 | |
| ER | rs | 0.11 | 0.08 | –0.02 | –0.03 | 0.02 | –0.09 | –0.13 | –0.02 | 0.15 | –0.24 | –0.17 | 0.03 | –0.11 |
| p | 0.29 | 0.44 | 0.89 | 0.81 | 0.85 | 0.41 | 0.24 | 0.85 | 0.18 | 0.03 | 0.12 | 0.78 | 0.32 | |
| AT | rs | –0.07 | –0.10 | –0.09 | –0.11 | 0.16 | 0.04 | –0.14 | –0.02 | 0.12 | –0.02 | –0.15 | –0.21 | –0.10 |
| p | 0.53 | 0.34 | 0.41 | 0.33 | 0.15 | 0.69 | 0.19 | 0.84 | 0.25 | 0.86 | 0.20 | 0.05 | 0.37 | |
| DT | rs | 0.04 | 0.13 | 0.16 | 0.20 | 0.18 | –0.08 | 0.10 | 0.08 | 0.03 | 0.05 | 0.15 | –0.06 | 0.03 |
| p | 0.72 | 0.23 | 0.13 | 0.07 | 0.09 | 0.47 | 0.38 | 0.44 | 0.78 | 0.63 | 0.18 | 0.60 | 0.81 | |
| SI | rs | 0.16 | 0.21 | –0.12 | –0.10 | 0.11 | 0.12 | –0.02 | –0.11 | –0.04 | 0.07 | –0.05 | 0.10 | 0.25 |
| p | 0.15 | 0.05 | 0.26 | 0.34 | 0.32 | 0.26 | 0.89 | 0.30 | 0.71 | 0.54 | 0.68 | 0.38 | 0.02 | |
| IB | rs | 0.12 | 0.14 | 0.08 | 0.09 | 0.09 | 0.18 | 0.11 | –0.03 | –0.05 | 0.05 | –0.04 | 0.16 | 0.21 |
| p | 0.25 | 0.20 | 0.48 | 0.40 | 0.41 | 0.09 | 0.32 | 0.82 | 0.63 | 0.64 | 0.72 | 0.15 | 0.05 | |
| BI | rs | 0.00 | 0.04 | 0.07 | 0.09 | 0.03 | –0.13 | 0.00 | 0.02 | 0.01 | 0.08 | 0.23 | 0.01 | 0.12 |
| p | 1.00 | 0.75 | 0.53 | 0.43 | 0.77 | 0.22 | 1.00 | 0.87 | 0.90 | 0.51 | 0.04 | 0.90 | 0.27 | |
| BS | rs | –0.05 | –0.00 | –0.01 | 0.01 | –0.09 | –0.02 | –0.18 | –0.14 | 0.07 | 0.13 | 0.25 | 0.06 | 0.18 |
| p | 0.64 | 0.989 | 0.94 | 0.92 | 0.41 | 0.83 | 0.09 | 0.21 | 0.55 | 0.23 | 0.03 | 0.58 | 0.10 | |
| BC | rs | 0.11 | 0.13 | 0.21 | 0.22 | 0.13 | 0.06 | 0.29 | 0.15 | –0.06 | 0.07 | 0.03 | 0.09 | 0.08 |
| p | 0.31 | 0.24 | 0.05 | 0.04 | 0.24 | 0.58 | 0.01 | 0.16 | 0.56 | 0.55 | 0.81 | 0.41 | 0.45 | |
| MP | rs | 0.10 | 0.12 | 0.13 | 0.14 | 0.11 | 0.24 | 0.18 | 0.07 | –0.01 | –0.01 | –0.08 | 0.09 | 0.11 |
| p | 0.37 | 0.27 | 0.23 | 0.19 | 0.30 | 0.03 | 0.09 | 0.55 | 0.90 | 0.95 | 0.50 | 0.43 | 0.30 | |
| OF | rs | –0.06 | –0.12 | 0.10 | 0.07 | 0.04 | 0.05 | 0.01 | 0.03 | 0.13 | 0.03 | –0.11 | –0.10 | –0.08 |
| p | 0.61 | 0.26 | 0.36 | 0.49 | 0.68 | 0.62 | 0.97 | 0.81 | 0.24 | 0.78 | 0.33 | 0.23 | 0.47 | |
| IF | rs | –0.14 | –0.13 | –0.14 | –0.14 | –0.03 | –0.20 | –0.26 | –0.12 | 0.03 | 0.07 | 0.15 | –0.02 | 0.01 |
| p | 0.19 | 0.23 | 0.20 | 0.21 | 0.80 | 0.06 | 0.02 | 0.25 | 0.77 | 0.55 | 0.17 | 0.84 | 1.00 | |
| BF | rs | 0.05 | 0.08 | 0.07 | 0.08 | 0.20 | –0.09 | –0.07 | 0.07 | 0.20 | 0.03 | 0.09 | –0.06 | –0.24 |
| p | 0.63 | 0.48 | 0.54 | 0.48 | 0.07 | 0.43 | 0.51 | 0.53 | 0.07 | 0.78 | 0.45 | 0.56 | 0.02 | |
| BE | rs | –0.05 | –0.04 | –0.04 | –0.04 | 0.02 | 0.03 | 0.03 | 0.00 | 0.08 | –0.01 | –0.02 | –0.05 | 0.37 |
| p | 0.63 | 0.71 | 0.69 | 0.72 | 0.84 | 0.78 | 0.81 | 1.00 | 0.44 | 0.90 | 0.85 | 0.63 | ||
| RS | rs | –0.02 | –0.01 | –0.07 | –0.07 | 0.00 | 0.22 | 0.25 | 0.13 | 0.05 | –0.14 | –0.06 | 0.01 | 0.10 |
| p | 0.86 | 0.95 | 0.52 | 0.54 | 0.99 | 0.04 | 0.02 | 0.22 | 0.67 | 0.22 | 0.62 | 0.90 | 0.37 |
HI, hypoxia index; ER, emotional resistance; AT, anxiety tendency; DT, depressive tendency; SI, sleep index; IB, introverted brain; BI, brain inhibition; BS, brain stability; BC, brain coordination; MP, memory processing; OF, outside focus; IF, inner focus; BF, brain fatigue; BE, brain emptying; RS, reaction speed; Aa, anterior wall Aa; Ba, anterior wall Ba; Ap, posterior wall Ap; Bp, posterior wall Bp; GH, genital hiatus; PB, perineal body; C, point C; D, point D; TVL, total vaginal length; MS-C I, class I muscle strength; MS-C II, class II muscle strength; AWP, anterior wall prolapse; PWP, posterior wall prolapse.
The results of data analysis between brain function and the variables during pregnancy showed no statistically significant correlation between brain function and occupation as well as between labor intensity and exercise frequency during pregnancy. However, weight gain during pregnancy was related to oxygen deficiency index (p = 0.04), brain stability (p = 0.03), brain coordination (p = 0.01), brain emptying (p = 0.04), and reaction speed (p = 0.01), inner focus (p = 0.001), with statistically significant, although the r-value was weak; neonatal weight was related to brain fatigue weakly (p = 0.02); and BMI at maternal visit was related to introverted brain weakly (p = 0.03) (Table 7).
| Variables | O | LI | EF | WGP | NW | BMI | |
| HI | rs | –0.03 | –0.08 | 0.02 | –0.22 | 0.16 | 0.05 |
| p | 0.76 | 0.49 | 0.89 | 0.04 | 0.13 | 0.63 | |
| ER | rs | 0.02 | –0.07 | 0.01 | –0.04 | 0.06 | 0.02 |
| p | 0.89 | 0.54 | 0.94 | 0.74 | 0.56 | 0.83 | |
| AT | rs | –0.04 | 0.00 | –0.09 | –0.04 | –0.06 | 0.00 |
| p | 0.71 | 0.97 | 0.42 | 0.71 | 0.59 | 0.98 | |
| DT | rs | 0.03 | –0.05 | 0.02 | 0.21 | 0.01 | –0.01 |
| p | 0.77 | 0.62 | 0.88 | 0.05 | 0.90 | 0.91 | |
| SI | rs | –0.07 | 0.03 | –0.05 | –0.04 | 0.03 | 0.21 |
| p | 0.54 | 0.77 | 0.62 | 0.71 | 0.77 | 0.06 | |
| IB | rs | –0.00 | 0.08 | –0.03 | 0.06 | 0.10 | 0.2 |
| p | 0.97 | 0.45 | 0.81 | 0.59 | 0.33 | 0.03 | |
| BI | rs | 0.04 | 0.05 | 0.07 | –0.1 | 0.08 | 0.01 |
| p | 0.71 | 0.68 | 0.50 | 0.37 | 0.46 | 0.94 | |
| BS | rs | –0.00 | –0.02 | 0.03 | –0.23 | 0.11 | 0.04 |
| p | 0.99 | 0.84 | 0.80 | 0.03 | 0.30 | 0.68 | |
| BC | rs | –0.10 | –0.01 | –0.06 | 0.27 | 0.07 | –0.07 |
| p | 0.34 | 0.93 | 0.55 | 0.01 | 0.52 | 0.51 | |
| MP | rs | 0.07 | –0.08 | –0.09 | 0.17 | –0.01 | 0.19 |
| p | 0.54 | 0.44 | 0.39 | 0.11 | 0.93 | 0.08 | |
| OF | rs | 0.04 | 0.15 | 0.20 | 0.10 | –0.03 | –0.11 |
| p | 0.71 | 0.16 | 0.06 | 0.37 | 0.76 | 0.30 | |
| IF | rs | 0.07 | 0.05 | –0.04 | –0.33 | –0.01 | –0.12 |
| p | 0.54 | 0.65 | 0.75 | 0.001 | 0.90 | 0.28 | |
| BF | rs | –0.11 | 0.16 | 0.03 | –0.00 | –0.24 | –0.06 |
| p | 0.31 | 0.14 | 0.77 | 0.99 | 0.02 | 0.57 | |
| BE | rs | 0.02 | –0.08 | 0.05 | –0.22 | 0.09 | –0.03 |
| p | 0.86 | 0.44 | 0.64 | 0.04 | 0.40 | 0.81 | |
| RS | rs | –0.14 | –0.10 | –0.04 | 0.26 | –0.14 | 0.12 |
| p | 0.19 | 0.35 | 0.72 | 0.01 | 0.19 | 0.29 |
HI, hypoxia index; ER, emotional resistance; AT, anxiety tendency; DT, depressive tendency; SI, sleep index; IB, introverted brain; BI, brain inhibition; BS, brain stability; BC, brain coordination; MP, memory processing; OF, outside focus; IF, inner focus; BF, brain fatigue; BE, brain emptying; RS, reaction speed; O, occupation; LI, labor intensity; EF, exercise frequency; WGP, weight gain during pregnancy; NW, newborn weight; BMI, body mass index.
Postpartum women show memory, cognitive, or other neurological/psychiatric
problems related to brain function, and these brain function changes are affected
by injuries during pregnancy and childbirth. The study
results showed that in the brain function
assessment of the 88 postpartum women,
The pelvic floor analysis with different delivery methods showed statistically significant difference, which was consistent with the clinical characteristics of vaginal and cesarean delivery. Brain function analysis showed that vaginal delivery had more severe cerebral fatigue than cesarean section. There was evidence that postpartum fatigue in vaginal delivery may be related to parity, epidural analgesia, perineal trauma, perineal pain, and longer second stage of labor [25]. Moreover, the study has shown that women who have undergone cesarean section have higher postpartum fatigue scores than those who have undergone vaginal delivery, and the higher the postpartum fatigue score, the more difficult the infant care activities [26]. However, these findings remain controversial.
Most postpartum women may have pelvic floor function problems, and accurate research results on whether the pelvic floor affects brain function are lacking. In this study, we analyzed the correlation between brain function and pelvic floor indicators for the first time, and showed that vaginal prolapse was weakly associated with several brain function indicators, including brain fatigue, sleep and anxiety, sensitivity to external disturbances, and slightly better associated with brain emptying ability (the ability to remove distracting thoughts). The discomfort of vaginal prolapse, the impact of female sexual function, stress urinary incontinence, or the fear of vaginal prolapse can all cause psychological and physical burden to the mother [27, 28, 29], and the brain function test in this study was also mostly manifested in mood, sleep, and fatigue. The pelvic floor muscle strength was slightly related to brain stability, brain active relaxation, and control ability, which may be related to the pelvic floor muscle involvement in the respiratory system, thereby affecting brain function [8, 30, 31]. Additionally, the present study observed that the perineal body and cervix or cuff (point C) were slightly related to brain memory processing, reaction speed, internal concentration, and brain coordination, suggesting that they can affect learning ability and the ability of various brain regions to coordinate work. Although the correlation was weakly, and to determine the interaction between the brain and pelvic floor function, further research will be needed.
As research on obesity has deepened, its effects on the brain have also been revealed. The effects of obesity and diet on brain structure and function have been proven, such as affecting brain cognitive function [32, 33]. With studies showing significant neuroplasticity in the female brain during pregnancy and the postpartum period [25, 34]. In the analysis of the correlation between maternal weight and exercise during pregnancy and postpartum brain function, we observed that pregnancy weight gain has the most obvious relationship with postpartum brain function, which mainly affects cerebral oxygen metabolism demand, oxygen utilization, brain stability and coordination, reaction speed, and brain emptying ability, the analysis suggests that pregnancy weight gain might also affects postpartum brain function. Therefore, the brain function status of this special group of women may be more susceptible to gestational weight gain/obesity influences; however, this conclusion still requires further clinical validation.
This study was in a stage of preliminary exploration, and the results still uncertain. Although there had a correlation between brain function and pelvic floor, the correlation was weak. Future prospective clinical studies will be conducted based on specific brain function directions.
This retrospective study showed that most postpartum women have brain function problems, including mood, sleep, fatigue, cerebral oxygen metabolism, concentration, and information processing ability. Moreover, some brain function indicators might have correlation with pelvic floor function, pregnancy weight gain. However, more brain function problems of postpartum women should be verified and discovered in follow-up studies.
We confirm that the data supporting the findings of this study are available within the article. The datasets used and analyzed during the current study are available from the corresponding author on reasonable request.
YC and WS designed the research study. YC and XY performed the research. XY and CL provided help and advice on the data collection and screening. YC analyzed the data. All authors contributed to editorial changes in the manuscript. All authors read and approved the final manuscript. All authors have participated sufficiently in the work and agreed to be accountable for all aspects of the work.
This study was formally approved by the ethics committee of West China Second Hospital of Sichuan University, the ethics approval number is 2023(176) in 2023.07.13. Due to the retrospective nature of the study, we submitted a request for exemption of informed consent to the Ethics Committee, the need to obtain informed consent was waived by the ethics committee of West China Second Hospital of Sichuan University.
Thanks to the collective efforts of the medical staff for the medical record data in the Obstetrics and Gynecology Rehabilitation Section of West China Second Hospital of Sichuan University.
This study was supported by the foundation of Science and Technology Department of Sichuan Province (2023JDKP0061).
The authors declare no conflict of interest.
Supplementary material associated with this article can be found, in the online version, at https://doi.org/10.31083/j.ceog5111249.
References
Publisher’s Note: IMR Press stays neutral with regard to jurisdictional claims in published maps and institutional affiliations.