


 , Min Ou 1, Xueyan Wang 1
1 Department of Medical Genetics and Prenatal Diagnosis, Sichuan Provincial Maternity and Child Health Care Hospital, 610045 Chengdu, Sichuan, China
Abstract
To enhance the efficacy of maternal serum screening (MSS), we conducted an analysis to examine the correlation between certain factors identified during second-trimester screening (STS) and fetal chromosomal abnormalities, excluding the common trisomies (trisomies 13, 18, and 21). Additionally, specific risk factor ranges were established for each category.
A retrospective 1:3 matched case-control study was conducted. Case data were obtained from 311 STS samples of fetal chromosomal abnormalities other than common trisomies, with testing performed in the Prenatal Diagnosis Center of the Maternal and Child Health Care Hospital of Sichuan Province in China between 6 January 2013 and 12 April 2023. A total of 933 controls were matched accordingly. Univariate and multivariable conditional logistic regression analyses were implemented and sensitivity analysis was performed.
Multivariable logistic analyses revealed that the independent risk factors for fetal chromosomal abnormalities other than common trisomies were ultrasonographic structural abnormalities (odds ratio (OR) = 3.038; 95% confidence interval (CI), 1.774–5.202; p < 0.001); free β-human chorionic gonadotropin (free β-hCG) as multiples of the median (MoMs) of ≤0.34 (OR = 3.006; 95% CI, 1.803–5.013; p < 0.001), 2.82–3.53 (OR = 1.884; 95% CI, 1.321–2.688; p < 0.001), 3.54–4.67 (OR = 1.949; 95% CI, 1.300–2.923, p = 0.001), and ≥4.68 (OR = 1.730; 95% CI, 1.045–2.866; p = 0.033); and a trisomy 21 (T21) risk of 1/271–1/1000 (OR = 2.434; 95% CI, 1.706–3.472; p < 0.001), 1/101–1/270 (OR = 3.330; 95% CI, 2.300–4.821; p < 0.001), and ≥1/100 (OR = 3.441; 95% CI, 2.178–5.438; p < 0.001).
Ultrasonographic structural abnormalities, free β-hCG MoMs, and T21 risk were identified as independent risk factors for fetal chromosomal abnormalities (with the exception of common trisomies) in STS. Our findings thus provide data to support clinical decision-making.
Keywords
- second-trimester screening
- fetal chromosomal abnormalities
- soft markers
- structural abnormalities
- trisomy 21
- free β-hCG
Maternal serum screening (MSS) has been the most commonly applied technique for the screening of fetal aneuploidies for the last three decades [1], but it is increasingly being replaced by non-invasive prenatal testing (NIPT) [2]. Despite NIPT possessing a high detection rate and a low false-positive rate, many pregnant women in China are still likely to opt for MSS, as NIPT is not currently covered by health insurance in most areas [3]. However, MSS has the advantages of ease of operation and having a low cost, making it relatively easy to conduct in community hospitals. In addition, MSS includes both combined first-trimester screening (cFTS) and second-trimester screening (STS). STS in particular is more accessible than cFTS, as the latter requires a high-quality and time-consuming fetal nuchal thickness (NT) assessment [4]. As a result, STS remains the most widely adopted screening method at this time in many underdeveloped regions of China.
The main principle of STS is the assessment of the risk of trisomy 21 (T21),
trisomy 18 (T18), and open neural tube defects (ONTDs) by combining the
concentration of biomarkers with maternal age, gestational age, and weight, among
other factors [5]. These biomarkers typically include alpha fetoprotein (AFP),
free
The aim of this study was to explore the association between the serum profiles of STS and fetal chromosomal abnormalities other than common trisomies through the STS data of our center over the past decade. We also compartmentalized the meaningful indicators into different ranges. Univariate and multivariable logistic regression analyses were then conducted to determine the correlation between each range and fetal chromosomal abnormalities. We expect that our findings will portray a significant role in the interpretation of STS results and thus inspire clinicians to provide reasonable counseling.
In the present investigation, we implemented a matched case-control study design, with all samples sourced from the Prenatal Diagnosis Center of the Sichuan Provincial Maternity and Child Health Care Hospital (SPMCHCH), China. Our analysis was focused on second-trimester biochemical screening samples collected at SPMCHCH over the past decade. The inclusion criteria for this study encompassed pregnant women with gestational weeks falling between 15+0 and 20+6 weeks, as well as samples containing complete risk-assessment results. Conversely, the exclusion criteria comprised twin pregnancies, individuals who smoked, patients diagnosed with type 1 diabetes, and those undergoing in vitro fertilization (IVF) procedures. For the case group, the inclusion criteria were the presence of fetal chromosomal abnormalities other than common trisomies. For the control group, the inclusion criteria were the presence of normal chromosomes. The case and control groups were matched at a ratio of 1:3, based on the same screening strategy, and with test dates differing by no more than 3 days. Furthermore, the matching process considered the presence or absence of ultrasound findings. If ultrasound findings were present, cases were matched to controls with ultrasound findings. If ultrasound findings were absent, cases were matched to controls without ultrasound findings.
Clinicians gathered information on pregnant women before collecting blood samples, including details such as date of birth, ultrasonographic information, number of fetuses, maternal weight, last menstrual period, and pregnancy history. Blood samples were then taken from pregnant women at 15+0 to 20+6 weeks of gestational age. Venous blood was collected in vacuum-dried tubes (2–3 mL) and left at room temperature for 30–120 minutes. The serum was then separated by centrifugation at 3000 rpm for 10 minutes.
Two screening strategies were offered for pregnant women at our center: a dual
test (AFP and free
First, the concentrations of biochemical markers were transformed into multiples
of the median (MoMs) based on the median values for the same gestational age.
Second, the MoM values were corrected for maternal weight, mode of pregnancy,
some comorbidities, and smoking status. Third, the likelihood ratio of every
biochemical marker was calculated based on the heights of Gaussian distributions
in abnormal and normal pregnancies. Finally, the fetal chromosomal risks for T21
and T18 were determined using all of the likelihood ratios combined with the
maternal age risk. The entire process of risk calculation was performed using
PRsoft V2.0 software (Guangzhou Fenghua Bioengineering Co., Ltd., Guangzhou,
China); the results of the risk assessment were categorized as follows: high-risk
(T21
The methods for prenatal diagnostic testing included chromosome karyotype
analysis, fluorescence in situ hybridization (FISH), quantitative
fluorescence PCR (QF-PCR), chromosomal microarray analysis (CMA), and CNV-seq
detection. Pregnant women showing high-risk STS were typically advised to undergo
prenatal diagnostic testing through amniocentesis. Advanced maternal age was also
a factor that prompted recommendations for prenatal diagnostic testing. However,
some of those who were hesitant to undergo invasive procedures chose non-invasive
prenatal testing (NIPT). The recommendation for prenatal diagnosis would still be
made if NIPT indicates the presence of chromosomal abnormalities. Pregnant women
at intermediate risk were generally recommended to undergo NIPT. Furthermore,
pregnant women with elevated AFP MoMs (
All STS data were uploaded to the prenatal diagnosis information management system (PDIMS) for pregnancy outcome follow-up, with follow-up data including the presence of fetal chromosomal abnormalities and abnormal karyotypes. We emphasized that if a chromosomal abnormality was detected in a neonate after birth, it was also reported to this system, as all prenatal screening and diagnosis institutions in Sichuan Province must upload their data to the PDIMS as required by the provincial health administration. In addition, all data were completed for follow-up within one year postpartum. Since the PDIMS is a shared online management system for prenatal screening and diagnostic institutions in the province, we could obtain the follow-up results from any pregnant woman who underwent STS at our institution but did not receive prenatal diagnosis there. Furthermore, we obtained fetal imaging results from pregnant women through the PDIMS system.
Fetal ultrasound findings were obtained from PDIMS for the case and control groups, and categorized into normal, soft markers, and structural anomalies. According to an expert consensus [14] published by the Society for Maternal-Fetal Medicine (SMFM) 2021, we define “soft marker” as minor abnormalities on second-trimester ultrasound that are not “structural abnormalities”. Common “soft markers” are “Echogenic intracardiac focus”, “Echogenic bowel”, “Choroid plexus cyst”, “Single umbilical artery”, “Urinary tract dilation”, “Shortened humerus, femur, or both”, “Thickened nuchal fold” and “Absent or hypoplastic nasal bone”. We define fetal structural anomalies involve morphological changes in anatomical structures compared to normal, such as “Neural malformation”, “Cardiac malformation”, and “urogenital malformation”.
The 2.5th, 5th, 95th, 97.5th, and 99th percentile values for AFP MoMs and free
Enumeration data were expressed as frequencies and percentages. The Fisher
exact-probability test was used for univariate analysis, and the odds ratio (OR)
values were calculated at the same time. Variables that were p
We executed sensitivity analyses on the primary indicators of STS. The Wilcoxon rank-sum test was used for comparing the differences of various types of fetal chromosomal abnormalities with the control group for various indicators. The results of sensitivity analyses are shown as a bar graph.
Between 6 January 2013 and 12 April 2023, a total of 637,663 pregnant women underwent STS examination at our prenatal diagnosis center. Of these pregnancies, there were 627,481 singleton pregnancies that met our inclusion criteria, and we excluded 51,371 (8.2%) samples that were lost to follow-up. Reasons for loss to follow-up included incorrect telephone numbers, disconnected or unreachable numbers, or refusal to answer. Thus, 576,110 samples were obtained with fetal chromosomal follow-up results. Among these samples, there were 311 samples with chromosomal abnormalities other than common trisomies. These 311 samples were then considered as the case group. After case-control matching in a 1:3 ratio based on the identical screening strategy, with test dates differing by no more than 3 days, and the presence or absence of ultrasound findings, we identified a total number of 933 controls (Fig. 1).
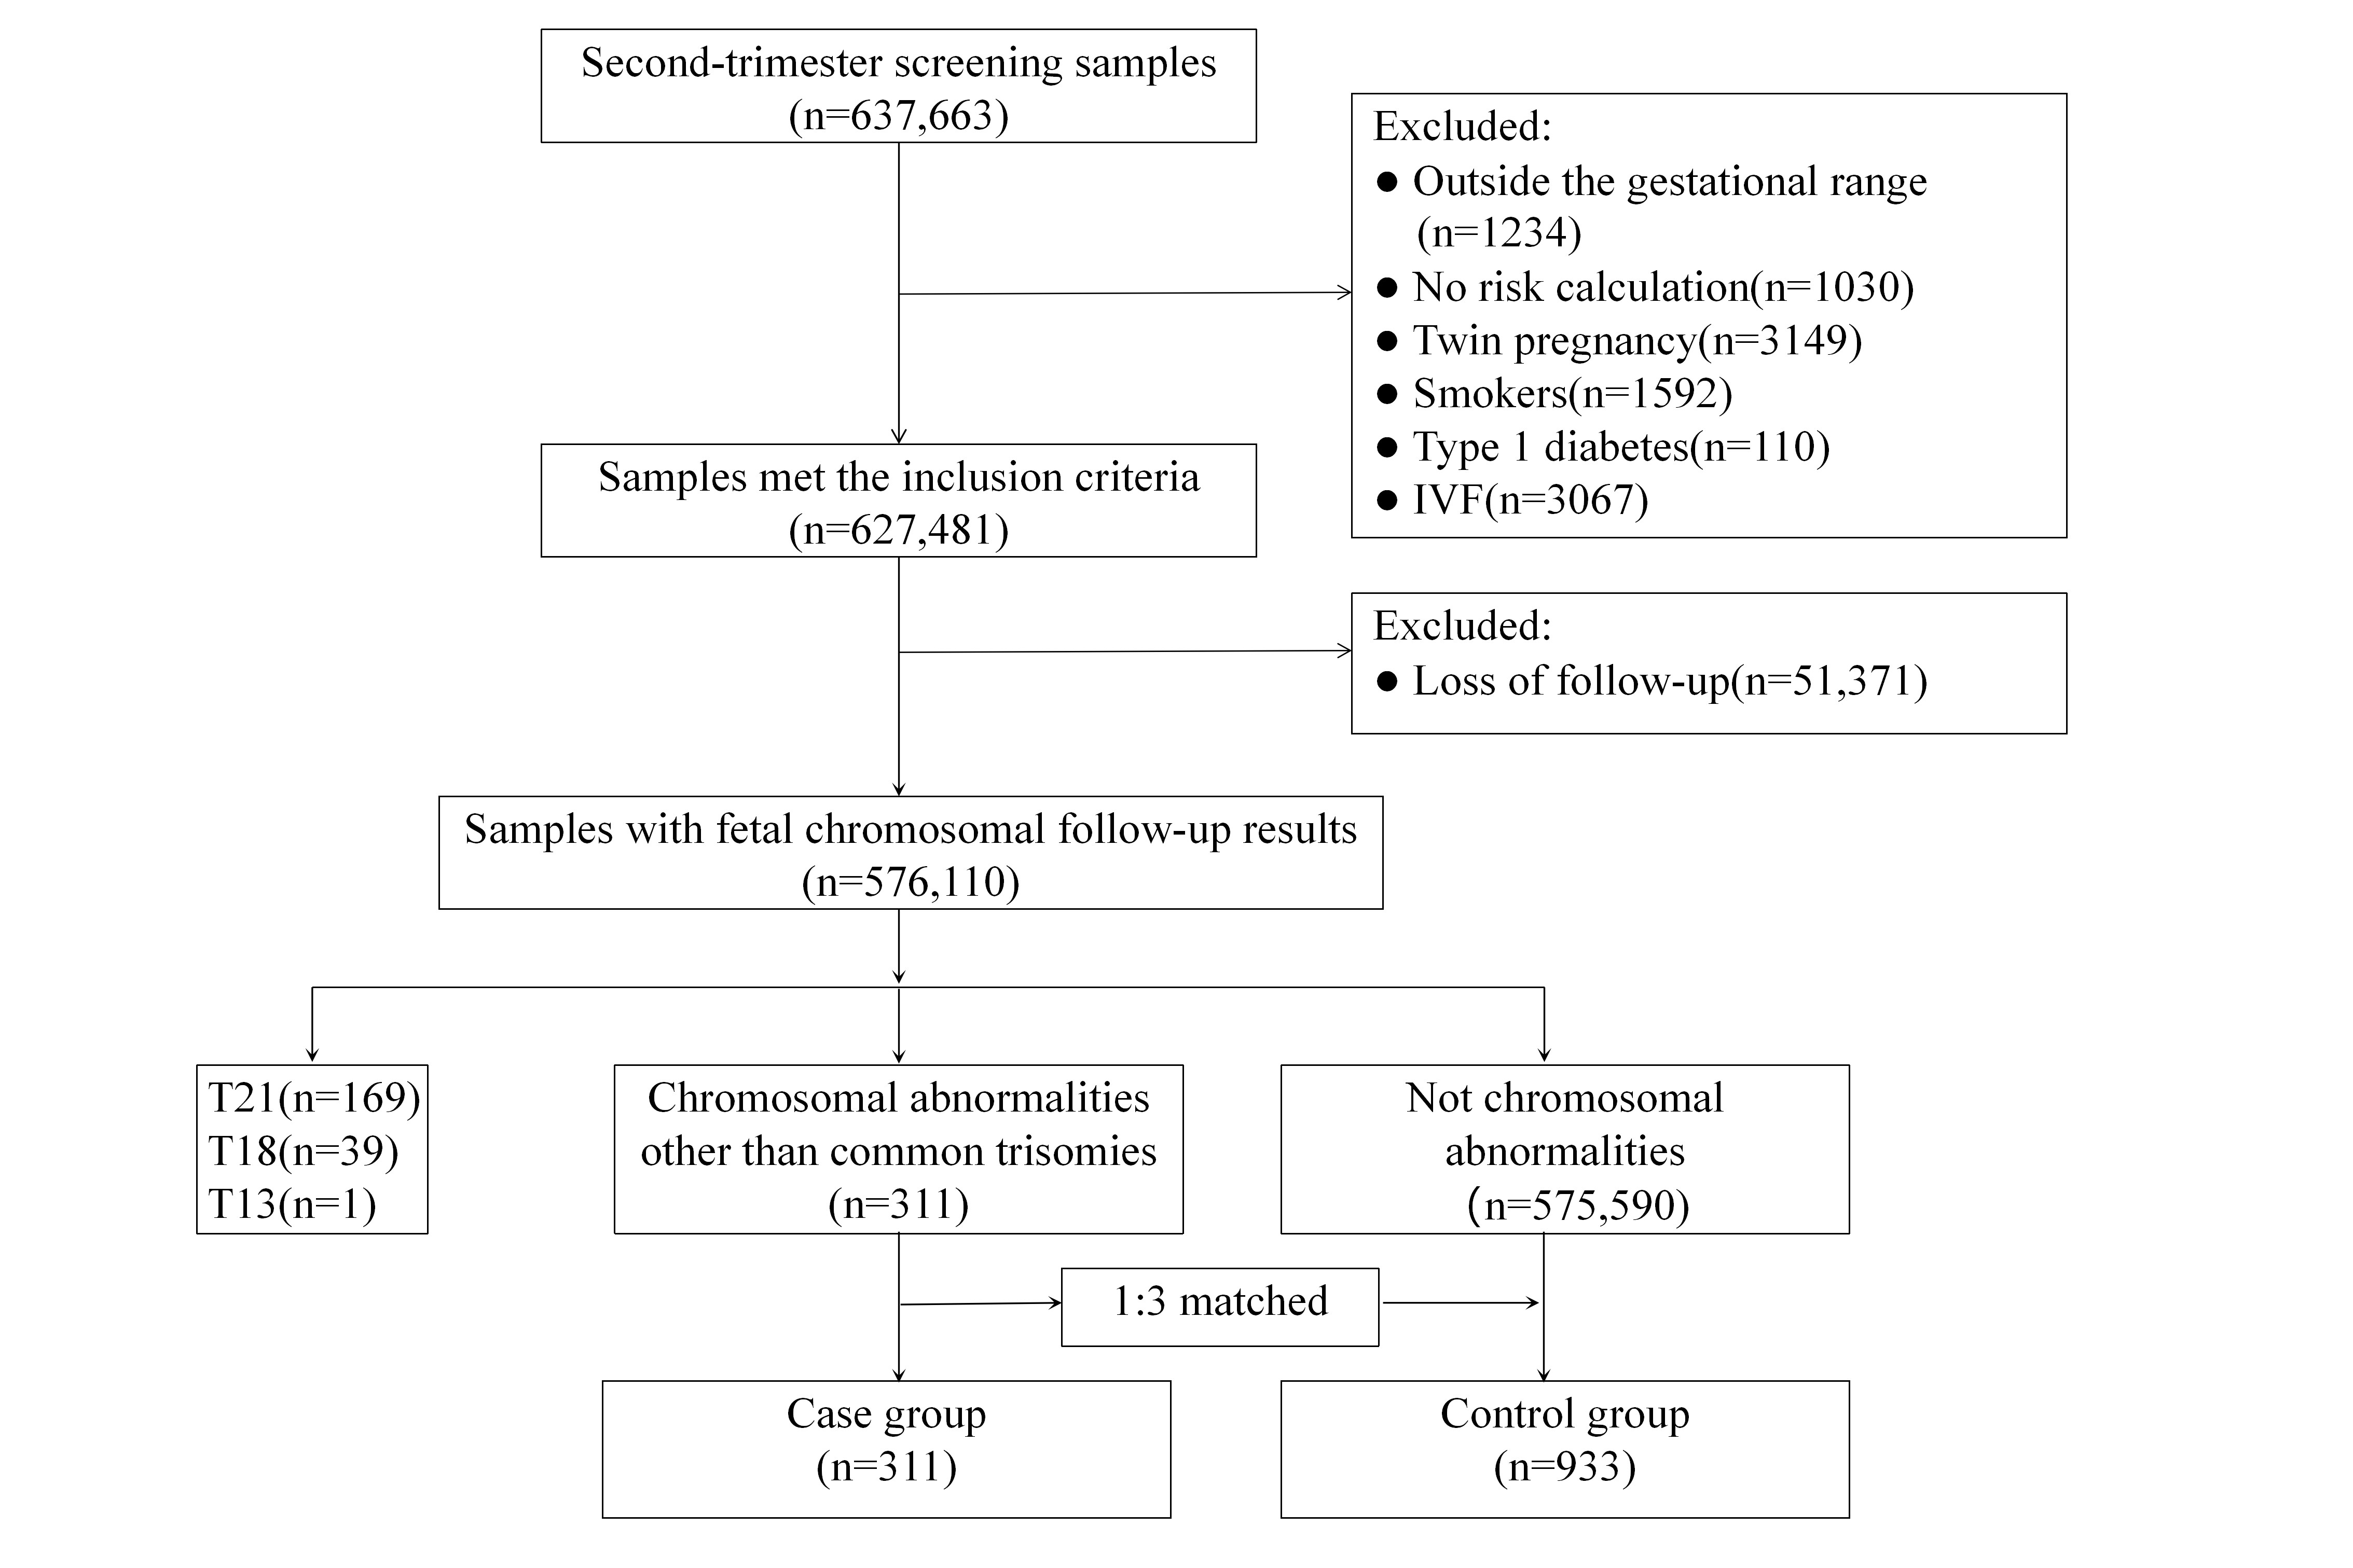 Fig. 1.
Flow chart of study sample selection. The range of gestational ages was between 15+0 and 20+6 weeks; T, trisomy; IVF, in vitro fertilization.
The data from the case group were classified into six main categories. They were rare autosomal trisomy, sex-chromosome abnormality, structural abnormality, mosaicism, pathogenic CNV, and karyotype unknown. Of these, mosaicisms comprised seven cases of T21 mosaicism and others. The two cases of rare autosomal trisomy were one with T20 and one with T17. The “karyotype unknown” indicated that due to the erroneous data entry, several samples in the PDIMS had incorrect follow-up information or irregular karyotype descriptions (Table 1).
| Fetal chromosomal abnormalities | n (%) |
| Rare autosomal trisomy | 2 (0.63) |
| Sex chromosome abnormality | 50 (16.08) |
| Structural abnormality | 64 (20.58) |
| Mosaicism | 57 (18.33) |
| Pathogenic CNV | 128 (41.16) |
| Karyotype unknown | 10 (3.22) |
| Total | 311 (100.00) |
CNV, copy number variation.
Adopting univariate analysis, we observed that the differences in the case group
were statistically significant (p
| Factors | Control group (n = 933) | Case group (n = 311) | x2 | p | OR (95% CI) | |
| Age of EDC, years, n (%) | 6.926 | 0.063 | ||||
| 675 (72.35) | 211 (67.85) | |||||
| 30–34 | 247 (26.47) | 90 (28.94) | 1.166 (0.875–1.553) | |||
| 35–39 | 9 (0.96) | 8 (2.57) | 2.844 (1.084–7.463) | |||
| 2 (0.21) | 2 (0.64) | 3.199 (0.448–22.850) | ||||
| Gestational age, days, n (%) | 5.391 | 0.141 | ||||
| 105–111* | 99 (10.61) | 32 (10.29) | ||||
| 112–118 | 373 (39.98) | 147 (47.27) | 1.219 (0.784–1.897) | |||
| 119–125 | 257 (27.55) | 76 (24.44) | 0.915 (0.570–1.469) | |||
| 126–146 | 204 (21.86) | 56 (18.01) | 0.849 (0.517–1.395) | |||
| Methodology for gestational age, n (%) | 0.450 | 0.823 | ||||
| Calculated with BPD* | 597 (63.99) | 195 (62.7) | ||||
| Calculated with CRL | 304 (32.58) | 107 (34.41) | 1.078 (0.820–1.416) | |||
| Calculated with LMP | 32 (3.43) | 9 (2.89) | 0.861 (0.404–1.836) | |||
| Ultrasonographic findings, n (%) | 16.353 | |||||
| Normal* | 298 (31.94) | 84 (27.01) | ||||
| Soft markers | 20 (2.14) | 10 (3.22) | 1.774 (0.800–3.935) | |||
| Structural abnormalities | 12 (1.29) | 16 (5.14) | 4.730 (2.154–10.388) | |||
| No results | 603 (64.63) | 201 (64.63) | 1.183 (0.885–1.580) | |||
| Maternal weight, kg, n (%) | 1.977 | 0.584 | ||||
| 206 (22.08) | 61 (19.61) | |||||
| 50.00–59.99 | 446 (47.80) | 163 (52.41) | 1.234 (0.881–1.729) | |||
| 60.00–69.99 | 213 (22.83) | 66 (21.22) | 1.046 (0.703–1.557) | |||
| 70.00–79.99 | 53 (5.68) | 16 (5.14) | 1.019 (0.544–1.910) | |||
| 15 (1.61) | 5 (1.61) | 1.126 (0.393–3.222) | ||||
| AFP MoM, n (%) | 8.508 | 0.070 | ||||
| 0.59–1.68* | 820 (87.89) | 258 (82.96) | ||||
| 38 (4.07) | 24 (7.72) | 2.007 (1.182–3.410) | ||||
| 0.53–0.58 | 25 (2.68) | 11 (3.54) | 1.398 (0.679–2.881) | |||
| 1.69–1.89 | 24 (2.57) | 6 (1.93) | 0.795 (0.321–1.965) | |||
| 26 (2.79) | 12 (3.86) | 1.467 (0.730–2.949) | ||||
| Free |
178.182 | |||||
| 0.42–2.81* | 824 (88.32) | 182 (58.52) | ||||
| 25 (2.68) | 17 (5.47) | 3.079 (1.629–5.820) | ||||
| 0.35–0.41 | 34 (3.64) | 2 (0.64) | 0.266 (0.063–1.119) | |||
| 2.82–3.53 | 28 (3.00) | 49 (15.76) | 7.923 (4.848–12.950) | |||
| 3.54–4.67 | 14 (1.50) | 35 (11.25) | 11.319 (5.967–21.471) | |||
| 8 (0.86) | 26 (8.36) | 14.714 (6.555–33.028) | ||||
| T21 risk, n (%) | 192.094 | |||||
| 554 (59.38) | 95 (30.55) | |||||
| 1/2001–1/3000 | 104 (11.15) | 15 (4.82) | 0.841 (0.469–1.507) | |||
| 1/1001–1/2000 | 117 (12.54) | 26 (8.36) | 1.296 (0.804–2.089) | |||
| 1/271–1/1000 | 94 (10.08) | 63 (20.26) | 3.908 (2.656–5.751) | |||
| 1/101–1/270 | 45 (4.82) | 67 (21.54) | 8.683 (5.614–13.427) | |||
| 19 (2.04) | 45 (14.47) | 13.812 (7.743–24.637) | ||||
| T18 risk, n (%) | 7.910 | 0.071 | ||||
| 906 (97.11) | 294 (94.53) | |||||
| 1/2001–1/3000 | 3 (0.32) | 2 (0.64) | 2.054 (0.342–12.355) | |||
| 1/1001–1/2000 | 11 (1.18) | 3 (0.96) | 0.840 (0.233–3.033) | |||
| 1/351–1/1000 | 7 (0.75) | 6 (1.93) | 2.641 (0.881–7.922) | |||
| 6 (0.64) | 6 (1.93) | 3.082 (0.986–9.628) | ||||
* indicates a control. Fisher’s Exact Test was used to compare the differences
between groups. Differences were considered statistically significant at
p
Multivariable conditional logistic regression analysis using a forward stepwise
procedure was performed for factors that were p
| Risk factors | Beta | Standard error | Wald | p | OR (95% CI) | |
| Ultrasound findings | 20.557 | |||||
| Soft markers | 0.619 | 0.337 | 3.372 | 0.066 | 1.856 (0.959–3.592) | |
| Structural abnormalities | 1.111 | 0.274 | 16.386 | 3.038 (1.774–5.202) | ||
| No results | 0.027 | 0.131 | 0.042 | 0.837 | 1.027 (0.795–1.328) | |
| Free |
36.579 | |||||
| 1.101 | 0.261 | 17.794 | 3.006 (1.803–5.013) | |||
| 0.35–0.41 | –0.862 | 0.713 | 1.460 | 0.227 | 0.422 (0.104–1.710) | |
| 2.82–3.53 | 0.634 | 0.181 | 12.213 | 1.884 (1.321–2.688) | ||
| 3.54–4.67 | 0.667 | 0.207 | 10.414 | 0.001 | 1.949 (1.300–2.923) | |
| 0.548 | 0.257 | 4.535 | 0.033 | 1.730 (1.045–2.866) | ||
| T21 risk | 54.181 | |||||
| 1/2001–1/3000 | –0.136 | 0.279 | 0.239 | 0.625 | 0.873 (0.506–1.506) | |
| 1/1001–1/2000 | 0.215 | 0.223 | 0.930 | 0.335 | 1.240 (0.801–1.921) | |
| 1/271–1/1000 | 0.890 | 0.181 | 24.093 | 2.434 (1.706–3.472) | ||
| 1/101–1/270 | 1.203 | 0.189 | 40.603 | 3.330 (2.300–4.821) | ||
| 1.236 | 0.233 | 28.034 | 3.441 (2.178–5.438) | |||
T, trisomy; MoM, multiple of the median;
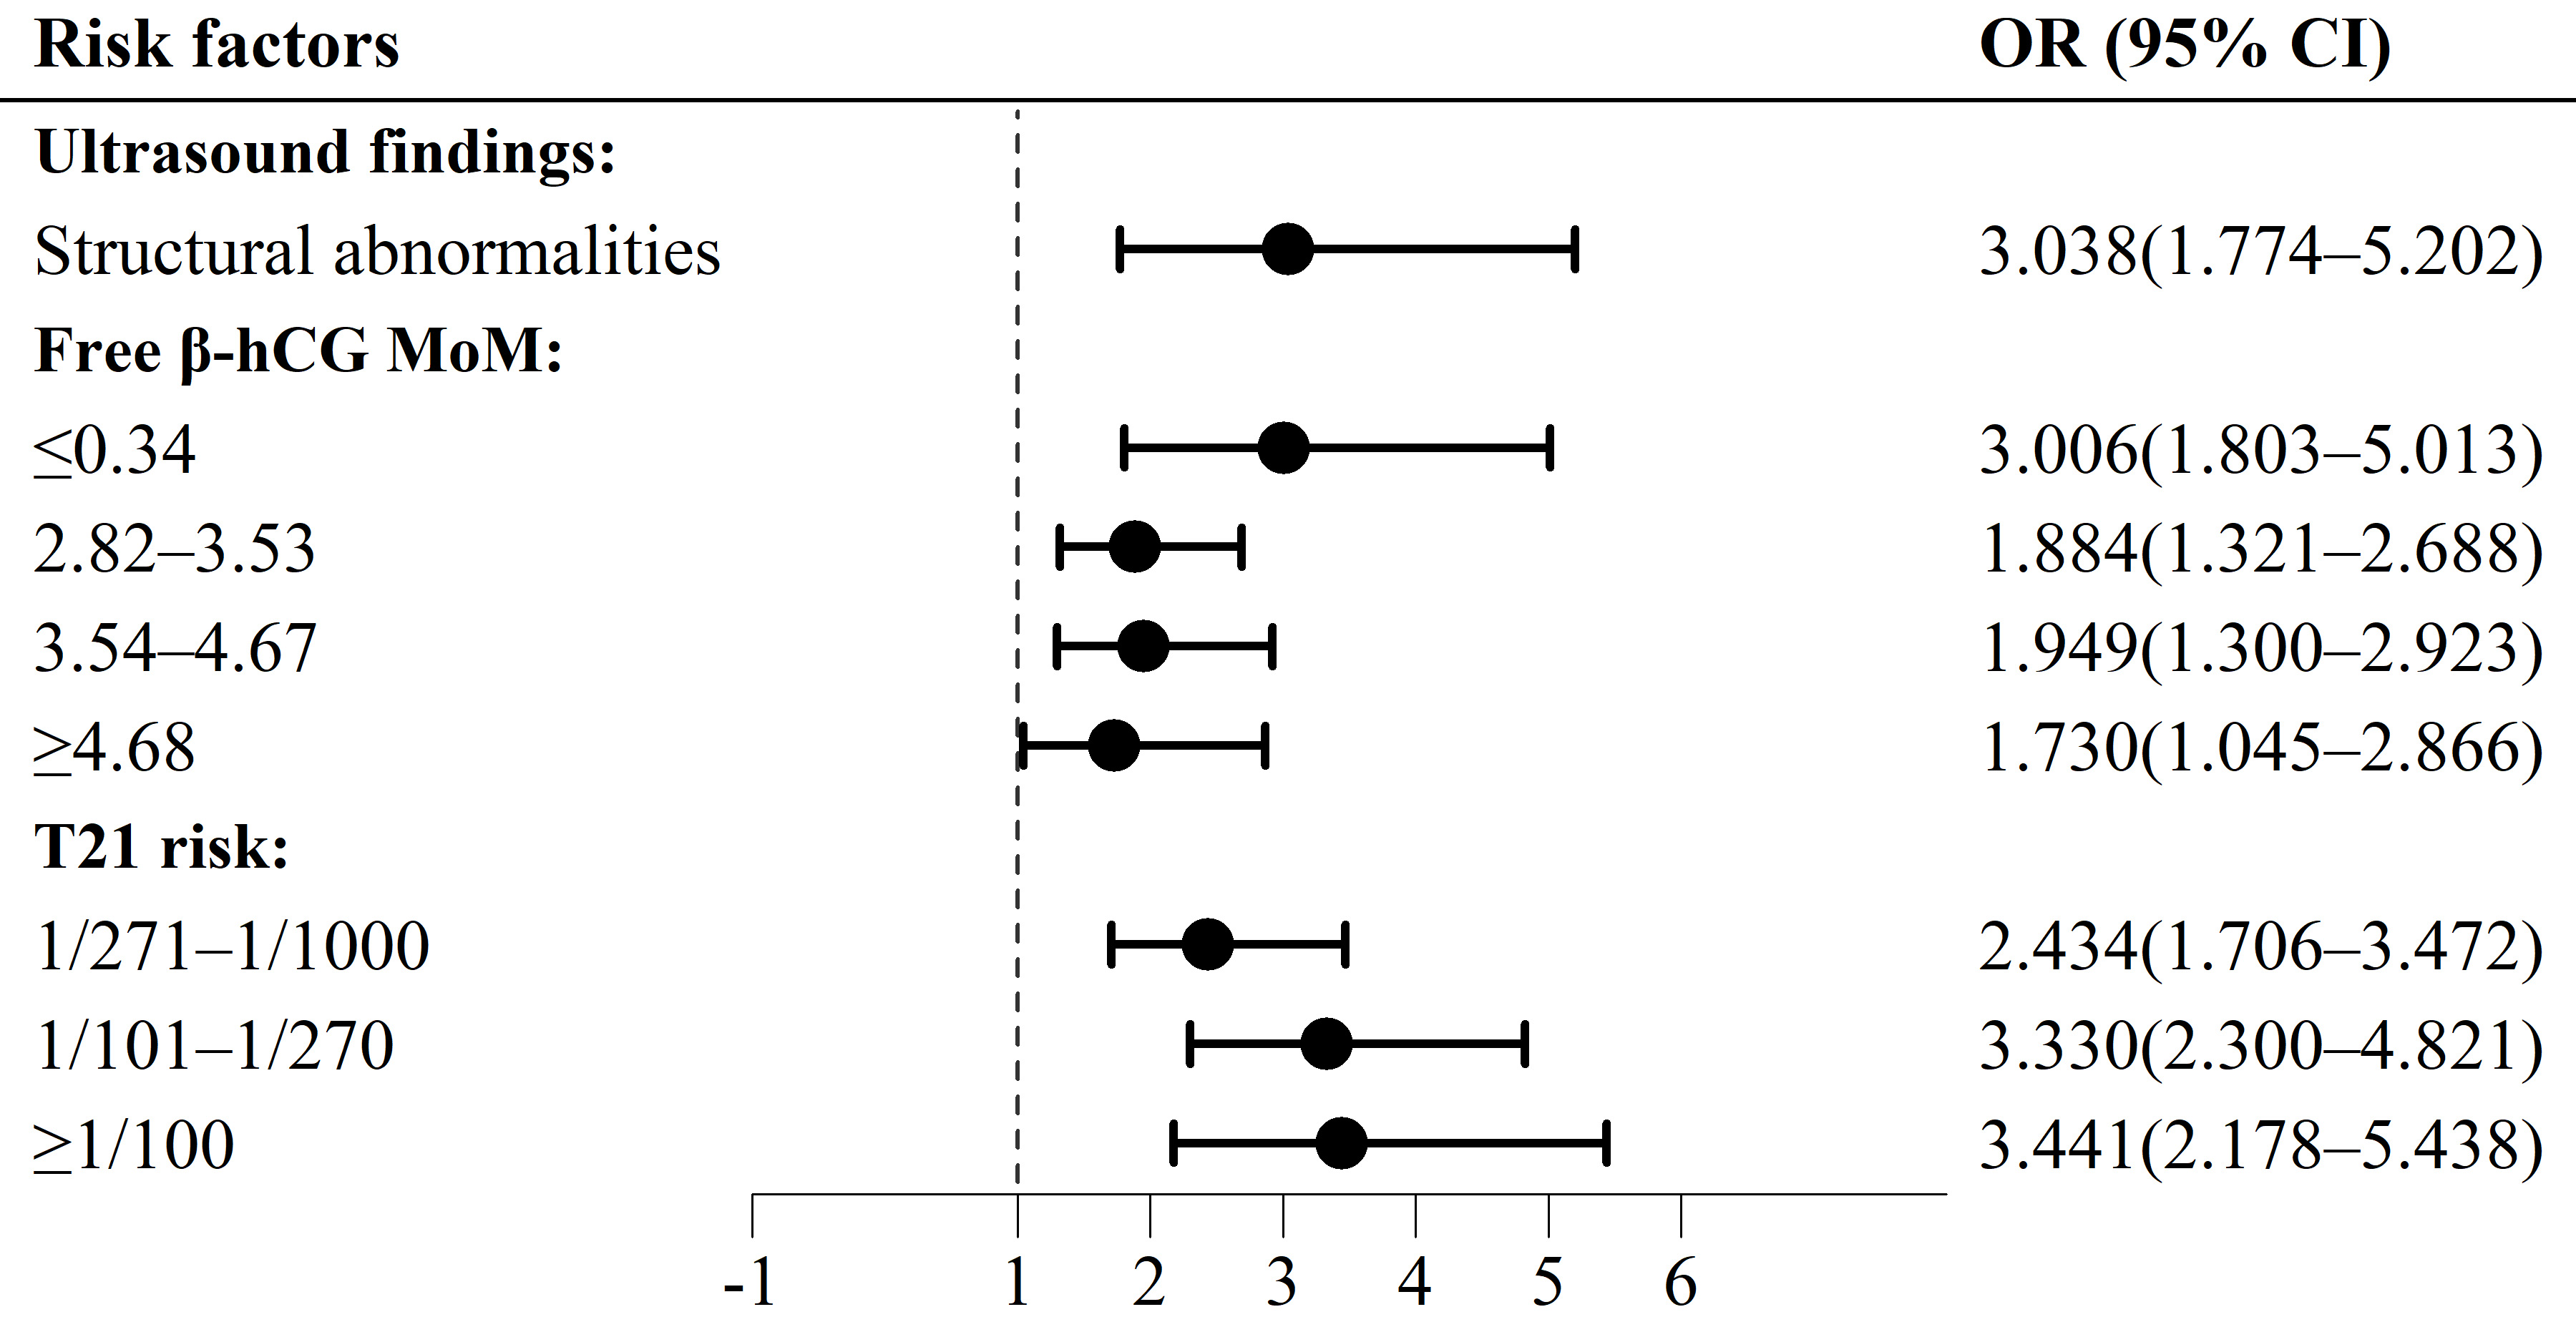 Fig. 2.
Forest map of risk factors for fetal chromosomal abnormalities
other than common trisomies, in second-trimester screening. T, trisomy; MoM,
multiple of the median;
Different fetal chromosomal abnormality groups and the control group were
compared with respect to AFP MoMs, free
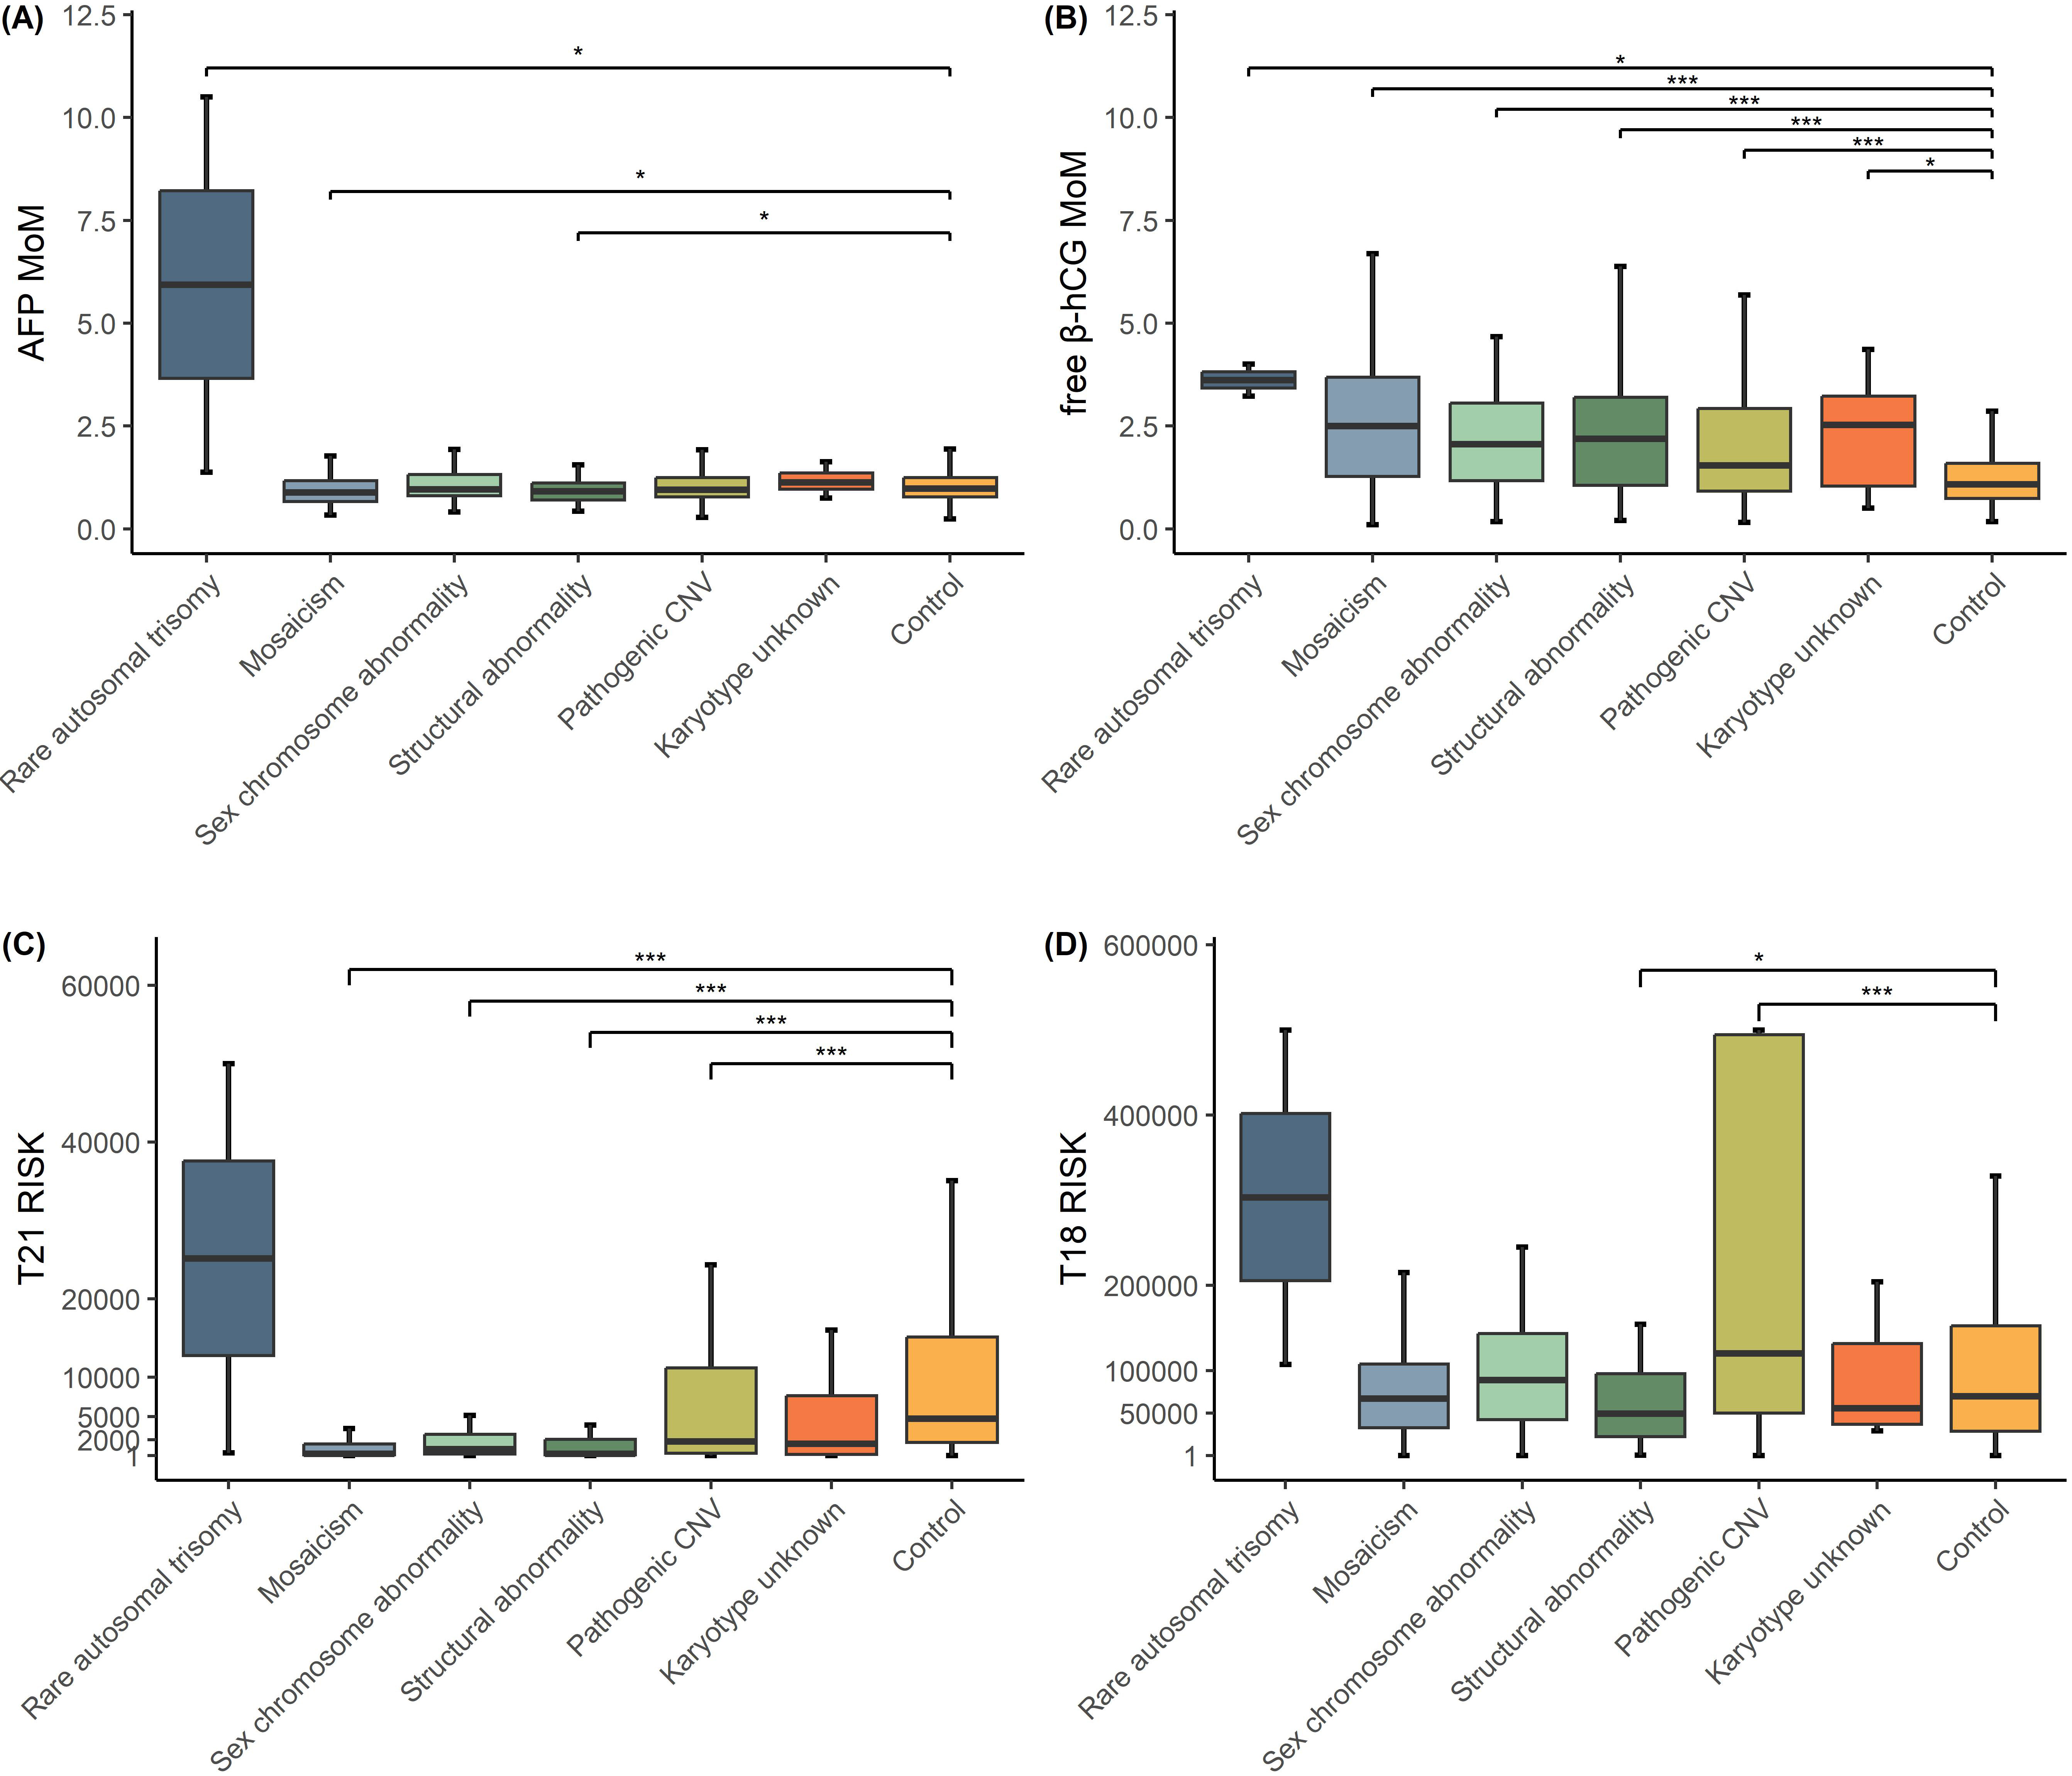 Fig. 3.
Boxplot comparing AFP MoMs, free
Regarding the risk of fetal chromosomal abnormalities other than common
trisomies, our study found that STS samples with structural abnormalities, low
free
Although our report focused solely on the STS markers as risk indicators for T21
and T18, the presence of numerous indicators associated with other fetal
chromosomal abnormalities provided suggestive evidence that the incidence rates
of these chromosomal abnormalities were not low. Norton et al. [15]
reported that among 2993 high-risk pregnant women who underwent invasive testing,
2487 (83.1%) were diagnosed with aneuploid abnormalities, while 506 (16.9%)
were diagnosed with other abnormalities. Similarly, the findings of Wang
et al. [16] showed that among the 100 high-risk pregnant women who
underwent a prenatal diagnosis, the number of chromosomal aneuploidies,
chromosomal structural abnormalities, and pathogenic CNVs were 55, 15, and 30,
respectively. In the present study, utilizing data obtained from our prenatal
diagnostic center over the past decade, we conducted a case-control study to
investigate the indicators associated with chromosomal anomalies and calculated
odds ratios (ORs) for each indicator. Despite potential confounding factors
inherent to this analytical approach, our data provided valuable insights for
clinicians based on the available dataset. Our findings revealed that ultrasound
structural abnormalities, free
Prenatal ultrasonographic examination remains one of the most important
examinations during pregnancy, as it is a cost-effective, non-invasive, and
relatively reliable method for screening fetal malformations. Fetal
ultrasonographic abnormalities principally include structural abnormalities and
soft-marker abnormalities. Fetal structural abnormalities primarily occur in the
cardiovascular system, nervous system, maxillofacial areas, genitourinary and
digestive system [17]. Soft markers, which are considered non-specific indices,
include echogenic intracardiac focus, single umbilical artery, thickened nuchal
translucency, absent nasal bone, pyelectasis, mild tricuspid regurgitation, and
choroid plexus cyst. By analyzing single nucleotide polymorphism (SNP) data from
713 fetuses with ultrasound-detected abnormalities and normal karyotypes, Cai
et al. [18] found that pathogenic CNVs were detected more frequently in
fetuses with sonographic structural abnormalities (12.7%, 30/237) than in
fetuses with non-structural abnormalities (5.7%, 27/476). In addition, some
studies have shown that soft-marker abnormalities were also associated with
chromosomal abnormalities, and that the higher the number of soft markers, the
higher the risk of chromosomal abnormalities [19, 20]. Therefore, some authors
have postulated that ultrasonographic screening can complement serologic
screening, especially for pregnant women with a single abnormal serological
marker [21]. In our investigation, we found after multivariable analysis that
ultrasound structural abnormalities (OR = 3.038; 95% CI, 1.774–5.202;
p
It is acknowledged that a higher risk of fetal chromosomal abnormalities exists with pregnancies for women after 35 years of age. While chromosome mis-segregations in the oocyte constitute one of the most significant causes of chromosomal abnormalities with advanced maternal age [22], our study revealed that maternal age was not a significant risk factor for fetal chromosomal abnormalities other than the common trisomies. This might be because of the law on Maternal and Infant Health Care in China, in which pregnant women over 35 years of age are mandated to receive a direct prenatal diagnosis. As a result, very few women of advanced maternal age undergo STS in China.
Abnormal MoM values generally indicate a range of chromosomal abnormalities and
adverse pregnancies. AFP, which is a fetus-derived glycoprotein, is produced by
the yolk sac as well as by fetal hepatocytes, and can be detected in maternal
serum as early as six weeks of gestation, with levels gradually increasing until
32 weeks [23]. The transport of AFP to the maternal serum occurs either through
the placenta or via diffusion across fetal membranes, and its increase or
decrease in the maternal context is correlated with a range of pregnancy
complications, including preterm labor, placental abruption, and preeclampsia
[24, 25]. In fetuses with Down syndrome, the presence of an AFP transport defect
leads to a diminution in maternal serum levels [26, 27]. hCG is a glycoprotein
hormone secreted by placental trophoblast cells and comprises two primary
subunits, alpha and beta. It begins to be secreted 6–8 days after fertilization
and peaks at approximately 8–11 weeks. In Down-syndrome fetuses, both maternal
serum hCG and free
Our findings demonstrated that T21 risk was a risk factor for fetal chromosomal
abnormalities other than the common trisomies. This risk was primarily determined
by multiplying the age risk of Down syndrome with the likelihood ratio of the
associated serum markers. The likelihood ratio was calculated based on the
relative height of the Gaussian distribution curve for Down syndrome pregnancies
compared to that of normal pregnancies [31], although the STS risk model for T21
and T18 was developed based on a certain number of abnormal versus normal
pregnancies. Thus, we posit that these indices might confer the ability to detect
other fetal chromosomal abnormalities. According to Lindquist et al.
[32], women with a T21 risk of first-trimester screening below 1 in 300 were most
likely to develop atypical abnormalities (excluding common trisomies and
sex-chromosome aneuploidies). Similarly, Iwarsson and Conner [9] also noted that
55% of atypical chromosomal pregnancies had an increased risk of T21, and Mak
et al. [33] demonstrated that the greater the number of risk factors for
atypical chromosomes at cFTS, the higher the incidence of atypical chromosomes.
In our study, the incidence of fetal chromosomal abnormalities other than the
common trisomies was statistically significant when the T21 risk value in STS
exceeded 1/1000. In addition, the higher the risk rate, the higher the incidence
of abnormalities. Notably, we found that the OR for intermediate-risk (OR =
2.434) was lower than the OR for free
Our study has several strengths. First, this study provided a large amount of data, encompassing nearly a decade’s worth of STS and follow-up data collected from our prenatal diagnosis center. Second, there were fewer reports of fetal chromosomal abnormalities except for common trisomies in STS, and the coverage of STS is currently still high in China. Third, to eliminate confounding factors, we exploited a matched case-control strategy. The STS samples at our center over the last decade consisted of two main screening strategies, a dual and a triple test. To ensure the inclusion of all abnormal cases in this study, we standardized the screening strategy, testing times across matched conditions and the presence or absence of ultrasound findings to minimize variations between different strategies, testing batches, and the presence or absence of ultrasound findings. Fourth, we employed sensitivity and subgroup analyses. We computed ORs for the various ranges of risk factors, providing valuable information to pregnant women with diverse STS results. The sensitivity analyses also supported the robustness of our results. However, there were some limitations to our study. Despite the existence of a province-wide networked PDIMS, fetal chromosome results were unavailable for some pregnant women. Due to the difficulty of follow-up, we may have lost some of the fetal chromosomal abnormality data. Furthermore, some fetuses or newborns with chromosomal anomalies who were clinically asymptomatic were not subjected to relevant examination, presumably impacting our results. However, in order to include more abnormal cases, we did not analyze uE3, though it has been reported that uE3 can be used to detect a number of pathogenic CNVs, such as a Xp22.31 microdeletion [34]. In light of this, we will focus on uE3 assessments in the future.
Our research revealed that free
Further inquiries could be directed to the corresponding author. The data that support the findings of this study are not publicly available due to privacy reason but are available from the corresponding author upon reasonable request.
ZW contributed to the conception of the study, collected data, and drafted the manuscript. MO collected data and processed the data, participated in the writing of the corresponding results section, and plotted Table 1 and Table 2. ZW performed statistical analysis. XW designed the research study, revised the language of the first draft and checked and revised the overall content and data. Defines and categorizes ultrasound data and participates in the writing of ultrasound-related sections in the Materials and Methods section. All authors revised and approved the final version of the paper. All authors have participated sufficiently in the work and agreed to be accountable for all aspects of the work.
The study protocol was approved by the Local Ethics Committee of Sichuan Provincial Maternity and Child Health Care Hospital (approval number: 20240607-219). The study protocol conforms to the ethical guidelines of the “World Medical Association (WMA) Declaration of Helsinki – Ethical Principles for Medical Research Involving Human Subjects” adopted by the 18th WMA General Assembly, Helsinki, Finland, in June 1964, and amended by the 59th WMA General Assembly, Seoul, South Korea, in October 2008. Patient consent has been obtained during all data collection processes.
We thank LetPub (https://www.letpub.com/) for its linguistic assistance during the preparation of this manuscript.
This research received no external funding.
The authors declare no conflict of interest.
References
Publisher’s Note: IMR Press stays neutral with regard to jurisdictional claims in published maps and institutional affiliations.