

 , Katarzyna Tomczyk 1, Adrian Mruczyński 1, Maciej Wilczak 1, Katarzyna Wszołek 1
1 Department of Maternal and Child Health, Poznan University of Medical Sciences, 61-701 Poznan, Poland
†These authors contributed equally.
Abstract
Lower urinary tract symptoms (LUTS) are a complex and widespread problem among women, resulting in serious problems in both physical, mental, and social health and occupational activity.
A self-administered survey questionnaire was conducted among 100 women diagnosed with LUTS via Google Forms. Among other things, the level of knowledge and self-assessment of existing knowledge about the condition among affected women and the preventive activities undertaken were assessed.
The respondents' level of knowledge varied widely. The average score reached was 66.67% (64.48 ± 24.63%). The study demonstrated that women under 35 years of age (U = 772.5; p = 0.005) and those with higher education (U = 615.5; p < 0.001) had significantly higher levels of knowledge.
Women's age and education affect knowledge of incontinence prevention. The common occurrence of lower urinary tract symptoms requires the development of a system of preventive, educational and therapeutic activities. Multilevel cooperation is important to increase the effectiveness of therapy.
Keywords
- lower urinary tract symptoms (LUTS)
- stress urinary incontinence (SUI)
- overactive bladder (OAB)
- mixed urinary incontinence (MUI)
In women, lower urinary tract symptoms (LUTS) are common in urogynecological practice [1]. This condition involves involuntary urination that can be objectively detected, leading to hygiene issues and posing challenges in social interactions [2]. Among women, there are three basic types of nonneurogenic LUTS: stress urinary incontinence (SUI), overactive bladder (OAB), and mixed urinary incontinence (MUI) [1]. SUI refers to the involuntary leakage of urine during activities like sneezing, coughing, physical exertion, or sudden changes in body position, without direct pressure on the bladder [3, 4]. OAB is characterized by a feeling of strong, sometimes uncontrollable urge to urinate, accompanied by a sense of urgency, even immediately or soon after using the toilet.
This condition can also lead to nocturnal incontinence (known as nocturia). Nocturia is the complaint that the individual has to wake at night one or more times for voiding [5]. MUI is a combination of stress and urgency incontinence, resulting in leakage during both physical exertion and bladder pressure [1].
LUTS stands out as one of the most serious global health issues in the 21st century and ranks among the most prevalent chronic conditions affecting women [6]. The exact prevalence of LUTS is difficult to determine because a large proportion of patients do not disclose their complaints, considering them embarrassing symptoms and, above all, a natural sign of aging [7], since both the prevalence and severity of incontinence problems increase with age [6] and is associated with high financial, social, and emotional costs [8]. Studies conducted in developed countries have revealed that about 200 million people suffer from LUTS, of which about 10–25% of women after the age of 30 have periodic symptoms of incontinence, while among women over the age of 50, this number increases to about 1/3 [9, 10].
Due to the above, people suffering from incontinence frequently withdraw from social and professional life [9]. These challenges impact not only the patients themselves, who are dealing with incontinence symptoms but also their families and the immediate environment. The basis for undertaking proper treatment lies in diagnosing the type of LUTS, and the goal of treatment, regardless of the type of incontinence, is certainly to improve quality of life. The collaboration among a medical specialist, a psychologist, and the cooperation of the patient, including their family, enhances the effectiveness of therapy. Uncontrolled urinary leakage, given its widespread prevalence in the community, takes on the characteristics of a disease that necessitates establishing a system of preventive, educational, and therapeutic measures [9, 11]. The purpose of this study was to assess knowledge subjectively, compare knowledge resources, and evaluate health-promoting behaviors related to LUTS in women.
The research was carried out among women diagnosed with LUTS. An original questionnaire (was not validated), from September 2022 to March 2023, developed through an online Google Forms survey, was utilized as the research instrument and distributed through social networks and support groups for verified women facing LUTS. Participation in the survey was voluntary and anonymous, conducted via an online platform. The study was conducted among 100 female respondents, each with a different age, education level, marital status, and place of residence. Factors such as diuretic usage, past births, and comorbidities were important considerations in the survey. Inclusion criteria were female gender and a diagnosis of LUTS. Exclusion criteria were male gender.
A questionnaire consisting of 27 questions was created to conduct this study. The first four questions gathered information about the women’s age, education, marital status, and place of residence. Subsequent questions focused on comorbidities, diuretic use, occupation, and the occurrence of incontinence symptoms. The next questions assessed women’s knowledge of incontinence, for example, the number of acceptable micturitions per day, the number of acceptable micturitions per night, risk factors for urinary incontinence (UI), the least invasive method of treating UI, and incontinence prevention methods. The final question assessed women’s knowledge of incontinence (self-evaluation): how do you rate your knowledge about UI?
Based on the questionnaire responses about women’s incontinence knowledge, the subjects’ knowledge was verified and evaluated using an assessment scale as outlined in Table 1.
| Rate | Sum of points | [%] |
|---|---|---|
| Very low | 0–6 | |
| Low | 7–10 | 30–49.9 |
| Moderate | 11–14 | 50–69.9 |
| High | 15–17 | 70–84.9 |
| Very high | 18–21 |
For data analysis, we used TIBCO Software Inc. (2017), Statistica (data analysis
software system), version 13, and Microsoft Excel (version 2019) from Microsoft
Office (Redmond, WA, USA). The distribution of variables was assessed using the
Shapiro–Wilk test. The Mann–Whitney U test was used for comparisons between
groups. Comparisons between the assessment results and self-assessment of
knowledge were conducted using the Wilcoxon paired rank order test. Spearman’s R
test and the
The study was conducted in a group of 100 women, aged 18–68 years, with an
average body mass index (BMI) of 25.69
| n = 100 (%) | ||
| Age | 18–25 years | 15 (%) |
| 26–35 years | 22 (%) | |
| 36–45 years | 25 (%) | |
| 46–60 years | 26 (%) | |
| 12 (%) | ||
| Education | Primary | 2 (%) |
| Vocational | 16 (%) | |
| Secondary | 31 (%) | |
| Higher | 51 (%) | |
| Place of residence | Rural | 25 (%) |
| City |
23 (%) | |
| City 50–100 thousands | 13 (%) | |
| City 100–250 thousands | 8 (%) | |
| City |
31 (%) | |
| Marital status | Widow | 10 (%) |
| Married | 59 (%) | |
| Single | 31 (%) | |
| Professional activity | Nonworking | 18 (%) |
| Physical work | 21 (%) | |
| Mixed work | 33 (%) | |
| Mental work | 28 (%) | |
| BMI (kg/m2) | Underweight (BMI |
2 (%) |
| Proper BMI (BMI 18.5–24.99 kg/m2) | 45 (%) | |
| Overweight (BMI 25.0–29.99 kg/m2) | 38 (%) | |
| Class 1 obesity (BMI 30.0–34.99 kg/m2) | 8 (%) | |
| Class 2 obesity (BMI 35.0–39.99 kg/m2) | 6 (%) | |
| Class 3 obesity (BMI |
1 (%) | |
| Manner of delivery | Instrumental vaginal delivery | 14 (%) |
| Spontaneous vaginal delivery | 62 (%) | |
| Caesarean section | 24 (%) |
BMI, body mass index.
Uncontrolled urine leakage during exercise, coughing, or sneezing was experienced by 73% of respondents, during intercourse by 31%, and in other situations by 22% of respondents (Table 3).
| n = 100 (%) | ||
|---|---|---|
| Uncontrolled urine leakage during exercise, coughing, or sneezing | Yes | 41 (%) |
| Occasionally | 32 (%) | |
| No | 27 (%) | |
| Uncontrolled urine leakage at rest | Yes | 6 (%) |
| Occasionally | 16 (%) | |
| No | 78 (%) | |
| Uncontrolled urine leakage during intercourse | Yes | 13 (%) |
| Occasionally | 18 (%) | |
| No | 69 (%) | |
| Number of nocturnal micturitions | 7 (%) | |
| Between 3 and 4/night | 24 (%) | |
| 2 times/night | 69 (%) | |
| Associated symptoms | Vaginal bulge | 6 (%) |
| Painful intercourse | 10 (%) | |
| Lower abdominal and low back pain | 17 (%) | |
| Feeling of incomplete bowel movement | 22 (%) | |
| Urinary urgency | 32 (%) | |
| Not applicable | 44 (%) |
Women aged over 36 (
| Uncontrolled urine leakage during exercise, coughing, or sneezing | Age | ||
| No | 17 (45.95%) | 10 (15.87%) | |
| Occasionally | 8 (21.62%) | 24 (38.10%) | |
| Yes | 12 (32.43%) | 29 (46.03%) | |
| Chi2 | |||
| Chronic diseases | |||
| Yes | No | ||
| No | 10 (16.67%) | 17 (42.50%) | |
| Occasionally | 19 (31.67%) | 13 (32.50%) | |
| Yes | 31 (51.67%) | 10 (25.00%) | |
| Chi2 | |||
| Uncontrolled urine leakage at rest | Level of education | ||
| Higher | Other | ||
| No | 46 (90.20%) | 32 (65.31%) | |
| Occasionally | 4 (7.84%) | 12 (24.49%) | |
| Yes | 1 (1.96%) | 5 (10.20%) | |
| Chi2 | |||
| Chronic diseases | |||
| Yes | No | ||
| No | 41 (68.33%) | 37 (92.50%) | |
| Occasionally | 13 (21.67%) | 3 (7.50%) | |
| Yes | 6 (10.00%) | 0 (0.00%) | |
| Chi2 | |||
| Uncontrolled urine leakage during intercourse | Level of education | ||
| Higher | Other | ||
| No | 40 (78.43%) | 29 (59.18%) | |
| Occasionally | 9 (17.65%) | 9 (18.37%) | |
| Yes | 2 (3.92%) | 11 (22.45%) | |
| Chi2 | |||
| Chronic diseases | |||
| Yes | No | ||
| No | 36 (60.00%) | 33 (82.50%) | |
| Occasionally | 12 (20.00%) | 6 (15.00%) | |
| Yes | 12 (20.00%) | 1 (2.50%) | |
| Chi2 | |||
| Number of nocturnal micturitions per night | Level of education | ||
| Higher | Other | ||
| 2 times | 43 (84.31%) | 26 (53.06%) | |
| 3–4 times | 7 (13.73%) | 17 (34.69%) | |
| 1 (1.96%) | 6 (12.24%) | ||
| Chi2 | |||
| Body weight | |||
| Normal BMI | Abnorma BMI | ||
| 2 times | 38 (84.44%) | 29 (54.72%) | |
| 3–4 times | 6 (13.33%) | 18 (33.96%) | |
| 1 (2.22%) | 6 (11.32%) | ||
| Chi2 | |||
| Chronic diseases | |||
| Yes | No | ||
| 2 times | 35 (58.33%) | 34 (85.00%) | |
| 3–4 times | 20 (33.33%) | 4 (10.00%) | |
| 5 (8.33%) | 2 (5.00%) | ||
| Chi2 | |||
BMI, body mass index.
The individual distribution regarding respondents’ knowledge is shown in Table 5.
| n = 100 (%) | ||
| Number of acceptable micturitions per day | 35 (%) | |
| 6–8 | 47 (%) | |
| 18 (%) | ||
| Number of acceptable micturitions per night | 0–1 | 0 (%) |
| 2 | 88 (%) | |
| 3–4 | 11 (%) | |
| 1 (%) | ||
| Risk factors for urinary incontinence | Reproductive organ surgery | 71 (%) |
| Age | 73 (%) | |
| Physical work | 73 (%) | |
| Obesity | 74 (%) | |
| Pregnancies and deliveries | 86 (%) | |
| The least invasive method of treating urinary incontinence | TOT/TVT surgical treatment | 4 (%) |
| Periocervical collagen injection | 7 (%) | |
| Do not know | 31 (%) | |
| Exercising the pelvic floor muscles | 58 (%) | |
| Incontinence prevention methods | Urinating prophylactically (in reserve, just in case) | 13 (%) |
| Drinking less | 14 (%) | |
| Withholding urine stream during micturition | 33 (%) | |
| Avoiding constipation | 45 (%) | |
| Maintaining a healthy body weight | 49 (%) |
TOT, transobturator tape; TVT, tension-free vaginal tape.
Respondents under 35 years of age were significantly more likely to indicate
that genital surgery could be a risk factor for incontinence (
| Age | χ2 | p | ||
| Pregnancies and deliveries | 34 (91.89%) | 52 (82.54%) | 1.82 | 0.180 |
| Physical work | 30 (81.08%) | 43 (68.25%) | 2.02 | 0.160 |
| Age | 31 (83.78%) | 42 (66.67%) | 3.65 | 0.060 |
| Obesity | 31 (83.78%) | 43 (68.25%) | 3.07 | 0.080 |
| Pelvic organ surgery | 31 (83.78%) | 40 (63.49%) | 4.94 | 0.030 |
| Level of education | χ2 | p | ||
| Higher, N = 51 | Other, N = 49 | |||
| Pregnancies and deliveries | 47 (92.16%) | 39 (79.59%) | 3.36 | 0.070 |
| Physical work | 41 (80.39%) | 32 (65.31%) | 2.91 | 0.090 |
| Age | 42 (82.35%) | 31 (63.27%) | 4.68 | 0.030 |
| Obesity | 43 (84.31%) | 31 (63.27%) | 5.86 | 0.020 |
| Pelvic organ surgery | 44 (86.27%) | 27 (55.1%) | 12.22 | |
| Place of residence | χ2 | p | ||
| Rural and city |
City ¿50 thousands, N = 52 | |||
| Pregnancies and deliveries | 41 (85.42%) | 45 (86.54%) | 0.03 | 0.870 |
| Physical work | 36 (75.00%) | 37 (71.15%) | 0.19 | 0.660 |
| Age | 31 (64.58%) | 42 (80.77%) | 3.34 | 0.070 |
| Obesity | 31 (64.58%) | 43 (82.69%) | 4.30 | 0.040 |
| Pelvic organ surgery | 32 (66.67%) | 39 (75.00%) | 0.84 | 0.360 |
According to female respondents under the age of 35, methods of preventing
incontinence include avoiding constipation (
| Age | p | |||
| Avoiding constipation | 23 (62.16%) | 22 (34.92%) | 7.03 | 0.010 |
| Urinating prophylactically (in reserve, just in case) | 4 (10.81%) | 9 (14.29%) | 0.25 | 0.610 |
| Maintaining a healthy body weight | 21 (56.76%) | 28 (44.44%) | 1.42 | 0.230 |
| Withholding urine stream during micturition | 6 (16.22%) | 27 (42.86%) | 7.99 | 0.005 |
| Drinking less | 5 (13.51%) | 9 (14.29%) | 0.01 | 0.910 |
| Level of education | p | |||
| Higher, N = 51 | Other, N = 49 | |||
| Avoiding constipation | 33 (64.71%) | 12 (24.49%) | 16.85 | |
| Urinating prophylactically (in reserve, just in case) | 6 (11.76%) | 7 (14.29%) | 0.14 | 0.710 |
| Maintaining a healthy body weight | 32 (62.75%) | 17 (34.69%) | 7.98 | 0.005 |
| Withholding urine stream during micturition | 15 (29.41%) | 18 (36.73%) | 0.61 | 0.440 |
| Drinking less | 3 (5.88%) | 11 (22.45%) | 5.99 | 0.010 |
| Place of residence | p | |||
| Rural and city |
City | |||
| Avoiding constipation | 23 (47.92%) | 22 (42.31%) | 0.32 | 0.570 |
| Urinating prophylactically (in reserve, just in case) | 8 (16.67%) | 5 (9.62%) | 1.1 | 0.290 |
| Maintaining a healthy body weight | 18 (37.5%) | 31 (59.62%) | 4.93 | 0.030 |
| Withholding urine stream during micturition | 17 (35.42%) | 16 (30.77%) | 0.24 | 0.620 |
| Drinking less | 7 (14.58%) | 7 (13.46%) | 0.03 | 0.870 |
| Marital status | p | |||
| Single, N = 31 | Married, N = 59 | |||
| Avoiding constipation | 17 (54.84%) | 27 (45.76%) | 0.67 | 0.410 |
| Urinating prophylactically (in reserve, just in case) | 2 (6.45%) | 8 (13.56%) | 1.13 | 0.290 |
| Maintaining a healthy body weight | 16 (51.61%) | 29 (49.15%) | 0.05 | 0.820 |
| Withholding urine stream during micturition | 6 (19.35%) | 25 (42.37%) | 5.03 | 0.020 |
| Drinking less | 5 (16.13%) | 8 (13.56%) | 0.11 | 0.740 |
| Body weight | p | |||
| Normal BMI, N = 45 | Abnormal BMI, N = 53 | |||
| Avoiding constipation | 20 (44.44%) | 24 (45.28%) | 0.01 | 0.930 |
| Urinating prophylactically (in reserve, just in case) | 4 (8.89%) | 9 (16.98%) | 1.43 | 0.230 |
| Maintaining a healthy body weight | 24 (53.33%) | 25 (47.17%) | 0.37 | 0.540 |
| Withholding urine stream during micturition | 18 (40%) | 14 (26.42%) | 2.04 | 0.150 |
| Drinking less | 2 (4.44%) | 12 (22.64%) | 7.32 | 0.010 |
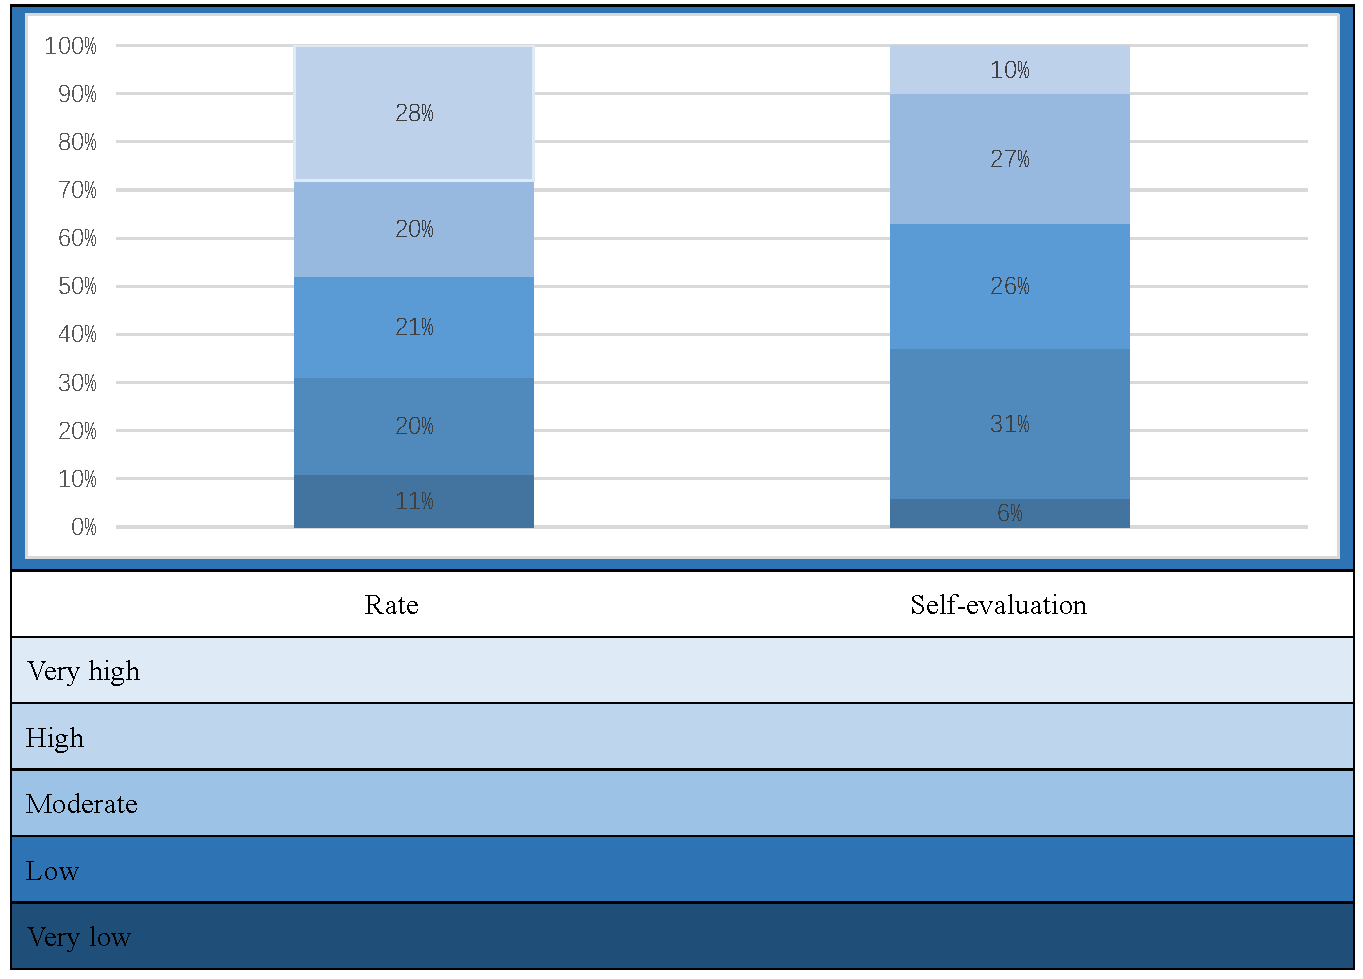
The knowledge of the female respondents ranged from 14.29% to 100% (Fig. 1).
The average score in the study group was 66.67% (64.48
 Fig. 1.
Comparison of assessment and self-evaluation of knowledge.
| Mean |
Min–Max | Me [Q1–Q3] | U | p | ||
| Age | ||||||
| 73.49 |
19.05–100 | 76.19 [61.90–90.48] | 772.5 | 0.005 | ||
| 59.18 |
14.29–100 | 57.14 [38.10–80.95] | ||||
| Education | ||||||
| Higher | 74.6 |
19.05–100 | 80.95 [61.90–95.24] | 615.5 | ||
| Other | 53.94 |
14.29–100 | 52.38 [38.10–76.19] | |||
| Place of residence | ||||||
| Rural or city |
60.22 |
14.29–100 | 61.9 [38.10–83.33] | 1021.5 | 0.120 | |
| city |
68.41 |
23.81–100 | 76.19 [50.00–88.10] | |||
| Marital status | ||||||
| Single | 69.74 |
14.29–100 | 76.19 [52.38–90.48] | 796.5 | 0.320 | |
| Marries | 64.57 |
19.05–100 | 66.67 [38.10–85.71] | |||
| Body weight | ||||||
| Normal | 68.99 |
19.05–100 | 76.19 [52.38–85.71] | 965.0 | 0.100 | |
| Excessive | 61.1 |
14.29–95.24 | 57.14 [38.10–80.95] | |||
| Chronic diseases | ||||||
| Yes | 62.22 |
19.05–100 | 61.9 [40.48–85.71] | 1041.0 | 0.260 | |
| No | 67.86 |
14.29–100 | 76.19 [45.24–85.71] | |||
| Prevention | ||||||
| Yes | 70.63 |
23.81–100 | 73.81 [57.14–90.48] | 837.5 | 0.110 | |
| No | 61.84 |
14.29–100 | 61.9 [38.10–80.95] | |||
SD, standard deviation.
Based on the questionnaire responses, a comparison was made between the
assessment/real knowledge and self-evaluation about UI.
Significant differences between the assessment and self-evaluation of knowledge
were observed in the study (p
| The rating scale | Education | ||
| Higher | Other | ||
| Rate in the knowledge rating scale | Very low | 3 (5.88%) | 8 (16.33%) |
| Low | 6 (11.76%) | 14 (28.57%) | |
| Moderate | 9 (17.65%) | 12 (24.49%) | |
| High | 9 (17.65%) | 11 (22.45%) | |
| Very high | 24 (47.06%) | 4 (8.16%) | |
| Chi2 Persona | |||
| Rate in the self-evaluation rating scale | Very low | 2 (3.92%) | 4 (8.16%) |
| Low | 15 (29.41%) | 16 (32.65%) | |
| Moderate | 10 (19.61%) | 16 (32.65%) | |
| High | 16 (31.37%) | 11 (22.45%) | |
| Very high | 8 (15.69%) | 2 (4.08%) | |
| Chi2 Persona | |||
| Place of residence | |||
| Rural or city |
City | ||
| Rate in the knowledge rating scale | Very low | 7 (14.58%) | 4 (7.69%) |
| Low | 11 (22.92%) | 9 (17.31%) | |
| Moderate | 11 (22.92%) | 10 (19.23%) | |
| High | 7 (14.58%) | 13 (25.00%) | |
| Very high | 12 (25.00%) | 16 (30.77%) | |
| Chi2 Persona | |||
| Rate in the self-evaluation rating scale | Very low | 4 (8.33%) | 2 (3.85%) |
| Low | 18 (37.50%) | 13 (25.00%) | |
| Moderate | 18 (37.50%) | 8 (15.38%) | |
| High | 5 (10.42%) | 22 (42.31%) | |
| Very high | 3 (6.25%) | 7 (13.46%) | |
| Chi2 Persona | |||
| Prevention of urinary incontinence | |||
| Yes | No | ||
| Rate in the knowledge rating scale | Very low | 1 (3.33%) | 10 (14.29%) |
| Low | 5 (16.67%) | 15 (21.43%) | |
| Moderate | 8 (26.67%) | 13 (18.57%) | |
| High | 5 (16.67%) | 15 (21.43%) | |
| Very high | 11 (36.67%) | 17 (24.29%) | |
| Chi2 Persona | |||
| Rate in the self-evaluation rating scale | Very low | 0 (0.00%) | 6 (8.57%) |
| Low | 3 (10.00%) | 28 (40.00%) | |
| Moderate | 9 (30.00%) | 17 (24.29%) | |
| High | 12 (40.00%) | 15 (21.43%) | |
| Very high | 6 (20.00%) | 4 (5.71%) | |
| Chi2 Persona | |||
UI is indeed becoming increasingly common in today’s medical landscape, particularly within urogynecology. It stems, in part, from a decline in female sex hormones, causing changes in the bladder and vagina, and the extinction of ovarian function [12, 13, 14]. Besides age, several factors contribute to the predisposition to UI, including overweight (obesity), smoking, multiple pregnancies, lack of exercise, carrying heavy objects, prior gynecological procedures, menopause, dynamic natural childbirth, delivering newborns with high birth weight, and genetic conditions [9, 10, 11, 12, 13, 14, 15].
The incidence of LUTS in women rises with age and the number of deliveries, increasing from 19% in those under 45 years to 29% in women aged 80 years and older [16]. The literature provides limited coverage of incontinence prevention. The results of this study allow us to assess women’s knowledge levels and their practical application in everyday life regarding incontinence prevention. In our study, 15% of women between the ages of 18 and 25 have already experienced UI. A sedentary lifestyle and inactivity weakens the pelvic floor muscles. Inadequate and excessively strenuous training may also overload it. Athletic women often experience heightened strain on pelvic floor muscles, leading to SUI, although the exact mechanisms behind these relationships are not yet fully understood [17]. The largest group in the study comprised respondents aged 46–60, accounting for 26% of the respondents. Interestingly, the study shows that place of residence and education indeed influence a higher percentage of women with the disease in question. This is likely due to better access to doctors and higher detection rates compared to women in smaller cities or rural areas. Among the mentioned methods of pregnancy termination, women most commonly underwent natural childbirth with protection (protection of the perineum by the midwife) or a perineal incision. Unfortunately, poorly conducted deliveries and lack of postpartum prophylaxis, including consultation with at least a urogynecological physiotherapist, as observed, have a significant impact on the appearance of LUTS later on. Urogynecological physiotherapy has proven effectiveness in treating SUI [18]. In surgical treatment of SUI, suburethral taping confirms the safety and efficacy of the method, both in short-term and long-term follow-ups, with a success rate exceeding 80% [19]. Ultrasound is feasible, reliable, and minimally invasive to explore the pathophysiology of UI [20]. The choice of the method between “retropubic” vs. “transobturator” surgeries depended on a preoperative ultrasound examination of the pelvic floor and by taking into account the mobility of the urethra and the height of the periurethral furrow-vaginal vaults. The role of ultrasonographic measurement of bladder and detrusor wall thickness could be an important step in diagnosis of UI [21].
In addition, the study demonstrated that women with chronic diseases were
significantly more likely to declare the occurrence of uncontrolled urine leakage
during exercise, coughing, or sneezing. The symptoms reported by female
respondents included painful intercourse in 10% of respondents, lower abdominal
and low back pain in 17%, while 44% of women reported no additional symptoms.
The study observed a significant correlation among women living in rural areas
and small urban areas. In contrast, a previous survey distinguished the three
most important etiological factors for SUI occurrence in premenopausal and
postmenopausal women in Poland. The analysis results clearly indicated that
patient age (p = 0.0001), body mass index (BMI) (p = 0.0001),
and surgical removal of the uterus by laparotomy (p = 0.0001) had the
greatest influence on SUI incidence. The impact of other etiological factors
remained quite controversial [22]. In Japan women, stress incontinence was
prevalent at all ages and the incidence of UI increased over 70 years of age.
Urinary incontinence was more likely as activities of daily living limitations
and cystitis increased. Women with a history of hysterectomy or diabetes mellitus
were at increased risk for UI [23]. The most common risk factors UI, among
Turkish women, were age, number of births, body mass index
Assessing women’s knowledge levels, the study observed that women using UI prophylaxis were significantly more likely to indicate up to 6 max allowable micturitions/day, whereas women not using prophylaxis were significantly more likely to indicate more than 8 micturitions/day. Similarly, regarding the allowable number of micturitions per night, it was observed that women living in cities with more than 50,000 residents were significantly more likely to indicate up to 2 allowable micturitions/night. The knowledge of the female respondents ranged from 14.29% to 100%. Thus, the study certainly shows that women who use preventive measures are significantly more informed and aware compared to those who do not, as indicated by their self-evaluation on this matter. Additionally, a significantly higher level of knowledge is evident among women aged up to 35 with higher education, with no significant impact observed based on place of residence or marital status. In the study by Aramowicz et al. [25], most of the respondents considered their level of knowledge to be average (27%), sufficient (23.7%) and weak (15.1%). In contrast, 24.3% of the respondents consider their scope of information on SUI as good and very good (7.9%). Therefore, the state of knowledge of women in the field of SUI is still insufficient [25]. Derewiecki et al. [26] in their study of women’s knowledge about incontinence obtained the following data: in I group — women reporting an UI problem, 73.68% declared knowledge at a sufficient level, while in II group — women without UI symptoms, it was only 22.5%. In a similar study conducted by Bakalczuk et al. [27], 36.5% of the respondents evaluated their state of knowledge as good, about 34.9% as sufficient and 18.7% of the women possessed insufficient knowledge. Despite general awareness that the problem of UI exists, still remains at too low a level to decrease the percentage of people affected by this affliction [27].
To implement incontinence prevention, it is essential to eliminate risk factors.
Avoiding constipation (by consuming a diet rich in fiber and ensuring adequate
hydration of the body), engaging in regular physical activity, maintaining normal
body weight, quitting smoking, and adopting proper toilet habits (such as
avoiding urine retention and refraining from pushing during micturition) are
necessary for preventing UI. Additionally, UI prophylaxis users were
significantly more likely to indicate that pelvic floor muscle exercises were the
least invasive form of UI treatment (
Women’s age and education affect knowledge of incontinence prevention. Taking into account their commonness in society, lower urinary tract symptoms have the characteristics of a disease requiring the development of a system of preventive, educational, and therapeutic activities. That is why multi-level cooperation is so important to increase the effectiveness of therapy.
The datasets used and/or analyzed during the current study are available from the corresponding author on reasonable request.
MWiś and KC-W designed the research study. MWiś, KC-W, KT, AM, KW, MWil performed the research. KC-W, KT, AM, KW, MWil analyzed the data. KC-W, KT, AM, MWil, KW wrote the manuscript. All authors contributed to editorial changes in the manuscript. All authors read and approved the final manuscript. All authors have participated sufficiently in the work and agreed to be accountable for all aspects of the work.
Ethical review and approval were waived for this study due to the survey-based, anonymous nature of the study. As the survey is anonymous, no informed consent is required.
We would like to express our gratitude to all those who helped us while writing this manuscript. Thanks to all the peer reviewers for their opinions and suggestions.
This research received no external funding.
The authors declare no conflict of interest. Karolina Chmaj-Wierzchowska, Maciej Wilczak and Katarzyna Wszołek are serving as Guest editors of this journal. We declare that Karolina Chmaj-Wierzchowska, Maciej Wilczak and Katarzyna Wszołek had no involvement in the peer review of this article and has no access to information regarding its peer review. Full responsibility for the editorial process for this article was delegated to Ugo Indraccolo.
References
Publisher’s Note: IMR Press stays neutral with regard to jurisdictional claims in published maps and institutional affiliations.