


1 Obstetrics & Gynaecology Unit, San Bassiano Hospital, 36061 Bassano Del Grappa, Italy
2 Department of Life, Health and Environmental Sciences, University of L'Aquila, 67100 L'Aquila, Italy
3 Obstetrics & Gynaecology Unit, San Salvatore Hospital, 67100 L'Aquila, Italy
Abstract
Background: The accuracy of third-trimester ultrasound in detecting large for
gestational age and macrosomic fetuses in diabetic and non-diabetic pregnant
women is unclear in the literature. The aim of the study is to examine the
precision of the 4-parameter Hadlock formula for the prediction of large fetuses
in these two populations. Methods: A systematic review and meta-analysis were
performed, and only studies evaluating the accuracy of third-trimester ultrasound
using the 4-parameter Hadlock formula were included. Data were extracted, and the
meta-analysis was performed using STATA software and Meta-disk 2.0 aiming to
obtain the pooled sensitivity and specificity. Quality assessment of the risk of
bias was performed using the QUADS-2 tool. Results: Nine articles were included
in the final analysis together with 24,693,702 pregnancies screened and 2336 real
large fetuses. The included articles were judged to be at high risk of bias in
more than half of the cases and at doubtful risk in the remaining cases.
Comparison between diabetic and non-diabetic populations was impossible because
the studies considered mixed pregnancies (diabetic and non-diabetic) or only
healthy, so the comparison was made between the latter two groups. The pooled
sensitivity was 0.54 (95% confidence interval (CI): 0.40–0.68), and the pooled
specificity was 0.94 (95% CI: 0.90–0.97). The heterogeneity estimated by the
Bivariate I
Keywords
- large for gestational age
- LGA
- macrosomia
- gestational diabetes
- estimated fetal weight
A large for gestational age (LGA) fetus is defined by the presence of a prenatal
abdominal circumference (AC) and/or estimated fetal weight (EFW)
Pregnancies complicated by gestational diabetes mellitus (GDM) have a 2 to 4 times higher risk of having LGA fetuses than non-diabetic women [11], along with a higher risk of perinatal morbidities related to neonatal macrosomia [12]. It is debated whether the presence of maternal diabetes reduces further the accuracy of ultrasound in estimating fetal weight [13]. In fact, it has been shown that the percentage difference in EFW may be as low as 0.2% in non-diabetic women when fetal biometry is performed within one week before delivery, while it rises to 7.9% in diabetic women [13]. However, the accuracy of ultrasonography in these two groups is not well described in the literature. Therefore, the aim of this review is to define the accuracy of the 4-parameter Hadlock formula in predicting the EFW of LGA fetuses in diabetic and non-diabetic pregnant women.
A meta-analysis on the accuracy of third-trimester ultrasound in estimating the actual birth weight of suspected LGA and macrosomic fetuses was conducted. The study was registered with the International Prospective Register of Systematic Reviews (PROSPERO) database (CRD42023407146) [14]. The Preferred Reporting Items for Systematic Reviews and Meta-analysis (PRISMA) guidelines were followed in reporting the results [15].
An English literature search was performed from inception until July 2022 in PubMed (Medline). For the purpose of the search, a combination of key terms was used, which, together with the search strategy, is given in the Appendix. Original articles and studies reporting the accuracy of the EFW Hadlock 4 formula [16] in detecting LGA and macrosomic fetuses were considered for inclusion, while literature reviews, meta-analyses, and case reports were not considered eligible. The diabetic patients could have had pregestational type I or II diabetes or GDM. According to the International Society of Ultrasound in Obstetrics and Gynecology (ISUOG) and the American College of Obstetricians and Gynecologists (ACOG) [1, 5], an LGA fetus was defined by an EFW or AC above the 90th percentile according to gestational age, while a macrosomic fetus was considered a fetus with an EFW above 4000 grams.
Data extracted or derived from the available data of each study included the type of population undergoing ultrasound and the total number of patients scanned, the sensitivity, the specificity, and the total number of true-positive (TP), false-positive (FP), true-negative (TN), and false-negative (FN) results. A meta-analysis was conducted to present sensitivity and specificity estimates along with 95% confidence intervals (CIs).
The quality assessment of each included study was performed using the Quality Assessment of Diagnostic Accuracy Studies (QUADAS-2) criteria [17]. After applying the two separate quality criteria, the Robvis tool web app (Version of 2022, University of Bristol, Bristol, United Kingdom) [18] was then used to visualize the risk-of-bias assessments creating traffic-light plots and weighted bar plots.
Derived data on TP, FP, TN, and FN were obtained by knowing the number of
patients studied and the sensitivity and specificity values through a 2
For the aim of the study, a subgroup analysis between healthy and mixed populations was performed. A comparative analysis was run using a random effects model with one categorical covariate from Meta-disk 2.0. Summary receiver operating characteristic (ROC) curve and forest plots were also reported.
A total of 1855 studies were identified through the search of the literature. 1792 titles and abstracts were screened, resulting in 63 proceeding to the full-text screen. Of these, 20 articles were excluded because of the formula used (non-Hadlock, Hadlock 1, Hadlock 2, or Hadlock 3 formula). Further, eight publications were excluded because of the incorrect study design or outcome, and the other three manuscripts because of insufficient data reported. Finally, 23 articles were excluded because they did not directly report TP, FP, TN, and FN data or could not be derived due to missing data. Thus, nine articles were included in the present meta-analysis [3, 7, 23, 24, 25, 26, 27, 28, 29], of which 3 represented a healthy population [7, 25, 27], one a diabetic population [26], and 5 a mixed population (healthy and diabetic) [3, 23, 24, 28, 29].
The selection process of included articles is presented in Fig. 1, while PRISMA checklist is given in the Supplementary Materials.
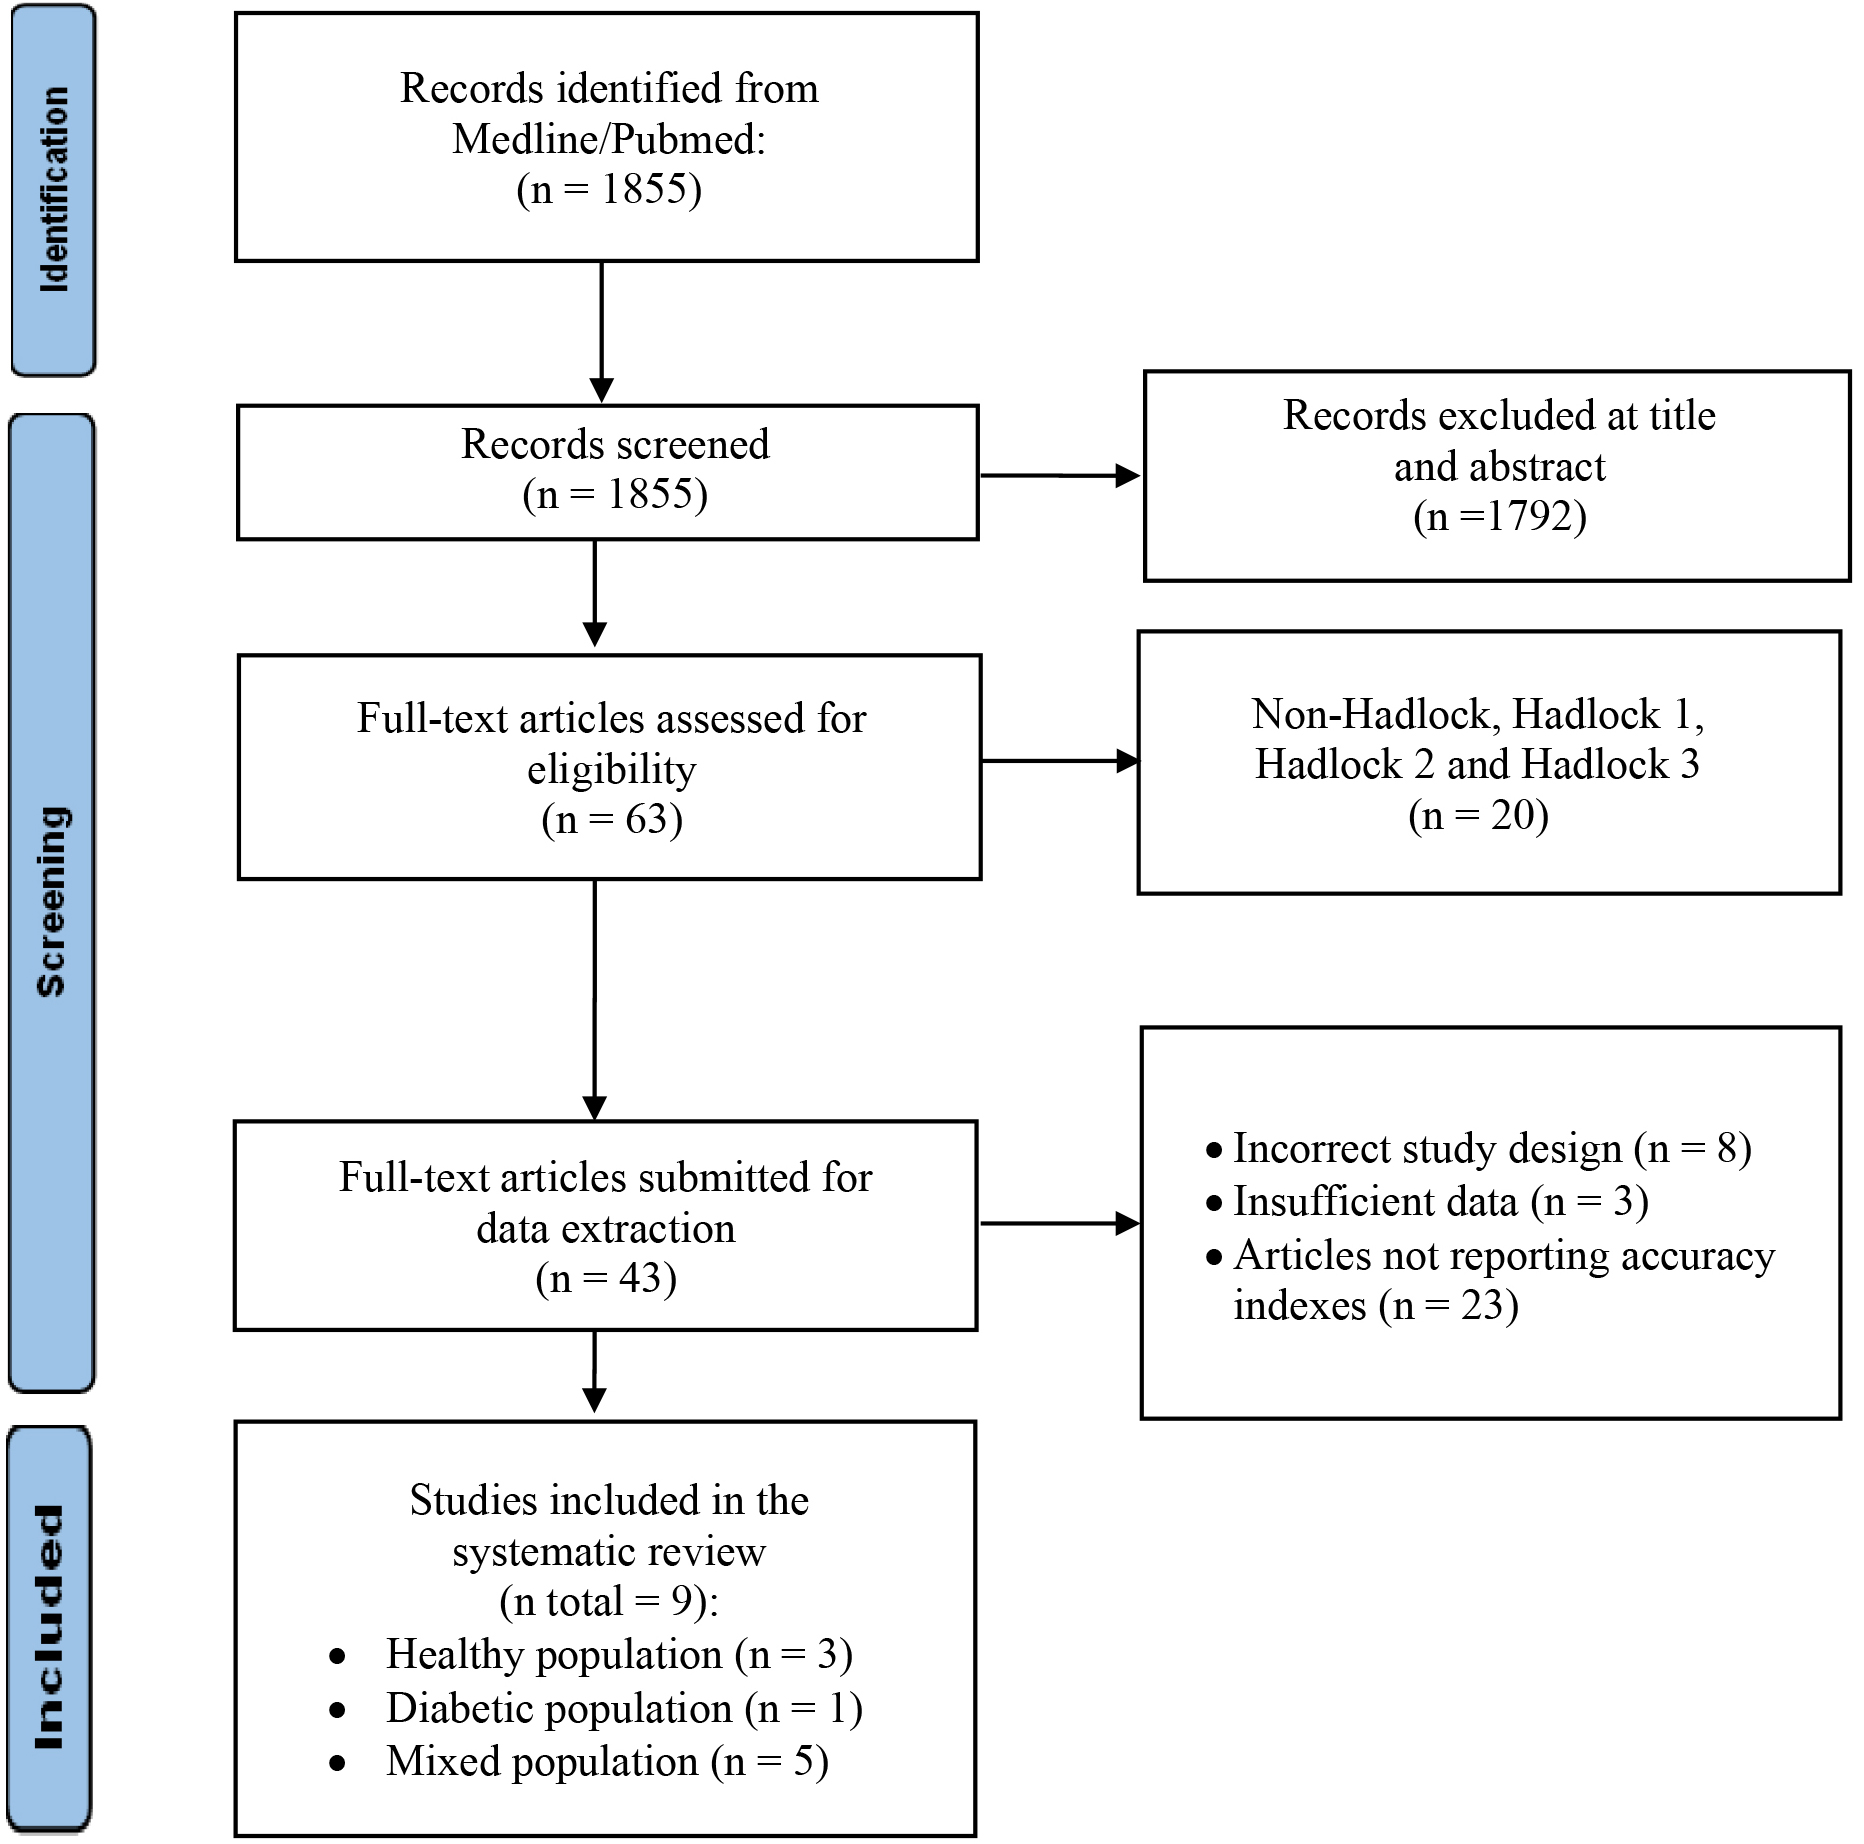 Fig. 1.
The selection process of included articles.
The risk of bias of included studies was represented with the traffic light plots and weighted bar plots according to the QUADAS-2 criteria (Fig. 2, Ref. [3, 7, 23, 24, 25, 26, 27, 28, 29]; Fig. 3). The rating obtained on “overall” risk of bias was high risk in more than half of the publications included in the review. In the remaining cases, the overall risk of bias was rated as doubtful. The fields with the highest risk of bias were “index test” because of the interval between ultrasound scans and delivery. Conversely, reference standard bias and flow and timing bias were found to be low risk for all publications.
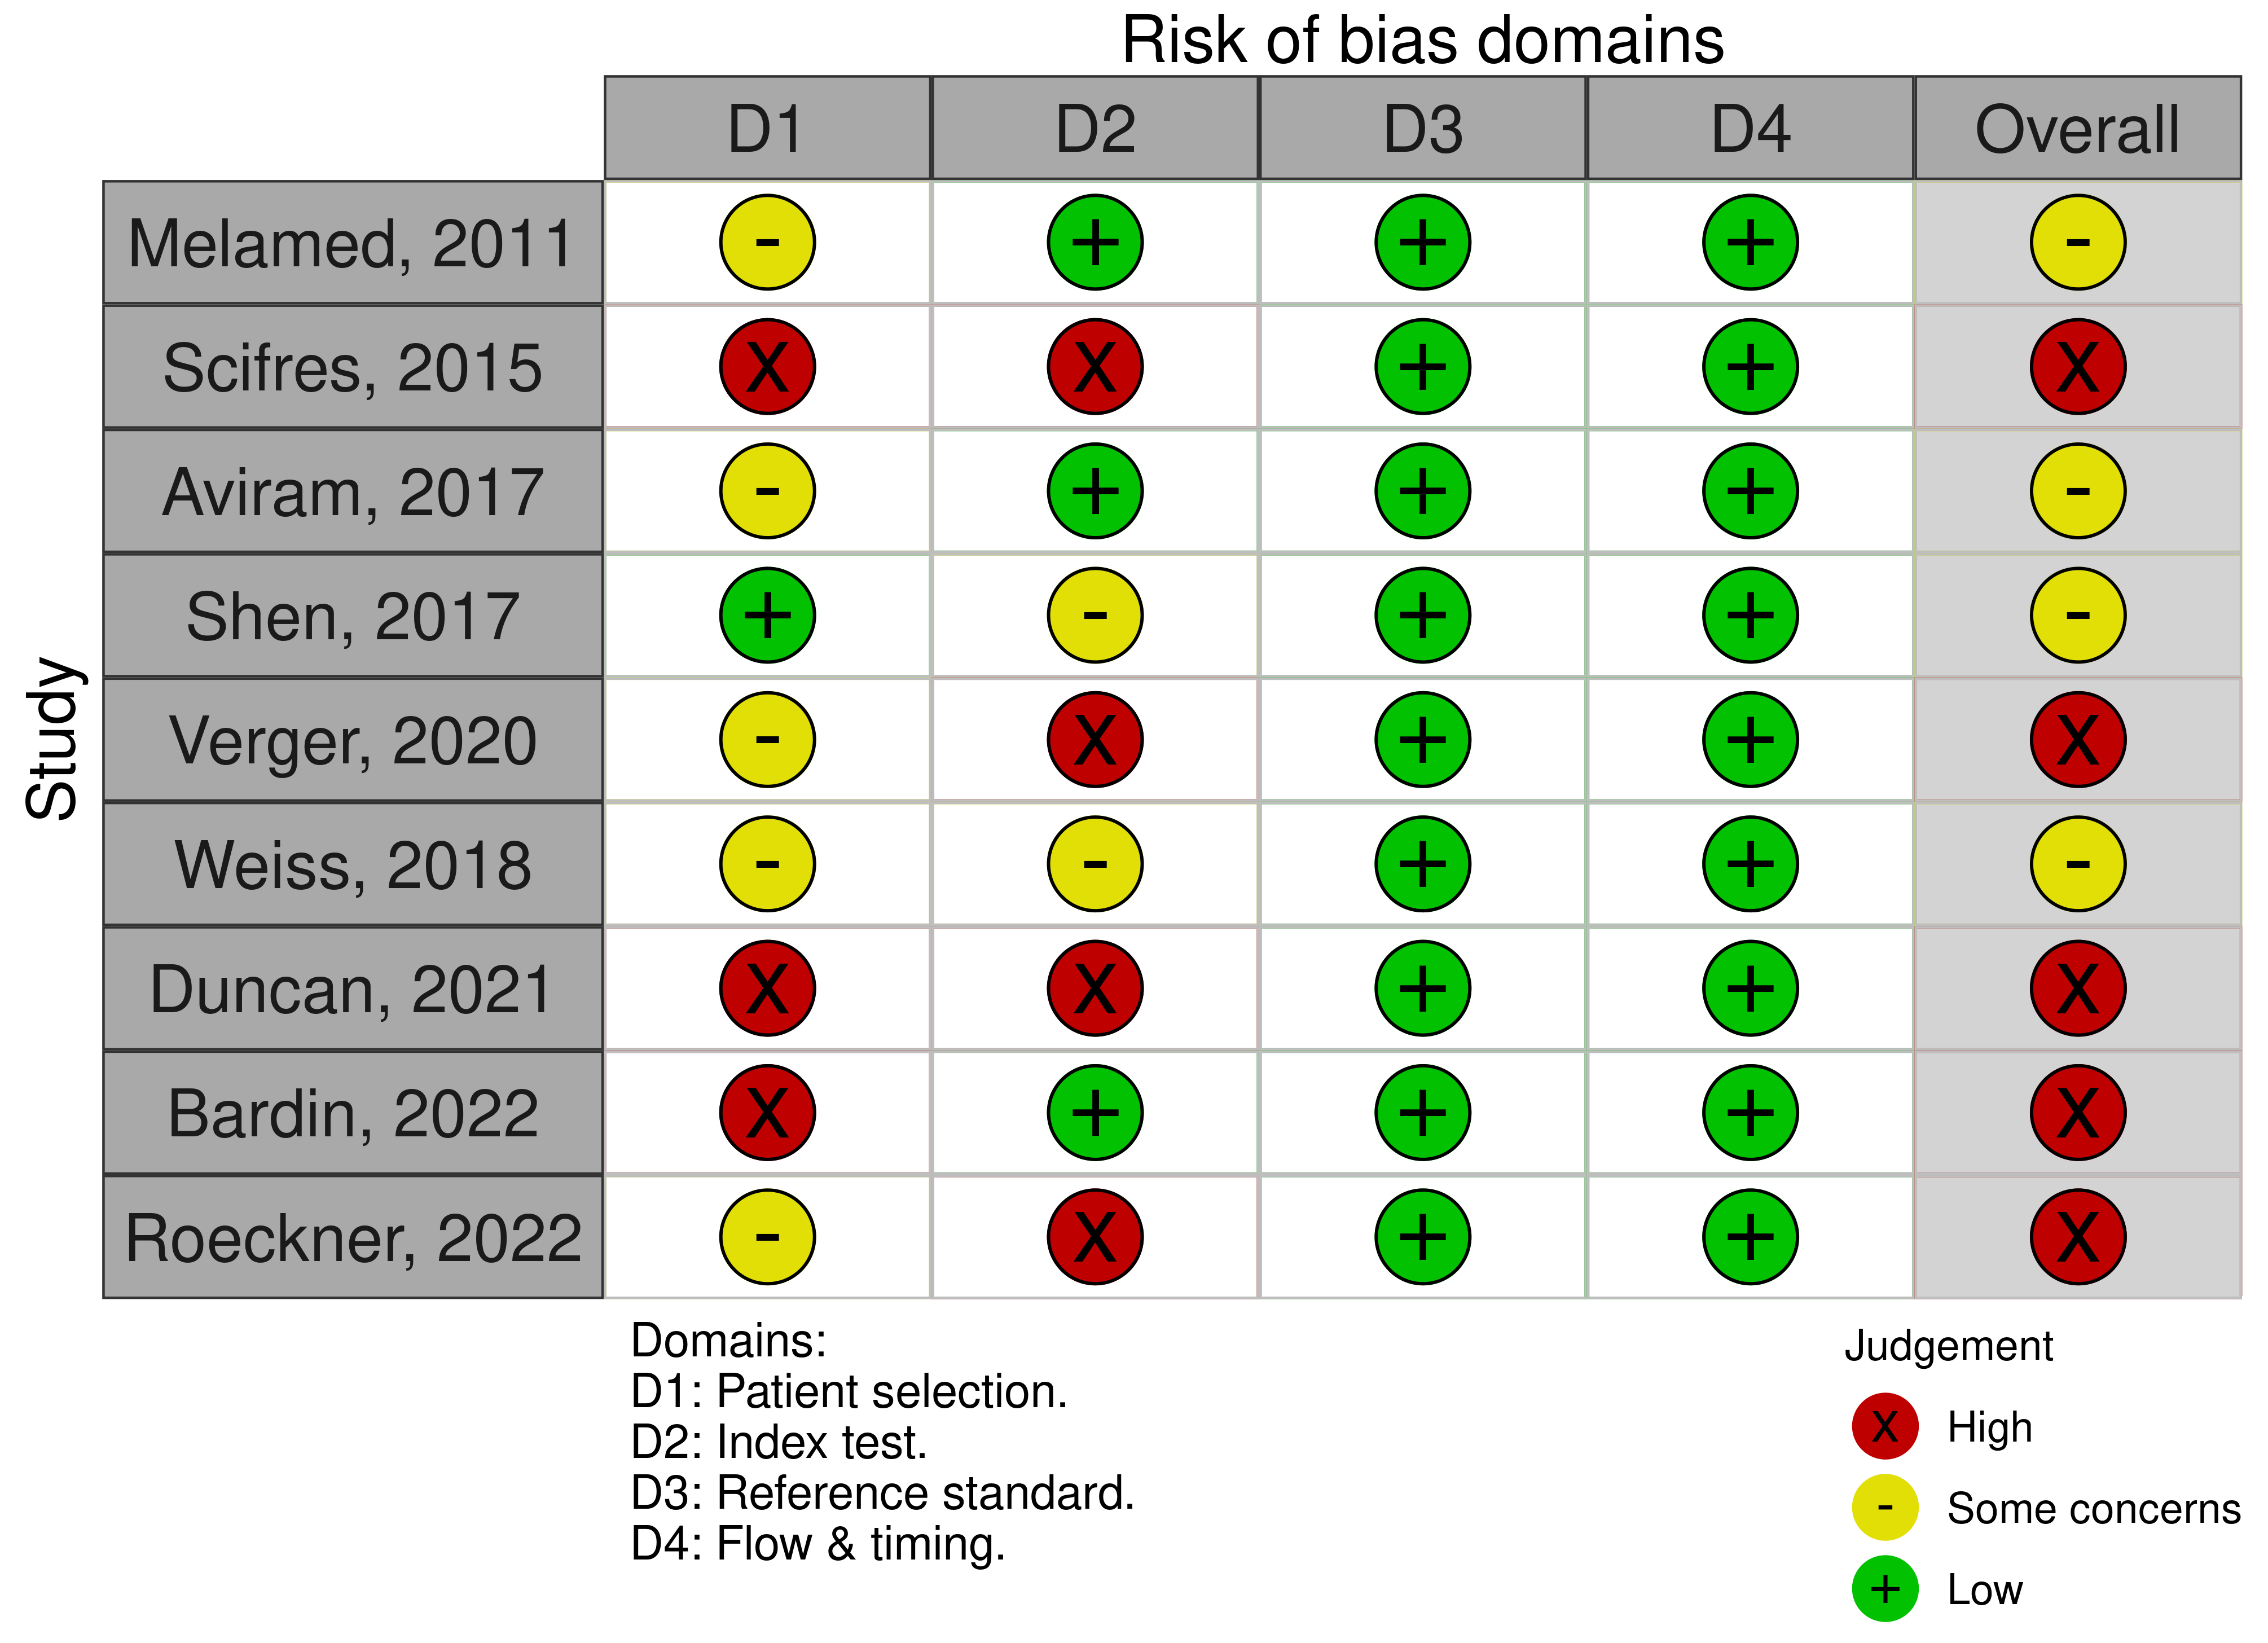 Fig. 2.
The traffic light plot QUADAS-2 quality evaluation of all included articles.
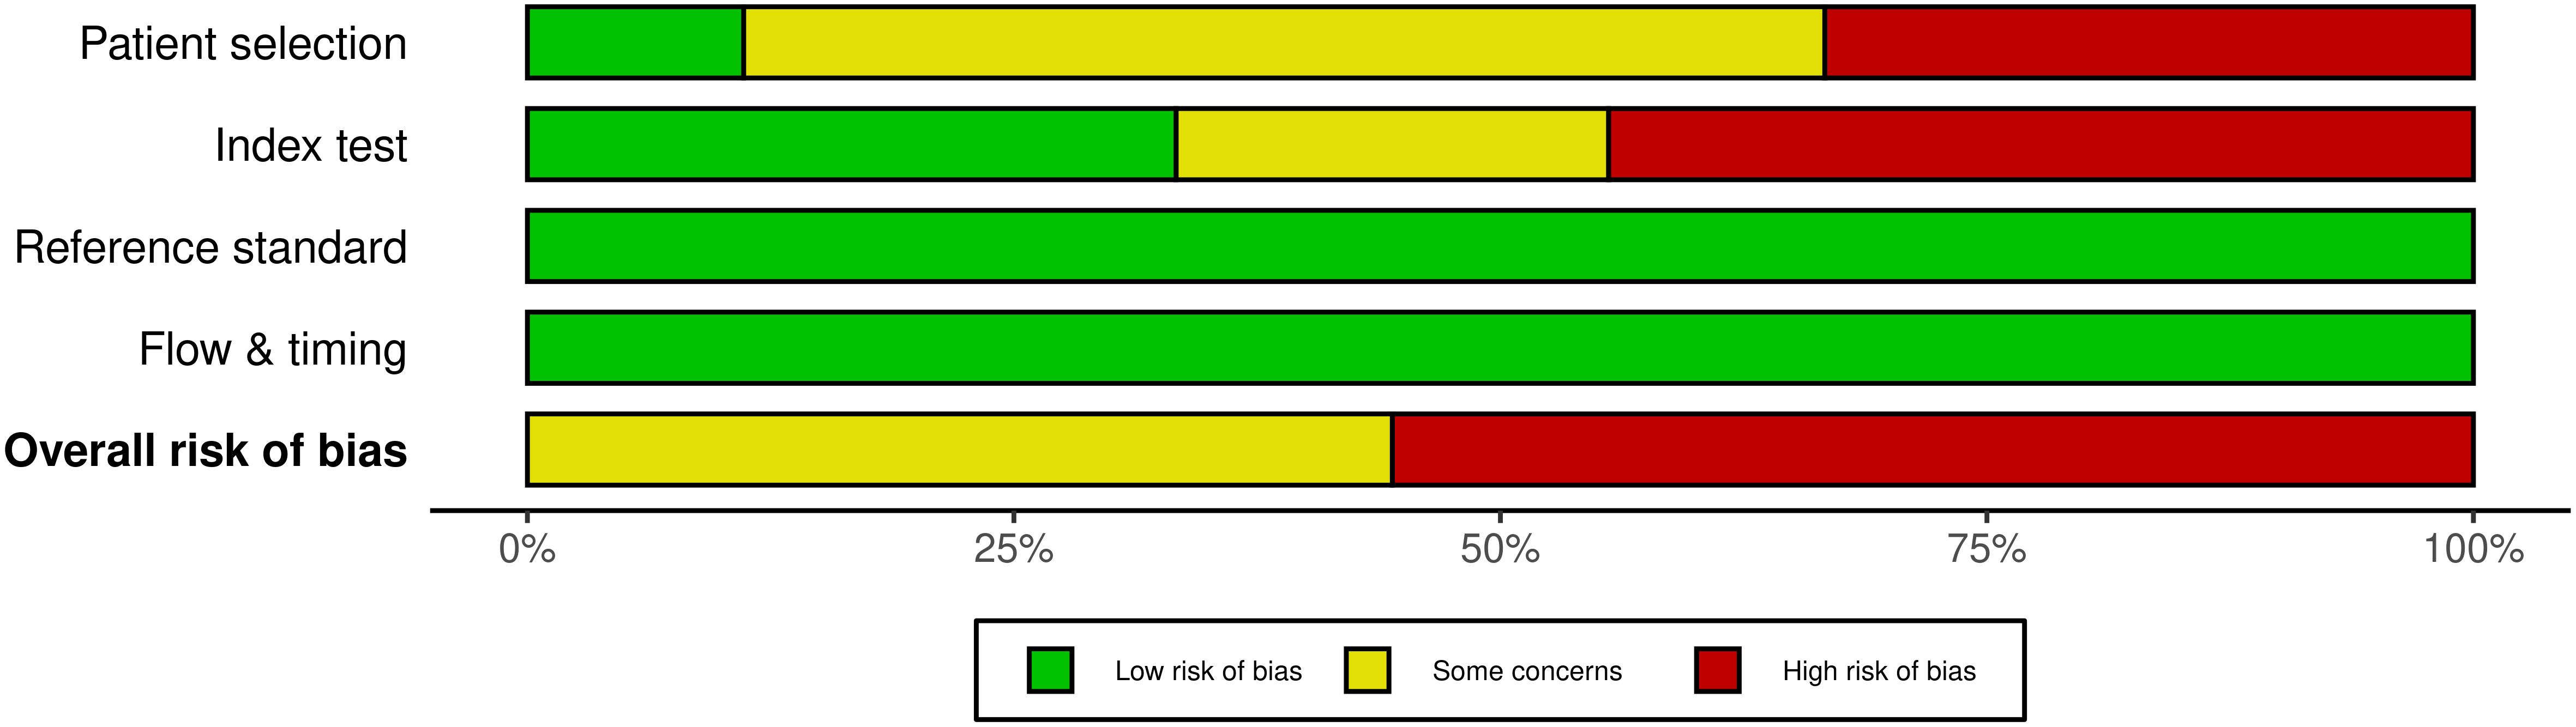 Fig. 3.
The weighted bar plot QUADAS-2 quality evaluation of all included articles.
For the purpose of the present study, the studies were divided into two major groups: group 1, defined as the “healthy” non-diabetic population; and group 2, defined as the “mixed” population including a population of healthy and diabetic patients [3, 23, 24, 26, 28, 29].
The total number of patients screened was 24,693,702, comprising 20,770,702 women in group 1 and 3923 women in group 2. The total number of real large fetuses was 2336. Table 1 (Ref. [3, 7, 23, 24, 25, 26, 27, 28, 29]) shows the main characteristics of the included studies.
| Author | Year | Fetal type | N of pregnancy screened | Diabetic women | Non-diabetic women | Timing of US | Sensitivity | Specificity | PPV | NPV | Overall accuracy | LR+ | AUC |
| Melamed [7] | 2011 | M | 4765 | NR | NR | within 3 days of delivery | 64.6% | 94% | 53.6% | 96.1% | 91.1% | 11.12 | 0.92 |
| Scifres [26] | 2015 | LGA | 1374 | NR | NR | within 31 days to delivery | 75.7% | 76.8% | 22.6% | 97.3% | NR | NR | NR |
| Aviram [3] | 2017 | LGA | 7996 | 339 | 1279 | within 7 days to delivery | 77.1% | 89.5% | 67.2% | 93.3% | 86.9% | 6.34 | 0.95 |
| Shen [27] | 2017 | LGA | 374 | NR | NR | within 14 days to delivery | 48.1% | 97.3% | 76.5% | 91.1% | NR | NR | NR |
| Verger [24] | 2020 | LGA | 253 | 39 | 214 | within 27 days to delivery | 66% | 82.5% | 50% | 90% | 79% | 3.77 | NR |
| Weiss [28] | 2018 | M | 3304 | 515 | 2789 | within 10 days to delivery | 23.4% | 96% | 64.1% | 80.2% | 78.8% | 5.78 | NR |
| Duncan [29] | 2021 | LGA | 1054 | 47 | 76 | 30–34 weeks | 30.1% | 97.5% | 63.8% | 91.4% | NR | 12.0 | 0.64 |
| Bardin [25] | 2022 | M | 5424 | NR | NR | within 3 days to delivery | 68.1% | 93.5% | 58.1% | 95.7% | 90.5% | NR | NR |
| Roeckner [23] | 2022 | LGA | 630 | 58 | 572 | 26–36 weeks | 31.8% | 98% | 71.1% | 90.1% | NR | 22.73 | 0.68 |
Abbreviations: N, number; US, ultrasound; M, macrosomia; LGA, large for gestational age; PPV, positive predictive value; NPV, negative predictive value; LR, likelihood ratio; AUC, area under the Receiver Operating Characteristic (ROC) curve; NR, non-reported.
Overall, the pooled sensitivity was 0.54 (95% CI: 0.40–0.68), while
specificity was 0.94 (95% CI: 0.90–0.96), as reported in Fig. 4, Ref. [3, 7, 23, 24, 25, 26, 27, 28, 29] and Fig. 5. The LR+ was
8.9 (95% CI: 6.2–12.9), and the LR– was 0.49 (95% CI: 0.36–0.65). The
between-study heterogeneity statistics estimated by the Bivariate I
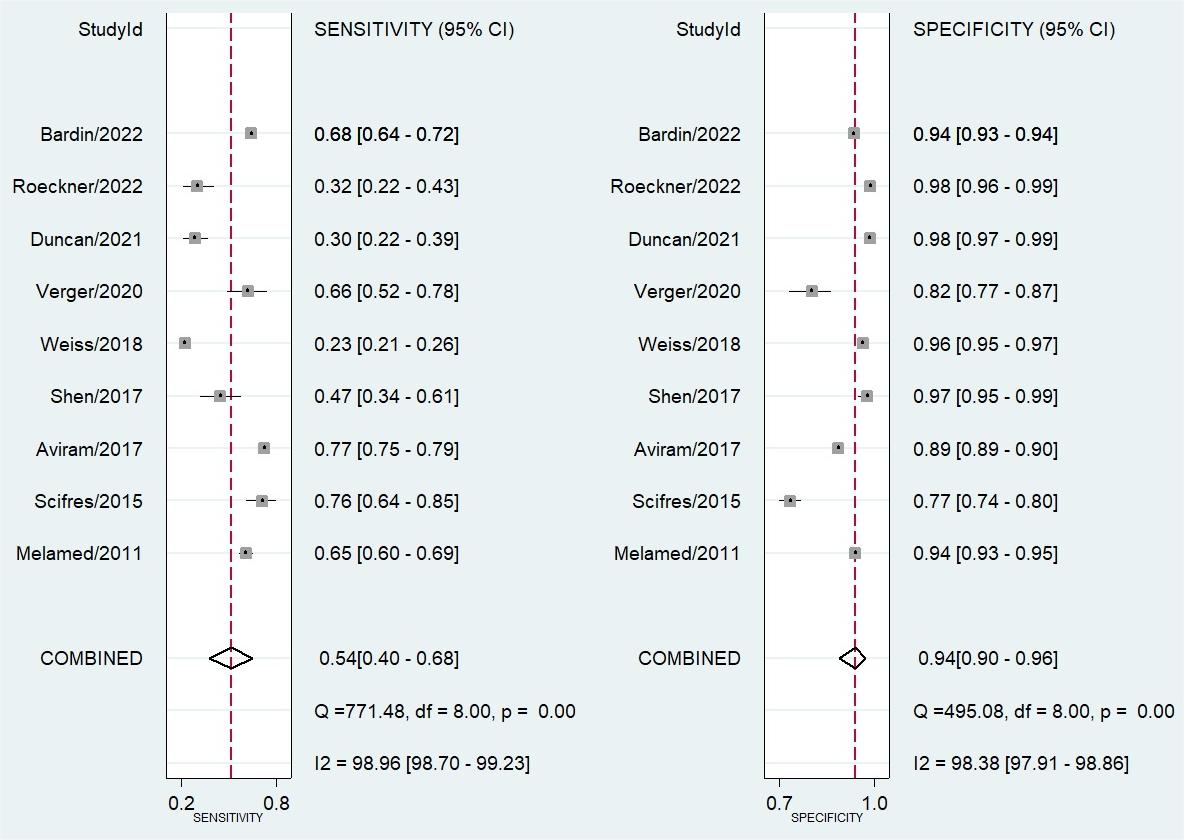 Fig. 4.
Forest plot analysis of the overall sensitivity and specificity of ultrasound in predicting large for gestational age fetuses.
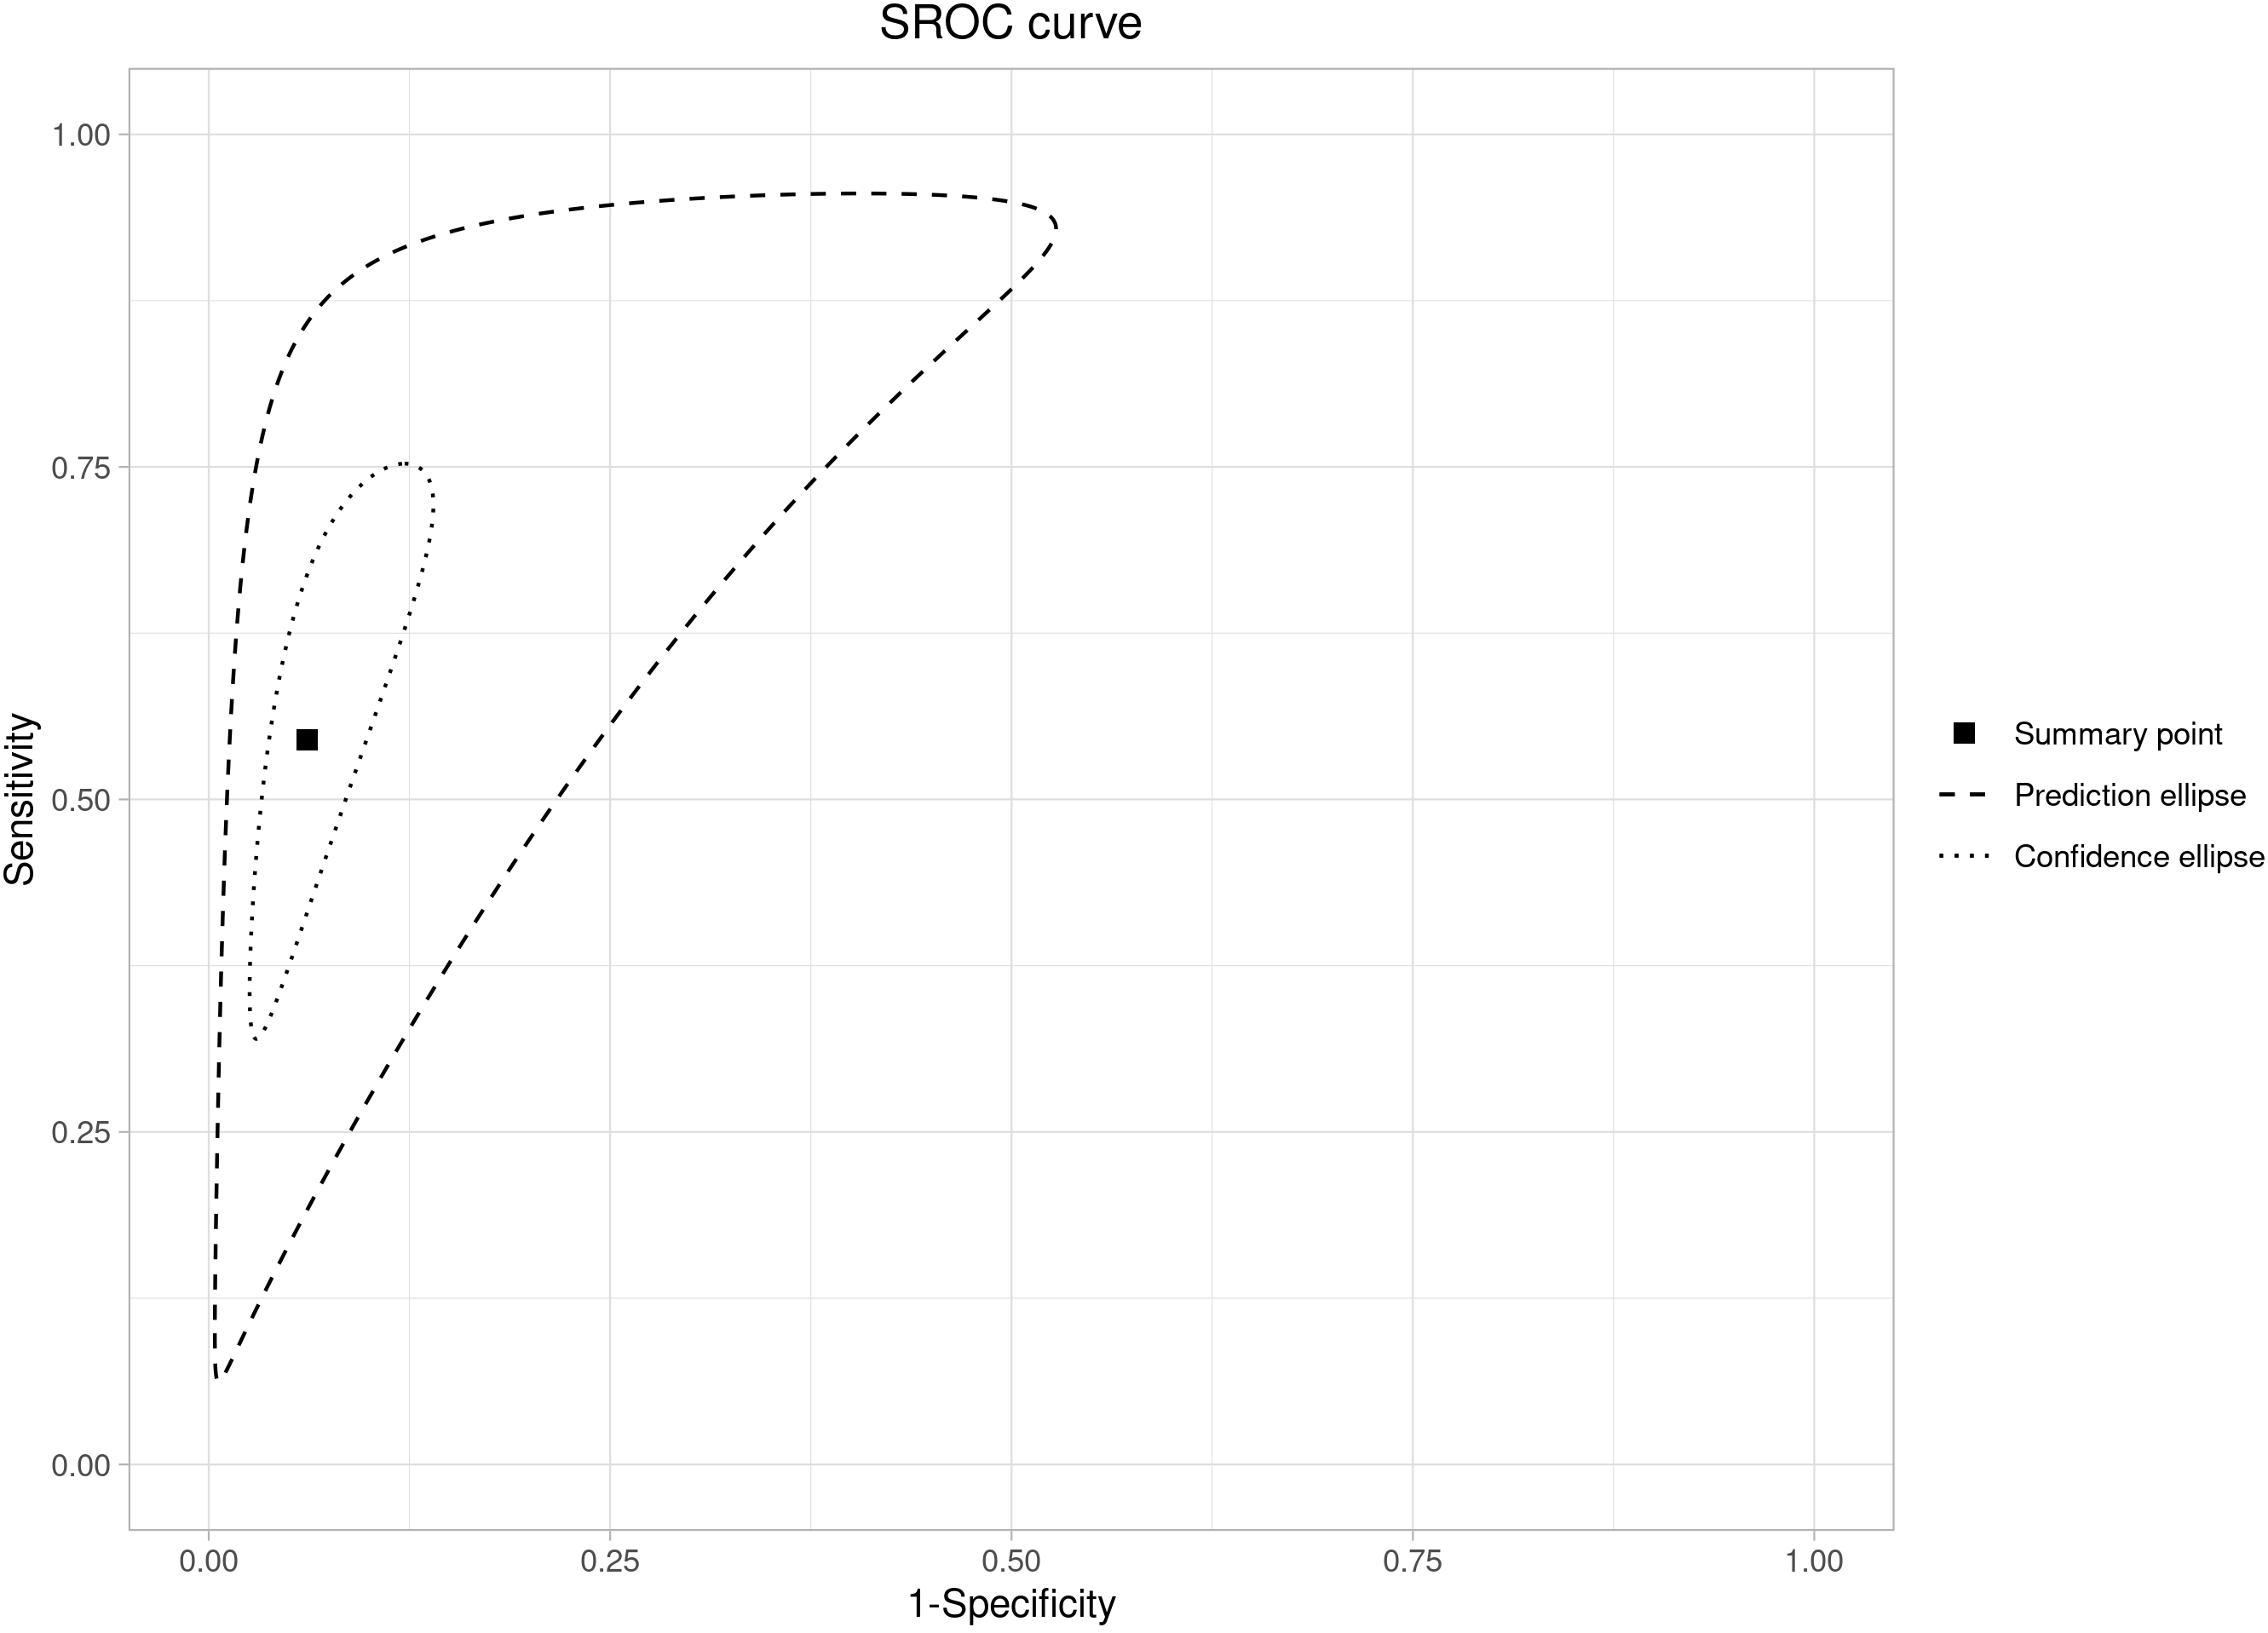 Fig. 5.
Summary ROC curve analysis for sensitivity and specificity of the Hadlock-4 in predicting large for gestational age fetuses.
The subgroup analysis shows a higher level of heterogeneity for the mixed
group (I
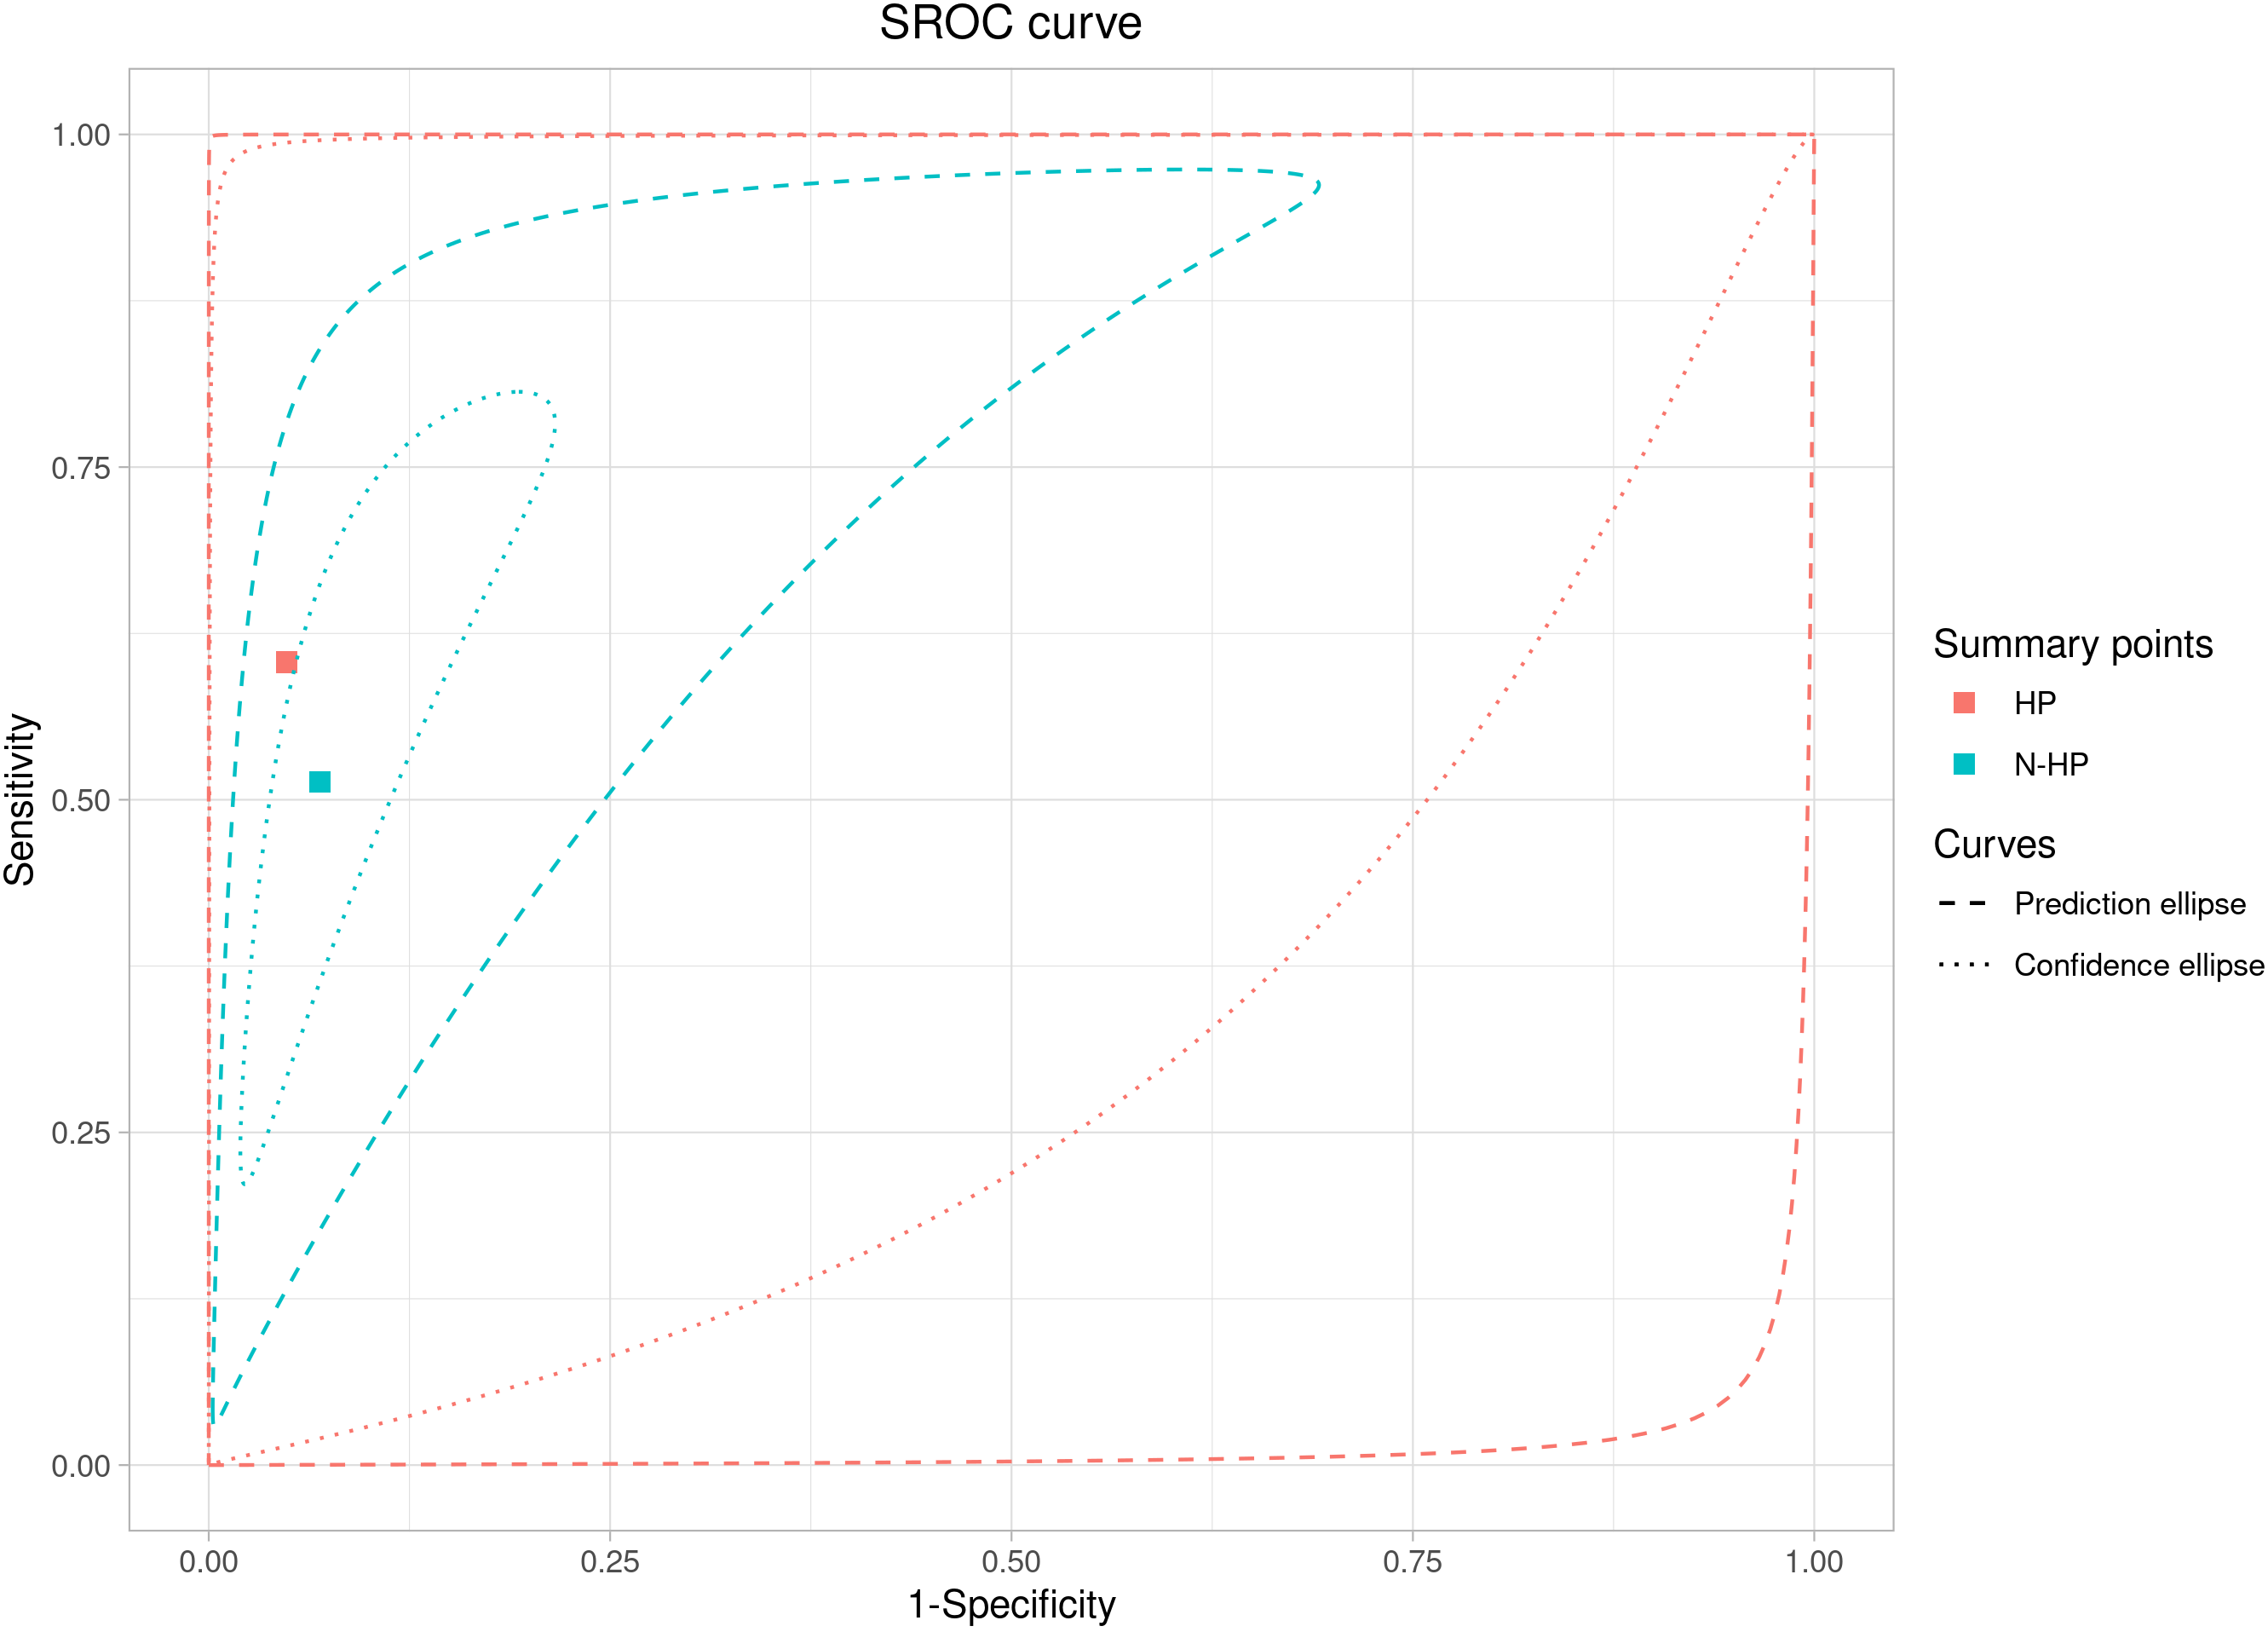 Fig. 6.
ROC curve analysis for the ultrasound prediction of large for gestational age fetuses in the healthy and mixed populations.
The meta-regression analysis for the subgroup (healthy and mixed populations) assessed that the sensitivity and specificity parameters did not differ between the mixed population and the healthy one (p = 0.11). In fact, the relative sensitivity between the mixed population and the healthy one was 0.85 (95% CI: 0.49–1.45; p = 0.57), and the relative specificity between the mixed population and the healthy one was 0.98 (95% CI: 0.91–1.04; p = 0.54).
The results of this study indicate that the overall accuracy of ultrasound in estimating fetal birth weight is in the range of 54% with a specificity of 94%. The data have not changed much if we consider the sub-analysis of the two population groups. In fact, the sensitivity for the non-diabetic population is 60%, while for the mixed population of diabetic and healthy is 51%. The main problem, however, is the high statistical heterogeneity found among the studies, together with the statistical methodology used, which does not allow to reach conclusive studies on the subject.
Several aspects make approaching this topic complex: first, the choice of growth
curves. In planning the study, we had to deal with the question of which growth
curve to consider in the systematic review, and we chose to narrow our assessment
to that of Hadlock-4 only. In fact, in a study that evaluated the performance of
36 growth curves on a total population of 350 newborns weighing more than 4000
grams, the Hadlock-4 formula identified 74% of fetuses weighing
The results of our review show that the accuracy of ultrasound in predicting the birth weight of a large fetus in a population of healthy mothers is nearly superimposable to that of diabetic mothers. This result is in line with the previous study that did not find an association between maternal diabetes and poorer accuracy of ultrasound while showing a negative correlation between obesity and performance of the test, although this association is not strong [33, 34]. Studies that aimed to improve the accuracy of ultrasound for the diagnosis of LGA or macrosomia by introducing maternal features have failed. Body mass index, fetal sex, and multiparity have no significant influence on measurement error [6] or accuracy. Adding clinical and demographic variables to the ultrasound assessment, including maternal weight and body mass index, does not improve the prediction of macrosomia [35]. In fact, if the ultrasound is performed by an experienced sonographer the impact of maternal body mass index is scarce [36]. This concept is reasonable if we consider that ultrasound is an operator-dependent examination and, therefore, it could indicate that the estimation of fetal weight should be performed by an experienced operator, if LGA is suspected. Although this is, to our knowledge, the first study that attempts to evaluate the difference in the detection rate of the ultrasound estimation of fetal weight in the diabetic and non-diabetic populations, there are some limitations.
The first is the small number of included studies characterized by high statistical variability. In many studies, the population included a mixed population of diabetic and non-diabetic women, for which it was necessary to merge the data, and this could have had an impact on the results. Moreover, the majority of studies reported on both LGA and macrosomic fetuses, which frequently overlap but maybe two different entities. In addition, the timing of ultrasound performance varies from 7 to more than 30 days contributing to the variability in terms of detection rate.
The estimation of the fetal weight in diabetic women is of paramount importance as it may help in identifying the optimal time of delivery of LGA fetuses in an attempt to prevent possible complications related to the birth of a macrosomic fetus. This review confirms that the accuracy of ultrasound in predicting large fetuses at birth is only moderate but that its performance is similar in mixed and non-diabetic populations. However, there is a high heterogeneity between studies that impede the drawing of definitive conclusions. Further studies are needed to establish the exact accuracy of ultrasound estimation of fetal weight.
LGA, large for gestational age; AC, abdominal circumference; EFW, estimated fetal weight; BPD, biparietal diameter; HC, head circumference; FL, femur length; GDM, gestational diabetes mellitus; PRISMA, Preferred Reporting Items for Systematic Reviews and Meta-analysis; TP, true-positive; FP, false-positive; TN, true-negative; FN, false-negative; CI, confidence interval; QUADAS-2, Quality Assessment of Diagnostic Accuracy Studies; AUC, area under the Receiver Operating Characteristic (ROC) curve; DOR, diagnostic odds ratio; LR+, positive likelihood ratio; LR–, negative likelihood ratio; FPR, false positive rate; MOR, median odds ratio.
All data generated or analyzed during this study are included in this published article.
IF designed the research study. SB performed the research. VC and SN analyzed the data. SB and IF wrote the manuscript. MG and RR provided help and advice on the study design and final draft. All authors contributed to editorial changes in the manuscript. All authors have red and approved the final manuscript.
Not applicable.
Not applicable.
This research received no external funding.
The authors declare no conflict of interest.
Search strategy
((((((((((obstetric ultrasound) OR (prenatal ultrasound[Title/Abstract])) OR (OB sonography[Title/Abstract])) OR (pregnancy ultrasound[Title/Abstract])) OR (pregnancy echo[Title/Abstract])) OR (pregnant uterus ultrasonography[Title/Abstract])) OR (sonographic estimation[Title/Abstract])) OR (ultrasound estimation[Title/Abstract])) OR (echographic estimation[Title/Abstract])) OR (ultrasonographic estimation[Title/Abstract])) AND ((((((large for gestational age) OR (LGA)) OR (large for date)) OR (large for age)) OR (fetal macrosomia)) OR (macrosomic fetus)).
References
Publisher’s Note: IMR Press stays neutral with regard to jurisdictional claims in published maps and institutional affiliations.