


1 Sackler Faculty of Medicine, Tel Aviv University, 69978 Tel Aviv, Israel
2 Department of Obstetrics and Gynecology, Meir Medical Center, 4428164 Kfar Saba, Israel
3 Helen Schneider Hospital for Women, Rabin Medical Center, 4941492 Petach Tikva, Israel
4 The Liver Institute, Rabin Medical Center, 4941492 Petach Tikva, Israel
Abstract
Background: Previous small-scale studies have reported alkaline
phosphatase (ALP) distribution throughout gestation. This retrospective,
observational analysis aimed to establish a large-scale, week-specific nomogram
of total ALP during pregnancy, and to address physiological parameters that may
impact normal ALP secretion throughout pregnancy. Methods: We analyzed
ALP levels during pregnancy among 5285 healthy women from various ethnicities,
with uncomplicated, term, singleton gestations, who delivered in a single
tertiary medical center, from August 2007 to December 2012. Results: We
found that normal gestational ALP is significantly elevated during pregnancy
compared to a non-pregnant state (132.2
Keywords
- Alkaline phosphatase
- Distribution
- Female
- Nomogram
- Pregnancy
Alkaline phosphatase (ALP) is an enzyme that catalyzes the hydrolysis of organic phosphate-esters in the extracellular space [1]. Several isoenzymes are produced by the hepatobiliary system, skeletal system, gastrointestinal tract, kidneys and placenta [2]. The placental isoenzyme, a heat stable homo-dimeric protein [3], is produced by syncytiotrophoblasts. It is the primary contributor to the corresponding rise in total ALP during gestation [4], along with elevated bone-related ALP, secondary to amplified bone formation [5, 6]. These two studies were the first to validate that ALP gradually increases during gestation, but failed to reveal associations with adverse outcomes [5, 6]. Nevertheless, several case reports demonstrated associations between elevated ALP with hypertensive disorders [7], gestational diabetes [7, 8, 9], preterm birth [10], placental abruption and stillbirth [11]; as well as in uncomplicated pregnancies [12, 13]. Additionally, elevated mid-trimester ALP, may predict preterm birth [14, 15] and low birth weight [16, 17, 18].
It was also suggested to be associated with arterial stiffness as a predictor of cardiovascular disease in non-pregnant individuals [19] and multiparous women [20].
Previous ALP nomograms demonstrated a gradual increase in total ALP, starting early in the second trimester, and peaking in the third trimester just prior to delivery, with maximum levels approximately 2–3 times higher than non-pregnant references [21, 22, 23, 24, 25, 26, 27]. Other than their small size, these studies were limited by lack of consideration of possible effect modifiers, such as body mass index, mode of conception, neonatal sex and the foe to-placental mass.
In our clinical practice, total ALP is often measured during biochemistry serum analysis, but is seldom used as a potential biomarker for adverse pregnancy outcomes. As maternal physiological adaptation confers substantial alterations in several laboratory tests, it is imperative to have high-quality pregnancy-specific distributions of ALP during pregnancy, on which to base pathological deviations. Therefore, we aimed to establish a large-scale ALP nomogram, and to address the role of possible physiological modifiers, and of total ALP levels during gestation — all as a foundation for further research, to explore associations of divergent ALP with adverse pregnancy outcomes.
This study was a retrospective analysis of ALP values during pregnancy, among healthy women from a variety of ethnicities, with uncomplicated singleton gestations, who delivered in a single tertiary medical center, from August 2007 to December 2012.
Eligibility was limited to healthy women, at least 18 years of age, with a singleton gestation, delivering a liveborn, non-anomalous, appropriately grown, term fetus, with at least one total ALP serum measurement during pregnancy.
Only women delivering at term were included, excluding deliveries before 37 + 0
and after 41 + 6 weeks. Gestational age at delivery was determined based on
maternally-reported last menstrual period and confirmed by first trimester
crown-rump length sonographic measurement [28]. We also excluded women with
pre-existing chronic diseases, such as essential hypertension, type 1 or 2
diabetes mellitus, thrombophilia, hypo- or hyperthyroidism, inflammatory bowel
disease and any other liver, kidney and/or heart disease - all were identified
according to ICD-9 diagnosis codes in the maternal electronic health record.
Women with the following gestational complications were also excluded: placental
complications (abruption, placenta accreta or placenta previa); hypertensive
disorders during pregnancy, classified according to American College of
Obstetrics and Gynecology guidelines [29]; gestational diabetes mellitus, defined
according to Carpenter and Coustan’s criteria [30]; oligohydramnios, defined as
amniotic fluid index
Data were retrieved from maternal and neonatal electronic medical records, derived from the comprehensive computerized databases of the Maternal-Fetal Unit, Obstetrical Emergency Room, delivery ward and post-partum hospitalization. Collected data included maternal demographics; medical and obstetrical variables (gravidity, parity, coexisting maternal chronic diseases and gestational-obstetrical complications); labor and delivery outcomes (gestational age at delivery, birth weight, mode of delivery and fetal sex); as well as the results of laboratory studies, specifically alkaline phosphatase, as collected periodically throughout gestation and up to one year before conception.
Blood samples were collected for each woman during routine pregnancy follow-up, from the last menstrual period to delivery. As biochemistry analysis is not routinely collected at fixed intervals during prenatal follow-up, the exact timing and number of ALP samples per woman varied and they were available according to physician discretion.
We documented a minimum of one ALP measurement per participant and up to three measurements - one per trimester; first trimester (0 to 13 + 6 gestational weeks), second trimester (14 to 27 + 6 weeks) and third trimester (28 to 41 + 6 weeks), as available. If more than one ALP measurement was obtained in a trimester, the first was used for analysis.
Also, one pre-conception measurement was collected, the closest available prior to the date of conception.
All blood samples were collected in serum separator gel tubes (BD, Mississauga, Ontario, CA) and ALP measurements were evaluated at the central laboratory of Clalit Health Services, under standard laboratory protocols, utilizing the same technique and equipment, in accordance with the recommendations of the International Federation for Clinical Chemistry [32]. Serum samples were processed by an Olympus AU5430 analyzer (Beckman Coulter, Atlanta, GA, USA), using manufacturer’s standardized reagents (OSR6204). ALP results were reported as units/liter (U/L).
Per manufacturers specification, the reference interval for reporting the result
(in adults
Coefficients of variability (%CV) are 2.1, 1.3, 1.3 (intra assay) and 4.2, 2.3, 1.8 (inter assay) at 38, 360, 1254 U/L, respectively.
Statistical analysis was performed using the SPSS Software (version 21.0, IBM
Corp., Chicago, IL, USA). Data were calculated and presented week-by-week and
per-trimester of pregnancy, providing means (standard errors), medians (ranges)
and percentiles. Data were presented as mean
Differences in means ALP values according to fetal sex (male vs. female),
birthweight (below or above 2500 g, as a reflection of the feto-placental mass)
were also calculated and compared. ALP values during pregnancy and in a
non-pregnant state were compared for a subgroup of women with available ALP
values. For all comparisons, a p-value
Overall, 44,153 women gave birth to singleton, non-anomalous, liveborn neonates at our center during the study period. Among them, 8718 had at least one available ALP measurement during pregnancy. We excluded women with any pre-existing comorbidity (n = 546), preterm or post-term delivery (n = 803), large or small for gestational age (n = 1553), hypertensive disorders (n = 296), gestational diabetes (n = 474), oligo- or polyhydramnios (n = 575), placental complications (n = 191) and chorioamnionitis (n = 4). Additionally, 20 outlier ALP values, all above 1000, were excluded. Accordingly, 5285 women, with 6610 ALP measurements were included.
Demographic, clinical and obstetrical characteristics of the study group, are
presented in Table 1, and compared to the population without an available ALP,
meeting the same inclusion and exclusion criteria. Although there were some
statistically significant differences between the two populations in gravidity
(2.7
| Parameter | Included population | Unavailable ALP | p-value | |
| n = 5285 | n = 23,292 | |||
| Maternal age, years | 32.4 |
32.3 |
0.199 | |
| Gravidity | 2.7 |
2.7 |
0.025 | |
| Parity | 2.2 |
2.3 |
0.001 | |
| Nulliparous | 1906 (36.1%) | 7409 (31.8%) | ||
| Fetal sex | ||||
| Male | 2674 (50.6%) | 11,883 (51.0%) | 0.580 | |
| Female | 2611 (49.4%) | 11,409 (49.0%) | ||
| Mode of delivery | ||||
| Vaginal | 3990 (75.5%) | 17,940 (77.0%) | 0.024 | |
| Assisted | 477 (9.0%) | 1866 (8.0%) | ||
| Cesarean | 818 (15.5%) | 3486 (15.0%) | ||
| Neonatal birthweight, grams | 3213 |
3225 |
0.015 | |
| Data presented as mean | ||||
The distribution of ALP measurements throughout gestation is presented in Table 2, as a nomogram with mean, standard deviation, minimum and maximum range, as well as 2.5th–97.5th percentiles per gestational week. The means and standard errors according to possible modifiers, are presented in Table 3. The mean ALP distribution is graphically presented in Fig. 1, per gestational week and the median, interquartile range and minimum-maximum values, in Fig. 2, per trimester.
| Week | n | Mean |
Range | Percentile | ||||||||
| 2.5th | 5th | 10th | 25th | 50th | 75th | 90th | 95th | 97.5th | ||||
| 4 | 231 | 84.21 |
29.0–415.8 | 32.00 | 37.60 | 42.00 | 50.00 | 63.00 | 83.00 | 164.92 | 230.00 | 289.38 |
| 5 | 300 | 83.10 |
27.0–425.7 | 35.53 | 40.00 | 43.00 | 51.25 | 63.00 | 81.00 | 179.21 | 231.48 | 259.74 |
| 6 | 325 | 75.08 |
23.0–433.0 | 32.15 | 36.30 | 40.00 | 47.00 | 57.00 | 72.00 | 150.48 | 218.80 | 246.60 |
| 7 | 306 | 81.11 |
26.0–779.3 | 32.00 | 34.35 | 39.00 | 45.00 | 57.00 | 74.25 | 183.78 | 247.88 | 290.30 |
| 8 | 267 | 83.05 |
20.0–470.8 | 32.70 | 36.00 | 39.00 | 47.00 | 59.00 | 79.00 | 192.60 | 245.52 | 295.41 |
| 9 | 251 | 97.74 |
27.0–794.0 | 33.00 | 35.00 | 40.00 | 47.00 | 62.00 | 93.00 | 219.80 | 272.32 | 334.55 |
| 10 | 224 | 103.23 |
24.0–544.7 | 34.00 | 36.25 | 40.75 | 49.00 | 64.00 | 144.50 | 216.85 | 248.43 | 346.10 |
| 11 | 190 | 119.26 |
31.0–804.3 | 33.00 | 35.55 | 41.10 | 51.75 | 68.00 | 182.23 | 261.99 | 314.34 | 372.03 |
| 12 | 138 | 105.52 |
21.0–766.8 | 33.00 | 37.90 | 41.00 | 50.00 | 60.50 | 144.05 | 220.11 | 289.44 | 367.49 |
| 13 | 116 | 115.20 |
32.0–516.4 | 33.93 | 37.85 | 40.70 | 49.25 | 70.00 | 154.38 | 257.25 | 334.69 | 394.33 |
| 14 | 128 | 115.92 |
27.0–533.1 | 36.00 | 37.00 | 41.90 | 49.25 | 68.50 | 172.5 | 255.21 | 297.84 | 398.30 |
| 15 | 133 | 116.74 |
24.3–418.5 | 36.70 | 40.00 | 43.40 | 53.50 | 72.00 | 178.15 | 235.58 | 286.54 | 328.65 |
| 16 | 140 | 115.95 |
33.0–658.0 | 35.05 | 41.05 | 47.00 | 53.00 | 68.50 | 161.43 | 269.70 | 322.06 | 368.85 |
| 17 | 137 | 125.17 |
32.0–418.8 | 39.35 | 41.90 | 47.00 | 53.00 | 75.00 | 196.15 | 248.88 | 331.67 | 373.70 |
| 18 | 133 | 127.23 |
32.0–402.2 | 37.05 | 39.70 | 44.00 | 57.00 | 78.00 | 194.45 | 256.16 | 302.89 | 326.27 |
| 19 | 129 | 125.76 |
36.0–411.0 | 39.25 | 42.50 | 49.00 | 56.00 | 77.00 | 185.85 | 269.60 | 299.35 | 338.58 |
| 20 | 122 | 134.06 |
33.0–545.0 | 36.23 | 44.15 | 46.00 | 56.00 | 89.00 | 191.73 | 278.40 | 346.43 | 438.89 |
| 21 | 132 | 126.72 |
4.0–520.1 | 40.00 | 44.65 | 48.00 | 58.25 | 78.00 | 176.08 | 254.29 | 317.83 | 387.22 |
| 22 | 117 | 138.53 |
14.0–498.0 | 37.70 | 42.90 | 50.80 | 59.00 | 79.00 | 196.35 | 296.64 | 391.49 | 422.40 |
| 23 | 171 | 136.77 |
6.0–476.8 | 34.30 | 42.20 | 47.20 | 60.00 | 94.00 | 210.8 | 260.18 | 320.20 | 374.00 |
| 24 | 110 | 146.58 |
41.0–541.0 | 46.88 | 52.10 | 56.10 | 64.00 | 105.60 | 187.15 | 294.16 | 397.24 | 510.07 |
| 25 | 102 | 139.10 |
42.0–410.6 | 47.45 | 52.00 | 56.30 | 65.00 | 100.00 | 200.18 | 267.12 | 293.40 | 370.64 |
| 26 | 91 | 134.96 |
4.0–454.0 | 43.60 | 48.20 | 59.00 | 72.00 | 103.00 | 189.00 | 241.22 | 306.20 | 397.53 |
| 27 | 102 | 135.77 |
39.0–420.1 | 46.88 | 53.15 | 62.00 | 71.75 | 105.50 | 193.70 | 249.44 | 283.85 | 383.11 |
| 28 | 113 | 143.09 |
42.0–367.0 | 49.55 | 54.50 | 65.00 | 78.50 | 111.00 | 193.95 | 257.50 | 302.94 | 348.10 |
| 29 | 108 | 166.88 |
44.0–493.0 | 57.18 | 62.00 | 72.90 | 89.50 | 135.00 | 225.10 | 316.10 | 377.79 | 443.81 |
| 30 | 124 | 156.32 |
59.0–690.8 | 62.25 | 66.75 | 74.00 | 96.00 | 132.55 | 195.90 | 254.30 | 319.50 | 376.80 |
| 31 | 139 | 154.50 |
49.0–356.3 | 63.30 | 69.00 | 81.00 | 98.00 | 141.00 | 195.00 | 255.60 | 295.20 | 339.50 |
| 32 | 129 | 162.47 |
52.0–464.0 | 59.75 | 77.00 | 88.00 | 111.50 | 147.00 | 211.35 | 248.70 | 282.00 | 359.05 |
| 33 | 146 | 163.85 |
62.0–655.1 | 65.68 | 79.70 | 87.40 | 104.08 | 134.00 | 199.20 | 289.68 | 320.96 | 438.63 |
| 34 | 159 | 163.81 |
17.0–495.8 | 72.00 | 79.00 | 87.00 | 119.00 | 152.00 | 192.00 | 244.00 | 291.90 | 362.60 |
| 35 | 157 | 178.80 |
77.0–525.0 | 84.00 | 101.90 | 109.00 | 129.50 | 160.30 | 212.20 | 266.40 | 322.02 | 379.35 |
| 36 | 207 | 177.7 |
77.0–702.0 | 84.00 | 90.80 | 100.00 | 126.00 | 158.00 | 208.00 | 273.48 | 335.08 | 354.80 |
| 37 | 249 | 178.79 |
43.0–657.0 | 80.55 | 90.50 | 104.00 | 130.00 | 172.70 | 210.00 | 249.00 | 315.00 | 360.78 |
| 38 | 243 | 182.07 |
75.0–765.0 | 91.30 | 101.00 | 112.00 | 134.00 | 165.70 | 201.00 | 259.04 | 331.16 | 415.69 |
| 39 | 198 | 186.00 |
64.0–704.0 | 76.95 | 99.00 | 116.99 | 135.75 | 170.00 | 221.23 | 271.55 | 313.50 | 354.15 |
| 40 | 94 | 192.98 |
44.0–551.0 | 72.55 | 103.50 | 113.00 | 142.00 | 189.00 | 229.80 | 261.00 | 350.98 | 451.29 |
| 41 | 3 | 204.30 |
180.7–245.6 | 180.70 | 180.70 | 180.70 | 180.70 | 186.60 | 245.60 | 245.60 | 245.60 | 245.60 |
| Total | 6610 | 128.92 |
||||||||||
| Modifiers | n | ALP (U/L) | p-value | |
| Pregnancy status |
||||
| Pregnant | 2014 | 132.19 |
||
| Non-pregnant | 2014 | 116.67 | ||
| Pregnancy trimester | ||||
| First | 2540 | 95.69 |
||
| Second | 1596 | 123.74 | ||
| Third | 2474 | 166.39 | ||
| Neonatal sex | ||||
| Males | 2684 | 136.03 |
0.510 | |
| Female | 2620 | 133.87 | ||
| Neonatal birthweight |
||||
| 22 | 161.84 |
0.797 | ||
| 2452 | 166.42 | |||
| Maternal age | ||||
| 320 | 145.79 |
0.130 | ||
| 25130 | 3178 | 135.59 | ||
| 1795 | 131.67 | |||
| Parity | ||||
| Nulliparous | 3393 | 136.40 |
0.211 | |
| Multiparous | 1911 | 132.41 | ||
| Data presented as mean | ||||
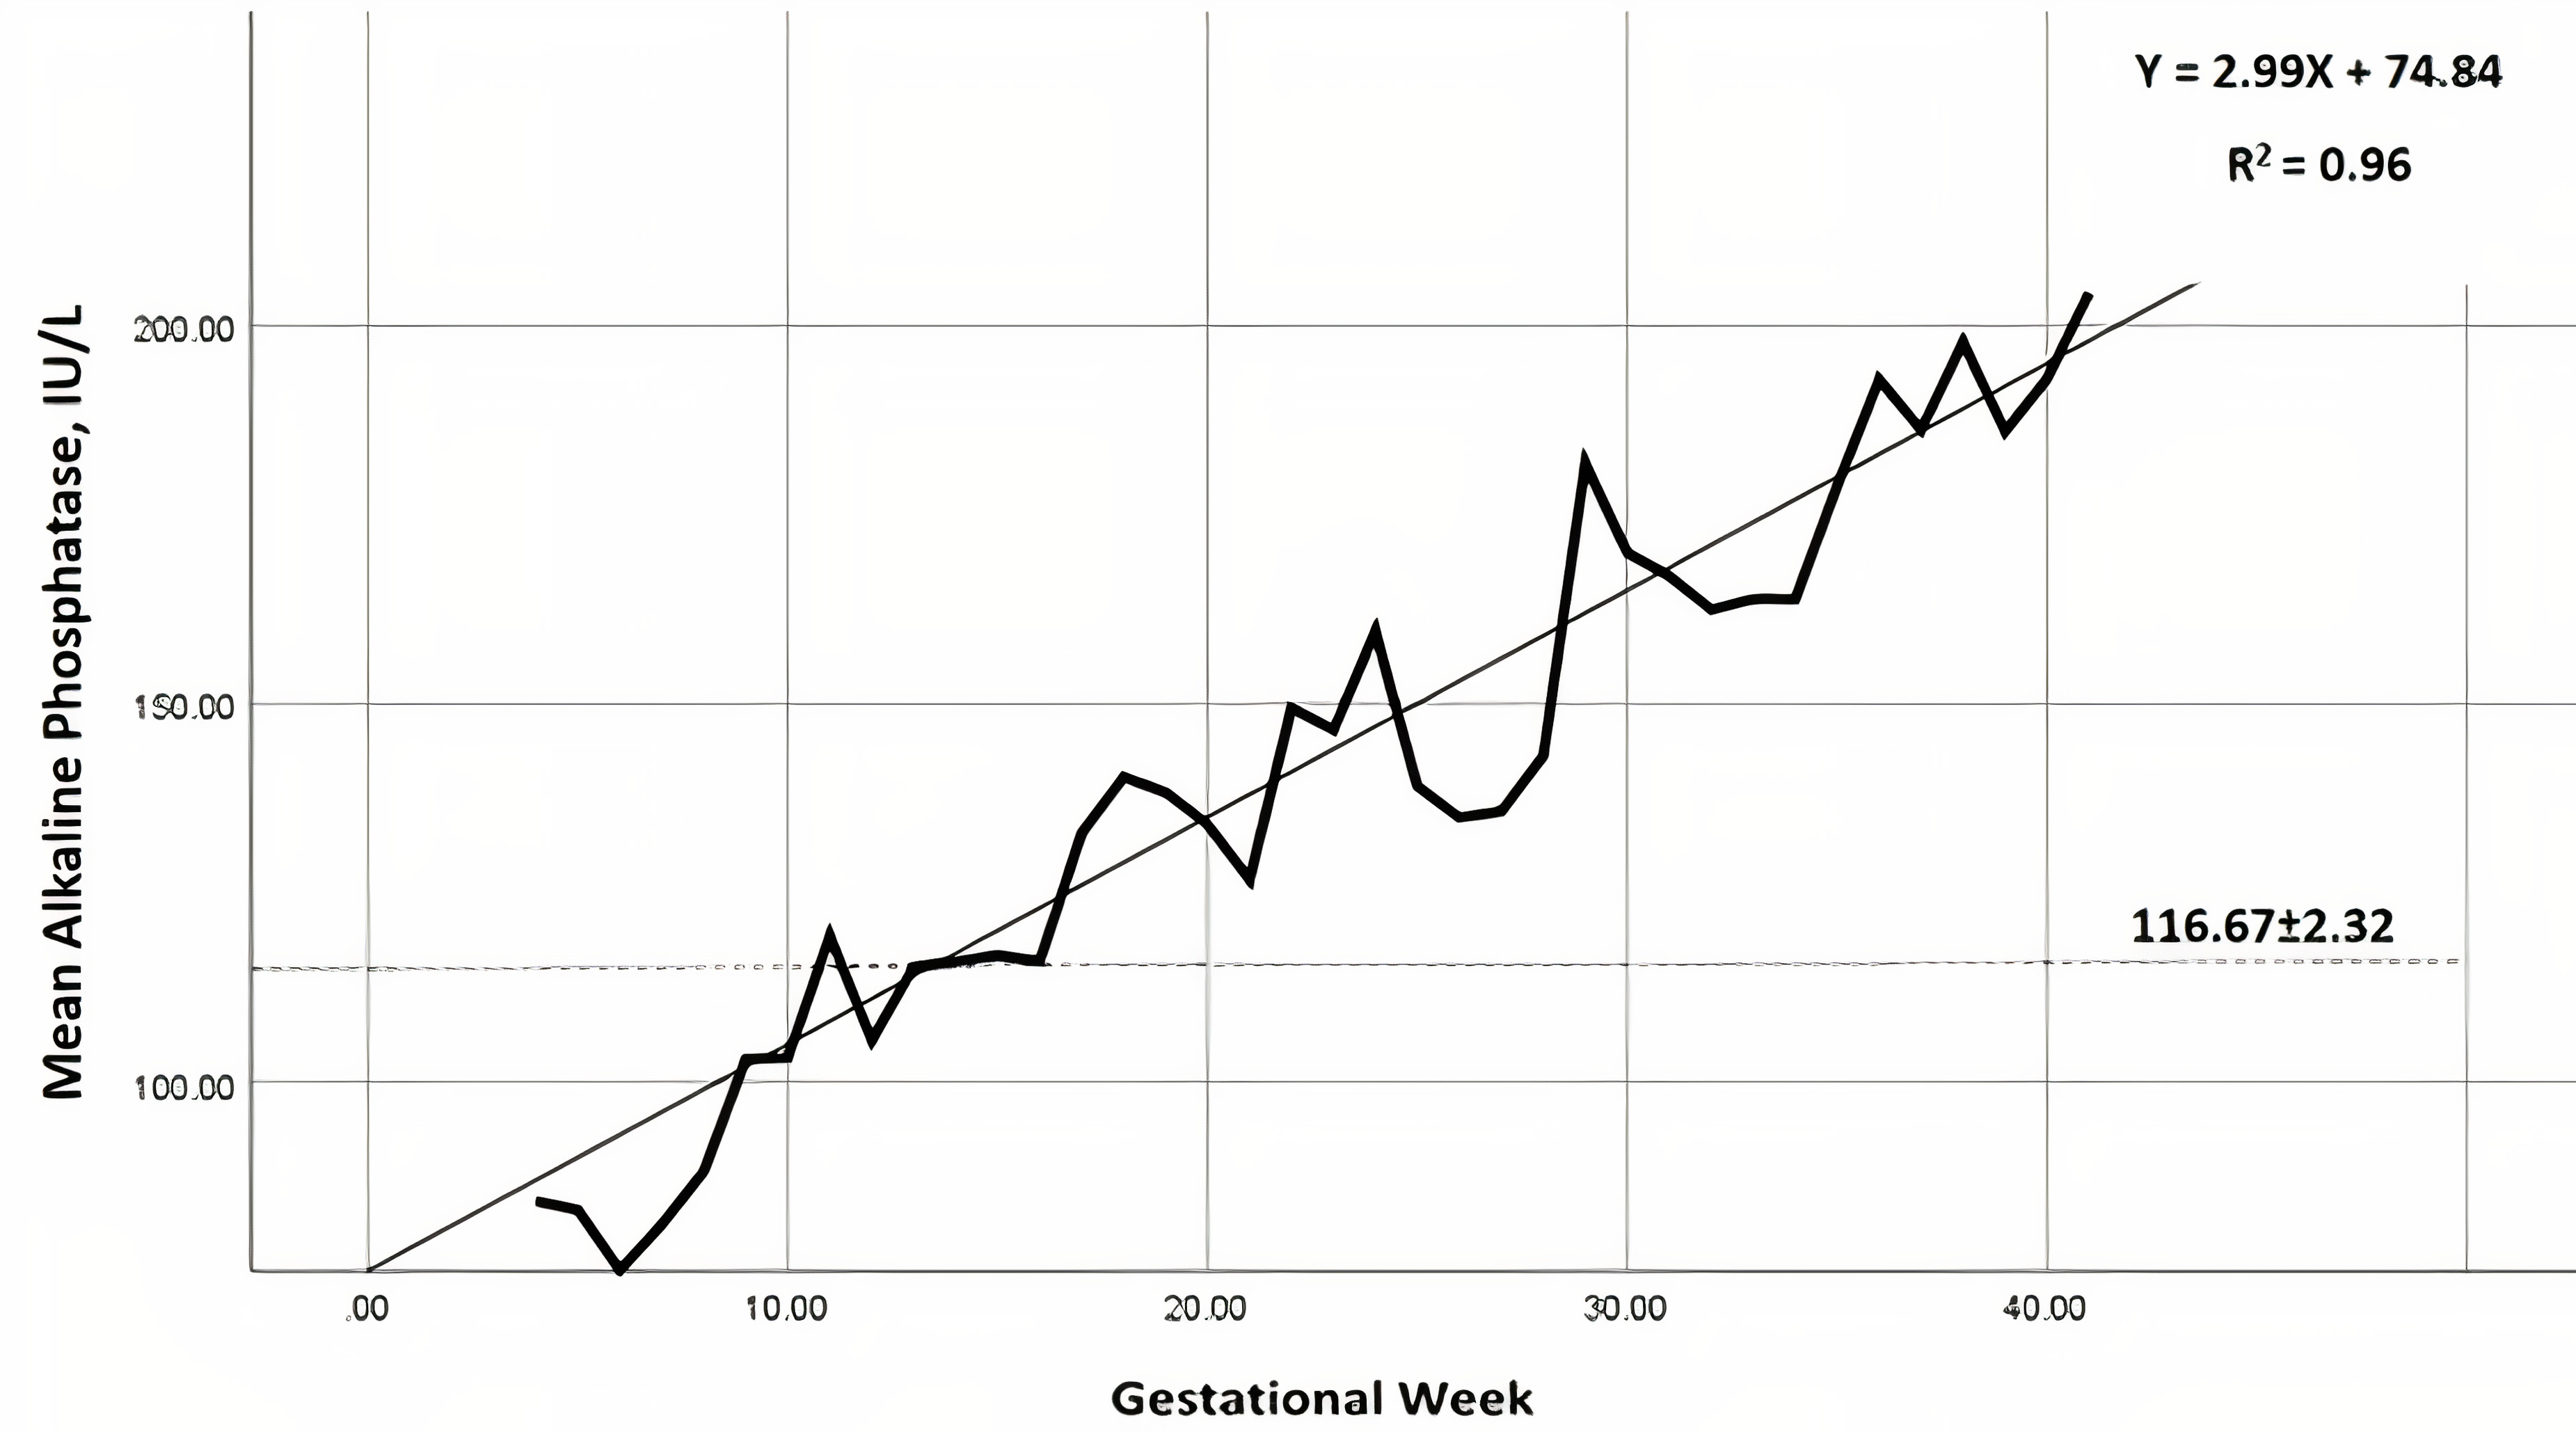 Fig. 1.
Nomogram of mean alkaline phosphatase (IU/L) levels, throughout
gestation (━━), per gestational week. Linear regression line is presented (___), as
well as the reference (- - -) for non-pregnant women in the study population
(116.7
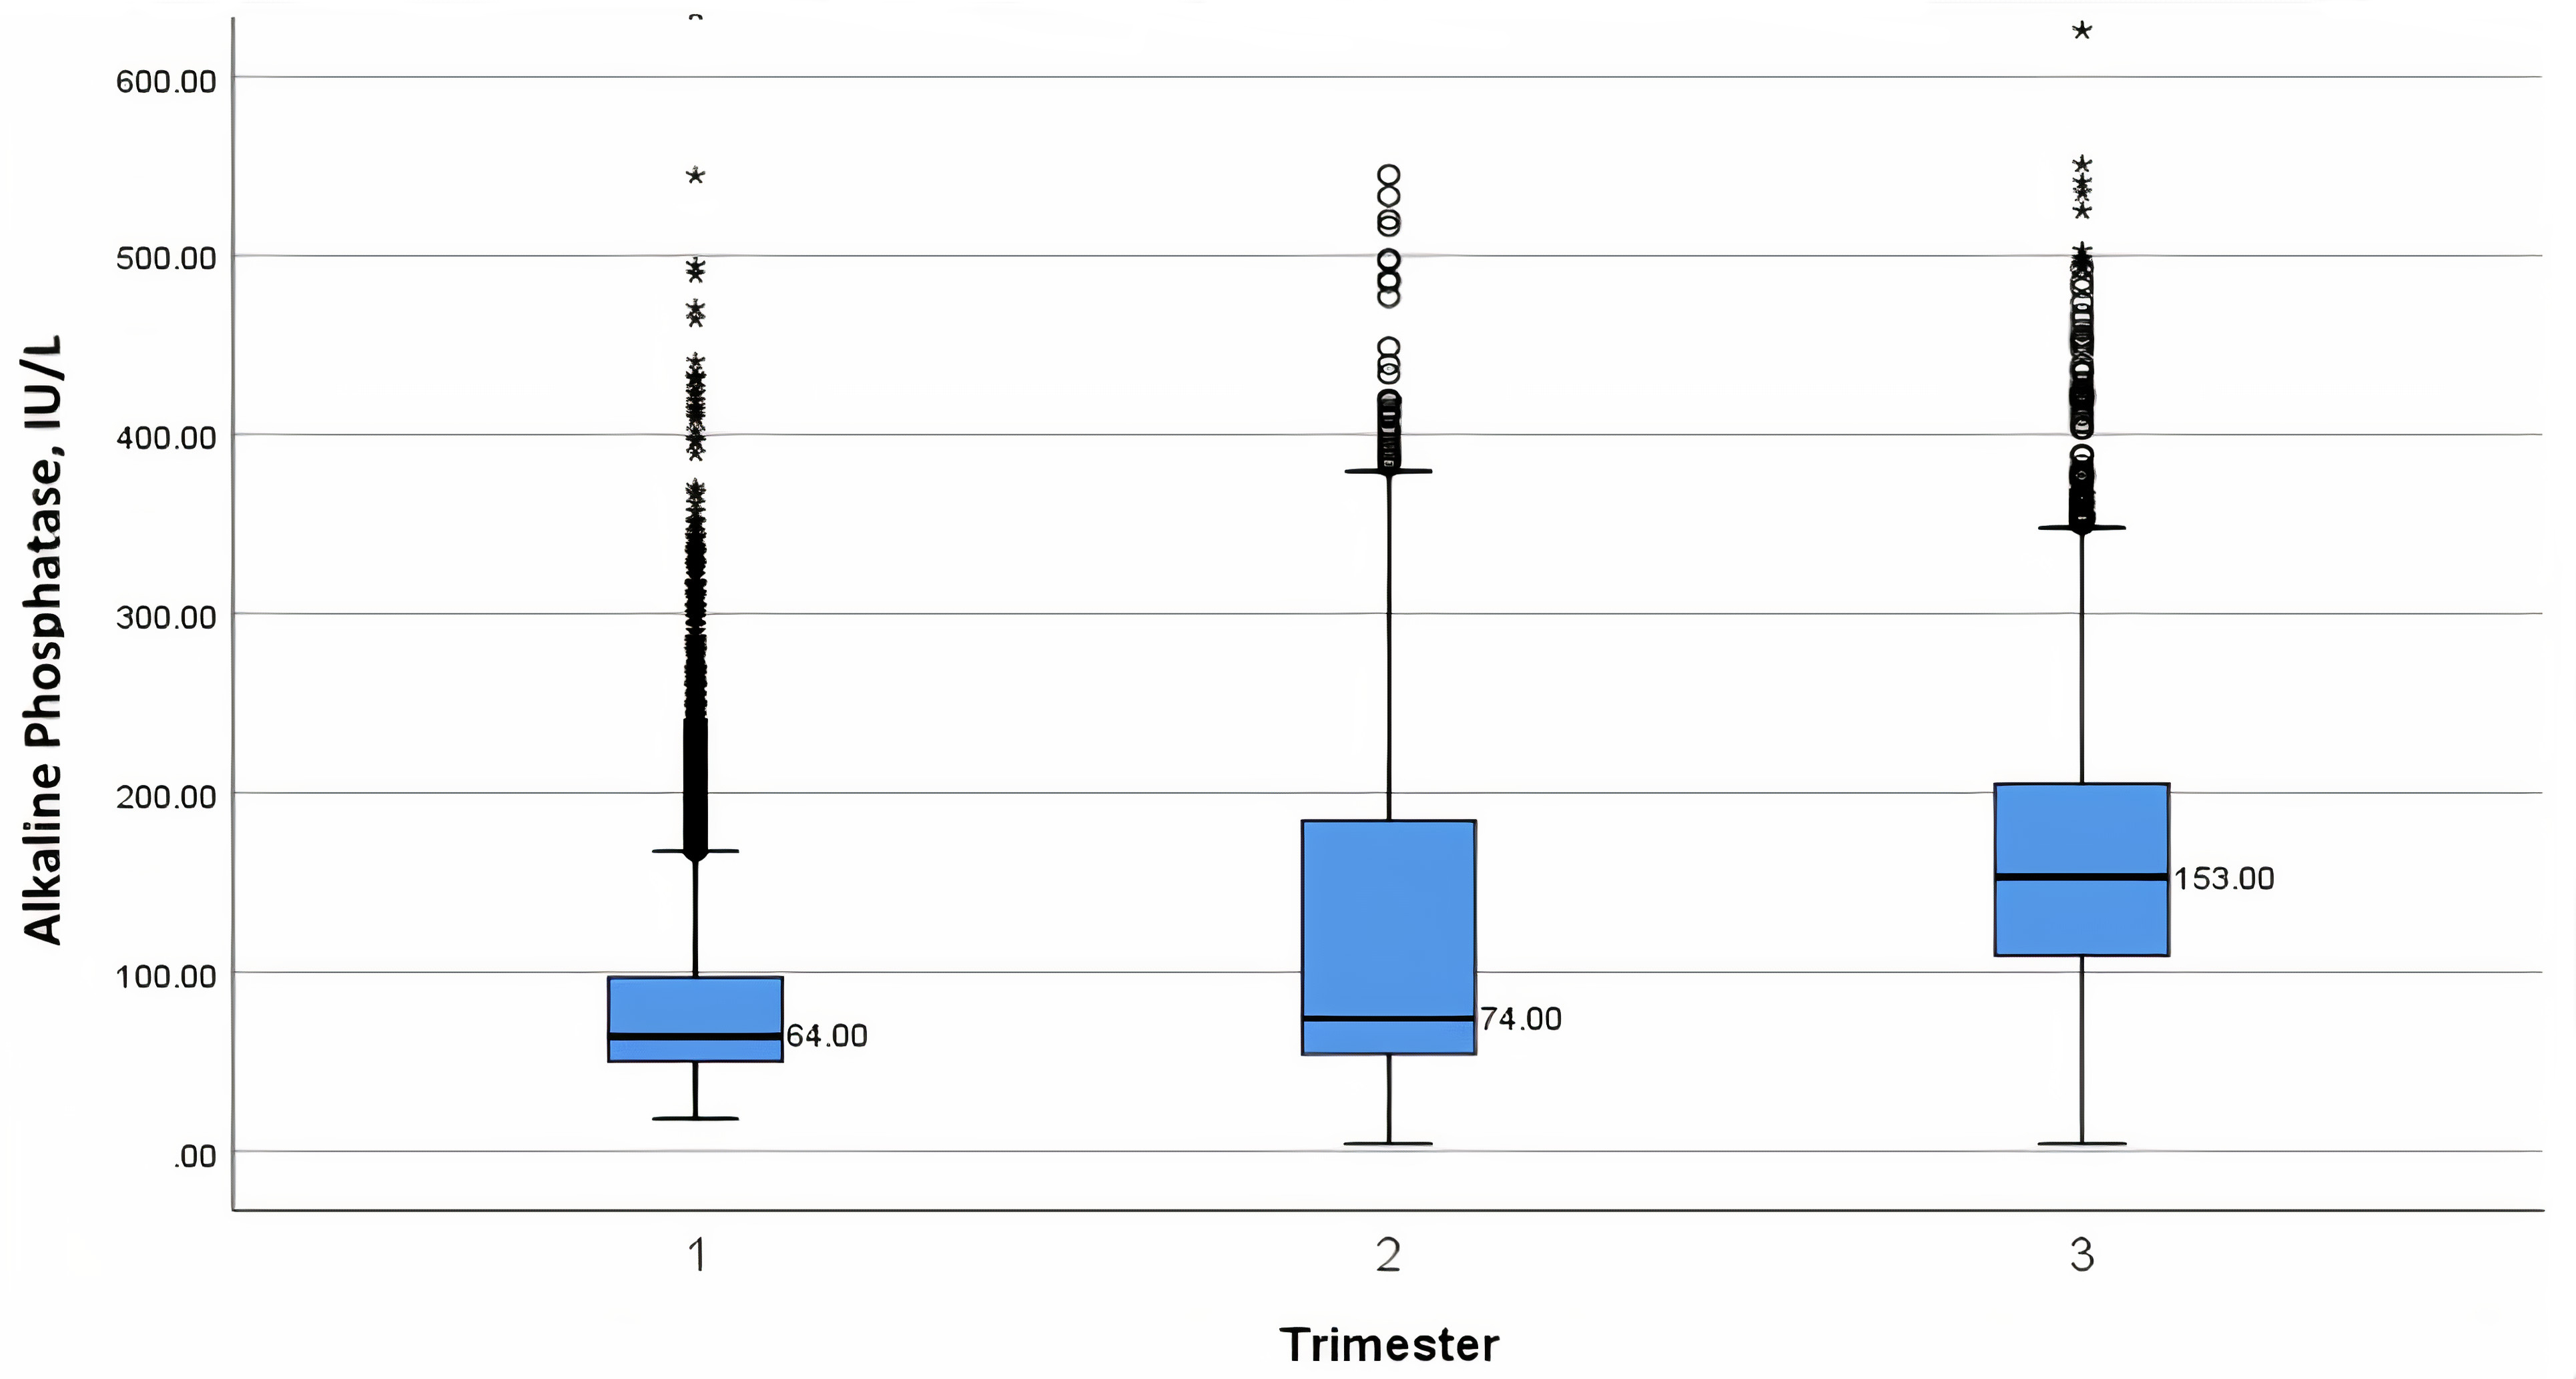 Fig. 2.
Box-plot nomogram of median alkaline phosphatase (IU/L) levels throughout pregnancy, per trimester week - with 25th and 75th interquartile ranges, as well as minimum and maximum values.
The association of possible physiological modifiers to ALP levels are presented
in Table 3. ALP is significantly elevated during pregnancy compared to a
non-pregnant state (132.2
We constructed an ALP nomogram among healthy women during the course of an uncomplicated pregnancy. Our main results indicate that ALP gradually increases during pregnancy, starting from early gestation and that other than gestational week, physiological parameters of maternal age, fetal sex and neonatal birthweight, did not affect the levels.
In accordance with our results, previous studies reported similar trends for both total and heat stable ALP, throughout pregnancy [21, 22, 23, 24, 25, 26, 27]. In a longitudinal study among 52 women, Larsson et al. [24] evaluated 25 common biochemical indices, including ALP. Similar to our results, they demonstrated rising ALP levels through gestation. However, their cohort was smaller and less homogenous, included preterm deliveries and small for gestational age newborns, as well as mothers who were smokers and used medication. Abbassi-Ghanavati et al. [25] established a normal reference range during pregnancy for multiple blood components, derived from a comprehensive literature review. Specifically, for ALP, they reported the upper and lower limits during a non-pregnant state and per trimester, based on 5 prior publications [22, 23, 24, 27, 33], again demonstrating gestational rise of ALP. Selected comparisons of ALP levels between the available results of two studies [24, 25] and our own, are presented in Table 4 (Ref. [23, 24]).
| Timing of measurement | Current study | Larsson [23] | Abbassi-Ghanavati [24] |
| 7–17 weeks | 33.0–334.5 | 34.8–79.8 | - |
| 17–24 weeks | 39.0–374.3 | 39.0–105 | - |
| 24–28 weeks | 47.2–388.9 | 46.2–115.2 | - |
| 28–31 weeks | 57.3–376.5 | 52.8–118.8 | - |
| 31–34 weeks | 65.0–353.7 | 66.6–177.6 | - |
| 34–38 weeks | 80.0–360.4 | 87.6–228.6 | - |
| First trimester | 33.0–315.3 | - | 17–88 |
| Second trimester | 36.0–366.6 | - | 25–126 |
| Third trimester | 58.0–368.0 | - | 38–229 |
Okesina et al. [21] in a longitudinal study of 67 pregnant women, determined the rise in total ALP and demonstrated that both placental and bone isoenzymes contribute to this increase. Placental ALP appears in serum as early as 13 weeks and becomes a significant contributor beyond 16 weeks, whereas bone ALP is a significant contributor at 32 and 38 weeks.
This is the first study to demonstrate that other than gestational age, possible modifiers of fetal sex, birthweight (as a surrogate for the fetal-placental mass) and maternal age did not affect ALP. This observation contradicts a small-scale study by Gol et al. [26], who compared total and placental ALP, according to fetal sex, among 30 women. Unlike our results they concluded that fetal sex affects ALP levels, across all gestational ages, with ALP significantly higher in mothers carrying a female versus a male fetus.
Establishing a normal reference range is of paramount importance, especially during pregnancy. Maternal adaptation to pregnancy induces profound physiological changes, in all organ systems, resulting in substantial changes in multiple blood analytes. An appropriate, robust, gestational nomogram is important to truly identify normal and pathological deviations. As there are only limited nomograms for pregnancy, and those for ALP are minimal, we constructed a large-scale, week-specific nomogram. Our planned research will use this nomogram to evaluate the association between abnormal ALP and pregnancy complications, all of which were not included in the current study.
We speculate that ALP is released following placental damage. Accordingly, higher than normal ALP may be associated with adverse pregnancy outcomes. This pathogenesis was occasionally supported by compatible histological findings associated with elevated ALP and pregnancy complications, such as placental infarcts [10, 11], abnormal syncytial and villus formation [12], chronic histiocytic intervillositis [34], and uteroplacental vascular disease [35]. Alternatively, others have suggested a different pathway through which placental ALP rises insufficiently in pregnancies complicated with fetal growth restriction and preeclampsia [36, 37], possibly reflecting decreased placental mass or malfunction, and relative ALP deficiency. Interestingly, there is a possible role in this mechanism to insufficient plasma level of the ectopic mineralization inhibitor inorganic pyrophosphate, which is a substrate of alkaline phosphatase [19].
The current study is not without limitations, mainly due to its retrospective design and the lack of some data (body mass index, mode of conception and smoking status), which may theoretically impact ALP levels. Additionally, we analyzed total ALP only and not the direct placental fraction. However, previous studies have demonstrated that placental isoenzymes have a half-life up to 7 days [38], which is the longest of all isoenzymes, and as such, have the most impact on the total ALP [5, 21]. As we included only healthy women, without any chronic or gestational morbidity, we safely assume that the rising levels of ALP represent the placental component and not a pathological source, from either maternal or fetal origin. Comparing the included and excluded population, i.e., those without an ALP measurement, demonstrated that the excluded population was similar to those included, confirming that there was no selection bias.
In conclusion, normal ALP levels associated with pregnancy are higher than in the non-pregnant state, gradually increasing from the end of the first trimester. This should be accounted for when evaluating lab results obtained for pregnant woman. In future studies, this nomogram can serve as the basis for comparison between a normal population and those with various pregnancy complications, to determine how ALP is affected during pathological events, the corresponding placental histopathology and whether ALP has a predictive role for adverse pregnancy outcomes.
NA—Conceptualization; Data curation; Investigation; Methodology; Validation; Supervision; Visualization; Writing - review & editing. Final approval. KNS—Investigation; Methodology; Validation; and data analysis and interpretation. LS, OSA, AB, EK—Data curation, Review and editing, Final approval. EH—Conceptualization; Data curation; Investigation; Methodology; Project administration; Supervision; Validation; Visualization; Roles/Writing - original draft; Writing - review and editing, Final approval. All authors agreed to be accountable for all aspects of the work in ensuring that questions related to the accuracy or integrity of any part of the work are appropriately investigated and resolved.
The study was approved by the Institutional Review Board of Rabin Medical Center (Approval No. 0121-13-RMC). Informed consent was waived due the retrospective design of the study.
The authors thank Faye Schreiber, MS for editing the manuscript. Also, we thank all the peer reviewers for their opinions and suggestions.
This research received no external funding.
The authors declare no conflict of interest.