


1 Department of Radiological Science, College of Health Sciences, Catholic University of Pusan, 46252 Busan, Republic of Korea
2 Departments of Radiology, Masan University, 51217 Gyeongsangnam-do, Republic of Korea
3 Department of Obstetrics and Gynecology, Ilsin Christian Hospital, 48724 Busan, Republic of Korea
4 Department of Radiological Science, College of Nursing, Healthcare Sciences & Human Ecology, Dong-eui University, 47340 Busan, Republic of Korea
Abstract
Background: In Korea, fetuses are currently assessed using ultrasound
data collected from foreign subjects. This study aimed to propose independent
reference values for the transverse cerebellar diameter (TCD) in Korean fetuses
to predict gestational age (GA) and compare the TCD values among different
countries. Methods: A total of 1819 healthy singletons with GAs of
15–37 weeks were retrospectively analyzed. The TCD was measured in the
transcerebellar plane of the fetal head. TCD percentiles were calculated for
different GAs, and a regression model was created to predict GA. Bland–Altman
analysis was performed to examine the differences in the mean TCD and variations
in the TCD among different countries. Results: The TCD ranged from 1.48
to 4.76 cm with a mean of 2.7
Keywords
- Gestational age
- Standard value
- Transverse cerebellar diameter
Measuring different parts of a fetus’s body using ultrasound is important to determine the gestational age (GA) and assess the growth and development of the fetus, which are closely associated with the risk of morbidity and mortality during the perinatal period. The biparietal diameter (BPD), abdominal circumference (AC), and femur length (FL) are commonly measured using two-dimensional ultrasound to assess fetal growth and differentiate between normal and abnormal growth [1]. Thus, it is important to select appropriate reference values for biometric indices according to GA for accurate biometric measurement and assessment. Accurate GA prediction allows for the estimation of delivery date and detection of various complications, including fetal growth retardation, premature birth, and fetal macrosomia, as part of prenatal care [2, 3]. Studies have reported that the transverse cerebellar diameter (TCD) may be measured using ultrasound to assess fetal growth and development during the gestation period [4]. The TCD has a higher prediction accuracy for GA and diagnostic accuracy for intrauterine growth restriction (IUGR) than other physical indices and is a highly trusted index used when mothers attend their first hospital visit without knowledge of their GA [5].
Efforts to determine the reference values for different fetal biometric indices at different GAs have continued since the 1960s. These reference values are affected by genetic factors such as the fetus’s sex and ethnicity, and environmental factors such as the mother’s gravidity, age, nutritional status, disease, and socioeconomic status; thus, different ethnicities or countries require different reference values for fetal biometric indices [6]. However, in Korea, fetuses are currently assessed using ultrasound data collected from foreign subjects [7].
The study aimed to measure the TCD in a large population of Korean fetuses to establish a quantitative index for predicting GA and compare the reference value for the TCD in Korean fetuses with those in fetuses from other countries. Furthermore, we aimed to propose independent reference values for Korean fetuses.
A total of 1819 pregnant women with GA of 15–37 weeks who were regularly examined at an obstetrics and gynecology hospital in South Korea between March 2018 and March 2021 were included. The mothers had regular menstrual cycles and accurately recalled their last menstrual period (LMP). All mothers and their fetuses were healthy. Mothers with gestational diabetes and hypertension, preeclampsia, chromosomal malformations, multiple pregnancies and intrauterine growth restriction confirmed by Doppler examination that could affect fetal growth were excluded from the study. GA was determined with respect to the LMP. Mothers with obstetric complications or conditions that could affect fetal growth were excluded. Measurement data stored in the Picture Archiving and Communication System were retrospectively analyzed in this cross-sectional study. Informed consent for inclusion was obtained from all subjects before they participated in the study.
The borders of the thalamus, cavum septum pellucidum, and third ventricle were examined in the transcerebellar plane of the fetal head [8]. The TCD was measured in an outer-to-outer fashion after observing the characteristic butterfly-like appearance of the cerebellar hemisphere and the cerebellar vermis at the center of the cerebellum on either side of the midline [9] (Fig. 1). A sonographer with 20 years of experience performed two measurements and took the mean value. A convex array probe (Voluson E10, GE Healthcare, WI, USA) with a frequency of 3.5 MHz was used.
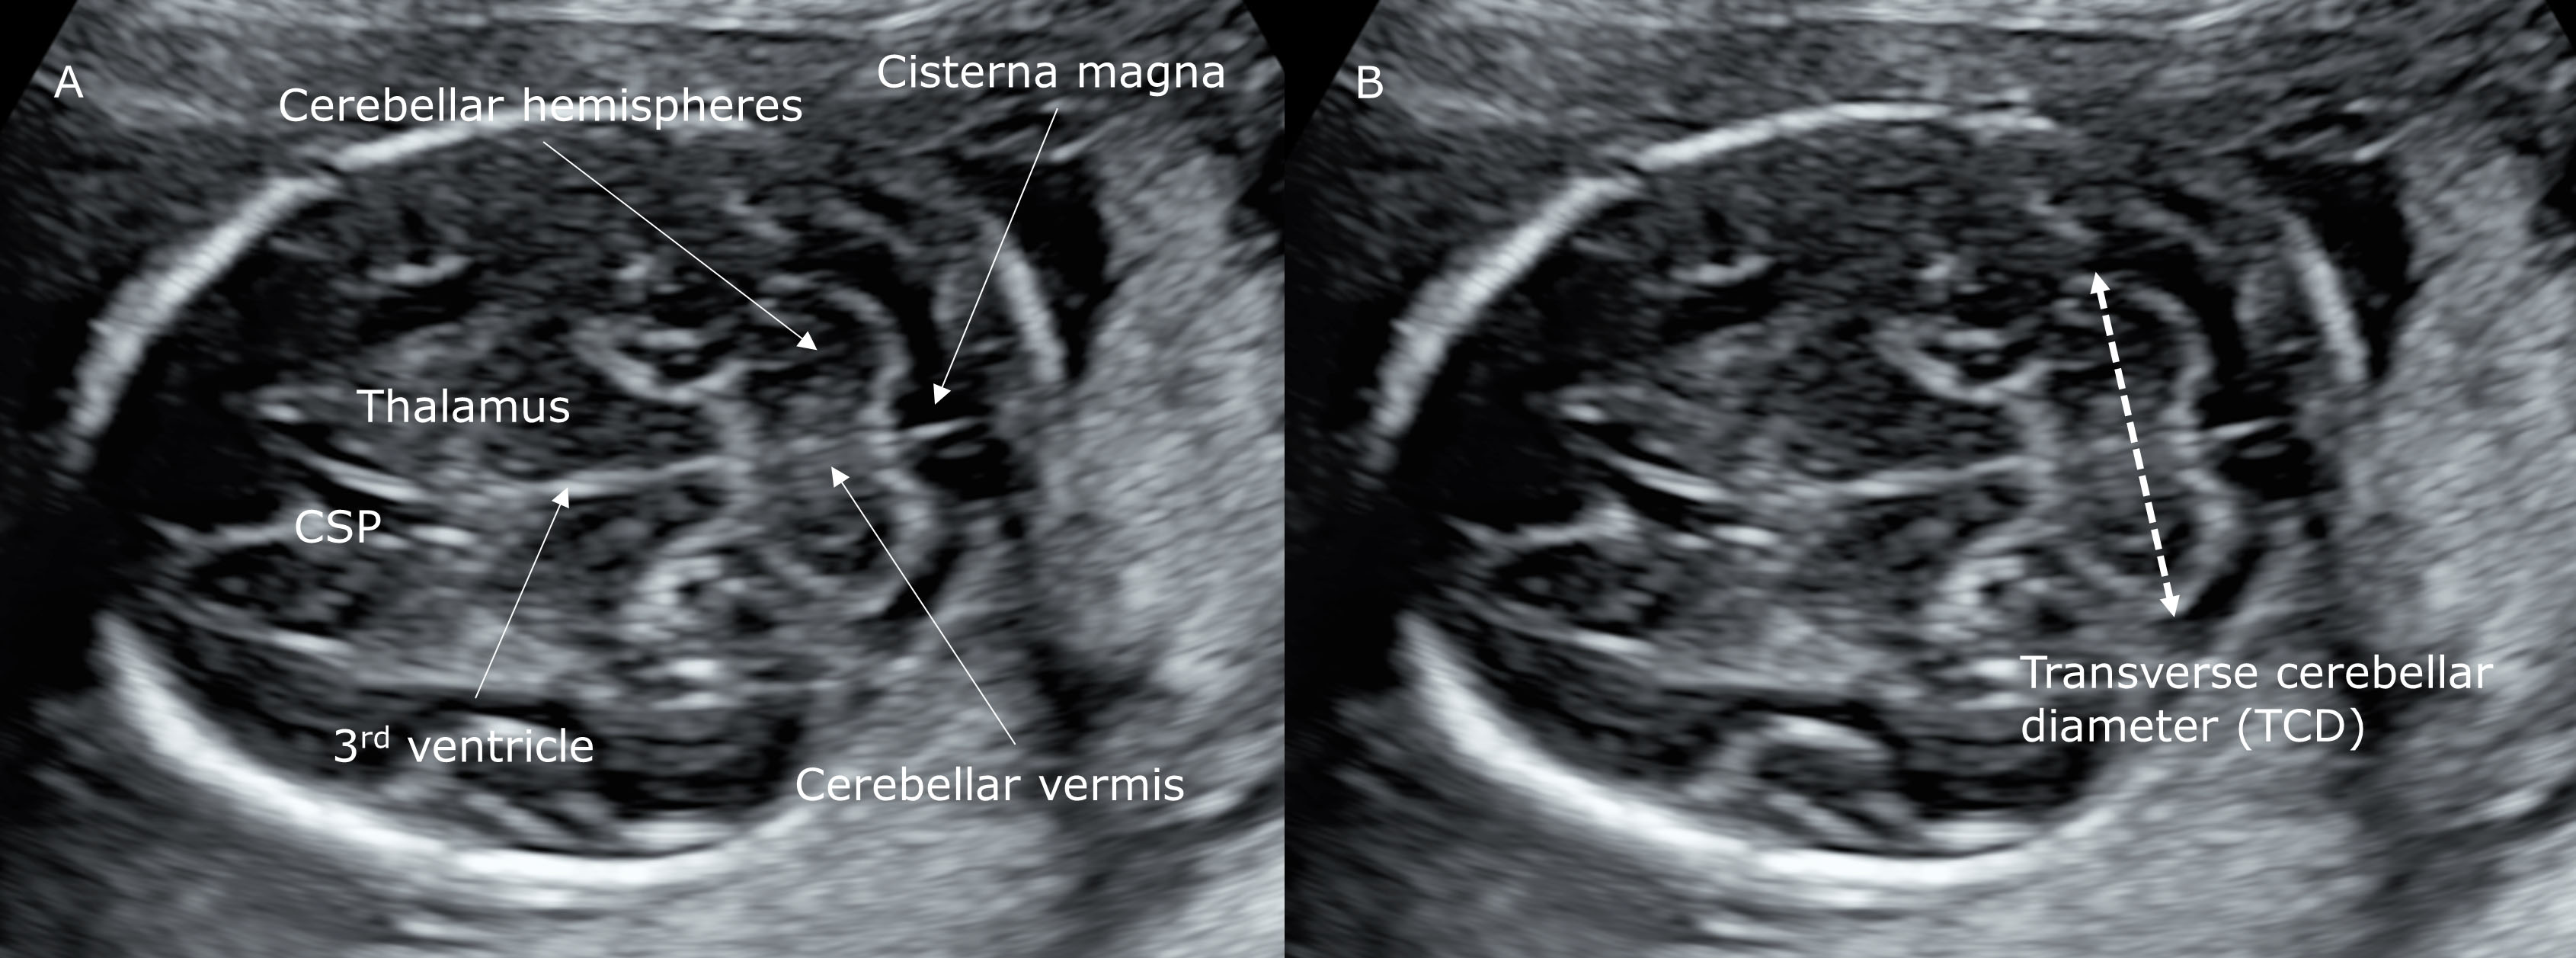 Fig. 1.
Transverse cerebellar cross-sectional ultrasound image of the fetal head at 21 weeks and 2 days of gestation. The figure shows the thalamus, cavum septum pellucidum, third ventricle, cerebellar hemispheres, and cerebellar vermis (A) and TCD measurement (B). CSP, cavum septum pellucidum.
Percentiles were obtained for the mean TCD value descriptive statistics. General
characteristics of pregnant women were classified using frequency analysis. A
percentile chart was created based on TCD measurements for different GAs. A
simple regression model was created to predict the GA. The coefficient of
determination (R
The intraobserver reliability of the TCD measurement was assessed using the intraclass correlation coefficient (ICC). The degree of agreement between the Korean data and the data from other populations and their variations were analyzed using the Bland–Altman analysis method [10]. The degree of agreement was expressed as bias, standard deviations, and 95% limits of agreement. All statistical analyses were performed using MedCalc for Windows, ver. 19.6.4 (MedCalc Software, Ostend, Belgium).
The age of the mothers included in this study ranged from 20 to 44 years with a
mean of 33.4
| Characteristics | n (%) | |
| Maternal age (years) | ||
| 320 (17.6) | ||
| 30–34 | 764 (42.0) | |
| 735 (40.4) | ||
| Gravidity | ||
| 1 | 867 (47.7) | |
| 2 | 763 (41.9) | |
| 189 (10.4) | ||
| BMI (kg/m |
||
| Underweight |
168 (9.2) | |
| Normal weight 18.5–24.9 | 1035 (56.9) | |
| Overweight 25.0–29.9 | 306 (16.8) | |
| Obese |
310 (17) | |
| BMI, body mass index. | ||
No significant difference in the TCD was found according to the general
characteristics. The TCD measurements had high reproducibility with an ICC of
0.992 (95% confidence interval [CI], 0.991–0.993). In the regression model of
TCD (cm) = 0.129 GA (weeks) – 0.527 (95% CI 0.129–0.130, p
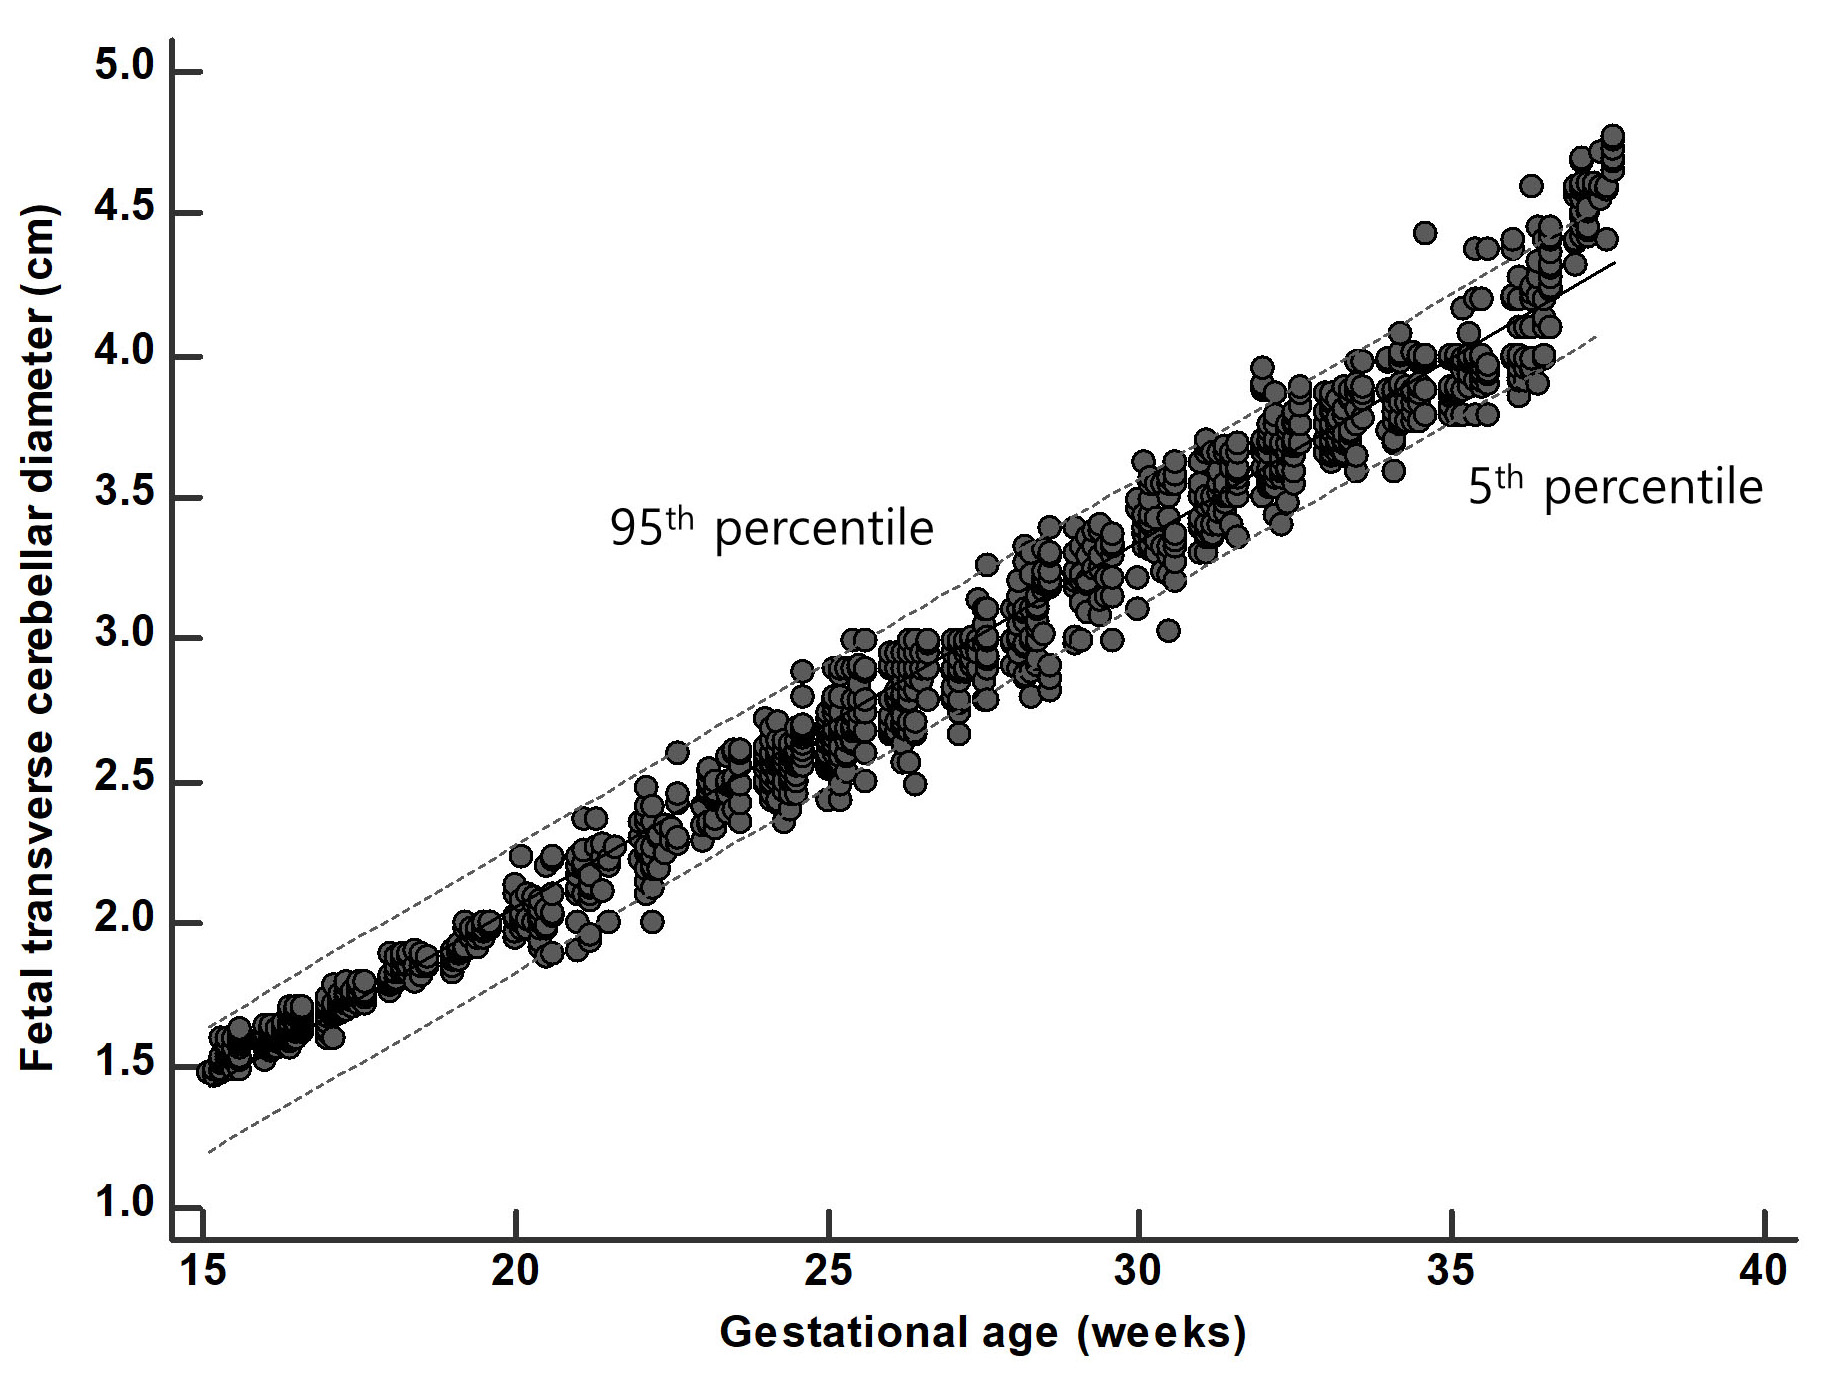 Fig. 2.
Scatter plot of transverse cerebellar diameter by gestational age. The lower, middle, and upper lines represent the 5th, 50th, and 95th percentiles, respectively.
| GA (weeks) | Fitted percentiles (cm) | ||||||
| 5th | 10th | 25th | 50th | 75th | 90th | 95th | |
| 15 | 1.48 | 1.48 | 1.51 | 1.54 | 1.56 | 1.59 | 1.59 |
| 16 | 1.57 | 1.58 | 1.59 | 1.62 | 1.64 | 1.67 | 1.68 |
| 17 | 1.63 | 1.68 | 1.70 | 1.72 | 1.75 | 1.76 | 1.78 |
| 18 | 1.78 | 1.79 | 1.80 | 1.84 | 1.88 | 1.89 | 1.89 |
| 19 | 1.85 | 1.87 | 1.88 | 1.93 | 1.97 | 1.99 | 2.00 |
| 20 | 1.90 | 1.94 | 1.98 | 2.04 | 2.08 | 2.16 | 2.22 |
| 21 | 1.95 | 2.00 | 2.10 | 2.16 | 2.23 | 2.27 | 2.34 |
| 22 | 2.11 | 2.16 | 2.22 | 2.29 | 2.35 | 2.42 | 2.47 |
| 23 | 2.34 | 2.36 | 2.43 | 2.47 | 2.50 | 2.60 | 2.61 |
| 24 | 2.43 | 2.46 | 2.52 | 2.57 | 2.61 | 2.68 | 2.69 |
| 25 | 2.54 | 2.59 | 2.65 | 2.67 | 2.74 | 2.88 | 2.89 |
| 26 | 2.66 | 2.67 | 2.79 | 2.83 | 2.90 | 2.95 | 2.99 |
| 27 | 2.77 | 2.79 | 2.88 | 2.93 | 2.99 | 3.01 | 3.10 |
| 28 | 2.86 | 2.89 | 2.98 | 3.08 | 3.20 | 3.29 | 3.31 |
| 29 | 2.98 | 2.99 | 3.15 | 3.22 | 3.32 | 3.37 | 3.38 |
| 30 | 3.20 | 3.23 | 3.33 | 3.40 | 3.51 | 3.55 | 3.58 |
| 31 | 3.36 | 3.37 | 3.40 | 3.51 | 3.59 | 3.66 | 3.69 |
| 32 | 3.53 | 3.58 | 3.59 | 3.67 | 3.75 | 3.87 | 3.89 |
| 33 | 3.64 | 3.66 | 3.69 | 3.76 | 3.84 | 3.89 | 3.97 |
| 34 | 3.69 | 3.70 | 3.77 | 3.86 | 3.97 | 4.00 | 4.01 |
| 35 | 3.79 | 3.79 | 3.88 | 3.95 | 3.99 | 4.07 | 4.20 |
| 36 | 3.91 | 3.93 | 3.99 | 4.14 | 4.27 | 4.41 | 4.45 |
| 37 | 4.40 | 4.42 | 4.48 | 4.57 | 4.67 | 4.73 | 4.76 |
| GA, gestational age. | |||||||
The 50th percentile of the TCD was compared between the current study and
previous studies assessing TCD in other populations. The TCD in this study was
0.04
| Bias |
95% Limits of agreement | |
| United States [16] | –0.257 (1.03) | –0.82 to 0.31 |
| United Kingdom [17] | –0.042 (0.93) | –0.19 to 0.28 |
| Hong Kong [18] | –0.228 (1.01) | –0.73 to 0.28 |
| India [19] | –0.121 (0.95) | –0.45 to 0.21 |
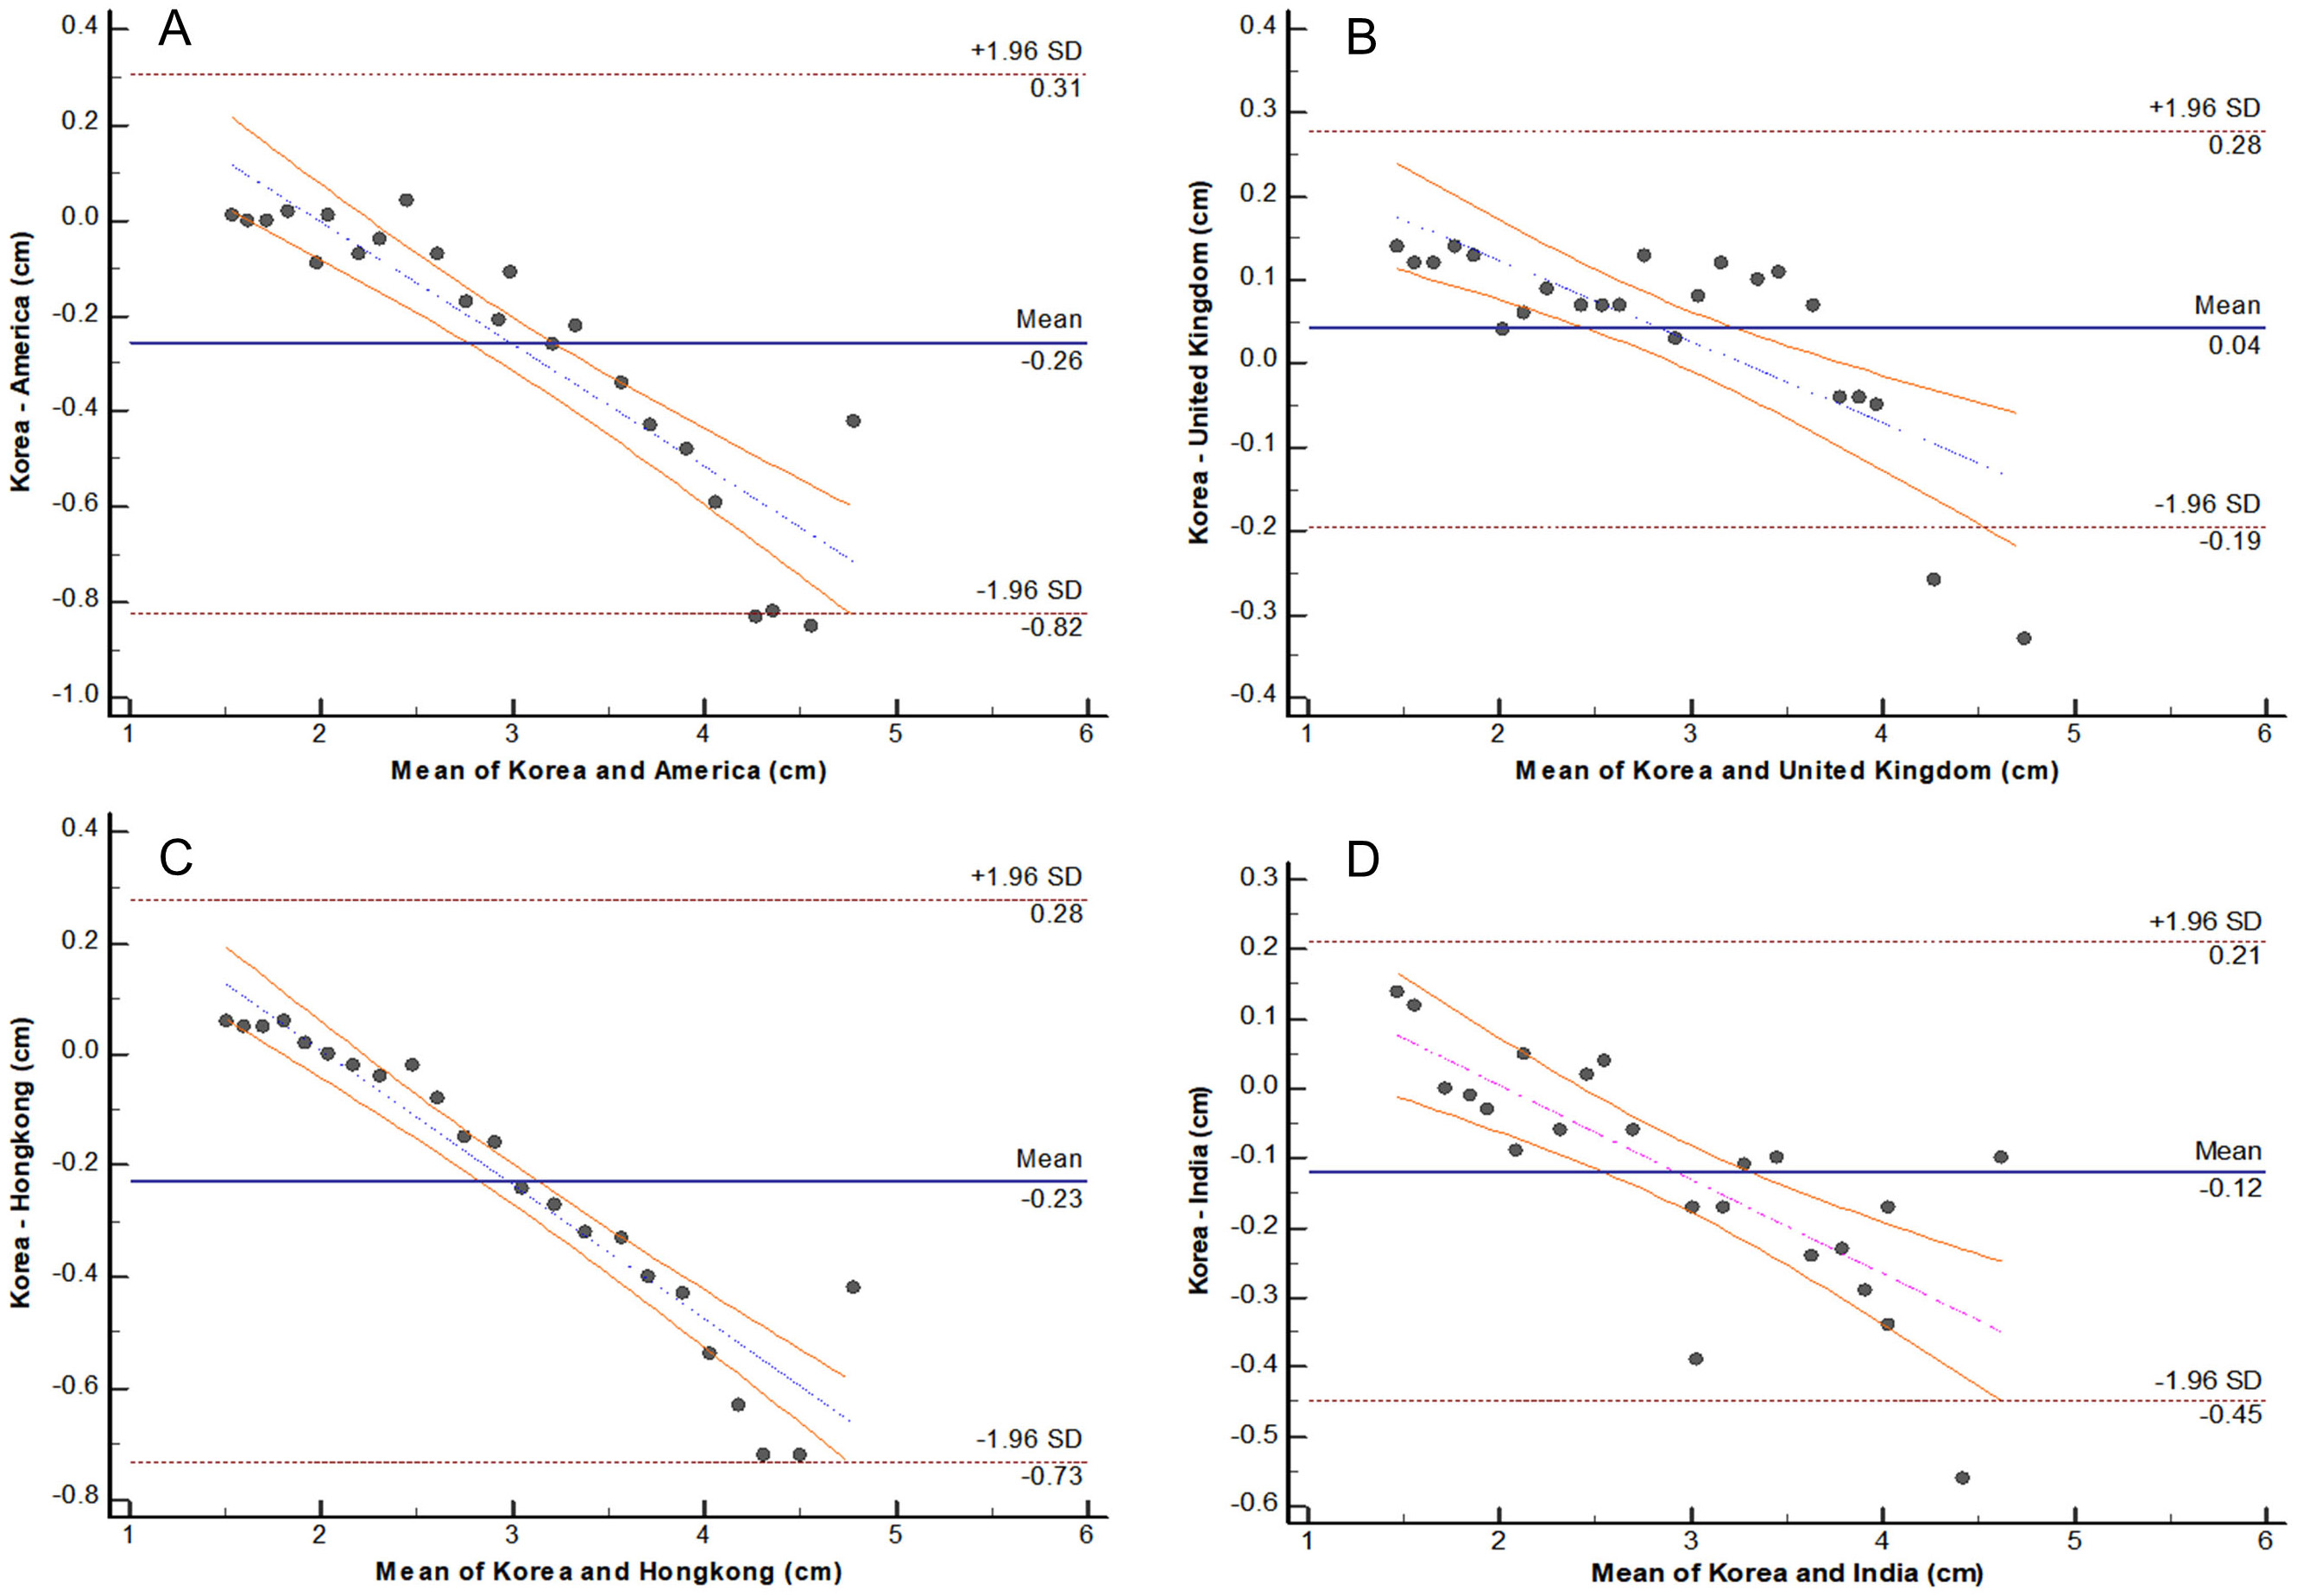 Fig. 3.
Difference against mean plot for measurements of fetal transverse cerebellar diameter between the Korean and other populations. (A) Korea vs. the United States, (B) Korea vs. the United Kingdom, (C) Korea vs. Hong Kong, and (D) Korea vs. India.
Prenatal ultrasound is used to diagnose pregnancy, determine gestational age,
assess fetal growth and development, and diagnose fetal deformities to determine
the directions of prenatal care and the delivery method. Therefore, fetal growth
and development must be assessed and closely monitored throughout the pregnancy.
The BPD, AC, and FL are biometric indices commonly measured using ultrasound to
assess fetal growth and development. The TCD is more accurate than other
biometric indices in predicting GA, and the TCD/AC ratio has been reported to
have a diagnostic accuracy of nearly 100% for asymmetric IUGR [4, 11, 12, 13]. In
clinical settings, the TCD is used to estimate GA for mothers who visit a
hospital for the first time in the second trimester who do not know the GA of
their fetuses. The TCD has been reported to have smaller standard deviations than
other biometric indices throughout the pregnancy period [14]. In this study, the
TCD explained
Currently available ultrasound data are mostly acquired from Western populations. Since the TCD varies according to body type, which varies between ethnicities and environments, a single TCD standard cannot be applied to all countries and ethnicities. Therefore, appropriate reference values must be determined for each country. Over the years, much research has been conducted to establish a biometric standard for each country. One study compared the reference values for fetal biometric indices in the second trimester using Z-scores and reported ethnic differences even among Asians from different countries. Kwon et al. [15] compared fetal biometric data between Italy, Pakistan, South America, and Hong Kong and reported similar results between Pakistan and South Korea for all indices except for the BPD. In this study, the TCD values of Korean fetuses in the 50th percentile were compared with those from the United States, United Kingdom, Hong Kong, and India, which are commonly used in clinical settings. Korean fetuses showed larger TCD values than the fetuses from the United Kingdom and smaller TCD values than those from the United States, Hong Kong, and India at all GAs [16, 17, 18, 19]. As the mean TCD increased in the Bland–Altman analysis, the differences and variations in the TCD among the countries also increased. These results demonstrate the need to use reference values for fetal biometric indices that consider ethnic differences.
In a regression model created to predict GA, the TCD explained 98.4% of the variance in GA, and the differences in the mean TCD and their variations among countries increased as the mean TCD increased. TCD is a useful biometric index for assessing fetal growth and predicting GA and must be used with consideration of ethnic differences. Moreover, the reference values for the TCD proposed in this study may be useful for assessing the growth of Korean fetuses and predicting GA. Continued research on fetal growth assessment using a larger number of subjects is needed.
SHY and DYL designed the research study. SHY performed the research. CHH and HSA provided help and advice on the experiments. DYL analyzed the data. SHY, CHH, HSA and DYL wrote the manuscript. All authors contributed to editorial changes in the manuscript. All authors read and approved the final manuscript.
Written informed consent was obtained from all participants. This study was approved by the Institutional Review Board of the Catholic University of Pusan, South Korea (#IRB no. 2021003).
Not applicable.
This research received no external funding.
The authors declare no conflict of interest.