


 , S. Chen 3,†, W.J. Zhu 1,2, X.T. Shen 1,2, Y.B. Li 1,2, J.X. Zheng 4,*
1 Center for Reproductive Medicine, The First Affiliated Hospital, Sun Yat-sen University, 510080, Guangdong, P.R. China
2 The Key Laboratory for Reproductive Medicine of Guangdong Province, The First Affiliated Hospital, Sun Yat-sen University, 510080, Guangdong, P.R. China
3 Department of Oral and Maxillofacial Surgery, The First Affiliated Hospital, Sun Yat-sen University, 510080, Guangdong, P.R. China
4 Department of Neurology, People's Hospital of Yangjiang, 529500, Guangdong, P.R. China
†Contributed equally.
Abstract
In this study, mouse embryos were used to compare the effects of vitrification and slow freezing on the physiology, normal spatial learning, cerebral development, and gene expression of offspring. 583 8-cell stage embryos were obtained from 60 female mice and randomly divided randomly into three groups: vitrified, slow frozen, and control groups. In the vitrified group, embryos were cryopreserved by using the vitrification technique. In the slow frozen group, embryos were frozen using the slow freezing technique. In the control group, the embryos were not frozen and were transferred. After thawing, birth rates, physiology, normal spatial learning, and cerebral development of offspring were compared among the three groups. The expression of fat and brain-associated genes were measured by RT-PCR (real-time quantitative polymerase chain reaction), Western blot, immunofluorescence staining, and immunohistochemistry. The weight of the offspring in the vitrified and slow frozen groups was higher (p < 0.05) than in the control group at 8 weeks. There were no differences in the other postnatal physiology and development parameters in the offspring from the three groups. There were no difference in the expression and distribution of two brain development-related proteins, glial fibrillary acidic protein (GFAP) and myelin basic protein (MBP) in the offspring. The expression of two fat-associated genes, Fat mass and obesity-associated (FTO) and PPARγ co-activator-1 (PGC-1α), were higher in offspring from the frozen-thawed (slow frozen and vitrified) group than the control group. Slow freezing and vitrification embryo transfer techniques had no significant differences in postnatal physiology and development.
Keywords
- Vitrification
- Slow freezing
- Gene expression
- Offspring health
- Mouse model
In vitro fertilization (IVF) is a critical method of assisted reproductive technology (ART) [1] that is responsible for approximately 6.5 million births worldwide. Compared with other assisted reproductive techanologies, embryo cryopreservation has several advantages, including increasing the rate of pregnancy and economics [2, 3]. After the first successful cryopreservation of human embryos was reported [4], several cryopreservation technologies have been developed. Frozen-thawed embryo transfer has become a major component of human IVF and embryo transplantation (ET) programs [5]. Currently, two techniques, slow freezing and vitrification, are used to cryopreserve human embryos [6]. The slow freezing technique requires expensive equipment to slowly freeze embryos to -30 ℃ or -65 ℃ using liquid nitrogen, which is a time-consuming procedure. Currently, vitrification is used for clinical cryopreservation of oocytes and embryos. During vitrification, the embryo is exposed to a high concentration of cryoprotectants, the cooling rate is rapid, and vitrification does not require expensive instrument. Thus, vitrification is more time and cost efficient strategy than the conventional slow freezing method [7]. In addition, vitrification can prevent embryos from damage due to ice crystal formation, which occurs during slow freezing. Vitrification reduces harm to developing embryos and increases the blastocyst rate. The disadvantage of the vitrification technique is that it requires the cryoprotectants in much higher concentrations than the slow freezing which can be toxic to cells. The most widely used vitrification solution also contains dimethyl sulfoxide (DMSO), which could affect the methylation process and result in epigenetically related abnormalities [8].
To determine whether the slow freezing and vitrification techniques affect normal spatial learning and cerebral development of mouse offspring, we tested the spatial learning and examined the expression and distribution of glial fibrillary acidic protein (GFAP) and myelin basic protein (MBP) [9, 10], which are markers of astrogliosis. In addition, the transcript levels of the fat and obesity-associated genes PPARγ co-activator-1 (PGC-1α) and fat mass and obesity-associated (FTO) [11, 12] were also examined in offspring from the slow frozen and vitrified groups, and the expression change of these two genes may explain the weight change of the mice in the slow frozen and vitrified groups.
60 specific pathogen-free F1 (ICR) female mice (6-8 weeks of age, 16-20 g in weight) were obtained from the Animal Center of Sun Yat-sen University. All the mice were housed in standard transparent plastic cages (330 × 205 × 180 mm) with five mice in each cage under temperature controlled (25 ± 0.5 ℃ and light controlled conditions (lights on, 06:00-18:00). Mice had free access to food and water [13]. All the protocols and procedures in this study were following the requirements of the Institutional Animal Care and Use Committee of The First Affiliated Hospital of Sun Yat-sen University (Approval no. 201204-008).
Superovulation were achieved by intraperitoneal injection of 7.5 IU (0.15 mL) of pregnant mare serum gonadotropin (PMSG, Sigma, St Louis, MO, USA) into female mice by and after 48 h, the mice were injected with 7.5 IU of human chorionic gonadotropin (hCG, Sigma, CG5). Superovulated females were then mated with single males of the same strain (8 weeks old). At the time of examination, mating was confirmed by the presence of a vaginal plaque in female mice. Mated females were sacrificed by cervical dislocation and the oviducts were flushed 62 h after hCG injection to collect 8-cell embryos [14]. The embryos were rinsed and grown in M16 medium (Sigma, M7292) medium at 37 ℃ with 5% CO2 before freezing. Control embryos were continuously cultured into blastocysts without freezing. After injection with hCG for 115 h, the development of blastocyst was observed in the control group.
After equilibrating in a DMEM/F12 medium containing 10% glycerol, 10% Dulbecco phosphate-buffered saline (DPBS), IVF-30 and 10% fetal calf serum (FCS) for 15 min, the embryos were pipetted into straws [15] and placed in a programmable freezer (Cryobath CL3300; Cryologic, Australia) for 10 min until they reached -7 ℃ at a cooling speed of 0.7 ℃/min. Forceps were placed in liquid nitrogen and cooled at first. Then, embryos were cooled to -33 ℃ at a cooling speed of 0.3 ℃/min. Finally, embryos were transferred into liquid nitrogen for storage. The straw was removed from liquid nitrogen, held at room temperature for 60 s and then in warm water (25 ℃) for 30 s to thaw the embryos. Cryoprotectant (CPA) was removed from the embryos in four steps: 1) embryos were incubated in medium containing 6% glycerol and 0.3 M sucrose for 5 min, 2) the embryos were incubated in medium containing 3% glycerol and 0.3 M sucrose for 5 min, 3) the embryos were incubated in medium containing 0.3 M sucrose for 5 min, and 4) the embryos were incubated in 20% fetal calf serum (FCS) FCS in phosphate-buffered saline (PBS) for 5 min. The embryos were then cultured at 37 ℃ with 5% CO2 in air.
Embryos equilibration was initiated in equilibrationsolution (ES) for 15 min at room temperature. The ES contained 7.5% (v/v) ethylene glycol (EG, Sigma, 324558) and 7.5% (v/v) dimethyl sulfoxide (DMSO, Sigma, D2650) was dissolved in human tubal fluid (HTF) medium (Sigma, MR-070) supplemented with 10% human serum albumin (HSA) (Sigma, A9511). After equilibration, the embryos were washed in small drops of vitrification solution containing 15% (v/v) EG for three times and base medium containing of 15% (v/v) DMSO for < 1 min. Then, the embryos were loaded into a modified straw by pulling and cutting a 0.25 mL plastic straw. After the embryos were loaded, the straw was covered with another straw with the end heat-sealed and the straw was plunged into liquid nitrogen. After cryostorage, the embryos were warmed by removing the straws from the liquid nitrogen and keeping them in the air for 10 s followed by placing them in a 37 ℃ water bath for 1 min. The contents of the straws were then expelled into a 0.28 mol/L sucrose solution at 37 ℃ for 1 min. The embryos were placed in a 0.17 mol/L sucrose solution for 3 min and then in base medium for 5 min at RT (room temperature) to further rehydrate and remove of cryoprotectants [16].
The lower back of the anaesthetized 2.5 days pseudo pregnant female mice was cleaned and then shaved. A small cut (1 cm) was made in the body wall just above each ovary. Then, under an operating microscope, frozen-thawed embryos or fresh 8-cell stage embryos were transferred to each uterine horn and were implanted, 10 litters of each embryo treatment group were generated. Finally, the skin incision was sutured.
All offsprings were kept throughout the experiment. Mice were weighed daily from birth until 8 weeks. At 8 weeks, the mice were euthanized and the fat was dissected out of each mouse. The fat was collected and weighed.
The mice forelimbs were placed flat on the induction bar of the Grip Strength Meter (GPM-100; Melquest, Toyama, Japan). When the mouse grasped the bar, the mouse's tail dragged in parallel, and the peak pulling force (in grams) was recorded on a digital force transducer. The grasping device would automatically record the maximum grasping force. These measurements were taken three times. The maximum value of the mouse's grasp force was measured at 8 weeks.
Whole blood was collected simultaneously from all mice by caudal venipuncture. Serum was collected from plasma via centrifugation and then fstocked at -20 ℃. Serum glucose and insulin concentrations were measured using 15-μL duplicate samples and an ELISA kit (Arbor Assays).
Total RNAs were isolated from 10 brains if offspring were pooled and constituted one biological replicate per group (control, slow frozen, and vitrified) using TRIzol reagent (Invitrogen) by following the manufacturer’s protocols. The total RNAs were dissolved in 10 μL RNAse-free water, and cDNAs were synthesized by reverse transcribing from 2 μL of each sample using reverse transcription kit (Takara). The sequence of primers used to determine the relative transcript abundance of PGC-1α, FTO, GFAP, and MBP are summarized in Table 1.
| Groups | NO. of 8-cell |
Survival rate | Offspring number | Birth rate |
| Control | 161 | 24 | 14.91% | |
| slow frozen | 161 | 58.39%a | 23 | 14.23%b |
| Vitrified | 161 | 67.08%a | 26 | 16.05%b |
a. p < 0.05 (comparison of the survival rate between the ART and the fresh group). b. p > 0.05 (comparison of the Birth rate between the ART and the fresh group).
Total proteins were extracted from10 brains if offspring were pooled and constituted one biological replicate per group. The lysates from brains were prepared in 200 mL of lysis buffer. Proteins were separated using 6-16% gradient polyacrylamide gels and then the proteins were transferred onto polyvinylidene fluoride membranes. After blocked in 5% bovine serum albumin (BSA), the membranes were incubated with FTO (ab94482) Rabbit mAb (1 : 1,000; Abcam), PGC-1α (sc-518025) Mouse mAb (1 : 500; Santa Cruz), MBP (sc-52070) Mouse mAb (1 : 500; Santa Cruz), or GFAP (ab4648) Mouse mAb (1 : 500; Abcam). The blots were then incubated with secondary antibodies. Densitometry of band intensities was performed and intensities were normalized to GAPDH (ab8243) Mouse mAb (1 : 2,000; Abcam) or α-tubulin (ab7291) Mouse mAb (1 : 2,000; Abcam) protein expression. Immunoblots were quantified using Image J.
Cortical neurons grown on coverslips were fixed with 2% paraformaldehyde (PFA) in PBS for 15 min at 37 ℃. After blocked with 5% BSA/PBS for 1 hour at room temperature, the nerons were then incubated with primary antibodies against MBP (1 : 500) and GFAP (1 : 1500) for 2 h at room temperature, and then stained with fluorescent conjugated secondary antibodies (Alexa Fluor 488 and 555, 1 : 500) for 1 h at room temperature. The immunostained coverslips were mounted onto slides with FluorSave (Calbiochem), and a Delta Vision microscope was used for fluorescent analysis. All of the images were taken with a 60× oil immersion lens.
The MWM test was conducted in a homogeneously illuminated room at 8:30 am. Each mouse was tested at postnatal day 60. Each mouse was trained in three blocks per day, and each block contained a 1-min trial. Mouse movement, escape latency, path length, mean speed, percentage of time in the target quadrant, and crossing number were recorded and analyzed as previously described [17].
All the data were statistically analyzed using the Student’s t-test with Excel (Microsoft). All experiments were performed with at least three biological replicates. Error bars in the Figures represent ± SD.
This study aimed to determine the effect of embryo vitrification and slow freezing on number of offspring. The control and slow frozen groups showed a reduced number of offspring per litter compared to the Vitrified group without statistical significance, which indicated that the postnatal birth rates were similar in the vitrified, slow frozen, and control groups in all treatments using t-test.
To test whether vitrification or slow freezing affects postnatal physiology and development, offsprings from the vitrified, slow frozen, and control groups were weighed daily and the mean weekly weights were calculated. Mice in the slow frozen and vitrified groups were significantly heavier than mice in the control group during weeks 4-8 (Figure 1A). However, there was no difference in body weight between mice in the slow frozen and vitrified groups during weeks 0-8. The amount of body fat in mice in the slow frozen and vitrified groups was markedly higher when compared with mice in the control group (Figure 1B). However, no differences were found in muscle distribution (sarcomere length) among the three groups at 8 weeks (Figure 1C). Serum glucose and insulin levels were measured with an ELISA kit, and there was no difference among the three groups (Figure 1D-E). There was also no difference in the forelimb grip test results among the three groups (Figure 1F). These results indicate that mice in the slow frozen and vitrified groups were similar to mice in the control group in muscle distribution, forelimb grip strength, and index parameters of metabolic health. However, the body weight and body fat of mice in the slow frozen and vitrified groups were higher than the mice in the control group.
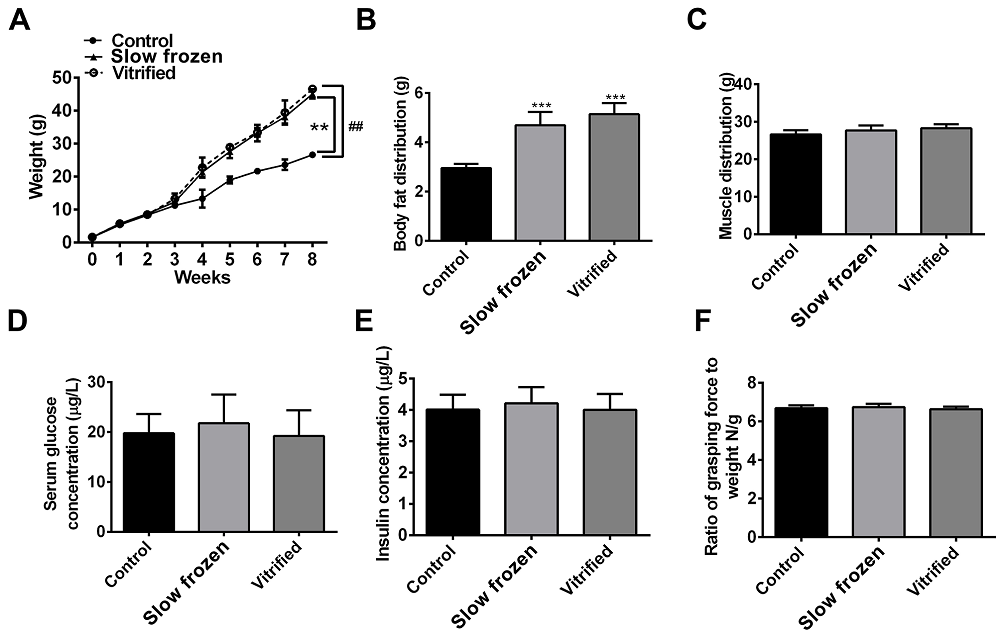 Figure 1.
— Effect of embryo vitrification and slow freezing on postnatal physiology. (A) The weights of offspring from the vitrified, slow frozen, and control groups from weeks 0-8. The data are shown as mean ± SEM ** p < 0.001, denote differences between control and slow frozen. ## p < 0.001, denote differences between control and vitrified. (B) The body fat of offspring from the vitrified, slow frozen, and control groups at 8 weeks. The data are shown as mean ± SEM, n = 30 (10 offspring were pooled and constituted one biological replicate, three separate biological replicates were repeated.). *** p < 0.0001. (C) Skeletal muscle distribution in offspring from the vitrified, slow frozen and control groups at 8 weeks. The data are shown as mean ± SEM, n = 30. (D-E) Serum glucose and insulin concentrations in offspring from the vitrified, slow frozen, and control groups at 8 weeks. The data are shown as mean ± SEM, n = 30. (F) Forelimb grip strength in offspring from the vitrified, slow frozen, and control groups at 8 weeks. The data are shown as mean ± SEM, n = 30.
We next investigated the movement coordination function in fresh-embryo group, slow freezing and vitrified-embryo group to provide further evidence for the effect of vitrification on the development of offspring in mice. The offsprings in the three groups were evaluated by the MWM test to determine whether vitrification and slow freezing influence spatial learning, and no difference was found among the slow frozen, vitrified, and control groups (Figure 2A-C). The escape latency, including times across the platform, percent time in the target quadrant, and escape path length analyses showed no difference among the three groups, indicating that normal spatial learning in offspring from the slow frozen and vitrified groups.
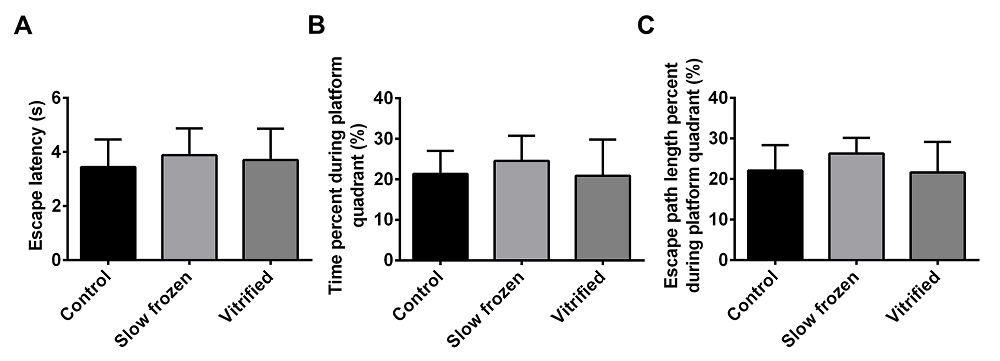 Figure 2.
— MWM analyses of offspring from the vitrified, slow frozen, and control groups. (A-C) No significant difference in spatial learning impairment, which including escape latency, times across the platform, time spent in the target quadrant, and escape path length was found in offspring from the vitrified, slow frozen, and control groups. n = 10 for each subgroup. Three repeated measures analysis of variance. The data are shown as mean ± SEM, p > 0.05.
To determine whether the increased weight and body fat in offspring from the slow frozen and vitrified groups were resulted from altered gene expression, we evaluated the expression of two fat and obesity-related genes, PGC-1α and FTO. The results from RT-qPCR and Western blot showed that mRNA and protein expression of PGC-1α and FTO were higher in the slow frozen and vitrified groups than in the control group (Figure 3A-B), indicating that the increased weight and body fat of offspring in the slow frozen and vitrified groups may result from increased expression of PGC-1α and FTO.
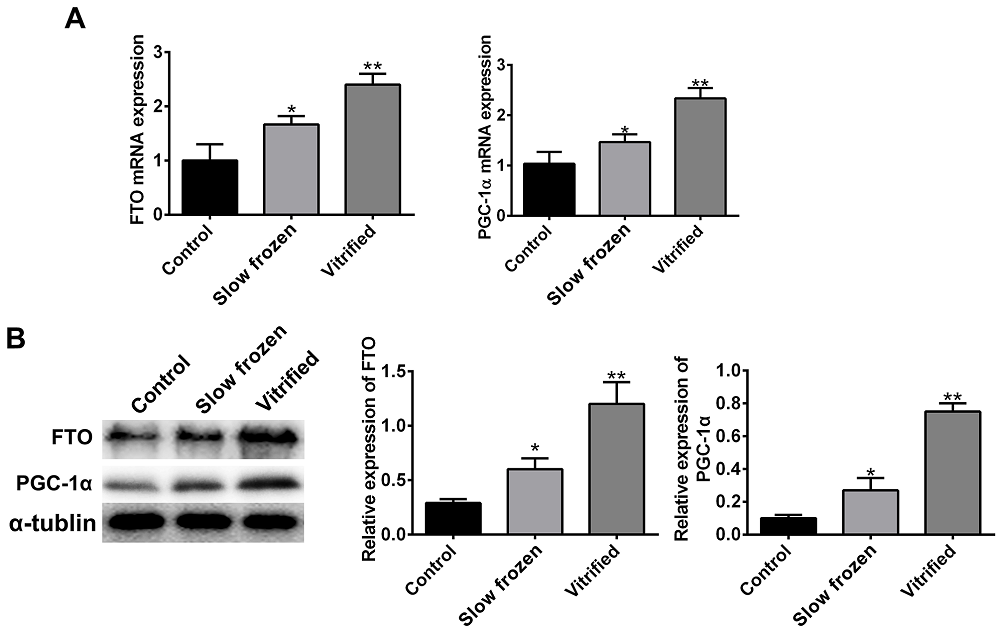 Figure 3.
— Increased expression of the weight-associated genes FTO and PGC-1 in offspring from the vitrified and slow frozen groups. (A) Cerebral cortices were lysed and subjected to RT-qPCR analysis to determine mRNA levels. Each cDNA sample was normalized to the reference gene GAPDH. mRNA levels of FTO and PGC-1 were higher in offspring from the slow frozen and vitrified groups than in offspring from the control group. (B) Cerebral cortices were lysed and subjected to Western blot analysis to determine protein levels. Each protein sample was normalized to the reference protein GAPDH. Protein levels of FTO and PGC-1 were higher in offsprings from the slow frozen and vitrified groups than in offspring from the control group. Data are shown as mean ± SEM, n = 3 (10 offsprings were pooled and constituted one biological replicate, three separate biological replicate). ** p < 0.01, *** p < 0.001.
Since many reports suggested that GFAP and MBP play important roles in brain development, we determined the effect of embryo vitrification and slow freezing on cerebral development by examining the expression of GFAP and MBP. We found similar expression levels of GFAP and MBP in offsprings from all three groups (Figure 4A). We also confirmed the distribution of GFAP and MBP in the cerebral cortex by immunofluorescence and immunohistochemistry (Figure 4B-C). These data indicated that there were no differences in content and distribution of GFAP and MBP in offspring from the slow frozen, vitrified, and control groups.
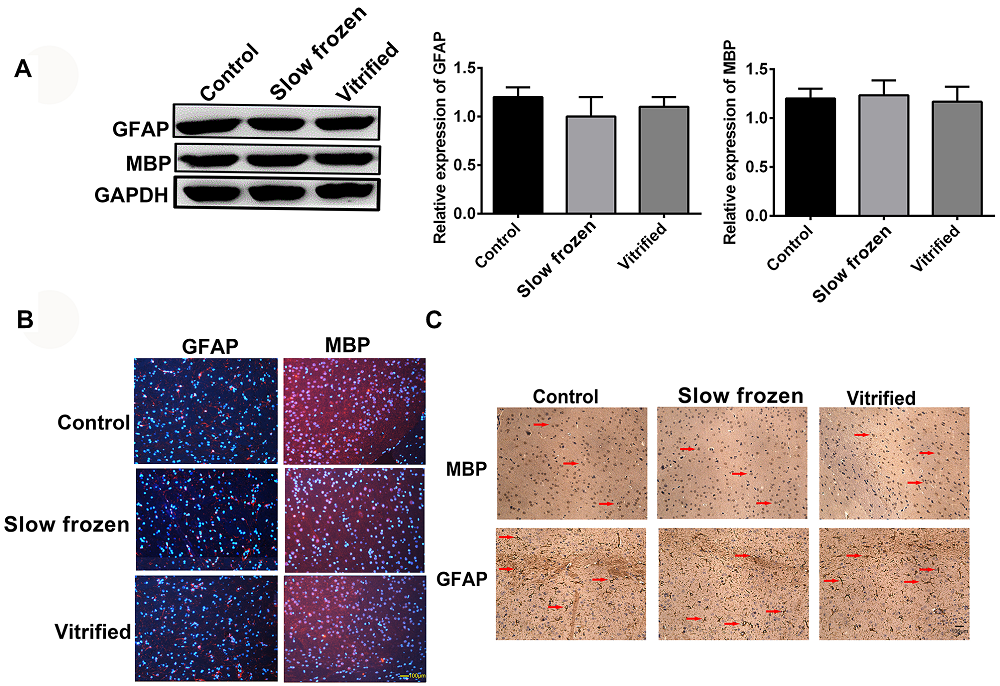 Figure 4.
— Expression and location of GFAP and MBP were similar in offsprings from the slow frozen, vitrified, and control groups. (A) Cerebral cortices were lysed and subjected to Western blot analysis to determine protein levels. Each protein sample was normalized to the reference protein GAPDH. GFAP and MBP expression were similar in offsprings from the slow frozen, vitrified, and control groups. (B) GFAP and MBP expression in the cortical neurons of offsprings from the slow frozen, vitrified, and control groups were analyzed at 8 weeks by immunofluorescence with anti-GFAP (red, left) and anti-MBP (red, right) antibodies. Scale bar, 100 μm. (C) GFAP and MBP expression in the cortical neurons of offsprings from the slow frozen, vitrified, and control groups were analyzed at 8 weeks by immunohistochemistry with anti-GFAP and anti-MBP antibodies. The arrow shows positive MBP staining. Scale bar, 100 μm. The results are representative of three independent experiments.
Although vitrification and slow freezing techniques have improved over the last decades, there were still concerns regarding the potential harmful effects of ART (assisted reproductive technology) [18]. Accumulated studies have reported that embryo development can be affected by vitrification, which then causes the structural and biochemical changes of DNA that leads to imprinting disorders [19]. Previous animal studies have confirmed the potential effects of vitrification on metabolic efficiency [20]. Previous studies have shown that cryopreservation may alter the cellular changes in embryos at different stages, species, and origins, as well as the molecular changes in offspring and embryo after IVF treatment [21]. However, there are few studies on the effect of physiological development, normal spatial learning, and cerebral development on offspring resulting from ART using mouse model. Although IVF technology is widely used in ART clinics and most IVF babies are healthy, the safety of vitrification is still a concern. Several studies have compared slow freezing and vitrification using human embryos, and majority of these studies focused on survival differences and development outcomes after thawing and pregnancy [22]. Other studies have shown that cryopreservation may affect DNA integrity [23] and the cytoskeleton [24] of embryos. Few studies have examined differences between normal spatial learning and cerebral development of offspring from IVF and ET. It is difficult to study the cerebral development of IVF babies due to follow-up limitations. In this study, we investigated the effect of cryopreservation on postnatal normal spatial learning and brain development using a mouse model. The mouse model has been confirmed as an ideal model to study the influence of IVF on physiology and brain development in adulthood due to the ease of obtaining embryos and offspring. We used the MWM test to evaluate spatial learning, and we found no differences in spatial learning between the offspring from the slow frozen, vitrified, and control groups. In addition, we measured the levels and distributions of the brain development-associated proteins GFAP and MBP, which play important roles in the development of glial fibrillary. Mutations in the mouse GFAP gene may be a genetic cause of spinal cord injury. The expression and distribution of GFAP and MBP were similar in offspring from the slow frozen, vitrified, and control groups.
It has been reported that ART offspring of mice display alterations in fat deposition [25], however, the underlying mechanism for this remains unclear and future research is required to understand the mechanistic changes that occur during ART. In our study, there are no data to indicate whether vitrification and slow freezing affect birth weights from weeks of 0-3. Therefore, our study showed that offsprings from the slow frozen and vitrified groups were heavier than the offspring from the control group during weeks 4 to 8, which is in accordance with our body fat data. Based on this phenotype, expression levels of two fat and obesity-related genes, PGC-1α and FTO, were evaluated. The mRNA and protein expression of PGC-1α and FTO were higher in offsprings from the slow frozen and vitrified groups than in offsprings from the control group, indicating that the higher weight and body fat of offsprings from the slow frozen and vitrified groups may be caused by elevated expression of PGC-1α and FTO. However, the involved mechanism is still unclear. On the other hand, numerous studies showed a higher weight of these children compared to children born after the transfer of fresh embryos [26, 27]. However, our results suggest that there is no difference in birth weight from control group, vitrification and slow freezing groups. Then, slow freezing and vitrification of mouse embryos increases the weight and body fat of offsprings 4-8 weeks later. Therefore, a more detailed analysis of the birth weight, the increased weight rate, glucose tolerant and insulin resistance of infant on vitrified and non-vitrified embryos are essential to better understand the effects of vitrification in the future. That might be associated with adult diseases of the ART offsprings, such as obesity and diabetes.
Taken together, our results showed that there were no difference in postnatal growth, including birth rate, offspring numbers, physiological and brain development, of offsprings from the slow frozen, vitrified, and control groups. Vitrification does not affect the physiological development, movement coordination function and brain development of mouse. But the reasons of the increase the weight and body fat of the mice, required further study.
Zengyan Wang and Shan Chen conceived and designed the experiments, Wenjing Zhu and Xiaoting Shen analyzed and interpreted the results of the experiments, Yubin Li and Jingxuan Zheng performed the experiments.
This project was supported by Science Fund of the National Natural Science Foundation of China (Grant No. 81200473) and Guangdong Provincial Key Laboratory of Reproductive Medicine (Grant No.2012A061400003).
I would like to express my gratitude to all those who helped me during the writing of this manuscript.
The authors state that there are no conflicts of interest to disclose.