

 , M. Y. Khamis 1, S. Eltabakh 2, R. S. Swilam 3, A. Elhabashy 1, R. EISherif 1
1 Departments of Obstetrics & Gynecology
2 Medical Biochemistry
3 Clinical Pathology, Faculty of Medicine, Alexandria University, Alexandria, Egypt
Abstract
Objective: In this study, the authors aimed to compare and correlate neutrophil/lymphocyte ratio (NLR), platelet/lymphocyte ratio (PLR), and C-reactive protein (CRP) levels in Egyptian patients with different degrees of preeclampsia (PE). Materials and Methods: The authors recruited 105 Egyptian pregnant women with gestational age ≥ 34 weeks. They were divided into 35 normotensive pregnant and 70 PE women, further subdivided into 35 mild and 35 severe PE cases according to ACOG criteria. Results: There was no statistically significant difference between patients with PE and healthy pregnant women as regards to NLR. PLR showed statistically significant difference between the control and severe PE cases and between mild and severe PE cases. CRP levels showed a statistically significant difference between the control and mild PE cases and between the control and severe PE cases. Conclusion: CRP was more sensitive and specific than PLR to predict PE in pregnant females, hence it can be used in prediction of PE. PLR was more sensitive but less specific than CRP to predict severity of PE in pregnant females, therefore PLR can be used for early prediction of severity. NLR cannot be used as a marker for prediction of PE or its severity.
Keywords
- Preeclampsia
- Neutrophil/lymphocyte ratio (NLR)
- platelet/lymphocyte ratio (PLR)
- C-reactive protein (CRP)
Preeclampsia (PE) is considered one of the main causes of maternal, fetal or neonatal mortality and morbidity [1]. It indicates the occurrence of a new-onset hypertension together with a new-onset proteinuria. On the other hand, some cases present with hypertension and multi-system affections which are indicative of disease severity in the absence of proteinuria [2, 3].
Many theories are suggested for development of PE. It may arise as a result of increased maternal intravascular inflammatory response with the start of pregnancy. This maternal response or stimulus might be very strong that affects the immune response whether the innate or the adaptive one [4]. Such increased inflammatory response in PE indicates increased activation of the complement system in an uncontrolled manner. This activation of the complement system will manifest inflammation, enhancing inflammatory cells chemotaxis, and release of proteolytic fragments leading to activated phagocytosis by neutrophils and monocytes [5].
Systemic inflammation in PE signifies, also manifests Th1-type immunity and the absence of Th2 tendency [6-8]. In patients with PE, the decidual lymphocytes and the mononuclear cells of the peripheral blood are prepared to synthesize increased levels of Th1 cytokines [6-8]. Such systemic inflammatory immune response could be evaluated reliably and measured easily through measuring the differential leucocytic count [9, 10]. The ratio neutrophil/ lymphocyte (NLR) signifies that the first line of defense of the active non-specific inflammatory mediator by neutrophils, while lymphocytes represent the regulatory and protective elements of inflammation [11]. This is of value regarding cases with subclinical and low-grade inflammation [12, 13].
As platelets and lymphocytes are considered blood parameters affecting the immune surveillance, the platelet/ lymphocyte ratio (PLR) has a major role in cytokine-dependent immune response [14, 15]. It is suggested that such PLR marker has a high sensitivity regarding many systemic inflammatory conditions. However, there are minimal data regarding the correlation of PLR and PE [16-18].
C-reactive protein (CRP) is an annular, pentameric protein found in blood plasma, which increases in response to inflammation. It is an acute-phase protein of hepatic origin that increases following interleukin-6 secretion by macrophages and T cells. CRP might have a role in PE. CRP elevation before the onset of some clinical conditions should be considered [19, 20].
A sample size of 35 pregnant women in each group [21] is necessary to evaluate an expected difference at PLR between mild and severe PE patients with the third control group = 26.9; SD = 8.6 [22], using alpha error = 0.05, giving a power of 80%.
| Group I (n = 35) | Group II (n = 35) | Group III (n = 35) | Test of Sig. | p | ||||
|---|---|---|---|---|---|---|---|---|
| No. | % | No. | % | No. | % | |||
| Neonatal birth weight (Kg) | ||||||||
| Min. - Max. | 1.30 - 4.0 | 1.30 - 4.20 | 1.10 - 3.60 | F= 11.293* | <0.001* | |||
| Mean ± SD. | 2.98 ± 0.45 | 2.85 ± 0.63 | 2.32 ± 0.73 | |||||
| Median | 3.0 | 2.90 | 2.45 | |||||
| Sig.bet.Grps | p1=0.373, p2<0.001*, p3=0.001* | |||||||
| Apgar 1 min. | ||||||||
| Min. - Max. | 4.0 - 7.0 | 5.0 - 7.0 | 2.0 - 8.0 | H= 10.710* | 0.005* | |||
| Mean ± SD. | 6.83 ± 0.57 | 6.86 ± 0.49 | 6.26 ± 1.27 | |||||
| Median | 7.0 | 7.0 | 7.0 | |||||
| Sig.bet.Grps | p1=0.808, p2=0.007*, p3=0.003* | |||||||
| Apgar 5 min. | ||||||||
| Min. - Max. | 8.0 - 9.0 | 7.0 - 9.0 | 6.0 - 9.0 | H= 15.996* | <0.001* | |||
| Mean ± SD. | 8.97 ± 0.17 | 8.86 ± 0.43 | 8.40 ± 0.95 | |||||
| Median | 9.0 | 9.0 | 9.0 | |||||
| Sig.bet.Grps | p1=0.350, p2<0.001*, p3=0.004* | |||||||
| Admission to NICU | ||||||||
| No | 33 | 94.3 | 32 | 91.4 | 22 | 62.9 | χ2= 14.885* | 0.001* |
| Yes | 2 | 5.7 | 3 | 8.6 | 13 | 37.1 | ||
| Sig.bet.Grps | FE p1=1.000, p2=0.001*, p3=0.004* | |||||||
| CBC | Group I (n = 35) | Group II (n = 35) | Group III (n = 35) | F | p |
|---|---|---|---|---|---|
| Hemoglobin (g/dl) | |||||
| Min. - Max. | 7.90 - 14.30 | 8.0 - 13.50 | 5.40 - 16.10 | 4.018* | 0.021* |
| Mean ± SD. | 11.17 ± 1.23 | 11.17 ± 1.35 | 12.05 ± 1.83 | ||
| Median | 11.10 | 11.20 | 11.90 | ||
| Sig. bet. grps. | p1=0.987, p2=0.016*, p3=0.015* | ||||
| WBCs (10³/μL) | |||||
| Min. - Max. | 5.99 - 13.10 | 5.40 - 17.10 | 5.12 - 26.67 | 1.939 | 0.149 |
| Mean ± SD. | 9.58 ± 2.19 | 10.85 ± 3.14 | 11.35 ± 5.51 | ||
| Median | 8.70 | 10.91 | 10.90 | ||
| Platelets (10³/μL) | |||||
| Min. - Max. | 120.0 - 447.0 | 108.0 - 393.0 | 52.0 - 400.0 | 8.852* | <0.001* |
| Mean ± SD. | 230.17 ± 69.41 | 242.37 ± 73.36 | 171.69 ± 82.07 | ||
| Median | 218.0 | 247.0 | 159.0 | ||
| Sig. bet. grps. | p1=0.499, p2=0.002*, p3<0.001* | ||||
The study was conducted on 105 pregnant women with gestational age ≥ 34 weeks. The cases were divided into three groups: group 1: 35 normotensive pregnant women as control group, group 2: 35 mild PE pregnant women, and group 3: 35 severe PE pregnant women.
PE patients were diagnosed and classified into mild and severe according to the strict criteria recommended by The American College of Obstetricians and Gynecologists (ACOG) [2]. The authors excluded cases with chronic hypertension, diabetes mellitus, renal or hepatic dysfunction, infectious diseases, premature rupture of membranes, and patients who received steroids within one week prior to inclusion.
All cases were subjected to detailed history taking, general and local abdominal examination, obstetric ultrasound for fetal biometry and amniotic fluid assessment, complete blood counts, including hemoglobin level, total white blood counts (WBCs), differential leucocytic count and platelets, which were obtained at the time of admission. Using ADVIA 2120i automated hematology system [23], NLR and PLR were calculated as the ratio of neutrophil count to lymphocyte count and the ratio of platelet count to lymphocyte count, respectively.
Measurement of serum CRP, using Dimension RXL max system was analyzed by particle enhanced turbidimetric immunoassay (PETIA). Other biochemical investigations were done including liver and renal function tests, management, and follow up until delivery with recording of mode of delivery, and maternal and fetal outcomes.
Data were fed to the computer and analyzed using SPSS software package version 20.0 [24, 25]. Qualitative data were described using number and percentage. The Kolmogorov-Smirnov test was used to verify the normality of distribution quantitative data which were then described using range (minimum and maximum), mean, standard deviation, and median. Significance of the ob-tained results was judged at the 5% level.
The authors found that maternal morbidity was significantly different among the three studied groups with maternal morbidity occurring in eight severe PE cases. There were three cases admitted to ICU with eclamptic fits, two cases admitted to ICU with eclamptic fits and HELLP syndrome (with one case of them developed bilateral retinal detachment), and three cases with HELLP syndrome only. There was no maternal mortality in the studied cases.
Regarding fetal outcome; neonatal birth weight, APGAR at one and five minutes and admission to NICU, there was no statistically significant difference between the control and mild PE cases, but there was statistically significant difference between the control and severe PE cases and between mild and severe PE cases as shown in Table 1.
Regarding different parameters of CBC, hemoglobin and platelet counts showed no statistically significant difference between the control and mild PE cases, but there was a statistically significant difference between the control and severe PE cases and between mild and severe PE cases as shown in Table 2. Regarding white blood, neutrophil, and lymphocyte counts, there was no statistically significant difference among the three studied groups as shown in Tables 2 and 3.
Regarding NLR, the results showed that there was no statistically significant difference between patients with PE and healthy pregnant women. PLR showed no statistically significant difference between the control and mild PE cases, but there was a statistically significant difference between the control and severe PE cases and between mild and severe PE cases as shown in Table 4.
| Group 1 (n = 35) | Group 2 (n = 35) | Group 3 (n = 35) | Test of Sig. | p | |
|---|---|---|---|---|---|
| Neutrophils (10³/µL) | |||||
| Min. - Max. | 3.22 - 11.10 | 3.30 - 15.20 | 3.60 - 24.76 | F = 2.353 | 0.100 |
| Mean ± SD. | 6.90 ± 2.14 | 8.08 ± 2.92 | 8.69 ± 4.88 | ||
| Median | 6.10 | 7.68 7.70 | |||
| Lymphocytes (10³/µL) | |||||
| Min. - Max. | 1.0 - 3.10 | 0.80 - 3.71 | 0.84 - 7.35 | H = 3.918 | 0.141 |
| Mean ± SD. | 1.97 ± 0.53 | 2.13 ± 0.70 | 1.93 ± 1.12 | ||
| Median | 2.06 | 2.10 | 1.70 |
| Group 1 (n = 35) | Group 2 (n = 35) | Group 3 (n = 35) | H | p | |
|---|---|---|---|---|---|
| NLR | 3.559 | 0.169 | |||
| Min. - Max. | 1.60 - 10.90 | 1.64 - 11.75 | 1.29 - 19.65 | ||
| Mean ± SD. | 3.92 ± 2.22 | 4.31 ± 2.58 | 5.28 ± 3.71 | ||
| Median | 3.0 | 3.43 | 4.08 | ||
| PLR | 7.386* | 0.025* | |||
| Min. - Max. | 46.15 - 260.53 | 56.84 - 287.69 | 16.15 - 292.10 | ||
| Mean ± SD. | 125.88 ± 52.42 | 126.37 ± 61.16 | 98.43 ± 59.11 | ||
| Median | 108.70 | 113.67 | 82.94 | ||
| Sig.bet.Grps | p1=0.784, p2=0.012*, p3=0.030* | ||||
In this study, CRP levels showed a statistically significant difference between the control and mild PE cases and between the control and severe PE cases, but there was no statistically significant difference between the mild and severe PE cases as shown in Table 5.
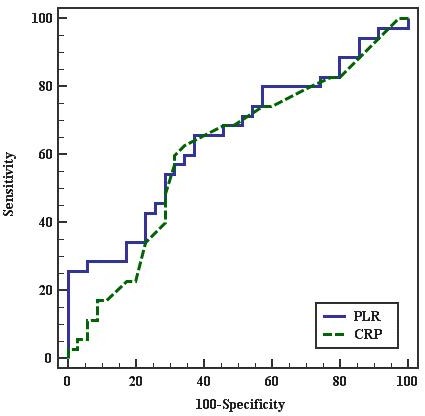
The Receiver Operating Characteristic (ROC) curve for the best cutoff points to predict PE in pregnant females was ≤ 77.5 for PLR and > 0.5 for CRP. PLR had 35.71% sensitivity, 85.71% specificity, 83.3% PPV. and 40% NPV. CRP had 75.71% sensitivity, 100% specificity, 100% PPV, and 67.3% NPV. This indicates that CRP is more sensitive and specific than PLR to predict PE in pregnant females as shown in Figure 1 and in Table 6.
On the other hand, the ROC curve for the best cutoff point to predict severity of PE in diagnosed PE females was ≤ 101.364 for PLR and > 1 for CRP. PLR had 65.71% sensitivity, 62.86% specificity, 63.9% PPV, and 64.7% NPV. CRP had 62.86% sensitivity, 65.71% specificity, 50.7% PPV, and 100% NPV. This indicates that PLR is more sensitive but less specific than CRP to predict severity of PE in pregnant females as shown in Figure 2 and in Table 7.
| Group 1 (n = 35) | Group 2 (n = 35) | Group 3 (n = 35) | H | p | |
|---|---|---|---|---|---|
| CRP (mg/dL) |
|||||
| Mean ± SD. | 0.30 ± 0.13 | 1.17 ± 1.17 | 1.66 ± 1.73 | ||
| Median | 0.30 | 0.70 | 1.30 | ||
| Sig.bet.Grps | p1<0.001*, p2<0.001*, p3=0.645 | ||||
| AUC | p | 95% C.I | Cut off | Sensitivity | Specificity | PPV | NPV | |
|---|---|---|---|---|---|---|---|---|
| PLR | 0.598 | 0.104 | 0.487 - 0.709 | ≤77.5 | 35.71 | 85.71 | 83.3 | 40.0 |
| CRP | 0.905 | <0.001* | 0.850 - 0.961 | >0.5 | 75.71 | 100.0 | 100.0 | 67.3 |
AUC: area under a curve; p value: probability value; CI: confidence intervals; NPV: negative predictive value; PPV: positive predictive value; *: Statistically significant at p ≤ 0.05.
| AUC | p | 95% C.I | Cut off | Sensitivity | Specificity | PPV | NPV | |
|---|---|---|---|---|---|---|---|---|
| PLR | 0.651* | 0.030* | 0.521 - 0.780 | ≤101.364 | 65.71 | 62.86 | 63.9 | 64.7 |
| CRP | 0.611 | 0.109 | 0.477 - 0.746 | >1 | 62.86 | 65.71 | 50.7 | 100.0 |
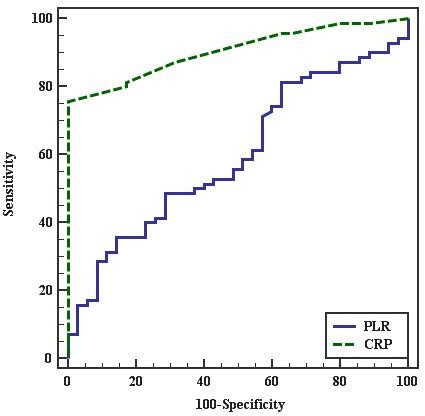 Figure 1.
— ROC curve for PLR and CRP to predict PE cases vs. control.
 Figure 2.
—ROC curve for PLR and CRP to predict severe PE cases vs. mild.
NLR is a good biomarker in conditions with low-grade inflammatory conditions [12, 13]. It is easily, effectively, and reliably estimated in cases with systemic inflammation [10]. The present data revealed no statistically significant difference between patients with PE and healthy pregnant women regarding NLR and this with agreement with the study of Yücel et al. [26] However, Yavuzcan et al. showed that NLR was statistically significant higher in severe PE females in comparison to healthy non-pregnant ones and in healthy pregnant females compared to non-pregnant ones, and not statistically significant between severe PE patients in comparison to healthy pregnant females [17]. In contrast to the present results, Toptas et al. found that NLR had a significant higher difference in patients with PE than cases with normal pregnancies, but no significant difference between PE patients with severe and mild degrees [22]. Serin et al. showed that NLR could predict the severity of the disease. They found that NLR had a significant high difference in PE patients compared to the healthy pregnant females. NLR was significantly higher in the severe PE cases than mild PE ones [27]. Akil et al. showed that NLR had a significant higher difference in mild and severe PE cases than in controls. It was also suggested that the increased NLR could be used as a predictor for the severity of PE [28]. Also, Oylumlu et al. showed that NLR of the PE cases could be used as a biomarker for different grades of PE [29].
The contradiction among the present results and the last four studies may be attributed to the small number and racial difference of the present studied cases. Those studies used the criteria recommended by ACOG (2002) [30] which included proteinuria, fetal growth restriction, and oligohydramnios as criteria to classify severe PE which the present authors omitted in this study.
It was suggested that PLR was a more sensitive marker of systemic inflammatory conditions and also a good factor regarding the prognosis in cases with breast, ovarian, and colorectal malignancy [16]. PLR is associated with many inflammatory conditions, yet the association of PLR and PE has somewhat limited data [16-18].
The present study showed that PLR had no statistically significant difference between the control and mild PE cases, but there was a statistically significant difference between the control and severe PE cases and between mild and severe PE cases. Yücel et al. found that PLR was lower in cases with severe PE than in the controls, and with a statistical significance which matched the present results [26]. Toptas et al. also found that PLR level was in comparison between PE and normal pregnant females. Also, patients with severe PE had lower PLR levels in comparison to mild cases [22]. These findings were in agreement with the present results. Kirbas et al. found lower PLR in mild PE group compared to controls, but with no statistical significant difference. PLR was higher in severe PE cases compared to mild PE and healthy pregnant females [31]. However, and contrary to the present results, Yavuzcan et al., the PLR had no significant different between cases with severe, mild PE, and healthy pregnant females [17]. The reason may be because the study showed no statistical significant difference with regards to platelet count between severe PE patients and healthy pregnant controls.
CRP is an acute phase protein, found in blood plasma, whose levels rise in response to inflammation. For a long time, a role of CRP in PE has been studied. The genetic variants of CRP associated to adverse cardiovascular outcomes may identify an association of such variants to PE [32]. A highly significant difference was evaluated [19, 33]. In this study, CRP levels showed statistically significant difference between the control and mild PE cases and between the control and severe PE cases, but there was no statistically significant difference between the mild and severe PE cases. Many studies have explored the association between CRP as a sensitive marker of inflammation and PE. Arikan et al. found similar results to this study. They found that plasma CRP had a significantly higher difference in severe PE patients in comparison to controls. Although CRP of mild PE cases has higher difference than controls and lower than severe PE cases, such differences were not statistically significant. Therefore, such elevated CRP in severe PE patients in comparison with normal controls might support the theory of PE being related to the increased inflammatory response [34]. Cebesoy et al. also showed that CRP had a significant higher difference in the PE cases, and significantly higher in severe cases and those with eclampsia than in mild [35].
Guven et al. showed that there was a statistical significant difference between the normal healthy pregnant females, mild and severe PE cases with a high sensitivity CRP (hs-CRP). Hs-CRP levels remained higher in severe PE cases than mild and normotensive ones [36] Üstün et al. reported higher CRP levels in mild and severe cases than that of normal control cases [37]. However, two studies failed to confirm the correlation between elevated CRP and PE. Djurovic et al. showed no differences in CRP and other inflammatory markers. Thus they concluded that there was no enhanced systemic inflammatory response in females who later developed PE [38]. Another study conducted by Savvidou et al., revealed that CRP in women who subsequently developed PE was not significantly different from those with uncomplicated pregnancies. Therefore they concluded that the onset of PE may not be proceeded by a maternal inflammatory response [39]. The disagreement of these studies may be because they were carried out earlier in pregnancy before the development of PE.
CRP was significantly higher and PLR was lower in severe PE than in mild PE and control groups. CRP was more sensitive and specific than PLR to predict PE in pregnant females, so it can be used in prediction of PE. PLR was more sensitive but less specific than CRP to predict severity of PE in pregnant females, so PLR can be used for early prediction of severity. NLR did not differ between severe PE, mild PE, and healthy pregnant women, so it cannot be used as a marker for prediction of PE or its severity.