

 , Ching-Fang Lee 1,*
1 Department of Business Administration, Chaoyang University of Technology, 413310 Taichung, Taiwan
Abstract
This study challenges the common stigma that social media addiction (SMA) reflects social disconnection. Using a dual-motivation framework, we examine how self-oriented and other-oriented motives shape green information sharing (GIS) and the internalization of green consumption values (GCV) within social media communities.
We analyzed cross-sectional survey data from 532 respondents in Taiwan, of whom 16.54% met the threshold for SMA. Analyses were conducted using Partial Least Squares Structural Equation Modeling (PLS-SEM) and Partial Least Squares Multi-Group Analysis (PLS-MGA). The PLS-MGA results revealed no significant differences in the structural paths between social media addicts and non-addicts. Independent sample t-tests were then employed to examine differences in the four main variables between the two groups.
The results show that social media addicts scored significantly higher than non-addicts on all four main variables. These findings suggest that social media addicts are more motivated and display stronger prosocial engagement than commonly assumed.
The dual-motivation framework applies to both social media addicts and non-addicts. Moreover, self-oriented motives also drive GIS, indicating that visible online prosocial acts can serve self-image goals.
Keywords
- social media addiction
- stigma
- self-oriented motivation
- other-oriented motivation
- online prosocial engagement
In an increasingly digital society, online platforms have become core arenas for civic participation, value expression, and community building (Shen et al., 2023). Social media has fundamentally reshaped social interaction and has become one of the most widely used channels of communication. In this context, users’ engagement with these platforms continues to rise. Through these spaces, individuals can engage in various visible actions to demonstrate self-identity, endorse shared causes, and promote social connection. One prominent form of such online prosocial participation is the public sharing of environmentally sustainable or “green” messages. These behaviors not only convey concern for environmental issues but also function as relational acts, connecting people who share similar values and worldviews (Sen et al., 2016; Xie et al., 2015).
Leveraging their real-time interaction and broad reach, social media platforms have become powerful tools for enhancing civic awareness and mobilizing community action (Shen et al., 2023). They attract stakeholders from diverse backgrounds to engage in public discussions that help shape social norms and collective consciousness. In this context, green information sharing (GIS) can strengthen moral responsibility, deepen social bonds, and foster a sense of belonging within online communities. Such public participation can also generate social pressure, motivating others to take similar actions (Byrum, 2019).
However, many previous studies have regarded green engagement on social media as a typical form of prosocial behavior rooted in altruistic values (Nivedhitha et al., 2024; Mansoor and Paul, 2022), a view that may be overly simplistic. Self-concept theory further suggests that people may reinforce their ideal self-image through GIS (Doster, 2013). In fact, self-orientation and other-orientation are not mutually exclusive; both may operate simultaneously to shape individuals’ participation in visible forms of online prosocial behavior (Krebs, 1991; Levit, 2014). This dual-motivation perspective is critical for understanding the authenticity, stability, and relational implications of such behaviors.
Patterns of social media use add further complexity to this phenomenon. Individuals who use social media frequently or compulsively may be more attuned to capturing social cues and opportunities for relationship maintenance (Hosni et al., 2020). While some research has suggested that such users display lower levels of altruistic motivation (Raggiotto et al., 2023), other findings indicate that they may be more actively involved in certain forms of prosocial behavior, such as charitable donations or advocacy (Mendini et al., 2022). These conflicting findings highlight the need to further examine the relationship between social media addiction (SMA) and online prosocial participation, especially in highly visible and value-driven behaviors such as GIS.
Social media use has a dual character, simultaneously fostering social connection and risking social disconnection (Ostic et al., 2021). Some studies suggest that excessive use heightens loneliness and reduces face-to-face interaction, whereas others argue that online participation can provide compensatory social support and mitigate isolation. Psychological accounts frequently link addiction to constructs such as fear of missing out (FoMO), attachment anxiety, and reward-system dysregulation (Musetti et al., 2025; Bunker and Kwan, 2023). This divergence underscores persisting knowledge gaps regarding the bidirectional, multifaceted relationship between addiction and disconnection (Yildirim et al., 2023; Bunker and Kwan, 2023). To address this gap, the present study examines whether social media addicts and non-addicts differ in relevant variables and structural pathways.
Therefore, this study aims to examine how self-oriented and other-oriented motivations (OO) are associated with GIS and the internalization of green consumption values (GCV) in online communities, and to compare the behavioral pathways between social media addicts and non-addicts. Through this analysis, we not only supplement research on visible environmental engagement but also deepen our understanding of how digital participation can function as a mechanism to promote social connection, foster social inclusion, and enhance community well-being. Based on the above discussion, this study proposes the following hypotheses, with all variables and hypothesized relationships presented in the conceptual model shown in Fig. 1.
Hypothesis 1. Self-orientation is positively associated with GIS.
Hypothesis 2. Other-orientation is positively associated with GIS.
Hypothesis 3. Self-orientation is positively associated with GCV.
Hypothesis 4. Other-orientation is positively associated with GCV.
Hypothesis 5. There are differences between social media addicts and non-addicts in the relevant variables and pathways.
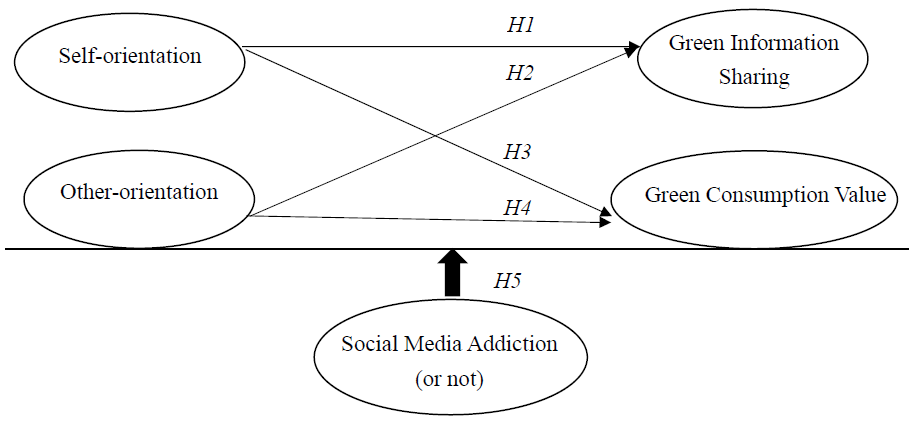 Fig. 1.
Conceptual Model. H, hypothesis.
This study employed a cross-sectional survey method to assess the conceptual model. Data were collected by a reputable market research company, which first used screening questions to confirm that participants had experience using social media, and system control measures were applied to prevent duplicate responses. To minimize potential interference arising from regional differences in social media usage habits and network infrastructure (Cheng et al., 2021), Taiwan was chosen as the research context, given its global leadership in information and communication technology (ICT) applications. Taiwan performed well in the World Digital Ranking, placing ninth among 67 economies in 2024 (IMD World Competitiveness Center, 2024). Prior to the study, sufficient information was provided to ensure that all participants gave informed consent.
The sample size was calculated based on statistical power analysis to ensure sufficient participants during the formal data collection phase. A priori analysis was conducted using the G-Power tool (Faul et al., 2009) to confirm the adequacy of the sample size. Following Cohen’s (1988) recommendations, the final sample of 532 participants achieved a statistical power of 99%, significantly exceeding the standard requirement.
As shown in Table 1, the survey collected 532 valid samples, with an average participant age of 37.19 years (SD = 9.06). Of all participants, 37.22% were male, and 62.78% were female. The majority of participants had a university degree (74.81%), with the remaining participants having a high school or vocational education (14.10%) and master’s or above (11.09%). According to the criteria suggested by Pontes et al. (2018), 88 participants (16.54%) met the threshold for SMA, which aligns with the 8%–19% prevalence range reported in previous meta-analyses (Cheng et al., 2021). This indicates that the study’s data are consistent with broader population distributions, thereby enhancing the external validity of the results.
| N = 532 | Categories | Frequency | Percentage (%) |
| Gender | Male | 198 | 37.22% |
| Female | 334 | 62.78% | |
| Education | High school or below | 75 | 14.10% |
| University | 398 | 74.81% | |
| Master’s or above | 59 | 11.09% | |
| SMA | Yes | 88 | 16.54% |
| No | 444 | 83.46% | |
| Mean | SD | ||
| Age (years) | 37.19 | 9.06 |
SMA, social media addiction.
The survey utilized several established scales from previous literature, all of which were measured using a 5-point Likert scale ranging from 1 (strongly disagree) to 5 (strongly agree). The questionnaire was professionally translated into Chinese by bilingual experts, followed by a semantic validation process with ten native Chinese speakers and a back-translation procedure to ensure fidelity to the original texts. The scales are described as follows.
GCV was measured using the GCV scale developed by Haws et al. (2014), which aims to capture the extent to which individuals express environmental protection values through their purchasing and consumption behaviors. The scale consists of six items on a single dimension, with sample items including, “My purchasing habits are affected by my concern for the environment”.
GIS was measured using the social media information sharing (SMIS) scale developed by Bock et al. (2005), which consists of five items on a single dimension and primarily assesses users’ attitudes toward information sharing on social media. In this study, the focus was specifically on green-related information. A sample item includes, “Sharing environmentally friendly green information with others on social media is valuable to me”.
Self-orientation was adapted from Whiting and Williams (2013), which measures the self-related motivations for using social media. The scale consists of four items on a single dimension, with sample items such as, “On social media, I enjoy gaining attention and praise through posts, status updates, or showcasing achievements”, and “I often seek likes, comments, and shares to enhance my emotional satisfaction”.
Other-orientation was adapted from Apuke and Omar (2021), primarily measuring the other-oriented use of social media. The scale consists of five items on a single dimension, with sample items such as, “I engage, share, and respond on social media because I want to remind others of important issues”.
SMA was assessed using the Bergen Social Media Addiction Scale (BSMAS), which consists of six items evaluating participants’ levels of SMA over the past 12 months. The six items reflect typical elements of addiction, including salience, mood modification, tolerance, withdrawal, conflict, and relapse (Griffiths, 2005; Schou Andreassen et al., 2016). The scale has been validated across different language versions. In social media research, addictive behavior is a clinically diagnosable term, and the prevalence of SMA has been validated using various threshold criteria, though these thresholds may change over time (Cheng et al., 2021). For this study, a more stringent threshold of 4 was adopted to test Hypothesis 5, as recommended by Pontes et al. (2018).
This study employed Partial Least Squares Structural Equation Modeling (PLS-SEM) software for statistical analysis, as it is capable of estimating models with smaller sample sizes and handling complex relationships between multiple variables. For common method variance (CMV) testing, the Harman single-factor test explained 36.142% of the variance, which is well below the 50% threshold. Multicollinearity analysis showed that all VIF values ranged between 1.56 and 2.10, well below the recommended threshold of 3.3 proposed by Kock and Lynn (2012), indicating that CMV was not a major concern in this study. In the subsequent analysis, the measurement model was first evaluated, followed by the validation of the structural equation model (Sarstedt et al., 2017) to test the impact pathways among the variables for Hypotheses 1 to 4. Finally, Partial Least Squares Multi-Group Analysis (PLS-MGA) was employed to examine the differences in the pathways between the groups of social media addicts and non-addicts.
The reliability and validity of the five reflective constructs included in the research model were evaluated. To ensure good convergent validity, all factor loadings were required to exceed 0.6 (Hair et al., 2017). Based on this criterion, the constructs were unidimensional, and only items with loadings above 0.6 were retained in the measurement model (Shi and Maydeu-Olivares, 2020; Hair et al., 2010). As shown in Table 2, without removing any items, all Cronbach’s alpha values ranged from 0.835 to 0.848, and all composite reliability (CR) values exceeded the recommended threshold of 0.7, indicating sufficient internal consistency reliability (Hair et al., 2010). The average variance extracted (AVE) was used to assess convergent validity, with AVE values ranging from 0.554 to 0.688, all above the recommended threshold of 0.5 proposed by Fornell and Larcker (1981), indicating that the constructs explained over half of the variance in their respective items. Additionally, as shown in Table 3, all item loadings exceeded 0.7. These results confirm the discriminant validity of the constructs.
| Construct | Cronbach Alpha | CR | AVE |
| OO | 0.848 | 0.892 | 0.623 |
| SO | 0.848 | 0.898 | 0.688 |
| GIS | 0.835 | 0.884 | 0.603 |
| GCV | 0.839 | 0.882 | 0.554 |
Note: OO, other-oriented motivation; SO, self-oriented motivation; CR, composite reliability; AVE, average variance explained; GIS, green information sharing; GCV, green consumption value.
| Construct | OO | SO | GIS | GCV |
| OO 1 | 0.817 | |||
| OO 2 | 0.784 | |||
| OO 3 | 0.800 | |||
| OO 4 | 0.761 | |||
| OO 5 | 0.782 | |||
| SO 1 | 0.826 | |||
| SO 2 | 0.869 | |||
| SO 3 | 0.849 | |||
| SO 4 | 0.771 | |||
| GIS 1 | 0.784 | |||
| GIS 2 | 0.787 | |||
| GIS 3 | 0.768 | |||
| GIS 4 | 0.781 | |||
| GIS 5 | 0.762 | |||
| GCV 1 | 0.747 | |||
| GCV 2 | 0.756 | |||
| GCV 3 | 0.732 | |||
| GCV 4 | 0.748 | |||
| GCV 5 | 0.739 | |||
| GCV 6 | 0.744 |
The overall model fit is acceptable. SRMR is 0.055 for the saturated model and 0.082 for the estimated model-below or close to the 0.08 guideline. The discrepancy based on Unweighted Least Squares (d_ULS) (0.639; 1.428) and the discrepancy based on Geodesic distance (d_G) (0.202; 0.241) are small, indicating the covariance structure is well reproduced. The chi-square values (632.725; 719.294) are large, which is common with large samples or complex models. NFI is 0.872 and 0.854, suggesting a moderate comparative fit (Hair et al., 2010). In sum, the model shows a satisfactory and methodologically acceptable fit. The f-square results indicate medium effects of OO on both endogenous constructs (GCV = 0.251; GIS = 0.272). By contrast, self-oriented motivation (SO) shows minor effects (GCV = 0.007; GIS = 0.011). R-squared/adjusted R-squared for GCV are 0.315/0.312, and for GIS are 0.344/0.341, exhibiting moderate explanatory strength.
The HTMT and CI (confidence intervals) results support satisfactory discriminant validity as shown in Table 4. Pairwise HTMT values range from 0.449 to 0.728, all below the commonly used 0.85 threshold, indicating that the constructs are well differentiated (Henseler et al., 2015). The bootstrap 95% confidence intervals span 0.354–0.804, with upper bounds not approaching 1.00. Overall, the constructs do not exhibit excessive overlap, providing empirical support for the discriminant validity of the measurement model.
| Original sample (O) | Sample mean (M) | 2.5% CI | 97.5% CI | |
| GIS |
0.728 | 0.728 | 0.648 | 0.804 |
| OO |
0.659 | 0.658 | 0.575 | 0.737 |
| OO |
0.687 | 0.687 | 0.604 | 0.765 |
| SO |
0.449 | 0.448 | 0.354 | 0.536 |
| SO |
0.479 | 0.479 | 0.391 | 0.562 |
| SO |
0.684 | 0.684 | 0.615 | 0.750 |
Note: HTMT, heterotrait-monotrait ratio; CI, confidence intervals.
The common Fornell-Larcker criterion for discriminant validity, as seen in Table 5, shows that the square root of each construct’s AVE was greater than the correlation with any other construct (Fornell and Larcker, 1981).
| Construct | OO | GCV | SO | GIS |
| OO | 0.789 | |||
| GCV | 0.557 | 0.744 | ||
| SO | 0.580 | 0.378 | 0.829 | |
| GIS | 0.580 | 0.609 | 0.406 | 0.777 |
Note: Values on the diagonals present the square roots of AVE.
As shown in Table 6, the upper part of the table presents the path analysis for
the impact of self- and other-orientation on GIS. The effect of other-orientation
on GIS was positive and significant (
| Path | Coeff. | t-value | p-value | Hypothesis |
| OO |
0.519*** | 11.781 | 0.000 | Supported |
| SO |
0.105* | 2.481 | 0.013 | Supported |
| OO |
0.509*** | 11.388 | 0.000 | Supported |
| SO |
0.083 | 1.753 | 0.080 | Not supported |
Note: Based on 5000 bootstrap samples.
*p
The lower part of the table presents the path analysis for the impact of both
orientations on GCV. The effect of other-orientation on GCV was positive and
significant (
Overall, the results indicate that both GIS and GCV are associated with other-orientation, while self-orientation is associated only with GIS.
To verify the generalizability of the concept and compare whether SMA negatively
impacts GIS and values, this study conducted multi-group analysis (MGA). To
ensure the validity of between-group comparisons prior to MGA, we conducted the
MICOM procedure in SmartPLS with 5000 permutations to assess measurement
invariance between the social media addicts and non-addicts. As shown in Table 7,
Step 2 (compositional invariance) held for all constructs (GCV = 0.393; GIS =
0.518; OO = 0.288; SO = 0.233; all p
| Construct | Step 2 Compositional Invariance (p-value) | Step 3a Equality of Means (p-value) | Step 3b Equality of Variances (p-value) |
| GCV | 0.393 | 0.000 | 0.963 |
| GIS | 0.518 | 0.000 | 0.180 |
| OO | 0.288 | 0.000 | 0.265 |
| SO | 0.233 | 0.000 | 0.000 |
The MGA pathway test results are shown in Table 8; no significant differences
were found between the groups based on gender, age, income, or SMA (p
| Path | Gender | Age | Income | SMA |
| OO |
0.727 | 0.852 | 0.178 | 0.291 |
| SO |
0.343 | 0.711 | 0.473 | 0.583 |
| OO |
0.540 | 0.485 | 0.529 | 0.801 |
| SO |
0.567 | 0.346 | 0.529 | 0.864 |
Note: Based on 5000 bootstrap samples, the values in the table represent two-tailed p-values. PLS-MGA, Partial Least Squares Multi-Group Analysis.
Gender is categorized based on biological sex (male/female); age is split into groups above and below 30; income is divided by the national median income; SMA is grouped by threshold values.
On the other hand, this study further employed independent sample
t-tests to examine differences in the four main variables between social
media addicts and non-addicts. The results, shown in Table 9, indicate
significant differences between social media addicts (M = 4.04, SD = 0.55) and
non-addicts (M = 3.24, SD = 0.73) in self-orientation (t = –11.52***, p
| Construct | Group | Mean (SD) | t-value | p-value |
| SO | Non-SMA | 3.24 (0.73) | –11.52*** | 0.000 |
| SMA | 4.04 (0.55) | |||
| OO | Non-SMA | 3.61 (0.54) | –8.34*** | 0.000 |
| SMA | 4.13 (0.49) | |||
| GIS | Non-SMA | 3.86 (0.51) | –6.49*** | 0.000 |
| SMA | 4.25 (0.46) | |||
| GCV | Non-SMA | 3.82 (0.51) | –5.99*** | 0.000 |
| SMA | 4.18 (0.51) |
Note: ***p
In summary, social media addicts scored significantly higher than non-addicts on all four main variables. However, in terms of the effect pathways, the SMA group did not exhibit stronger effects compared to the non-addiction group.
This study aimed to examine the effects of self-oriented and OO on GIS and the internalization of GCV, as well as to compare differences in motivation and behavior between social media addicts and non-addicts. The results revealed that: (1) both types of motivation positively predicted GIS, but only other-orientation significantly predicted the internalization of GCV; (2) social media addicts scored significantly higher than non-addicts on all four key variables: self-orientation, other-orientation, GIS, and GCV internalization; and (3) multi-group analysis showed no significant differences in the structural relationships between the two groups, indicating that their behavioral patterns were similar.
Previous studies have often portrayed green engagement on social media as a prototypical form of prosocial behavior rooted in altruistic values (Nivedhitha et al., 2024; Mansoor and Paul, 2022), overlooking the potential role of SO.
This study found that even in highly value-driven behaviors, self-orientation significantly promoted information sharing, suggesting that such behaviors are not driven solely by altruistic concern but may also serve self-image enhancement functions (Doster, 2013). While our findings confirm that social media addicts scored higher in self-orientation than non-addicts (Raggiotto et al., 2023), this did not translate into lower prosocial engagement. On the contrary, they also scored higher in other-orientation, information sharing, and value internalization. This suggests that the common portrayal of social media addicts as less prosocial may be an oversimplified—and potentially stigmatizing—assumption, warranting further examination and clarification in future research.
From a practical perspective, our findings highlight the importance of simultaneously appealing to both self-oriented and OO. Platforms and nonprofit organizations that design messages addressing both personal image expression and concern for others may be more effective in increasing participation rates. Although social media addicts exhibit higher levels of motivation and behavior than non-addicts, the similarity in their behavioral patterns indicates that the dual-motivation framework applies across user groups. Future research could further examine the applicability of this framework to other forms of digital prosocial behavior, such as online volunteering or public issue advocacy, and explore how the relative weight of self- and other-orientation may vary across contexts to more fully understand motivational mechanisms in digital social participation.
This study has several limitations. First, the cross-sectional design limits causal inference, and reverse causality cannot be ruled out. Second, potential interaction effects between self- and other-orientation were not examined and may be associated with prosocial engagement in more complex ways. Third, the study focused on GIS as one form of visible online prosocial behavior; future work should explore whether similar motivational patterns hold for other digital prosocial acts, such as online volunteering or mental health advocacy. Fourth, the sample was drawn from a single region. Although Taiwan offers a compelling context given its global leadership in ICT applications, future research should replicate the analyses across diverse cultural settings to evaluate the robustness and generalizability of the findings. Finally, SMA is a multifaceted construct, and its nuanced links to motivation and behavior merit further investigation.
This study challenges the common conflation of SMA with social disconnection and its associated stigma. Using a dual-motivation framework, we find that both self-oriented and OO predict GIS, whereas only OO reliably predicts the internalization of GCV. Multi-group analyses indicate no significant differences in these structural paths between social media addicts and non-addicts. Notably, social media addicts score higher on self-orientation, other-orientation, GIS, and GCV. The results show that they are not less prosocial; rather, they exhibit greater visible online prosocial engagement.
This study has several limitations. First, the cross-sectional design limits causal inference, and reverse causality cannot be ruled out. Second, potential interaction effects between self- and other-orientation were not examined and may be associated with prosocial engagement in more complex ways. Third, the study focused on GIS as one form of visible online prosocial behavior; future work should explore whether similar motivational patterns hold for other digital prosocial acts, such as online volunteering or mental health advocacy. Fourth, the sample was drawn from a single region. Although Taiwan offers a compelling context given its global leadership in ICT applications, future research should replicate the analyses across diverse cultural settings to evaluate the robustness and generalizability of the findings. Finally, SMA is a multifaceted construct, and its nuanced links to motivation and behavior merit further investigation.
The research data supporting the findings of this article are available from the corresponding author upon reasonable request.
CPL developed the framework, designed the questionnaire, supervised data collection, curated the data, secured resources, and managed project administration. CFL refined the theoretical framework, performed and verified the statistical analyses, and validated data quality and robustness. CPL drafted the Introduction and Discussion, and CFL drafted the Literature Review, Results, and Conclusion. Both authors contributed to interpretation, visualization, and manuscript revision. Both authors read and approved the final manuscript, participated sufficiently in the work, and agreed to be accountable for all aspects of the work.
This study was conducted in accordance with the ethical principles outlined in the 1975 Helsinki Declaration (revised in 2000). Participants provided informed consent and were assured of anonymity and confidentiality. The research only involved presenting prepared materials relevant to the study’s objectives and collecting survey responses; given the nature of the study, a formal institutional ethics review was not deemed necessary.
The authors gratefully acknowledge the Department of Business Administration, Chaoyang University of Technology, for providing the research environment and facilities that supported this study. We also sincerely thank all respondents for their time and cooperation in completing the survey.
This research received no external funding.
The authors declare no conflict of interest.
The authors used ChatGPT (OpenAI, San Francisco, CA, USA) to improve the clarity and fluency of the manuscript’s language. The authors carefully reviewed and approved all content, and take full responsibility for the final version.
References
Publisher’s Note: IMR Press stays neutral with regard to jurisdictional claims in published maps and institutional affiliations.