


1 Department of Psychology, Gachon University, 13120 Seongnam, Republic of Korea
Abstract
The Bergen Social Media Addiction Scale (BSMAS) is a self-report scale used to measure the severity of social media addiction symptoms. Although the BSMAS has been validated and proven to be reliable in Korean adults, few studies have examined its psychometric properties in Korean adolescents. Therefore, the aim of this study was to confirm the validity and reliability of the BSMAS in Korean adolescents.
The BSMAS, the Social Media Addiction Proneness Scale (SMAPS), and the Social Network Site Use Motives Scale-Revised (SUMS-R) were administered to a cohort of 296 Korean adolescents. Confirmatory factor analysis (CFA) was performed to examine the construct validity. Internal consistency and convergent validity were examined. Additionally, measurement invariance tests across gender and age were conducted.
The modified one-factor model exhibited a good model fit. The BSMAS showed statistically significant correlations with all eight subscales of the SUMS-R and with the SMAPS, confirming convergent validity. The BSMAS showed high Cronbach’s α, and its items showed acceptable item-total correlations. Measurement invariance testing across genders confirmed configural and metric invariance, but scalar invariance was not achieved. In contrast, the measurement invariance test across age groups demonstrated stronger evidence of invariance.
These results suggest that the BSMAS is a useful tool for assessing social media addiction in Korean adolescents and provide preliminary evidence of its validity in this population. However, the failure to confirm scalar invariance emphasizes that gender-specific comparisons should be interpreted with caution.
Keywords
- social media addiction
- Bergen Social Media Addiction Scale
- adolescent
- Korean
Social media refers to an online space where individuals share common interests, communicate with colleagues and friends, and present information for self-expression (Cai et al., 2025). According to recent statistics, the number of social media users worldwide exceeded 5 billion in 2024 and is projected to reach 6 billion by 2029 (Statista, 2024). Although social media offers many benefits, problematic use can lead to negative consequences, such as social media addiction.
Social media addiction refers to excessive involvement with social media, a compulsive desire to access it, the excessive use of time and energy, and impaired interpersonal or occupational functioning due to its use (Wang et al., 2025). Social media addiction is classified as a type of behavioral addiction and is characterized by six components common to all behavioral addictions: salience, mood modification, tolerance, withdrawal symptoms, conflict, and relapse (Çiftci et al., 2025).
Social media addiction has been reported to cause academic, social, and psychiatric impairments in adolescents (Çiftci et al., 2025). For example, adolescents’ social media addiction influences insomnia through depressive symptoms (Çiftci et al., 2025); adolescents who use social media for more than 2 hours per day show lower scores on academic performance and engagement (Tsitsika et al., 2014); and social media addiction negatively impacts adolescents’ experiences with cyberbullying (Kucuk et al., 2024).
Due to having one of the highest smartphone penetration rates in the world, Korean teenagers are exposed to social media at a younger age than their peers in many other countries (Kyung and Kim, 2019). In addition, due to Korea’s competitive and test-oriented educational environment, adolescents experience substantial academic stress and often use social media as a coping mechanism to relieve this stress (Bae et al., 2020). Moreover, Korean teenagers have become increasingly sensitive to social comparison and the fear of missing out (FOMO), which reflects a collectivist yet competitive cultural context in which peer recognition is strongly mediated by social media (Han and Kim, 2020). Finally, platforms such as KakaoTalk, Instagram, and TikTok are deeply embedded in the peer culture of Korean teenagers, and social media use is integrated with other digital content, such as online games, short-form videos, and webtoons, increasing the risk of problematic use (Kwack and Kang, 2020). Taken together, social media addiction among Korean adolescents should be understood within Korea’s technological, educational, and cultural context.
Various scales have been developed to measure social media addiction (Watson et al., 2020). One of the most widely used scales is the Bergen Social Media Addiction Scale (BSMAS). The BSMAS has been used in various cultural contexts, and its validity and reliability have been verified (Bottaro et al., 2025). For example, Arrivillaga et al. (2024) validated the Spanish version of the scale and confirmed robust psychometric properties for Spanish speakers. Similarly, Monacis et al. (2017) demonstrated the reliability and validity of the Italian version of the scale, further exploring the relationship between social media addiction and attachment type. In Asia, Lin et al. (2017) used the Persian version to verify the validity of the scale using classical test theory and Rasch model, and Leung et al. (2020) reported the stable psychometric properties of the BSMAS for young people in China. These cross-cultural validation studies have confirmed the strength of the scale while also indicating limitations in its applicability in different socio-cultural contexts. In addition, several studies reported that the BSMAS has demonstrated reliability and validity among adolescents as well as adults (Rouleau et al., 2023; Watson et al., 2020; Arrivillaga et al., 2024). Given the lack of validation studies of the BSMAS for Korean adolescents and the potential influence of educational and cultural contexts on the expression and measurement of social media addiction, this study is necessary to establish the appropriateness of the BSMAS for this population.
Therefore, this study examines the validity and reliability of the BSMAS for Korean adolescents. The purpose of this study was to (1) examine the factor structure of the BSMAS for Korean adolescents, (2) confirm the internal consistency of the BSMAS, (3) assess the convergent validity of the BSMAS, and (4) verify the measurement invariance of the BSMAS across gender and age. Establishing measurement invariance ensures that the same construct is measured in the same way across groups (Putnick and Bornstein, 2016). Testing measurement invariance across gender and age ensures that men and women, as well as different age groups, interpret and respond to the BSMAS items equivalently. According to previous studies (Aparicio-Martínez et al., 2020; Politte‐Corn et al., 2023), gender and age differences have been observed in social media addiction. Testing measurement invariance across gender and age addresses the risk that differences observed in social media addiction scores may reflect measurement artifacts rather than actual psychological differences (Al-Dassean and Murad, 2025; Sisí et al., 2025). Therefore, demonstrating measurement invariance across gender and age is a prerequisite for conducting valid group comparisons and enhancing the interpretability and generalizability of the results.
296 Korean adolescents participated in this study. Data were collected using convenience sampling. Among the participants, 154 (52.0%) were female, and 142 (48.0%) were male. The mean age of the adolescents was 16.32 years (standard deviation [SD] = 0.718), and the age range was 15 to 17 years. Westland’s (2010) lower bound formula for structural equation modeling was applied to determine the adequacy of the sample size, which indicated that at least 200 participants were required for the six-item, single-factor model in this study. A total of 296 participants were recruited, thereby exceeding this minimum requirement. All the participants were active social media users, with an average daily usage time of 144.57 minutes (SD = 99.677). Participants completed the questionnaire using a pen or pencil. The participants in this study were part of the sample used in a previous study (Kim and Lim, 2021). However, the present study employed different psychological measurement tools, focused on a different analytical perspective, and tested independent research questions and hypotheses.
The BSMAS (Andreassen et al., 2016) is a measure of symptoms of social media addiction. The BSMAS includes 6 items based on a 5-point Likert-type scale (1 = very rarely to 5 = very often). Each item represents core elements of social media addiction (i.e., salience, tolerance, mood modification, conflict, withdrawal, and relapse). In this study, the Korean version of the BSMAS was used (Shin, 2022). The internal consistency of this scale was 0.86 (Shin, 2022).
The SMAPS (Jung and Kim, 2014) is a measure of social media addiction proneness. The SMAPS includes 24 items based on a 4-point Likert-type scale (1 = strongly disagree to 4 = strongly agree). The scale includes four dimensions: tolerance and preoccupation, avoidance of negative emotions, daily life disturbance and loss of control, and virtual life orientation and withdrawal. The internal consistency of this scale was 0.92 (Jung and Kim, 2014). In this study, this scale was used to confirm the convergent validity of the BSMAS.
The SUMS-R (Lim, 2023) is used to measure social media use motives. The
SUMS-R includes 40 items based on a 5-point Likert-type scale (1 = strongly
disagree to 5 = strongly agree). The scale includes eight dimensions:
information, enhancement, social, coping, pastime, conformity, expression, and
concealment motives. Social media use motives refer to the reasons for using
social media, shaped by prior social media experiences, and are known as the
proximal determinants of social media use and social media addiction (Lim, 2023). In this study, this scale was used to confirm the convergent validity of the BSMAS. Internal consistency tests yielded Cronbach’s
The collected quantitative data were analyzed using SPSS version 27.0 (IBM Corp., Armonk, New York, USA) and Mplus version 8.8 (Muthén & Muthén, Los Angeles, CA, USA). A p-value of 0.05 was considered statistically significant. The factor structure of the BSMAS was examined using confirmatory factor analysis (CFA). Table 1 presents the standards for the fit indices introduced in the study (Schermelleh-Engel et al., 2003).
| Fit measure | Good | Acceptable | Pre-modification fit indices | Post-modification fit indices |
| 0 |
3 |
3.91 | 1.62 | |
| RMSEA | 0 |
0.05 |
0.10 [0.07, 0.14] | 0.05 [0.00, 0.10] |
| CFI | 0.97 |
0.95 |
0.95 | 0.99 |
| TLI | 0.97 |
0.95 |
0.91 | 0.98 |
| SRMR | 0 |
0.05 |
0.03 | 0.03 |
Note:
CFA was conducted to determine whether the one-factor model derived from a previous study of Korean college students was applicable to Korean adolescents. If the one-factor model did not meet the established criteria, an alternative model was constructed using modification indices and its fit was re-examined.
In this study, measurement invariance tests were conducted to examine whether the factor structure was maintained across gender and age groups (15–16 years vs. 17 years). In these analyses, the fit of the configural, metric, and scalar models was evaluated, and differences in model fit between these models were examined to establish measurement invariance. Because Chen’s (2007) recommendation of a minimum of 200 cases per group was not met, invariance was considered established when the difference in comparative fit index (CFI) values between models was less than or equal to 0.005 and the difference in root mean square error of approximation (RMSEA) values was less than or equal to 0.010.
To examine the internal consistency of the scale, we calculated the Cronbach’s
Prior to the main analysis, Harman’s single-factor test was conducted to examine the presence of common method bias, which can occur when all variables are measured at a single time point and collected through self-report. Exploratory factor analysis of all 70 items revealed 11 factors with eigenvalues greater than 1, with the first factor accounting for 25.17% of the total variance. Because a single factor did not explain more than 50% of the total variance, the likelihood of significant common method bias was considered low (Podsakoff et al., 2003).
The data failed to meet the assumption of multivariate normality (two-sided
multivariate skew test of fit = 12.05, p
Because the fit of the one-factor model was insufficient, the structure of the
model was modified based on the modification index’s suggestions. The modified
model is a one-factor model that allows correlations between items 1 and 2
(Fig. 1). The goodness-of-fit indices for the modified one-factor model are
presented in Table 1. The RMSEA, CFI, TLI,
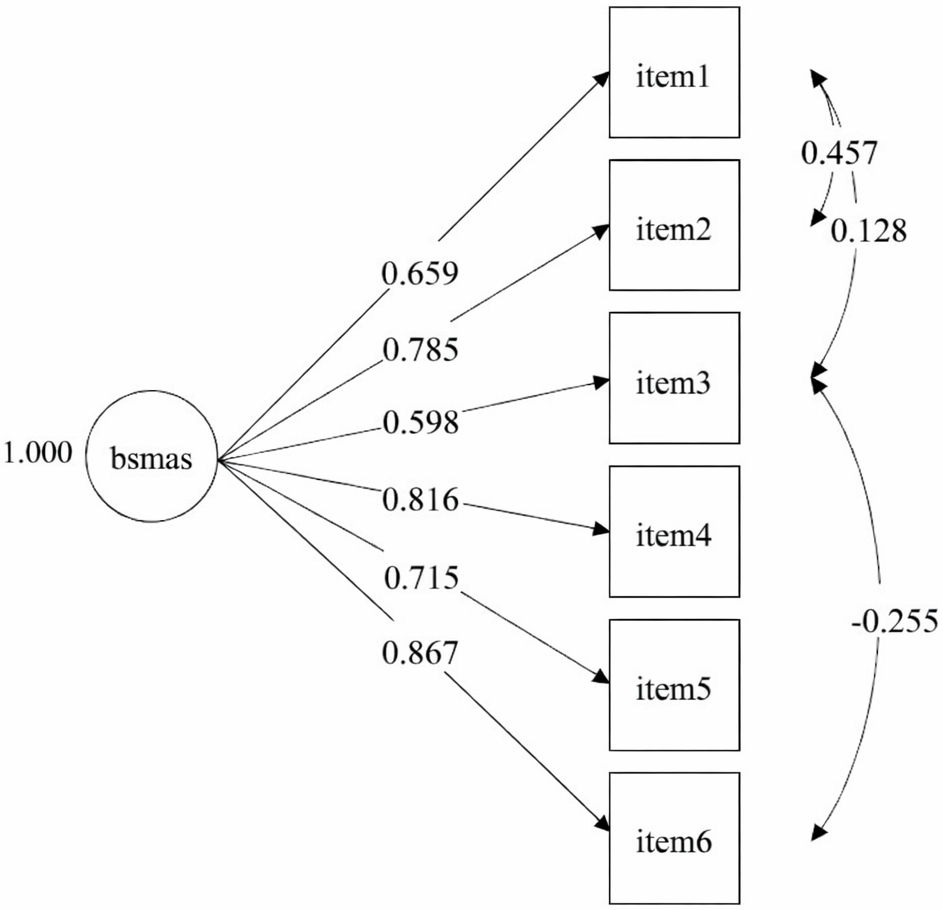 Fig. 1.
Modified one-factor model of the BSMAS. BSMAS, Bergen Social Media Addiction Scale.
The Cronbach’s
| Items | Mean | SD | Corrected item-total correlation | |
| 1. | 2.12 | 1.10 | 0.70 | 0.87 |
| 2. | 1.96 | 1.06 | 0.79 | 0.85 |
| 3. | 1.77 | 0.93 | 0.57 | 0.89 |
| 4. | 1.87 | 1.04 | 0.76 | 0.86 |
| 5. | 1.43 | 0.74 | 0.67 | 0.88 |
| 6. | 1.86 | 1.02 | 0.75 | 0.86 |
SD, standard deviation.
Measurement invariance was examined using multi-group CFA (multi-group CFA)
across gender. Fit indices for each step (configural, metric, and scalar
invariance models) is presented in Table 3. The configural invariance model
showed good fit,
| Model | df | CFI | RMSEA (90% CI) | SRMR | Δ |
ΔCFI | ΔRMSEA | ΔSRMR | |
| Configural | 26.960 | 16 | 0.981 | 0.068 (0.013–0.111) | 0.032 | - | - | - | - |
| Metric | 36.812 | 21 | 0.972 | 0.071 (0.030–0.109) | 0.065 | 9.939 (5) | –0.009 | 0.003 | 0.033 |
| Scalar | 49.568 | 26 | 0.959 | 0.078 (0.044–0.111) | 0.062 | 14.120 (5) | –0.013 | 0.007 | –0.003 |
Note. CI, confidence interval.
The scalar invariance model indicated an acceptable but weaker fit,
Measurement invariance was examined across age groups using multi-group
confirmatory factor analysis (CFA). Fit indices for each step is presented in
Table 4. The configural invariance model demonstrated good fit (
| Model | df | CFI | RMSEA (90% CI) | SRMR | Δ |
ΔCFI | ΔRMSEA | ΔSRMR | |
| Configural | 19.883 | 16 | 0.993 | 0.040 (0.000–0.091) | 0.027 | - | - | - | - |
| Metric | 23.982 | 21 | 0.994 | 0.031 (0.000–0.079) | 0.049 | 4.099 (5) | 0.001 | –0.009 | 0.022 |
| Scalar | 26.888 | 26 | 0.998 | 0.015 (0.000–0.067) | 0.048 | 1.740 (5) | 0.004 | –0.016 | –0.001 |
The scalar invariance model further demonstrated good fit (
The results of the correlation analysis using the scale administered to the
participants to confirm the convergent validity of the BSMAS are presented in
Table 5. The BSMAS showed a statistically significant positive correlation with
the SMAPS, which measures social media addiction proneness (r = 0.68, p
| 1 | 2 | 3 | 4 | 5 | 6 | 7 | 8 | 9 | 10 | |
| 1. BSMAS | - | |||||||||
| 2. SMAPS | 0.68 | - | ||||||||
| 3. Information | 0.36 | 0.34 | - | |||||||
| 4. Enhancement | 0.48 | 0.51 | 0.61 | - | ||||||
| 5. Social | 0.49 | 0.55 | 0.53 | 0.58 | - | |||||
| 6. Coping | 0.60 | 0.63 | 0.46 | 0.56 | 0.61 | - | ||||
| 7. Pastime | 0.52 | 0.53 | 0.52 | 0.69 | 0.61 | 0.62 | - | |||
| 8. Conformity | 0.42 | 0.56 | 0.43 | 0.36 | 0.72 | 0.61 | 0.50 | - | ||
| 9. Expression | 0.46 | 0.51 | 0.48 | 0.51 | 0.73 | 0.54 | 0.48 | 0.63 | - | |
| 10. Concealment | 0.45 | 0.57 | 0.29 | 0.34 | 0.53 | 0.60 | 0.42 | 0.70 | 0.67 | - |
| Mean | 11.00 | 43.44 | 15.23 | 15.98 | 12.84 | 10.61 | 14.63 | 9.47 | 11.07 | 8.76 |
| SD | 4.74 | 12.20 | 4.22 | 4.12 | 4.21 | 4.48 | 4.77 | 3.84 | 4.29 | 3.52 |
| Range | 6–26 | 24–75 | 5–25 | 5–25 | 5–24 | 5–24 | 5–25 | 5–19 | 5–25 | 5–19 |
| Cronbach’s |
0.89 | 0.94 | 0.84 | 0.88 | 0.83 | 0.91 | 0.86 | 0.91 | 0.91 | 0.92 |
Note. N = 296.
SMAPS, Social Media Addiction Proneness Scale; SD, standard deviation; information = information motives; enhancement = enhancement motives; social = social motives; coping = coping motives; pastime = pastime motives; conformity = conformity motives; expression = expression motives; concealment = concealment motives.
All correlation coefficients were statistically significant at the p
This study was conducted to evaluate the psychometric properties of the BSMAS in Korean adolescents. The BSMAS was found to have a modified one-factor structure, good convergent validity, and acceptable internal consistency. In addition, while the measurement invariance of the modified one-factor structure of the BSMAS across age was confirmed, the measurement invariance across gender was only partially confirmed.
In testing measurement invariance across age in the BSMAS, the configural, metric, and scalar models were supported, indicating that adolescents from different age groups interpret and respond to the BSMAS items in the same way. This supports the validity of comparisons across age groups. Moreover, because previous studies (e.g., Politte‐Corn et al., 2023) have reported age-related differences in social media use patterns, the findings of this study provide evidence that such differences reflect actual psychological variations rather than measurement artifacts.
In testing measurement invariance across gender in the BSMAS, the configural and metric models were supported, but the scalar invariance model was not supported. This indicates that while the modified one-factor structure is consistent across genders and the factor loadings are equivalent, the item intercepts differ by gender. Similar results were reported in the Jordanian version of the BSMAS, which demonstrated partial scalar invariance across gender (Al-Dassean and Murad, 2025). Consequently, it is not statistically appropriate to compare BSMAS scores between male and female adolescents without accounting for gender differences, and gender-specific norms should therefore be considered in clinical and research applications. Moreover, although previous studies (e.g., Aparicio-Martínez et al., 2020) have reported gender-related differences in social media addiction, the findings of this study suggest that such differences may partly reflect measurement artifacts rather than true psychological variations.
Several explanations can be offered for why scalar invariance across gender was not established. First, male and female adolescents may have responded to the items based on different social media use motives. For example, male adolescents may have answered the items with enhancement or pastime motives, whereas female adolescents may have responded with coping or social motives. Second, certain terms in the items (e.g., “personal problems,” “urge”) may have been interpreted differently across genders. Third, the same item may have conveyed different meanings to males and females, such that in some groups it accurately reflected symptoms of social media addiction, while in others it did so less precisely. This explanation provides a basis for why scalar invariance was not supported in the present study. However, due to the limited sample size, partial scalar invariance analysis could not be conducted, and thus these explanations should be regarded as provisional. Future research with larger and more gender-balanced samples will be able to test partial invariance, identify items that function differently by gender, and determine which of these explanations is most accurate.
Although the internal consistency of the BSMAS was generally acceptable, Item 3
(‘You use social media to forget about personal problems’) contributed less to
the overall reliability compared to the other five items. Specifically, when Item
3 was deleted, Cronbach’s
Three explanations can be proposed for the finding that Item 3 of the BSMAS
(“You use social media to forget about personal problems”) showed relatively
lower item–total correlations compared to the other items, and a relatively
higher “
The original one-factor model was not a good fit, but by allowing two items to be correlated, we observed an improvement in model fit. This suggests that, rather than assuming items 1 and 2 are independent, the relationships between these items are important and must be considered in this model. However, because the modified model, based on the modification index, may not be applicable to other samples as is, its fit should be confirmed in future studies using different samples (Kline, 2023).
Based on the modification indices, one correlated error was added to the modified one-factor model. Specifically, the error terms of Item 1 (“You spend a lot of time thinking about social media or planning how to use it”) and Item 2 (“You feel an urge to use social media more and more”) were allowed to covary. The positive covariance can be explained by the fact that both items capture preoccupation with and craving for social media, reflecting overlapping aspects of salience and tolerance.
The results of the correlation analysis between the BSMAS and the scales used to verify convergent validity showed that the BSMAS shared 46.24% of the variance with the SMAPS, which measures constructs like those of the BSMAS, and 12.96% to 36.00% of the variance with eight social media use motives. Among the use motives, coping motives showed a significantly higher correlation with the BSMAS than the other use motives. These findings are consistent with studies examining the relationship between social media use motives and social media addiction (Shin, 2022; Lim, 2023). Therefore, this suggests that when intervening with adolescents who have social media addiction, it is important to focus on their coping motives.
This study has both theoretical and practical implications. First, the modified one-factor model of the BSMAS presented in this study demonstrates that the correlations between the items of the BSMAS should be considered when measuring social media addiction in Korean adolescents using the BSMAS. Second, the finding of only partial measurement invariance between male and female adolescents suggests that this scale may be perceived differently across genders and that the same BSMAS scores may not represent the same levels of social media addiction. Therefore, clinicians and counselors should exercise caution when interpreting gender differences in BSMAS scores. In addition, to increase the clinical utility of the BSMAS, it is necessary to develop interpretive guidelines that include gender-specific norms for Korean adolescents.
This study has several limitations. First, this study employed a convenience
sampling method, making it difficult to consider the data as representative of
the broader population. Thus, future studies should use more systematic sampling
strategies by region, age, and gender to generalize the results. Second, all data
included in this study were obtained using self-report questionnaires. Therefore,
the correlations with the constructs of this study may have been overestimated
due to the similarity in the format of the measurement tools. Therefore, in
future studies, it is necessary to use various modalities to identify the
relationships between variables. Thirdly, we examined the measurement invariance
of the BSMAS across gender and age, but we did not examine the measurement
invariance across time. Previous studies have shown that the BSMAS has
measurement invariance even with a 12-month time difference (Gomez et al., 2024). Therefore, it is necessary to show that the structure of the BSMAS
targeting Korean adolescents has time-invariance. Lastly, according to Chen’s
(2007) guidelines, a minimum of approximately 200 participants per group is
generally recommended for the stable application of conventional cut-off criteria
(
This study provides preliminary evidence that the BSMAS demonstrated acceptable reliability and validity as a tool for measuring social media addiction among Korean adolescents. The scale may be useful for screening and evaluating intervention; however, results should be interpreted with caution, as scalar invariance across gender was not supported and Item 3 showed relatively low performance. Further research with larger, gender-balanced samples and potential revisions to Item 3 is warranted. Despite these limitations, these findings suggest that the BSMAS is a promising tool that can contribute significantly to both research and practice.
The data that support the findings of this study are available from the corresponding author upon reasonable request.
YJL designed the study, collected the data, analyzed the results, and wrote the manuscript. The author read and approved the final version of the manuscript. The author has participated sufficiently in the work and agreed to be accountable for all aspects of the work.
The study was carried out in accordance with the guidelines of the Declaration of Helsinki. This study was approved by the Institutional Review Board of Gachon University (Approval no. 1044396-202503-HR-056-01). Written consent was obtained from all participants prior to data collection.
The author would like to thank Kim S. for help in data collection.
This work was supported by the Gachon University research fund of 2025 (GCU-202504440001).
The author declares no conflict of interest.
References
Publisher’s Note: IMR Press stays neutral with regard to jurisdictional claims in published maps and institutional affiliations.