


 , Aysun Akçam 2, Elçin Babaoğlu 3,*
 , Hatice Karakuş Öztürk 4, Suna Köse 5
1 Psychiatric Nursing Department, Artvin Çoruh University, 08100 Artvin, Turkey
2 Department of Turkish Language Education, Independent Researcher, 40100 Kırşehir, Turkey
3 Psychiatric Nursing Department, Uskudar University Heath Sciences Faculty, 34100 Istanbul, Turkey
4 Department of Sociology, Artvin Çoruh University, 08100 Artvin, Turkey
5 Independent Researcher, 26100 Eskişehir, Turkey
Abstract
Violence against women remains a critical global public health and human rights issue. Although several tools have been developed to assess attitudes toward violence against women, existing scales are often limited in scope, population coverage, or psychometric strength.
This study addresses this gap by developing and validating the Sahara Attitude Scale Towards Violence Against Women for individuals aged 18 and above. The development process of the scale consisted of the following stages: content validity, construct validity, convergent and discriminant validity, reliability studies, validation of the obtained structure, and test-retest reliability. Data were collected through Google Forms from 360 individuals with different sociocultural backgrounds for exploratory factor analysis (EFA) and 336 individuals for confirmatory factor analysis (CFA).
As a result of exploratory and confirmatory factor analyses, a two-factor, 12-item structure was obtained. The scale explains 76.3% of the variance, with Cronbach’s α of 0.94, Gutman’s 0.95, and McDonald’s Omega ω of 0.96. The fit indices for the construct [χ2/df = 2.726, Root Mean Square Error of Approximation (RMSEA) = 0.072, comparative fit indices (CFI) = 0.97, goodness-of-fit index (GFI) = 0.93, adjusted goodness of fit index (AGFI) = 0.90, and normed fit index (NFI) = 0.96] were found to be at an adequate level. The legitimization factor reflects individuals’ tendency to view actions such as violence, harassment, or mistreatment toward women as legitimate, understandable, or justified for various reasons. This factor consists of 1–6 items, explaining 63.2% of the variance, with Cronbach’s α of 0.94, Gutman’s 0.94, and McDonald’s Omega ω of 0.92. The control factor represents a perspective that considers it legitimate to restrict women’s freedom, establish control over them, and constantly monitor their actions. This factor consists of items 7–12 and explains 13.1% of the variance, with Cronbach’s α of 0.92, Gutman’s 0.91, and McDonald’s Omega ω of 0.94.
The Sahara Attitude Scale Towards Violence Against Women is a 5-point Likert scale (0 = Strongly Disagree, 4 = Strongly Agree). There are no reverse-scored items in the scale. The total scale score is obtained by summing the scores of all items, and the raw score ranges from 0 to 48 points. The raw score must be standardized to a range of 0–100 points in accordance with the guidelines. Higher scale scores indicate stronger attitudes supporting violence against women.
Keywords
- attitude
- social psychology
- reliability
- validity
- violence
- women
In recent years, violence has become an increasingly widespread phenomenon on a global scale, as well as in our own country. The most common form of violence is that which is perpetrated against women. Prior to an examination of the notion of gender-based violence against women, it is first necessary to provide a concise discussion of the phenomenon of violence within the concept. The World Health Organization (WHO) defines violence as “any situation in which there is actual or threatened use of physical force or power against oneself, another person, or against the community, that either results in or is likely to result in physical injury, death, psychological harm, or deprivation” (WHO, 1996; Krug et al., 2002). It is evident from the data presented by a plethora of regional and international organisations, chiefly the WHO, that women constitute the most vulnerable demographic with regard to exposure to violence in its myriad forms. The notion of violence against women was initially delineated in 1993 in the United Nations (UN) General Assembly’s “Declaration on the Elimination of Violence Against Women”. According to the aforementioned definition, violence against women is defined as “any act of violence based on gender that results in or is likely to result in physical, sexual, or psychological harm or suffering to women, including threats of such acts, coercion, or arbitrary deprivation of liberty, whether occurring in public or private life” (UN, 1993). In the course of the World Conference on Human Rights in Vienna that same year, the global community formally recognised violence against women as a significant human rights violation on the international stage (Devries et al., 2013). Violence against women, a pervasive human rights violation on a global scale, manifests in various forms, including physical, psychological, economic, and sexual violence. According to WHO, such behaviors include “physical aggression such as slapping, hitting, kicking, and beating” and “sexual aggression such as forced sexual intercourse and other forms of sexual coercion”. However, the WHO definition encompasses a broader spectrum of behaviors, extending beyond physical and sexual violence to encompass intimidation, monitoring of movement, and psychological abuse, including reproductive coercion (WHO, 2021). Other forms of violence against women, such as sexual harassment, non-spousal sexual violence, female genital mutilation, and honor killings, are also becoming increasingly prominent (Corey et al., 2023; Farouki et al., 2022). Flirting violence on university campuses, along with abuse facilitated by technology, has been frequently encountered in recent years in many forms of intimate partner violence, such as non-partner sexual violence and sexual harassment (Sardinha et al., 2022). At the same time, developments in communication technology, such as spyware, location trackers, and devices that can record attacks and upload them to social media, have given rise to new forms of violence against women (Henry and Powell, 2018). According to estimates published by the WHO, approximately 30% of women worldwide have experienced physical and/or sexual violence at some point in their lives (WHO, 2024). This phenomenon has far-reaching consequences, impacting women’s individual, social, and economic participation in societal life. Moreover, it has been associated with significant health implications and even fatalities (García-Moreno et al., 2015; Cepeda et al., 2022).
Violence against women is regarded as one of the most critical social issues, as it constitutes a violation of fundamental rights, both domestically and on a global scale. Violence against women is a multifaceted phenomenon, rooted in historical and societal factors including gender inequality, patriarchal norms, and individual beliefs. Power relations between men and women, shaped by patriarchal structures and societal expectations of traditional gender roles, have contributed to the perpetuation of violence against women.
The Sustainable Development Goal emphasizes the elimination of all forms of violence against women in the public and private sectors by 2030 (WHO, 2024). Analysing the social factors that fuel violence against women and conducting research in this area is of great importance in determining goals and action plans for policymakers and decision-makers in the fight to stop violence against women. In this context, it is observed that numerous national and international studies have been conducted on the issue of violence against women (Yanıkkerem and Esmeray, 2023; Tektaş et al., 2020; Bouhours and Broadhurst, 2015; Castro et al., 2017; Kabasakal and Girli, 2012). Conversely, attitudes towards violence against women are influenced by a multitude of factors embedded within the social structure. In this context, the principal objective of the present study is to ascertain the attitudes of individuals towards violence against women and to evaluate these attitudes in terms of various psychosocial factors. Consequently, it is hypothesised that the development of enhanced measurement tools within the current research paradigm will facilitate expeditious advancements in the study of violence against women. Furthermore, it is anticipated that this study will facilitate the development of appropriate policies and strategies for interventions targeting attitudinal and behavioural change to prevent violence against women.
The objective of this study is to ascertain the attitudes of individuals aged 18 and over towards violence against women and to evaluate these attitudes in terms of various psychosocial factors. The phenomenon of violence against women is multifaceted, with numerous factors contributing to its perpetuation, including but not limited to gender inequality, patriarchal norms, and individual beliefs. Recent international studies highlight the importance of developing culturally adapted measurement tools to assess violent and aggressive behaviors in different societies (Sanjari et al., 2025). A review of the extant literature reveals that there are various measurement tools aimed at measuring attitudes towards violence against women. One such measurement tool is the Attitude Scale Toward Violence, which was developed by Gömbül in 2000 (Gömbül, 2000). The development of this scale was initiated to ascertain the attitudes of health personnel towards violence against women by their spouses within the family. Consequently, its capacity for measurement is constrained to health personnel and is not adequate for general population screening. Another measurement tool related to this topic is the ISKEBE Attitude Scale Toward Violence Against Women, which was developed by Kanbay et al. (2017). This measurement tool is a two-factor, 30-item scale developed for the population aged 18 and over, with an explanatory variance of 47.9%. Despite the scale’s adequate number of items and variability, its comparatively low variability indicates the necessity for a measurement instrument with a reduced number of items and elevated variability for the general population. The objective of this study is to address a significant gap in the existing literature by developing the Sahara Attitude Scale Toward Violence Against Women. The data obtained will be significant in terms of raising social awareness, developing strategies to combat violence, and guiding policymakers.
Since this research aims to develop a measurement tool, it requires the use of analytical techniques and specific methodology. Therefore, the study was designed as a methodological research (DeVellis, 2014).
The development process of the scale was conducted in two phases. The initial phase of the tool development process was conceptualisation, while the subsequent phase involved psychometric evaluation procedures (see Fig. 1).
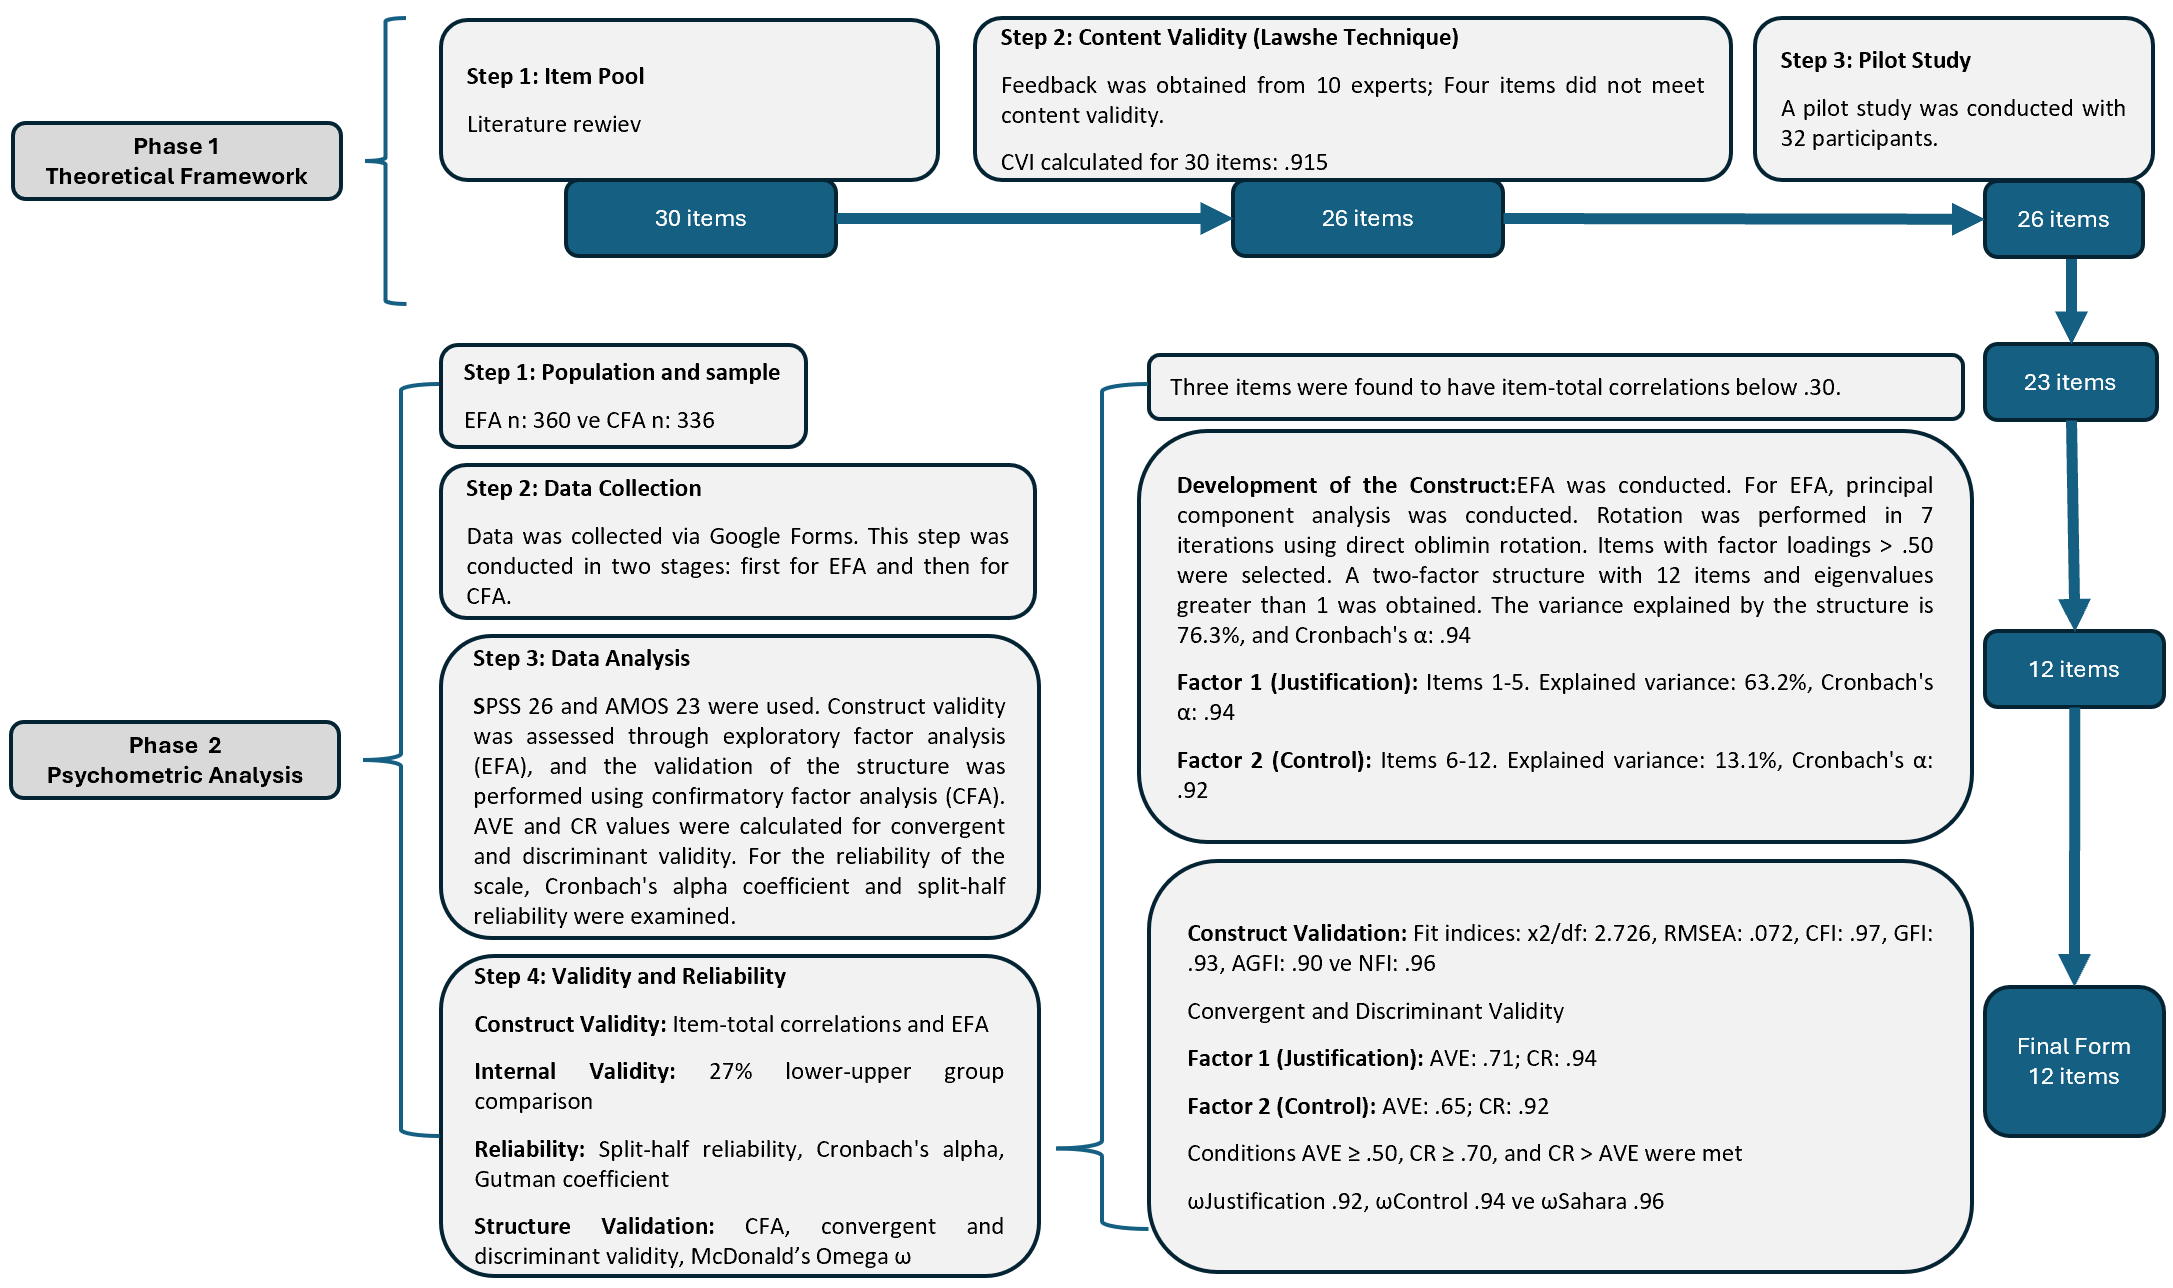 Fig. 1.
Flow diagram of research methodology. CVI, content validity index; AVE, average variance extracted; CR, composite reliability.
In this study, the item pool for the scale developed to measure attitudes toward violence against women among individuals aged 18 and older was created based on literature reviews. National and international studies on violence against women and previously developed measurement tools were reviewed. Individual, cultural, and social factors influencing attitudes toward violence against women were identified in the literature. At the end of this phase, an item pool consisting of 30 statements was created.
For content validity, opinions were obtained from 10 experts in the fields of sociology, psychology, measurement, and evaluation. Content validity was achieved using the Lawshe technique (Lawshe, 1975).
The purpose of the pilot study is to test the suitability of the developed scale for the target population. In this process, a sample representing the target population and showing demographic, social, and economic diversity should be selected (Erkuş, 2007; Trochim and Donnelly, 2006). According to Boateng and colleagues (2018), 30–50 participants are sufficient for a pilot application. Therefore, a pilot application was conducted with a sample of 32 participants. During this process, item clarity, relevance, and comprehensibility were evaluated, and minor wording adjustments were made based on participant feedback to ensure the appropriateness of the scale for the general population.
Since this study is a scale development study, factor analysis techniques must be used. In the study, exploratory factor analysis (EFA) was first performed to reveal the structure, and then confirmatory factor analysis (CFA) was performed to validate the structure that emerged. Therefore, two separate samples with similar characteristics were needed in the study. It is stated that a sample size of at least 300 is appropriate to achieve sufficient sample size in scale development studies (Comrey and Lee, 1992). In this study, 696 individuals (360 for EFA and 336 for CFA) were reached as a result of the data collection phase.
51.4% of the EFA sample were male, 29.4% were married, 73.9% were higher
education students or graduates, 80.3% had a nuclear family, and 61.9% lived in
a city or large city. The mean age of the sample is 28.4
During the data collection process, a link created via Google Forms was shared with participants through online platforms and social media accounts. Participants were selected using a purposive sampling method. This method is considered an effective approach in scale development studies to reach the target population and include individuals with diverse socio-demographic characteristics. Online data collection enabled access to a large participant group in a short period of time and allowed us to exceed the minimum sample size recommended for factor analyses.
The inclusion criteria for participation in the study were as follows:
(1) Being 18 years of age or older,
(2) Having the ability to read and understand Turkish,
(3) Voluntarily agreeing to complete the online form.
Participants who met these criteria were included in the study. The data collection process was carried out in two phases. In the first phase, data were collected from 360 participants for EFA. In the second phase, to confirm the obtained structure, data were collected again from 336 participants with similar socio-demographic characteristics for CFA. Missing data (n = 13) were handled using listwise deletion, resulting in complete data sets for the analyses.
Descriptive statistics and the IBM SPSS Statistics for Windows, Version 26.0
(IBM Corp., Armonk, NY, USA) software package for EFA, and the IBM SPSS Amos,
Version 23.0 (IBM Corp., Armonk, NY, USA) software package for CFA were used in
the data analysis phase. The structure validity was performed using EFA, and the
structure obtained was validated using CFA. Item-total correlations were
examined prior to factor analysis. Average variance extracted (AVE) and composite
reliability (CR) values were calculated for convergent validity and discriminant
validity. Cronbach’s
In order to determine the construct validity of the scale, “principal
components analysis (PCA)” was used for EFA, and the “direct oblimin
technique” was used as the factor rotation technique based on the assumption
that the factors are interrelated. CFA was performed to analyze the fit of the
factor structure of the model obtained from EFA, and the fit indices were
examined. For the fit indices, 0.05
This section presents the validity and reliability findings of the scale, the validation of the obtained structure, and related discussions.
Validity is a concept that expresses the degree to which a measurement tool measures the concept it intends to measure accurately and completely. In this study, the validity of the scale was examined in terms of content validity, construct validity, and internal validity.
For content validity, the content validity ratio (CVR) and content validity index (CVI) were calculated using the Lawshe technique. The Lawshe technique provides a systematic approach for evaluating the content validity of scale items in scale development and validity studies and offers an objective evaluation based on expert opinions (Büyüköztürk, 2010; Lawshe, 1975; Polit and Beck, 2006).
In this study, opinions were obtained from 10 experts for content validity. The
critical value calculated for 10 experts is 0.62. Four items (i8, i28, i29, i30)
in the item pool were excluded from the study because their CVR values were below
the threshold value of 0.62 for 10 experts. The CVR values for the remaining 26
items ranged from 0.80 to 1. The CVI value for the 26 items was calculated as
0.915, and the CVI value was found to be greater than the CVR value (CVI
| No | Nu | N | CVR | Critic value | No | Nu | N | CVR | Critic value |
| i1 | 9 | 10 | 0.80 | 0.62 | i16 | 10 | 10 | 1.00 | 0.62 |
| i2 | 9 | 10 | 0.80 | 0.62 | i17 | 9 | 10 | 0.80 | 0.62 |
| i3 | 10 | 10 | 1.00 | 0.62 | i18 | 10 | 10 | 1.00 | 0.62 |
| i4 | 9 | 10 | 0.80 | 0.62 | i19 | 9 | 10 | 0.80 | 0.62 |
| i5 | 10 | 10 | 1.00 | 0.62 | i20 | 10 | 10 | 1.00 | 0.62 |
| i6 | 10 | 10 | 1.00 | 0.62 | i21 | 9 | 10 | 0.80 | 0.62 |
| i7 | 10 | 10 | 1.00 | 0.62 | i22 | 9 | 10 | 0.80 | 0.62 |
| *i8 | 8 | 10 | 0.60 | 0.62 | i23 | 10 | 10 | 1.00 | 0.62 |
| i9 | 9 | 10 | 0.80 | 0.62 | i24 | 10 | 10 | 1.00 | 0.62 |
| i10 | 10 | 10 | 1.00 | 0.62 | i25 | 10 | 10 | 1.00 | 0.62 |
| i11 | 10 | 10 | 1.00 | 0.62 | i26 | 10 | 10 | 1.00 | 0.62 |
| i12 | 9 | 10 | 0.80 | 0.62 | i27 | 10 | 10 | 1.00 | 0.62 |
| i13 | 10 | 10 | 1.00 | 0.62 | *i28 | 8 | 10 | 0.60 | 0.62 |
| i14 | 9 | 10 | 0.80 | 0.62 | *i29 | 8 | 10 | 0.60 | 0.62 |
| i15 | 9 | 10 | 0.80 | 0.62 | *i30 | 8 | 10 | 0.60 | 0.62 |
| Number of Experts = 10 | |||||||||
| Critic Value = 0.62 | |||||||||
| CVI = 0.915 | |||||||||
*Items that were excluded from the study because they were deemed “Not Appropriate” or “Needs Revision” by experts and therefore did not meet the validity criteria; Nu, Number of experts who deemed the item “Necessary”; N, Number of experts who provided feedback on the item; CVR (Nu-N/2)/(N/2), Validity Rate; CVI, content validity index; CVR, content validity ratio.
Construct validity determines how well a measurement tool measures a theoretical construct (Strauss and Smith, 2009). The construct validity of the scale was tested using EFA.The primary aim of EFA is to determine how many factors the items in the scale can be grouped under (Costello and Osborne, 2005). It is recommended to examine the item-total correlations of the items before EFA. Item-total correlations are a widely accepted method in the literature to increase the validity and reliability of a scale. Item-total correlations should generally be 0.30 or above. This indicates that the item adequately represents the overall structure of the scale (Nunnally and Bernstein, 1994). Low item-total correlations may indicate that the item does not contribute sufficiently to the structure and may reduce the reliability of the scale (DeVellis, 2014). Therefore, if the item-total score correlation coefficient is below 0.30, the item should be considered problematic and either revised or removed from the scale (Çokluk et al., 2018; Şencan, 2005).
When the item-total correlations were examined, three items (i1, i2, i17) were excluded from the study because their item-total correlations were below 0.30. Thus, 23 items remained in the item pool. The item-total correlations of the remaining items ranged from 0.680 to 0.845 (Table 2).
| No | x | sd | ITC | No | x | SD | ITC | ||
| *i1 | 1.52 | 1.48 | 0.970 | 0.209 | i15 | 0.93 | 1.23 | 0.969 | 0.742 |
| *i2 | 0.27 | 0.78 | 0.969 | 0.280 | i16 | 0.53 | 0.93 | 0.968 | 0.845 |
| i3 | 0.34 | 0.83 | 0.969 | 0.725 | *i17 | 1.36 | 1.45 | 0.969 | 0.277 |
| i4 | 0.42 | 0.92 | 0.969 | 0.712 | i18 | 1.24 | 1.38 | 0.969 | 0.744 |
| i5 | 0.44 | 0.91 | 0.968 | 0.753 | i19 | 0.66 | 1.13 | 0.969 | 0.729 |
| i6 | 0.50 | 0.95 | 0.969 | 0.680 | i20 | 0.62 | 1.02 | 0.968 | 0.795 |
| i7 | 0.40 | 0.86 | 0.968 | 0.763 | i21 | 0.56 | 0.96 | 0.968 | 0.759 |
| i9 | 0.58 | 0.99 | 0.968 | 0.817 | i22 | 0.85 | 1.13 | 0.968 | 0.781 |
| i10 | 0.31 | 0.75 | 0.969 | 0.792 | i23 | 0.51 | 0.95 | 0.968 | 0.817 |
| i11 | 0.67 | 1.11 | 0.968 | 0.791 | i24 | 1.02 | 1.27 | 0.968 | 0.748 |
| i12 | 0.46 | 0.93 | 0.969 | 0.736 | i25 | 0.92 | 1.23 | 0.968 | 0.805 |
| i13 | 1.14 | 1.38 | 0.969 | 0.695 | i26 | 0.33 | 0.78 | 0.969 | 0.731 |
| i14 | 0.59 | 1.10 | 0.969 | 0.779 | i27 | 0.93 | 1.25 | 0.968 | 0.782 |
*Items with a total correlation
In order to perform EFA, the suitability of the data metric for factor analysis
must be investigated. For this purpose, the Kaiser-Meyer-Olkin (KMO) value and
Bartlett’s sphericity test must be examined. The KMO test result is expected to
be
Based on the findings, the KMO value was determined as 0.945. Barlett’s
Globality test yielded significant results (
| No | Items | F1 | F2 |
| i3 | If a woman is harassed, she should blame herself. | 0.931 | |
| i5 | A woman’s revealing clothing is a reason for her to be harassed. | 0.923 | |
| i7 | It is normal for a woman who is out late at night to be harassed. | 0.886 | |
| i10 | Unless the violence is severe, it is acceptable to beat a woman. | 0.868 | |
| i6 | It is inevitable that some women will be harassed. | 0.867 | |
| i16 | If a woman is beaten, she is also to blame. | 0.715 | |
| i18 | It is not appropriate for a woman to be out late at night. | 0.892 | |
| i13 | It is not appropriate for women to work in every sector. | 0.873 | |
| i27 | Women having too much freedom can disrupt family order. | 0.849 | |
| i25 | A woman’s actions, where she goes, and what she wears should be monitored. | 0.849 | |
| i24 | A woman’s spending should be kept under control. | 0.843 | |
| i11 | A woman should only be allowed to spend money to the extent that she is permitted. | 0.692 | |
| Explained Variance: | 63.23 | 13.07 | |
| Total Variance | 76.29 | ||
| KMO: 0.945; Bartlett’s Test of Sphericity: 3785.446; df: 66; p | |||
| Method: PCA; Rotation: Direct Oblimin (7 iterations) | |||
F1, justification; F2, control; KMO, Kaiser-Meyer-Olkin.
For EFA, “PCA” was used as the factor rotation technique, and based on the assumption that factors are interrelated, the “direct oblimin technique” was selected from the “oblique” rotation techniques, with 7 iterations performed. Items with factor loadings below 0.50 and cross-loaded on different factors were excluded from the study. The analysis resulted in a two-factor structure with eigenvalues greater than 1 (Table 3). The total variance explained by the scale was calculated as 76.3%.
Factor 1. “Justification” reflects individuals’ tendency to view acts such as violence, harassment, or abuse against women as legitimate, understandable, or justified for various reasons. The statements included in this factor reveal the internalization of gender stereotypes, the perception that women’s behavior is the cause of violence, and the victim is to blame. This attitude is the product of a mindset that explains violence against women not as an individual act, but as a result of women’s so-called “wrong” behavior. Such thoughts can lead to the normalization of violence, impunity for perpetrators, and the silencing of victims. Approaches that define violence as “acceptable if minor” also fall within this scope. This sub-dimension represents the belief patterns that should be the main target of social transformation and awareness-raising efforts. This factor explains 63.2% of the variance.
Factor 2. “Control” reveals individuals’ tendency to control and restrict women’s lives, behavior, clothing, spending, and social roles. It represents a perspective that justifies restricting women’s freedom, establishing dominance over them, and constantly monitoring their movements. This controlling attitude is fueled by the tendency to view women as passive, obedient, and dependent on male approval. Views such as “it is inappropriate for women to go out late at night”, “it is not natural for women to work”, or “women’s spending should be approved by men” are part of this structure. This understanding not only contradicts gender equality but also denies women’s autonomy as individuals and limits their role in society. The variance explained by this factor is 13.1% (Table 3).
The internal validity of the items that make up the scale was tested using a 27% lower-upper group comparison. The 27% method measures the degree to which an item distinguishes between high-scoring and low-scoring participants. Participants are ranked based on their total scale scores, and the top 27% (upper group) are compared with the bottom 27% (lower group).
It was found that there was a statistically significant difference between the
mean scores of the upper group, which had high mean scores in both factors and
the scale total, and the lower group, which had low mean scores (p
| Factor | Group | n | x | SD | t | p |
| F1. Justification | Lower group | 97 | 0 | 0 | –15.501 | |
| Upper group | 1.42 | 0.90 | ||||
| F2. Control | Lower group | 97 | 0 | 0 | –34.849 | |
| Upper group | 2.50 | 0.71 | ||||
| Sahara | Lower group | 97 | 0 | 0 | –24.147 | |
| Upper group | 1.85 | 0.75 |
Sahara, Sahara Attitude Scale Towards Violence Against Women.
Reliability is the degree to which a measurement tool demonstrates consistency and stability. Reliability aims to minimize the margin of error in a measurement tool and ensure that measurements are stable (Crocker and Algina, 2008).
The Cronbach
| Factor | r | Gutman | Cronbach |
| F1. Justification | 0.951 | 0.94 | 0.94 |
| F2. Control | 0.925 | 0.91 | 0.92 |
| Sahara | 0.797 | 0.95 | 0.94 |
r, Spearman-Brown Coefficient.
The structure of the scale was validated using CFA. CFA is used to test the validity of a previously determined factor structure (Kline, 2016). During CFA, fit indices such as Root Mean Square Error of Approximation (RMSEA); comparative fit indices (CFI); goodness-of-fit index (GFI); adjusted goodness of fit index (AGFI); and normed fit index (NFI) were used as the basis for evaluation.
The two-factor structure of the Sahara Attitude Scale Towards Violence Against
Women was tested using first-order multiple factor CFA. When examining the paths
related to the structure of the scale, it was determined that both factors
contributed significantly to the scale (Fig. 2). In addition, the items included
in the factors load significantly on the factor they belong to (p
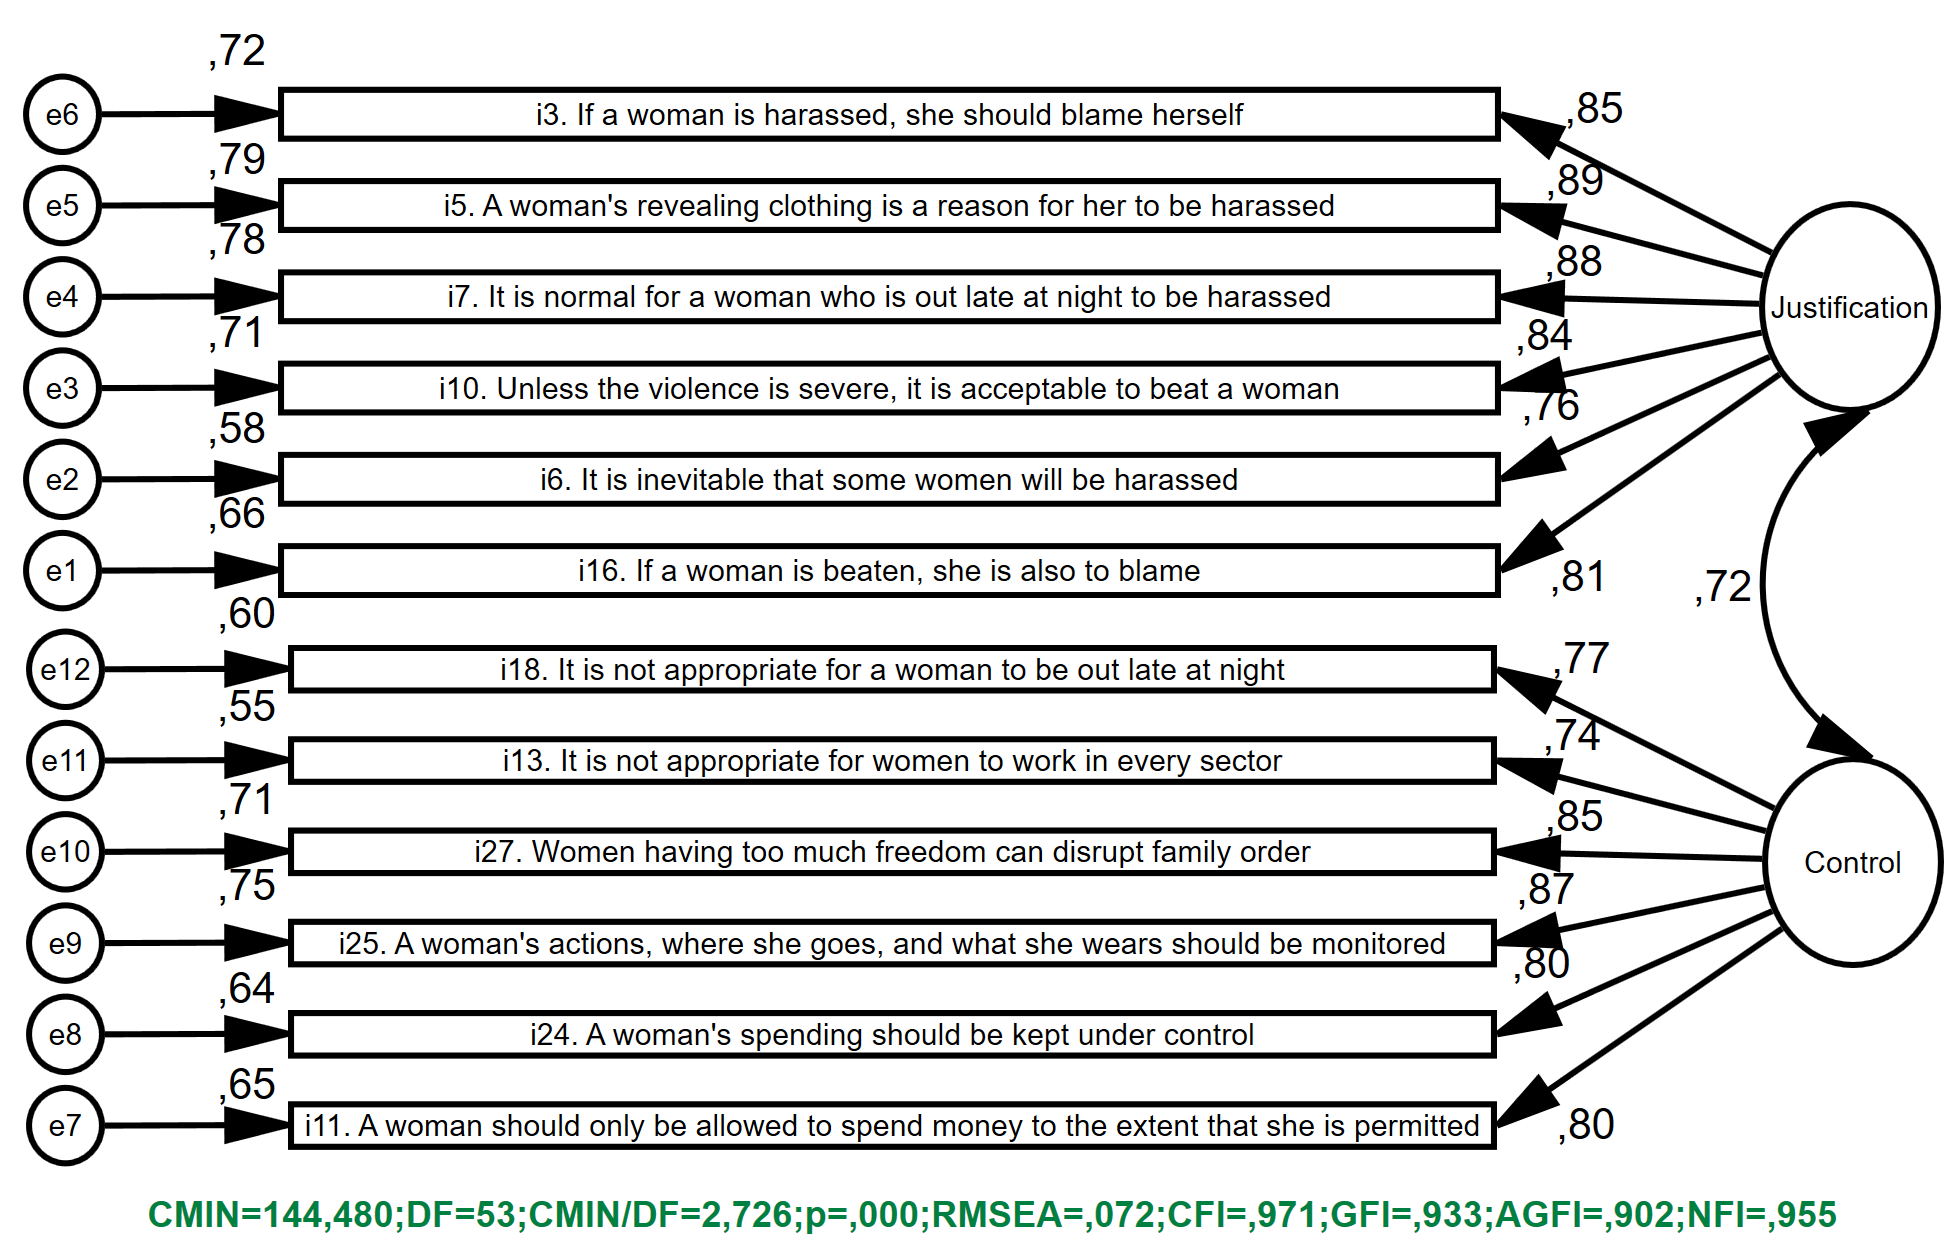 Fig. 2.
CFA findings as to the factor structure of the scale. CFA, confirmatory factor analysis; RMSEA, Root Mean Square Error of Approximation; CFI, comparative fit indices; GFI, goodness-of-fit index; AGFI, adjusted goodness of fit index; NFI, normed fit index; CMIN, chi-square; DF, degrees of freedom.
In addition to the overall fit indices, Table 6 presents the unstandardized
estimates, standard errors, p-values, 95% confidence intervals, and
standardized factor loadings for all items. All factor loadings were
statistically significant (p
| Item | Factor | Unstandardized | SE | p | Standardized | 95% CI | 95% CI |
| Estimate | Loading | Lower | Upper | ||||
| i16 | Justification | 1.000 | - | *** | 0.813 | - | - |
| i6 | Justification | 0.959 | 0.061 | *** | 0.761 | 0.839 | 1.079 |
| i10 | Justification | 0.842 | 0.046 | *** | 0.842 | 0.752 | 0.932 |
| i7 | Justification | 0.998 | 0.051 | *** | 0.885 | 0.898 | 1.098 |
| i5 | Justification | 1.038 | 0.053 | *** | 0.888 | 0.934 | 1.142 |
| i3 | Justification | 0.898 | 0.048 | *** | 0.851 | 0.804 | 0.992 |
| i11 | Control | 1.000 | - | *** | 0.804 | - | - |
| i24 | Control | 1.129 | 0.069 | *** | 0.797 | 0.994 | 1.264 |
| i25 | Control | 1.157 | 0.064 | *** | 0.865 | 1.032 | 1.282 |
| i27 | Control | 1.193 | 0.067 | *** | 0.845 | 1.062 | 1.324 |
| i13 | Control | 1.159 | 0.078 | *** | 0.740 | 1.006 | 1.312 |
| i18 | Control | 1.201 | 0.076 | *** | 0.775 | 1.052 | 1.350 |
*** p
AVE and CR values were examined for the convergent and discriminant validity of the scale. To ensure the convergent validity of the scale, it is expected that the AVE values of the items be 0.50 or above and the CR values be 0.70 or above (Hair et al., 2019; Bagozzi and Yi, 1988).
When examining the convergent validity of the two-factor structure of the scale,
the AVE value for the “Justification” factor was calculated as 0.71 and the CR
value as 0.94, while the AVE value for the “Control” factor was calculated as
0.65 and the CR value as 0.92. Since the AVE values for both factors of the scale
are greater than 0.50, it was concluded that the average explained variance of
the items is significant. The CR coefficients exceeded 0.70, demonstrating
adequate internal consistency of the scale. When the AVE and CR values are
evaluated together, it is concluded that the scale has convergent validity since
the conditions required for convergent validity, AVE
| n | AVE | CR | Omega ( | |
| F1 (Justification) | 6 | 0.71 | 0.94 | 0.92 |
| F2 (Control) | 6 | 0.65 | 0.92 | 0.94 |
| Sahara | 12 | – | – | 0.96 |
| Discriminant Validity | ||||
| F1 | F2 | |||
| F1 (Justification) | (0.843) | |||
| F2 (Control) | 0.661** | (0.806) | ||
** p
The test-retest method was used to evaluate the consistency of the scale over
time. Test-retest reliability is a technique used to determine whether a
measurement tool demonstrates consistency over time. For measurements of
medium-term psychological characteristics such as motivation and attitude, a time
interval of 2 to 4 weeks is recommended between measurements (Hinkin, 1998).
In line with this, the scale was reapplied to a group of 72 participants at
two-week intervals within the scope of the study. Test-retest reliability was
first examined using Pearson correlation, which yielded a coefficient of r = 0.88
(p
In this study, factor analysis techniques were used to reveal the structure of the “Sahara Attitude Scale Towards Violence Against Women”. Before factor analysis, it is necessary to examine whether the items contribute sufficiently to the scale. For this aim, the item-total correlations of the items in the pilot form were examined. Item-total correlations are a widely accepted method in the literature to enhance the validity and reliability of a scale. Item-total correlations should generally be 0.30 or above. This demonstrates that the item adequately represents the overall structure of the scale (Nunnally and Bernstein, 1994). Low item-total correlations may indicate that the item does not contribute sufficiently to the construct being measured and may reduce the reliability of the scale (DeVellis, 2014). Therefore, if the item-total score correlation coefficient is below 0.30, the item should be considered problematic and either revised or removed from the scale (Çokluk et al., 2018; Şencan, 2005). In this study, three items had item-total correlations below 0.30 and were excluded from the study. The remaining items had item-total correlations above 0.30, indicating that they contributed sufficiently to the scale, and it was decided to include them in the factor analysis (Table 2).
According to the literature, for factor analysis to be performed appropriately,
the KMO test result must be
The construct validity of the scale was determined using EFA. For EFA, “PCA” was used, and based on the assumption that factors are interrelated, the “direct oblimin technique” was used as the factor rotation technique. To determine factorization in the scale, factors with eigenvalues greater than 1 were considered, and a line graph was examined. It was preferred that each factor explain at least 5% of the variance, and that the total variance explained by the scale be at least 50%. For item elimination from the factors, item factor loadings were at least 0.50 (Finch et al., 2016). Items with cross-loadings of less than 0.10 in different factors were considered as redundant items and excluded from the study (Büyüköztürk, 2010). As a result of the analyses, a two-factor structure with eigenvalues greater than 1 was obtained, and seven iterations were performed. After removing items with factor loadings below 0.50 and cross-loadings on different factors, a two-factor structure with 76.3% of the variance explained was obtained. Considering that at least 40% of the total variance should be explained by factors in multi-factor measurement tools and at least 30% in single-factor measurement tools (Field, 2018), the explained variance of the scale is sufficient for a three-factor scale (Table 3).
To analyze the internal validity of the scale, a 27% lower-upper group
comparison was conducted. The discriminative power of the items was evaluated
based on the significant difference (p
In this study, Cronbach
The literature indicates that the structure determined by EFA must be validated
by CFA. To determine whether a model has been validated or not, certain model fit
index values are examined. However, the fit indices in the literature are
diverse, and it is challenging to determine which fit index should be considered
standard (Orcan, 2018; Çokluk et al., 2018; Koyuncu and Kılıç, 2019). In this study, fit indices such as
The correlation analysis between the two latent dimensions revealed a moderate
positive relationship (r = 0.72, 95% CI [0.60–0.84], p
AVE and CR are two important indicators used in structural equation modeling and
scale development studies to assess the validity and reliability of a scale. AVE
represents the ratio of the total variance that can be explained by the items
representing a structure. In other words, AVE shows the extent to which the items
of a scale represent the entire scale. The AVE value should be 0.50 or higher.
This value indicates that the items of the structure explain at least 50% of the
total variance. An AVE value below 0.50 indicates that the structure has low
explanatory power and that the items should be reviewed (Fornell and Larcker, 1981). CR is a reliability coefficient that evaluates the internal consistency
of a structure. It is accepted as an alternative measure to Cronbach’s
This study has several limitations. First, the data were collected through online surveys using purposive sampling, which may limit the generalizability of the findings to the broader population. Second, the sample was restricted to adults aged 18 and above from a single cultural context, and thus the psychometric properties of the Sahara scale should be further examined in larger and more diverse populations. Third, all data were based on self-report, which may be subject to response and social desirability bias. Future studies are recommended to validate the scale in different cultural settings, with more representative sampling methods, and by incorporating multiple sources of information.
This study aimed to determine attitudes toward violence against women among individuals aged 18 and older by assessing the validity and reliability of the “Sahara Attitude Scale Toward Violence Against Women” in Turkish culture. The results of content validity, construct validity, convergent and discriminant validity, reliability analyses, and model confirmation indicated that the scale has adequate validity and reliability and can provide consistent measurements in Turkish culture.
“Sahara Attitudes Scale Toward Violence Against Women” was developed to
determine the level of attitudes toward violence against women in the population
aged 18 and older (Appendix Table 8). As a result of exploratory and confirmatory
factor analyses, a two-factor, 12-item structure was obtained. The scale explains
76.3% of the variance, with Cronbach’s
The factor “Justification” reveals individuals’ tendency to view acts such as
violence, harassment, or mistreatment against women as legitimate,
understandable, or justified for various reasons. The statements included in this
factor reveal the internalization of gender stereotypes, the perception that
women’s behavior is the cause of violence, and that the victim is to blame. This
attitude is the product of a mindset that explains violence against women not as
an individual act but as a result of women’s so-called “wrong” behavior. Such
beliefs can lead to the normalization of violence, impunity for perpetrators, and
the silencing of victims. Approaches that define violence as “acceptable if
minor” also fall within this scope. This sub-dimension represents the belief
patterns that should be the main target of social transformation and awareness
efforts. This factor consists of items 1–6 and explains 63.2% of the variance,
with a Cronbach
The factor “Control” reveals individuals’ tendency to control and restrict
women’s lives, behavior, clothing, spending, and social roles. It represents a
perspective that justifies restricting women’s freedom, establishing dominance
over them, and constantly monitoring their movements. This controlling attitude
feeds on the tendency to view women as passive, obedient, and dependent on male
approval. Views such as that it is “inappropriate” for women to go out late at
night, that their work is “not naturally accepted”, or that their spending must
be “approved by men” are part of this structure. This understanding is contrary
to gender equality and denies women’s autonomy as individuals, limiting their
role in society. This factor consists of 7–12 items and explains 13.1% of the
variance, with a Cronbach’s
The Sahara Attitude Scale Toward Violence Against Women is a 5-point Likert-type scale (0 = Strongly Disagree, 4 = Strongly Agree). There are no reverse-scored items in the scale. The total scale score is obtained by summing the scores of all items, and the raw score ranges from 0 to 48 points. The raw score must be standardized to a range of 0 to 100 points according to the guidelines. An increase in the score indicates an increase in favorable attitudes toward violence against women.
Standardization has been applied to the scoring of this scale to enable easy and consistent comparisons between samples in studies using the scale and in future adaptation studies.
The following formula should be used to standardize the scores obtained from the scale to 100.
For example, if a person scored 24 points on the scale, their standardized score can be calculated as follows:
In this case, the standardized score of a person who scored 24 points on the scale is 50 points. It is mandatory to use the standardized form of the scores obtained from the scale in the studies to be conducted.
The data that support the findings of this study are available from the corresponding author upon reasonable request.
YK: data curation, validation, conceptualization, formal analysis, supervision, writing–original draft. AA: conception and design, acquisition of data, interpretation of data. EB: conception and design, acquisition of data, analysis and interpretation of data. HKÖ: data curation, writing–review & editing. SK: data curation, writing–review & editing. All authors contributed to critical revision of the manuscript for important intellectual content. All authors read and approved the final manuscript. All authors have participated sufficiently in the work and agreed to be accountable for all aspects of the work.
The study was carried out in accordance with the guidelines of the Declaration of Helsinki. The studies involving humans were approved by Artvin Çoruh University Scientific Research and Publication Ethics Committee (Approval Date and Number: 13.02.2025-168412). The studies were conducted in accordance with the local legislation and institutional requirements. The participants provided their written informed consent to participate in this study.
Not applicable.
This research received no external funding.
The authors declare no conflict of interest.
See Table 8.
| Please rate your level of agreement with the following statements. | Rating (0–4) | |
| 1 | If a woman is harassed, she should blame herself. | |
| 2 | A woman’s revealing clothing is a reason for her to be harassed. | |
| 3 | It is normal for a woman who is out late at night to be harassed. | |
| 4 | Unless the violence is severe, it is acceptable to beat a woman. | |
| 5 | It is inevitable that some women will be harassed. | |
| 6 | If a woman is beaten, she is also to blame. | |
| 7 | It is not appropriate for a woman to be out late at night. | |
| 8 | It is not appropriate for women to work in every sector. | |
| 9 | Women having too much freedom can disrupt family order. | |
| 10 | A woman’s actions, where she goes, and what she wears should be monitored. | |
| 11 | A woman’s spending should be kept under control. | |
| 12 | A woman should only be allowed to spend money to the extent that she is permitted. |
Rating scale: (0) I don’t agree at all; (1) I disagree; (2) I partially agree; (3) I agree; (4) I completely agree.
References
Publisher’s Note: IMR Press stays neutral with regard to jurisdictional claims in published maps and institutional affiliations.