

 , Tomas Lazdauskas 2,*
1 Behavioral–Developmental Initiatives, Scottsdale, AZ 85254, USA
2 Institute of Psychology, Faculty of Philosophy, Vilnius University, LT 01513 Vilnius, Lithuania
Abstract
The New York Longitudinal Study (NYLS) identified three core temperament types—Easy, Difficult, and Slow-to-warm-up—based on early qualitative analyses of childhood behavior and constrained by the analytic tools available at the time. However, more than one-third of participants could not be classified within this framework, and the typology has never been formally revised using contemporary statistical approaches, which limits the model’s generalizability. Despite these methodological constraints, the nine NYLS temperament dimensions and their associated typology have remained influential in both research and applied contexts.
This study revisited the NYLS framework using latent profile analysis (LPA), a probabilistic person-centered method that identifies latent subgroups based on multivariate response patterns. Data were drawn from a large adult sample assessed with the standardized Chess–Thomas Adult Temperament Questionnaire, second edition (ATQ2), as well as its newly validated Lithuanian version. The sample comprised 1260 adults aged 18–80 years (M = 32.2) from the USA (n = 554) and Lithuania (n = 706). To enhance robustness and cross-group comparability, measurement invariance (MI) was tested across country, gender, and age groups.
A five-profile solution emerged as optimal. Three profiles resembled the classic NYLS types—Easy (13.1%), Difficult (11.1%), and Slow-to-warm-up (13.5%)—and two additional profiles were identified: Curious (33.3%) and Shy (29.0%). The new profiles reflected coherent behavioral patterns centered on approach-withdrawal tendencies and activity level, demonstrated conceptual convergence with other temperament and personality typologies, and remained consistent across demographic groups.
These findings refine and expand the original NYLS typology with greater methodological rigor, providing a statistically validated framework for understanding adult temperament that can inform future developmental research, psychological assessment, and clinical practice.
Keywords
- adult temperament types
- latent profile analysis
- New York Longitudinal Study
- NYLS
- person-centered approach
For decades, research in personality has predominantly followed a variable-centered approach. This methodology has substantially advanced the understanding of the structural organization of constructs and the relationships among variables, operating under the assumption that these associations apply uniformly across individuals (Howard and Hoffman, 2018). However, this assumption has increasingly been questioned, with some scholars arguing that variable-centered models may obscure critical insights into how personality characteristics are configured and interact within individuals (Asendorpf, 2002; Herzberg and Roth, 2006). In contrast, a person-centered approach enables researchers to identify subpopulations based on shared patterns of variable expression (Howard and Hoffman, 2018), offering a more nuanced perspective on individual personality functioning. Among person-centered approaches, latent profile analysis (LPA) has emerged as a particularly powerful method, as it probabilistically identifies subgroups based on multivariate response patterns and offers a flexible framework for evaluating their distinctiveness. While both approaches are valuable and complementary (Mervielde and Asendorpf, 2000; Roth and Herzberg, 2017), the person-centered framework, and LPA in particular, provides a robust basis for typological research aimed at capturing coherent constellations of enduring characteristics rather than isolated dimensions (Williams and Kibowski, 2016).
Within this broader methodological context, temperament research has followed a similar trajectory. Although temperament is conceptually distinct from personality traits, typically referring to biologically rooted dispositions evident early in life (Teglasi et al., 2023), many temperament models have been developed using variable-centered, factor-analytic techniques. These include foundational frameworks developed by Rothbart and colleagues (Rothbart et al., 2000), see also Evans and Rothbart (Evans and Rothbart, 2007; Evans and Rothbart, 2009), Buss and Plomin (1975; 1984), Bates and associates (Bates et al., 1979), and Strelau (1996), all of which have been influential in structuring the understanding of temperament across the lifespan. However, longitudinal studies indicate that developmental continuity in temperament is rarely attributable to isolated traits; instead, it reflects stable configurations of interrelated characteristics (Caspi and Silva, 1995; Korn, 1984; Pesonen et al., 2003; Thomas and Chess, 1986). These findings underscore the value of person-centered methodologies for capturing the complexity and stability of temperament over time.
Among temperament models, the New York Longitudinal Study (NYLS) stands out as a landmark investigation that integrated both variable- and person-centered perspectives. Conducted by Thomas, Chess, and colleagues (Chess and Thomas, 1999; Thomas et al., 1963; Thomas et al., 1968), the NYLS followed a cohort from infancy into adulthood to examine the hypothesis that individual behavioral styles emerge early in life, remain relatively stable, and shape responses to environmental contexts. The NYLS was particularly focused in identifying patterns of temperament that either predisposed individuals to, or protected them from, behavioral disorders (Thomas et al., 1968). Through systematic observations and caregiver interviews, nine core temperament dimensions were identified: activity level (the proportion of active versus inactive periods), regularity/rhythmicity (predictability in timing of functions), adaptability (responses to new or altered situations), approach or withdrawal (initial reactions to novel stimuli), intensity of reaction (energy level of responses), quality of mood (emotional tone, either positive or negative), persistence (continuation of activities despite obstacles), distractibility (susceptibility to disruption by unrelated stimuli), and threshold of responsiveness (sensitivity to stimuli and intensity needed to elicit a response). These dimensions became the foundation for understanding individual differences in temperament across development.
Through a combination of clinical judgment and early statistical methods, the NYLS identified three temperament types: Easy, Difficult, and Slow-to-warm-up (Thomas et al., 1963; Thomas and Chess, 1977). The Easy type was characterized by regularity, positive responses to novelty, quick adaptation to change, mild emotional reactivity, and an overall positive mood. In contrast, the Difficult type was characterized by irregularity, negative reactions to novelty, low adaptability, intense emotional responses, and a predominantly negative mood. The Slow-to-warm-up type exhibited initial withdrawal, gradual adaptation, and milder expressions of intensity and regularity compared to the Difficult type. Prevalence estimates from the NYLS assigned 40% of participants to the Easy group, 10% to the Difficult group, and 15% to the Slow-to-warm-up group. However, 35% of participants did not fit these categories, suggesting the presence of additional or intermediate profiles and highlighting the need for a more differentiated typology (Carey, 1970; Chess and Thomas, 1986).
Despite its age, the NYLS typology remains highly influential in both research and practice. It continues to inform theoretical models (Caspi, 2000; Maine et al., 2025), cross-cultural studies (Super et al., 2008; Super et al., 2020), and research on specialized populations (Cassiano et al., 2020). It has also demonstrated predictive validity for adult mental health outcomes (Wu et al., 2022). Beyond research, the NYLS model underpins clinical guidelines (Carey and McDevitt, 2016; Delgado et al., 2022) and is widely cited in parenting literature (Kurcinka, 2020; Turecki and Tonner, 2000), further affirming its practical relevance.
Although temperament is generally considered relatively stable across the lifespan, the application of person-centered methods to adult temperament has been limited. Nevertheless, existing studies based on frameworks such as Cloninger’s psychobiological model (Cloninger et al., 1993; Strelau, 1996) and Strelau’s regulative theory of temperament (Strelau, 1996) have demonstrated the utility of person-centered analyses in adult populations. For example, adult temperament profiles have been associated with diverse outcomes, including health status (Keltikangas-Järvinen et al., 1999; Wessman et al., 2012), clinical symptoms (Müller et al., 2014; Rzeszutek and Oniszczenko, 2022), physical activity (Karppanen et al., 2023), criminal behavior (Moreira et al., 2022b), humor potential (Moreira et al., 2022a), and cognitive-emotional regulation (Wytykowska et al., 2022). These findings underscore the potential value of identifying temperament profiles, defined as biologically based configurations of behavioral tendencies, using person-centered methods in adult populations.
While the NYLS provided foundational insights, its typology was limited by a small sample size (N = 133), the analytic tools available at the time, and its exclusive focus on childhood data. Notably, over one-third of participants could not be categorized into any of the three original types, and the model was never formally updated. This substantial proportion of unclassifiable cases raised questions about the comprehensiveness of the three-type system, limited its capacity to capture the full range of individual differences, and reduced its practical utility. In applied and clinical settings, the absence of a comprehensive classification complicates the tailoring of interventions to individual needs. These limitations highlight the need for a more differentiated typology and point to the value of modern person-centered methods, such as LPA, which can identify additional subgroups based on multivariate response patterns and provide a more systematic framework for classification. Furthermore, it remains unclear whether comparable temperament profiles emerge in adulthood, given developmental shifts in temperament expression. To address these gaps, the present study revisits and extends the NYLS typology using LPA applied to a large, cross-national adult sample from the USA and Lithuania. Including participants from both countries allowed for analysis of the pooled sample while preserving statistical power and treating country as a distinct demographic variable.
The current study had two primary objectives. First, we aimed to reassess the viability of the NYLS typology by identifying adult temperament profiles using LPA, based on data from a standardized instrument derived from the original NYLS framework. This instrument assesses biologically based characteristics while clearly distinguishing temperament from broader trait- or state-like personality constructs. LPA, a probabilistic, person-centered method, provides greater nuance and flexibility than traditional clustering techniques (Spurk et al., 2020; Weller et al., 2020). It is particularly well-suited to typological research and aligns with professional practice, where categorical classifications are often more informative than dimensional scores (Mervielde and Asendorpf, 2000; Williams and Kibowski, 2016). Although LPA has been widely applied in temperament research with infants and toddlers (Augustine et al., 2022; Gartstein et al., 2017), as well as with children and adolescents (Dalimonte‐Merckling and Brophy‐Herb, 2019; Guerin et al., 2023; Hawes et al., 2022; Martin and Lease, 2022; Moran et al., 2017), its application to adult samples remains limited.
Second, we examined whether the resulting profiles varied by age, gender, or country of residence. Prior studies have reported gender-based differences in temperament patterns (Korn, 1984; Wessman et al., 2012; Wytykowska et al., 2022), although findings at the profile level remain mixed or ambiguous. While cultural influences on temperament are well documented in children (DeVries, 1984; Putnam et al., 2024; Super et al., 2020), few cross-national studies have investigated adult populations. Although both the USA and Lithuania are considered Western societies, they represent distinct cultural contexts that may shape behavioral tendencies in different directions (Allik et al., 2017; Schmitt et al., 2007). Age is also a relevant factor, as the expression of specific temperament characteristics may shift across the lifespan; for example, behaviors associated with difficult temperament in childhood may become more adaptive in later life (Carey and McDevitt, 1995). Exploring how temperament profiles relate to demographic variables is essential for both theoretical understanding and applied interpretation.
In summary, this study addressed two key objectives: (1) to revisit and refine the NYLS temperament typology using modern person-centered methodology in an adult sample, and (2) to examine how sociodemographic factors may influence or interact with temperament profiles. The findings aim to contribute to both theoretical advancement and practical application, helping to bridge the gap between research and real-world practice.
The initial sample for this online study consisted of 1374 adults from the USA (n = 602) and Lithuania (n = 772). To reduce potential response bias inherent in online surveys, a screening procedure was implemented to identify and exclude potentially careless responses. Following established guidelines (Curran, 2016; Meade and Craig, 2012; Ward and Meade, 2023), post-hoc techniques, such as the LongString index, intra-individual response analysis, and multivariate outlier detection using Mahalanobis D statistics, were applied. As a result, 8.3% of participants were identified as providing invalid responses and subsequently excluded from further analysis. The final sample comprised 1260 individuals from the USA (n = 554) and Lithuania (n = 706). Of these, 77.0% identified as female, 22.7% as male, and 0.3% as nonbinary. The sample was therefore predominantly female, which should be considered when interpreting the generalizability of the findings. Participants’ ages ranged from 18 to 80 years (M = 32.2, SD = 12.9), with the majority (74.9%) between the ages of 18 and 39.
The survey was administered online and made available to the general public to maximize accessibility and reach. Recruitment employed multiple dissemination channels, including university mailing lists, psychology and survey interest forums, and general-interest social media platforms (e.g., Facebook, Instagram). A primary emphasis was placed on social media advertisements to attract a broad participant base. Participants accessed the survey remotely via Google Forms and Microsoft Forms between 2021 and 2023 and were informed that completion would take approximately 10–15 minutes. No specific technical requirements were needed beyond basic internet access. Participation was entirely voluntary, and all participants provided written informed consent. No monetary or material compensation was offered.
Temperament characteristics were assessed using the updated Adult Temperament Questionnaire, second edition (ATQ2; Behavioral–Developmental Initiatives (B–DI), 2018), along with its Lithuanian adaptation (Lazdauskas and McDevitt, 2023). This self-report instrument is grounded in the NYLS framework and was originally developed for use with individuals in their early twenties (Thomas et al., 1982). A shortened version of the questionnaire was introduced a decade later, and subsequent revisions have increased the number and age groups of the normative sample (Behavioral–Developmental Initiatives (B–DI), 2018).
The ATQ2 comprised 54 items rated on a seven-point scale (1 = hardly ever to 7 =
almost always). Based on the Chess and Thomas longitudinal study, it assesses
nine key temperament characteristics: activity level (low vs high), rhythmicity
or regularity (high vs. low), adaptability (gradual vs. high), initial response
(withdrawal vs. approach), intensity (high vs. low), mood (negative vs.
positive), persistence (low vs. high), distractibility (high vs. low), and
sensory threshold (sensitive vs. nonreactive). Scale reliabilities range from
sufficient (
Participants reported their age, self-identified gender, and country of residence.
LPA was conducted using the tidyLPA package (https://data-edu.github.io/tidyLPA/), version 1.1.0 (Rosenberg et al., 2018). Screening for careless responding, as previously described, employed version 1.2.2 of the careless package (https://github.com/ryentes/careless/) (Yentes and Wilhelm, 2023). Measurement invariance (MI) testing was performed using the lavaan package (https://lavaan.ugent.be), version 0.6-16 (Rosseel, 2012). All analyses were conducted in R, version 4.3.1 (R Core Team, 2023; R Foundation for Statistical Computing, Vienna, Austria). The R packages used are available via the Comprehensive R Archive Network (CRAN; Vienna, Austria). Descriptive statistics, one-way analyses of variance (ANOVA), and cross-tabulations were generated using the R-based software JASP, version 0.18.1 (JASP Team, 2024; JASP, Amsterdam, The Netherlands), to streamline the analytic workflow.
LPA was applied to the full sample, as only minor differences in temperament
scores were observed between the USA and Lithuanian subsamples, and between
female and male participants. Additionally, correlations between temperament
scores and age were weak or negligible (Supplementary Table 1). These findings
were supported by MI analysis of the nine-factor model, which indicated
sufficient comparability across groups and therefore justified estimating latent
profiles in the pooled sample rather than conducting separate subgroup analyses
(Supplementary Table 2). Goodness-of-fit indices—comparative fit index (CFI) and
root mean square error of approximation (RMSEA)—remained within acceptable
thresholds across all three MI levels, with CFI
The sample size was adequate for conducting LPA (Nylund et al., 2007; Tein et al., 2013). The analysis followed a three-step approach: (1) model
specification, (2) determination of the optimal number of latent classes, and (3)
interpretation of the selected solution (Bauer, 2022). Model specification
relied on a default class-invariant parametrization. To determine the optimal
number of profiles, three classes of criteria were applied: (a)
information-theoretic methods, (b) likelihood ratio tests, and (c) entropy-based
measures (Tein et al., 2013). Information criteria included the Akaike
Information Criterion (AIC), Bayesian Information Criterion (BIC), and
sample-size adjusted BIC (SABIC), with lower values indicating better model fit.
Model comparisons were supported by the bootstrap likelihood ratio test (BLRT).
Classification quality was evaluated using entropy and average posterior
probabilities, applying conventional thresholds: entropy = 0.60–0.80, and
posterior probabilities = 0.70–0.80. Minimum class size thresholds (1–5% of
total sample) were also considered (Bauer, 2022; Nylund et al., 2007; Spurk et al., 2020). Profile interpretation involved detailed within- and between-class
analyses of trait scores. Profile characteristics were identified based on the
ATQ2 Test Manual (Behavioral–Developmental Initiatives (B–DI), 2018) and
guidelines from prior typological research (Martin and Lease, 2022). Traits
were considered salient if their scores exceeded
Descriptive characteristics of the sample, including correlations among
temperament dimensions, as well as the M and SDs for each variable, are presented
in Table 1. The analysis revealed that most temperament dimensions were weakly
interrelated, with approximately 75% of correlations falling below the moderate
threshold (r
| 1. | 2. | 3. | 4. | 5. | 6. | 7. | 8. | 9. | |
| 1. Activity | — | ||||||||
| 2. Rhythmicity | −0.03 | — | |||||||
| 3. Adaptability | 0.20*** | 0.01 | — | ||||||
| 4. Approach | 0.38*** | −0.01 | 0.38*** | — | |||||
| 5. Intensity | 0.04 | 0.01 | 0.43*** | 0.20*** | — | ||||
| 6. Mood | 0.10*** | −0.02 | 0.40*** | 0.30*** | 0.53*** | — | |||
| 7. Persistence | 0.18*** | −0.10*** | 0.26*** | 0.14*** | 0.20*** | 0.16*** | — | ||
| 8. Distractibility | 0.12*** | −0.02 | 0.41*** | 0.28*** | 0.32*** | 0.30*** | 0.26*** | — | |
| 9. Threshold | 0.07* | 0.05 | 0.24*** | 0.13*** | 0.20*** | 0.21*** | 0.07* | 0.21*** | — |
| M | 4.04 | 3.90 | 3.21 | 4.52 | 3.78 | 3.59 | 3.41 | 4.31 | 4.42 |
| SD | 1.21 | 1.40 | 1.09 | 1.25 | 1.03 | 0.93 | 0.97 | 1.03 | 1.12 |
Note: Higher scores on the ATQ2 scale represent: (1) low level of activity, (2)
high rhythmicity (or regularity), (3) gradual adaptability, (4) low approach (or
initial withdrawal), (5) high intensity, (6) negative mood, (7) low persistence,
(8) high distractibility, and (9) low threshold (or sensitivity). * p
LPA was used to classify the sample into subgroups based on the nine assessed temperament dimensions. Models with up to nine profiles were estimated, and fit indices are summarized in Table 2. Model selection criteria provided mixed guidance regarding the optimal number of profiles, with some indices offering limited informativeness in this context.
| Clusters | AIC | BIC | SABIC | Entropy | PP | N | BLRT |
| L–H | min/max | p-value | |||||
| 1 | 32,209.12 | 32,301.62 | 32,244.44 | 1.00 | 1.00 | 1.00 | — |
| 2 | 31,108.49 | 31,252.38 | 31,163.44 | 0.68 | 0.89–0.91 | 0.49/0.51 | 0.01 |
| 3 | 30,850.62 | 31,045.90 | 30,925.19 | 0.69 | 0.84–0.86 | 0.18/0.55 | 0.01 |
| 4 | 30,737.30 | 30,983.96 | 30,831.49 | 0.63 | 0.75–0.84 | 0.15/0.31 | 0.01 |
| 5 | 30,694.28 | 30,992.33 | 30,808.10 | 0.64 | 0.72–0.85 | 0.11/0.33 | 0.01 |
| 6 | 30,651.25 | 31,000.69 | 30,784.69 | 0.64 | 0.71–0.85 | 0.07/0.28 | 0.01 |
| 7 | 30,619.34 | 31,020.17 | 30,772.41 | 0.65 | 0.67–0.85 | 0.02/0.25 | 0.01 |
| 8 | 30,623.63 | 31,075.85 | 30,796.32 | 0.64 | 0.61–0.86 | 0.05/0.20 | 0.07 |
| 9 | 30,586.63 | 31,090.24 | 30,778.95 | 0.65 | 0.58–0.85 | 0.02/0.22 | 0.01 |
Note: AIC, Akaike information criterion; BIC, Bayesian information criterion; SABIC, sample-size adjusted Bayesian information criterion; BLRT, bootstrap likelihood ratio test; LPA, latent profile analysis; PP, interval between the profiles with the lowest (L) and highest (H) posterior probabilities; N min/max, minimum and maximum class sizes (proportions). Exact class proportions (percentages) for each solution were as follows: 2-cluster model: 48.9, 51.1; 3-cluster model: 55.1, 17.7, 27.2; 4-cluster model: 27.1, 15.4, 30.9, 26.7; 5-cluster model: 33.3, 11.1, 29.0, 13.5, 13.1; 6-cluster model: 24.1, 6.7, 27.6, 18.6, 11.0, 12.1; 7-cluster model: 25.3, 6.2, 22.1, 18.4, 2.5, 11.3, 14.1; 8-cluster model: 5.7, 5.3, 19.9, 6.9, 15.5, 14.0, 20.1, 12.5; 9-cluster model: 17.3, 6.1, 17.1, 2.7, 16.7, 10.2, 21.6, 1.9, 6.4.
AIC values decreased consistently with the addition of more profiles, indicating improved fit but limiting its utility for model selection. BIC reached its minimum with the four-profile model, whereas SABIC favored a seven-profile solution. Although the elbow plot did not clarify the model prevalence for AIC and SABIC, it showed a clear flattening of the BIC curve beginning with the four-profile solution. In contrast, entropy reached its lowest value in the four-profile model, suggesting reduced classification accuracy at that level. For models with seven or more profiles, at least one subgroup fell below acceptable thresholds for posterior probability and class size, raising concerns about stability and interpretability. The BLRT indicated significant improvements in fit for most adjacent model comparisons, except between the seven- and eight-profile solutions.
Taken together, these considerations identified the five-profile model as the most statistically viable: it yielded the second-lowest BIC, showed improved entropy relative to the four-profile solution, and maintained subgroup sizes above the recommended minimum thresholds.
Beyond statistical indices, the five-profile model was also preferred based on its interpretability and theoretical coherence (Fig. 1). Each profile’s distinctive characteristics were interpreted relative to sample M, providing a nuanced understanding of temperament expression both within and across profiles (Table 3).
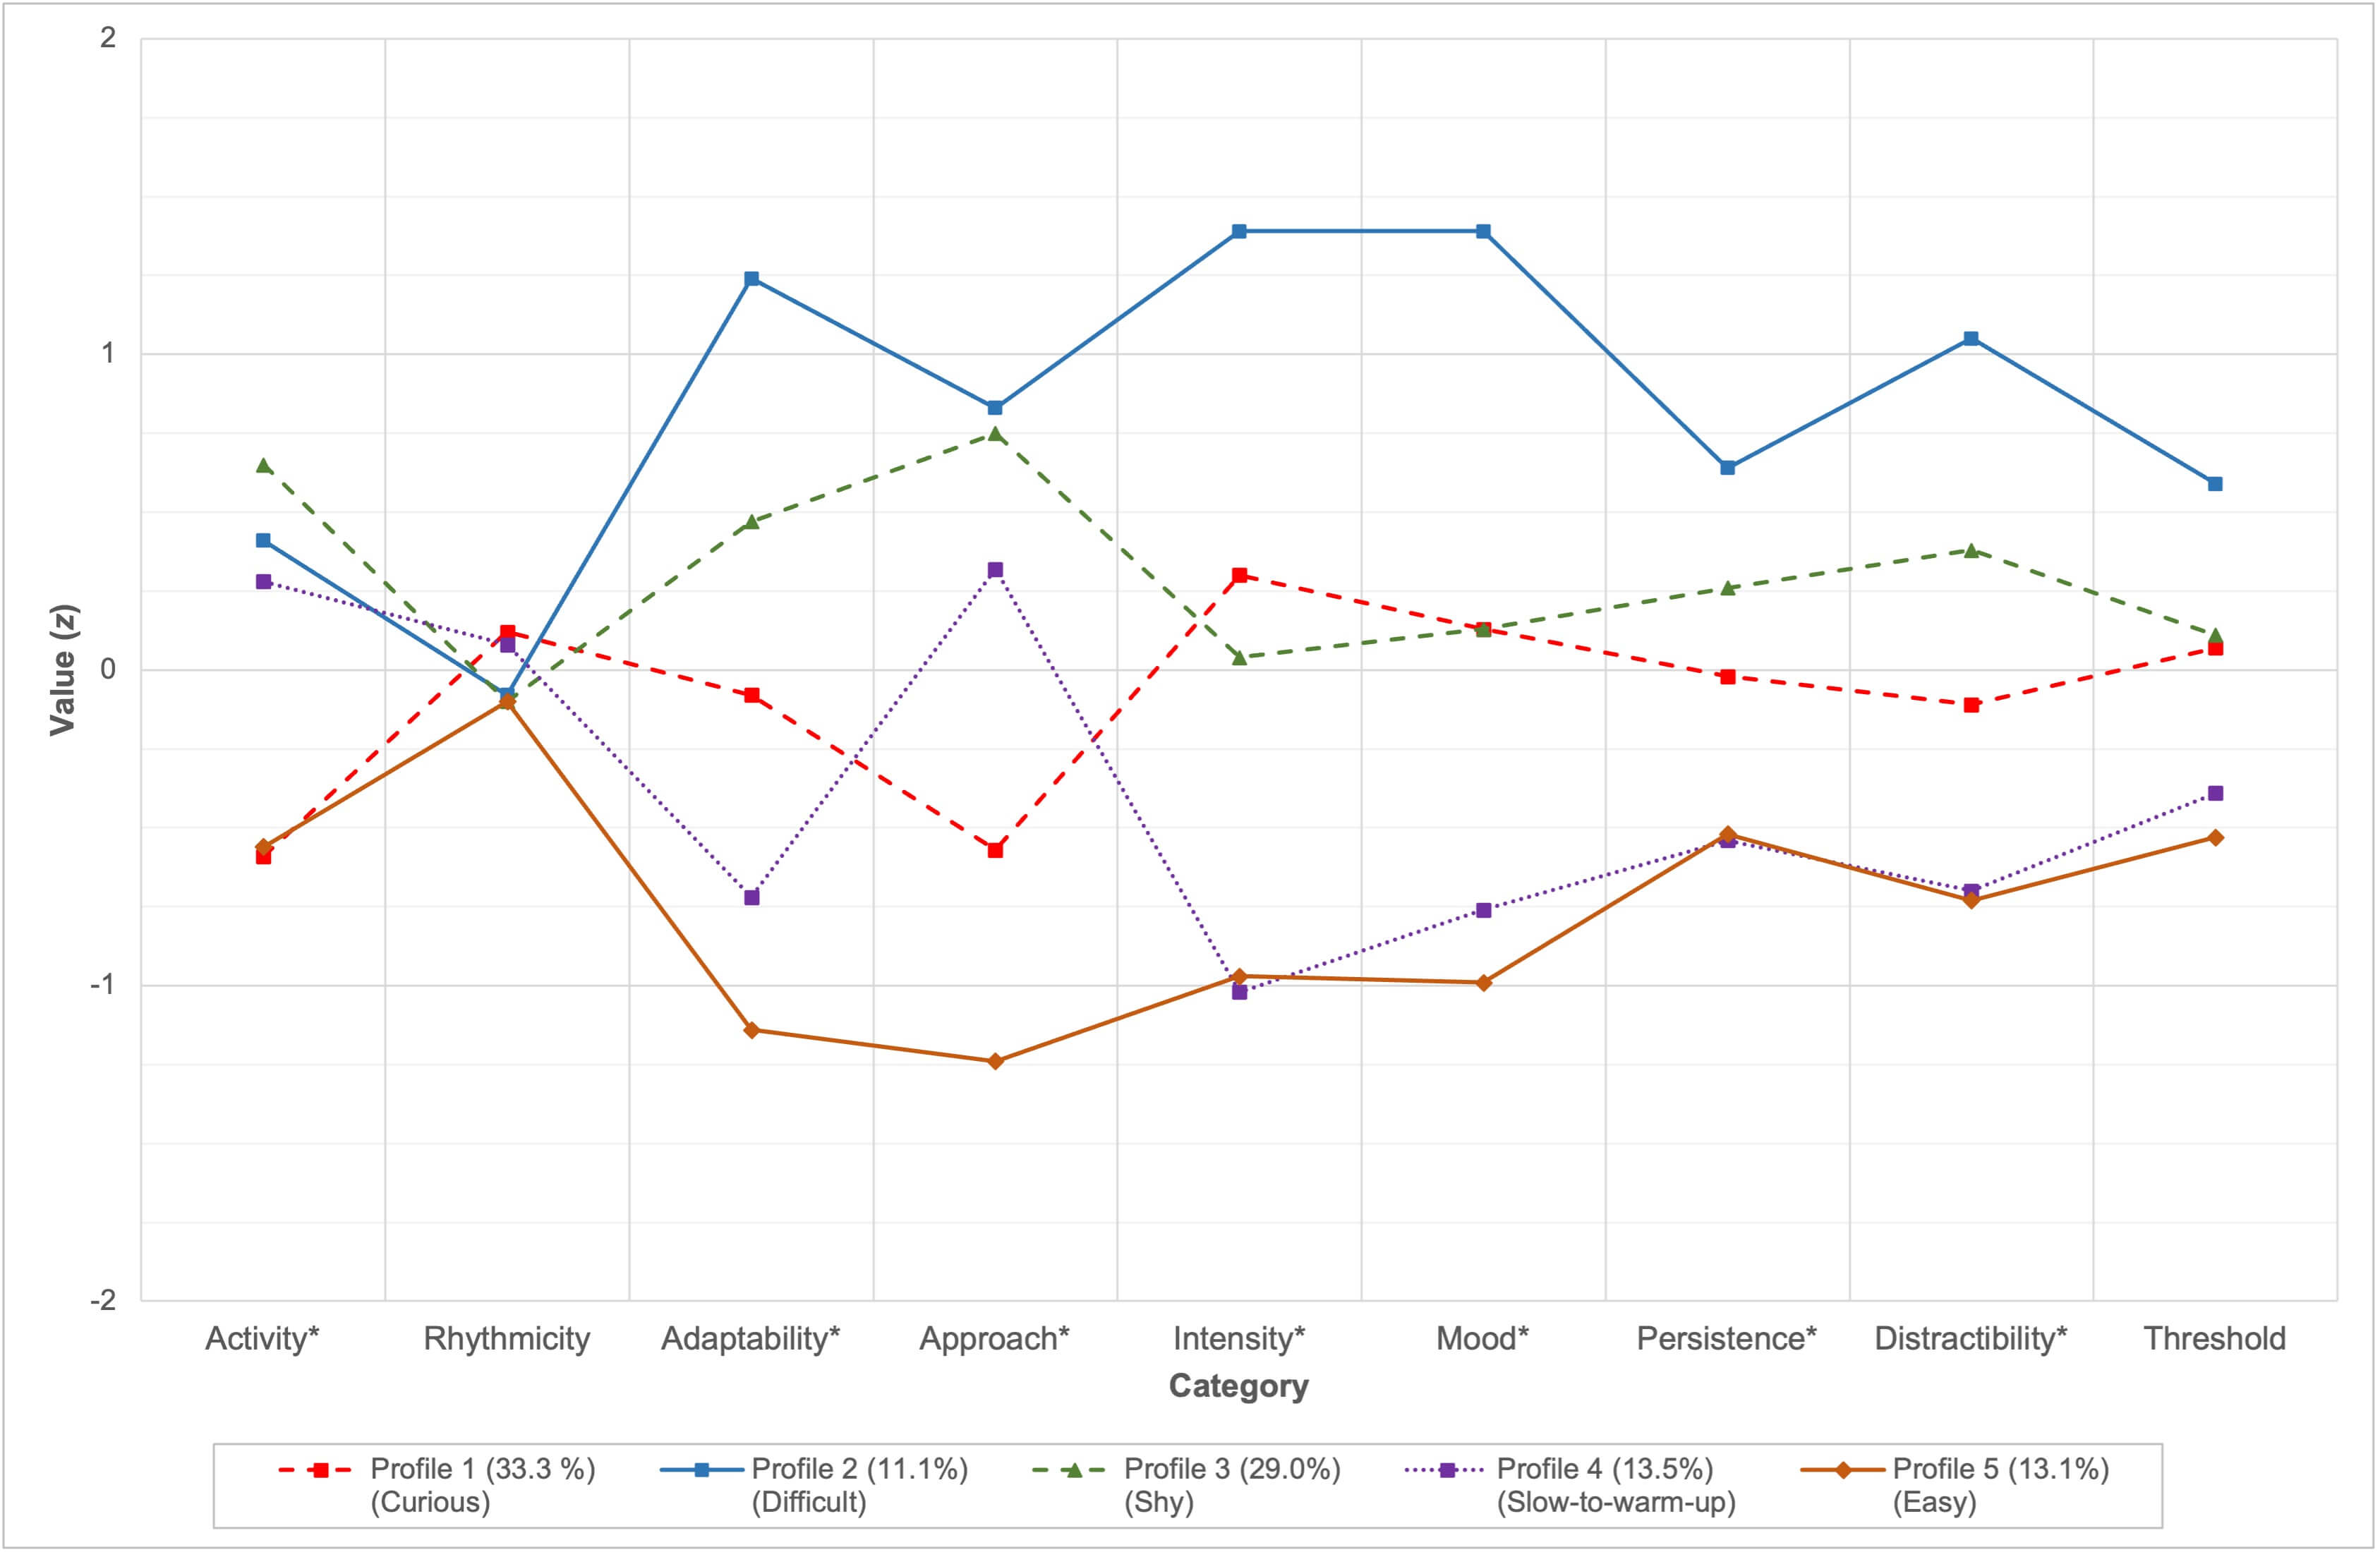 Fig. 1.
Profile plot of the five-profile model. Higher ATQ2 scores represent: low activity level, high rhythmicity (or regularity), gradual adaptability, low approach (or initial withdrawal), high intensity, negative mood, low persistence, high distractibility, and low sensory threshold (or sensitivity). Categories that most effectively differentiated the profiles (where statistically significant differences were accompanied by medium or large effect sizes) are denoted with an asterisk (*).
| Variables | M | SD | Post-hoc test | ANOVA | |||||||||
| Curious | Difficult | Shy | Slow-to-warm-up | ||||||||||
| t | d | t | d | t | d | t | d | F(4) | |||||
| Activity | 140.3*** | 0.309 | |||||||||||
| Curious (n = 419) | −0.59 | 0.79 | – | – | |||||||||
| Difficult (n = 140) | 0.41 | 0.93 | −12.3*** | −1.199 | – | – | |||||||
| Shy (n = 366) | 0.65 | 0.81 | −20.8*** | −1.490 | −2.9* | −0.291 | – | – | |||||
| Slow-to-warm-up (n = 170) | 0.28 | 0.87 | −11.5*** | −1.044 | 1.4 | 0.155 | 4.8*** | 0.447 | – | – | |||
| Easy (n = 165) | −0.56 | 0.85 | −0.4 | −0.037 | 10.1 | 1.162 | 15.5*** | 1.454 | 9.2*** | 1.007 | |||
| Rhythmicity | 3.3 | 0.010 | |||||||||||
| Curious (n = 419) | 0.12 | 0.95 | – | – | |||||||||
| Difficult (n = 140) | −0.08 | 1.03 | 2.0* | 0.198 | – | – | |||||||
| Shy (n = 366) | −0.10 | 0.98 | 3.1 | 0.220 | 0.220 | 0.022 | – | – | |||||
| Slow-to-warm-up (n = 170) | 0.08 | 1.08 | 0.5 | 0.046 | −1.338 | −0.153 | −1.9 | −0.175 | – | – | |||
| Easy (n = 165) | −0.10 | 1.01 | 2.4 | 0.220 | 0.190 | 0.022 | 0 | 0 | 1.6 | 0.174 | |||
| Adaptability | 284.5*** | 0.476 | |||||||||||
| Curious (n = 419) | −0.08 | 0.70 | – | – | |||||||||
| Difficult (n = 140) | 1.24 | 0.82 | −18.7*** | −1.827 | – | – | |||||||
| Shy (n = 366) | 0.47 | 0.82 | −10.5*** | −0.755 | 10.8*** | 1.073 | – | – | |||||
| Slow-to-warm-up (n = 170) | −0.72 | 0.68 | 9.6*** | 0.874 | 23.7*** | 2.702 | 17.5*** | 1.629 | – | – | |||
| Easy (n = 165) | −1.14 | 0.52 | 15.8*** | 1.454 | 28.6*** | 3.281 | 23.5*** | 2.208 | 5.3*** | 0.579 | |||
| Approach | 405.7*** | 0.564 | |||||||||||
| Curious (n = 419) | −0.57 | 0.73 | – | – | |||||||||
| Difficult (n = 140) | 0.83 | 0.78 | −21.7*** | −2.122 | – | – | |||||||
| Shy (n = 366) | 0.75 | 0.61 | −28.0*** | −2.003 | 1.2 | 0.119 | – | – | |||||
| Slow-to-warm-up (n = 170) | 0.32 | 0.60 | −14.8*** | −1.344 | 6.8*** | 0.779 | 7.1*** | 0.660 | – | – | |||
| Easy (n = 165) | −1.24 | 0.54 | 10.9*** | 1.002 | 27.2*** | 3.124 | 32.0*** | 3.005 | 21.5*** | 2.345 | |||
| Intensity | 324.1*** | 0.508 | |||||||||||
| Curious (n = 419) | 0.30 | 0.71 | – | – | |||||||||
| Difficult (n = 140) | 1.39 | 0.63 | −15.9*** | −1.552 | – | – | |||||||
| Shy (n = 366) | 0.04 | 0.75 | 5.0*** | 0.360 | 19.2*** | 1.912 | – | – | |||||
| Slow-to-warm-up (n = 170) | −1.02 | 0.65 | 20.6*** | 1.872 | 30.0*** | 3.425 | 16.3*** | 1.512 | – | – | |||
| Easy (n = 165) | −0.97 | 0.70 | 19.7*** | 1.808 | 29.2*** | 3.360 | 15.4*** | 1.448 | −0.590 | −0.064 | |||
| Mood | 239.7*** | 0.433 | |||||||||||
| Curious (n = 419) | 0.13 | 0.74 | – | – | |||||||||
| Difficult (n = 140) | 1.39 | 0.78 | −17.2*** | −1.679 | – | – | |||||||
| Shy (n = 366) | 0.13 | 0.78 | 0 | 0 | 16.9*** | 1.680 | – | – | |||||
| Slow-to-warm-up (n = 170) | −0.76 | 0.78 | 13.0*** | 1.178 | 25.0*** | 2.857 | 12.7*** | 1.177 | – | – | |||
| Easy (n = 165) | −0.99 | 0.67 | 16.1*** | 1.483 | 27.5*** | 3.162 | 15.8*** | 1.482 | 2.8 | 0.305 | |||
| Persistence | 50.9*** | 0.140 | |||||||||||
| Curious (n = 419) | −0.02 | 0.87 | – | – | |||||||||
| Difficult (n = 140) | 0.64 | 1.09 | −7.2*** | −0.707 | – | – | |||||||
| Shy (n = 366) | 0.26 | 1.00 | −4.3*** | −0.307 | 4.0*** | 0.400 | – | – | |||||
| Slow-to-warm-up (n = 170) | −0.54 | 0.84 | 6.1*** | 0.554 | 11.0*** | 1.261 | 9.3*** | 0.861 | – | – | |||
| Easy (n = 165) | −0.52 | 0.86 | 5.9*** | 0.538 | 10.8*** | 1.245 | 9.0*** | 0.845 | −0.1 | −0.016 | |||
| Distractibility | 137.6*** | 0.305 | |||||||||||
| Curious (n = 419) | −0.11 | 0.81 | – | – | |||||||||
| Difficult (n = 140) | 1.05 | 0.78 | −14.2*** | −1.389 | – | – | |||||||
| Shy (n = 366) | 0.38 | 0.85 | −8.1*** | −0.576 | 8.2*** | 0.813 | – | – | |||||
| Slow-to-warm-up (n = 170) | −0.70 | 0.93 | 7.8*** | 0.712 | 18.4*** | 2.101 | 13.9*** | 1.288 | – | – | |||
| Easy (n = 165) | −0.73 | 0.82 | 8.2*** | 0.751 | 13.9*** | 2.140 | 14.2*** | 1.327 | 0.359 | 0.039 | |||
| Threshold | 35.3 | 0.101 | |||||||||||
| Curious (n = 419) | 0.07 | 0.92 | – | – | |||||||||
| Difficult (n = 140) | 0.59 | 0.91 | −5.6*** | −0.547 | – | – | |||||||
| Shy (n = 366) | 0.11 | 0.94 | −0.6 | −0.043 | 5.1*** | 0.503 | – | – | |||||
| Slow-to-warm-up (n = 170) | −0.39 | 1.02 | 5.4*** | 0.488 | 9.1*** | 1.034 | 5.7*** | 0.531 | – | – | |||
| Easy (n = 165) | −0.53 | 1.02 | 6.8*** | 0.629 | 10.2*** | 1.176 | 7.2*** | 0.673 | 1.3 | 0.142 | |||
Note: Higher scores represent low activity level, high rhythmicity (or
regularity), gradual adaptability, low approach (or initial withdrawal), high
intensity, negative mood, low persistence, high distractibility, and low
threshold (or sensitivity). Post-hoc tests were performed with Bonferroni
correction, adjusting p-value for comparisons within a family of 5. For
clarity, scores that deviate significantly from the sample M are underlined,
while the t and F values are written in bold when statistical
significance (p) is accompanied by a medium or large effect size
(
Within this model, Profile 2 (11.1% of the sample) was characterized by low adaptability, withdrawal, high emotional intensity, negative mood, and distractibility, corresponding to the Difficult temperament. Individuals in this group tend to be easily distracted, react strongly—often negatively—to environmental changes, and require more time to adjust to new circumstances. In contrast, Profile 5 (13.1%) was characterized by high adaptability, positive responses to novelty, mild emotional reactivity, positive mood, and low distractibility, reflecting the Easy temperament—typically flexible, stable, and responsive to environmental demands. The remaining profiles reflected more differentiated patterns. Profile 1 (33.3%) exhibited high activity and strong approach behavior, earning the label Curious; individuals with this profile are energetic, exploratory, and readily engage with new situations. Profile 3 (29.0%) showed low activity and pronounced withdrawal, consistent with a Shy temperament characterized by hesitancy and slow engagement in unfamiliar settings. Finally, Profile 4 (13.5%) shared traits with Easy type—adaptability, mild emotional responses, and positive mood—but differed in exhibiting lower activity and a more cautious approach to novelty, aligning with the Slow-to-warm-up profile. Collectively, the behavioral distinctions across profiles underscore the conceptual coherence of the typology and support the rationale for the adopted labels.
The distribution of temperament profiles and the probabilities of profile membership were examined across country, gender, and age. Due to the large sample size, there were some significant correlations accounted for only small amounts of variance (Table 4).
| Profile | Country | Gender | Age | ||||||||
| Prevalence | Probability | Prevalence | Probability | Prevalence | Probability | ||||||
| USA, % | LT, % | t (1258) | d | Female, % | Male, % | t (1254) | d | M | SD | r | |
| Curious | 28.3 | 37.1 | −4.1*** | −0.230 | 32.2 | 37.4 | −2.2* | −0.146 | 32.7 | 12.4 | 0.03 |
| Difficult | 10.5 | 11.6 | −0.6 | −0.035 | 12.1 | 7.7 | 2.4* | 0.158 | 30.3 | 10.2 | −0.07* |
| Shy | 31.8 | 26.9 | 1.9 | 0.107 | 30.3 | 24.5 | 2.2* | 0.149 | 30.9 | 12.2 | −0.08** |
| Slow-to-warm-up | 15.9 | 11.6 | 3.3*** | 0.190 | 12.6 | 16.8 | −1.5 | −0.101 | 32.3 | 13.8 | 0.03 |
| Easy | 13.5 | 12.8 | 0.4 | 0.023 | 12.9 | 13.6 | −0.9 | −0.060 | 35.3 | 15.7 | 0.11*** |
| F(4) = 4.1** | |||||||||||
| Cramer’s V = 0.107 | Cramer’s V = 0.094 | ||||||||||
Note: Due to the limited number of non-binary individuals, gender analysis
focused exclusively on data from female and male participants (n = 1256).
*p
The analysis revealed a statistically significant, though small, association between profile distribution and country. In both, the USA and Lithuanian samples, the Curious and Shy profiles predominated, together accounting for approximately 60% of participants. In the USA sample, the Difficult profile was the least prevalent, whereas in the Lithuanian sample, both the Difficult and Slow-to-warm-up profiles occurred at similarly low rates. Probability analyses supported these findings: Lithuanian participants were more likely to belong to the Curious profile, whereas USA participants showed a higher likelihood of being classified as Slow-to-warm-up. These differences, although statistically significant, were accompanied by small effect sizes.
Gender-based differences also reached statistical significance but were similarly limited in magnitude. Across both female and male subgroups, the Curious and Shy profiles were the most common, while the Difficult profile was the least frequent, especially among males. Probability estimates indicated that females were more likely than males to belong to the Difficult and Shy profiles, whereas males were more likely to be classified as Curious. However, all observed gender differences exhibited very weak effect sizes, indicating minimal practical significance.
Age-related differences in profile membership were also statistically significant, though with small magnitude. Participants in the Difficult profile had the lowest average age, while those in the Easy profile had the highest. The remaining profiles showed intermediate age distributions. A positive association was observed between age and the probability of membership in the Easy profile, whereas negative associations emerged for the Difficult and Shy profiles. Although statistically significant, these relationships were weak, suggesting that age had only a minimal influence on profile assignment.
Overall, these findings indicate that country, gender, and age were not major correlates of temperament profile membership in this sample, supporting the generalizability of the five-profile structure across sociodemographic groups.
This study identified five qualitatively distinct adult temperament profiles—Easy, Difficult, Slow-to-warm-up, Curious, and Shy—based on a large cross-national sample assessed with standardized self-report instruments grounded in the NYLS framework. The first three profiles closely resembled the original NYLS types (Chess and Thomas, 1999; Thomas et al., 1963), reinforcing the framework’s enduring relevance. However, the Easy profile was less prevalent in this adult sample, and no “unclassified” or “intermediate” individuals were identified. Instead, participants not captured by the original typology were meaningfully grouped into two additional profiles: Curious and Shy. This suggests that the classic three-type structure, while foundational, may have overlooked important temperament configurations that become detectable when using modern person-centered methods.
The Curious and Shy profiles represent conceptually coherent extensions of the NYLS model, distinguished primarily by approach-withdrawal tendencies and activity level—dimensions central to many temperament theories (Zuckerman, 2012). The Curious profile was characterized by high activity and strong approach tendencies, whereas the Shy profile reflected low activity and marked withdrawal. These opposing behavioral styles help address a theoretical gap left by the original NYLS structure. It is plausible that these patterns were not previously detected due to their limited relevance to symptomatic behaviors.
The five-profile model also aligns conceptually with other large-scale typologies. For instance, the Dunedin study proposed five temperament types: Undercontrolled, Inhibited, Confident, Reserved, and Well-adjusted (Caspi and Silva, 1995; Caspi et al., 2003). Several of these correspond to NYLS categories: Undercontrolled with Difficult, Inhibited with Slow-to-warm-up, and Well-adjusted with Easy (Caspi, 2000). The Curious profile resembles the Confident type, defined by high approachability in childhood and impulsivity in adulthood, whereas the Shy profile parallels the Reserved type, characterized by withdrawal and sluggishness in childhood and a less decisive disposition in adulthood. Additional support comes from person-centered models grounded in broader personality frameworks. For example, Herzberg and Roth (2006) used Big Five data to identify five clusters—Resilient, Overcontrolled, Undercontrolled, Reserved, and Confident—that closely parallel both the Dunedin and current model. Although based on different theoretical foundations, this structure shows organizational similarities, suggesting common patterns of personality and temperament across frameworks. This is consistent with Asendorpf’s (2008) work, which directly linked NYLS temperament concepts to adult personality prototypes, highlighting continuity from early behavioral tendencies into adulthood. Taken together, these parallels position the present five-profile solution within a broader family of five-type models, underscoring its theoretical significance and its convergence with established temperament and personality typologies.
The present typology also helps clarify previously overlapping constructs in the literature. For instance, the Slow-to-warm-up profile identified here, characterized by withdrawal, persistence, and low distractibility, more closely aligns with the Reserved type in the Dunedin study (Caspi and Silva, 1995) than with the Inhibited type. In contrast, the Shy profile, which also exhibits withdrawal but is characterized by low persistence and high distractibility, aligns more closely with the Inhibited type. This distinction addresses a long-standing conflation between temperamental shyness and Slow-to-warm-up temperament. Asendorpf (2008) described a “Slow-to-warm-up inhibited temperament” (p. 113) as a developmental precursor to adult introversion and neuroticism. Our findings suggest that this description more accurately characterizes the Shy profile, while the Slow-to-warm-up profile appears more self-regulated and emotionally stable in terms of behavioral reactivity. These refinements enhance conceptual precision and may inform both developmental theory and clinical assessment.
Beyond temperament, person-centered models based on broader personality inventories further highlight the relevance of the current findings. For instance, studies by Isler et al. (2016) and Daljeet et al. (2017), using the Big Five and HEXACO models, identified three- to five-profile structures through latent modeling approaches. Similarly, Fisher and Robie (2019), using an exceptionally large global dataset, proposed a three-profile system—Maladaptive, Adaptive, and Highly-adaptive—based on overall psychological adjustment. On the one hand, these models, though grounded in different traditions, show similar patterns of high and low trait expression. On the other hand, they typically do not capture qualitative distinctions in behavioral reactivity, such as approach-withdrawal or emotional intensity, which are central to temperament theory. This comparison highlights the complementary value of temperament-based typologies in capturing early-emerging affective and regulatory styles that may precede or inform broader personality constructs.
Demographic factors, including age, gender, and country, were not meaningfully associated with temperament profile membership. Although some effects reached statistical significance, their effect sizes were small, indicating limited practical relevance. This finding aligns with previous research suggesting that demographic effects may be weaker in adulthood, particularly in older samples (Brancart et al., 2024). Prior studies have reported mixed findings regarding gender-based differences (Wessman et al., 2012; Wytykowska et al., 2022), but these often relied on broader constructs or included non-temperamental variables, making direct comparisons difficult. The similarity in profile distributions across the USA and Lithuanian samples further supports the potential cross-cultural generalizability of the five-profile model. Nonetheless, future research should examine whether more nuanced patterns were obscured by sample characteristics, cohort effects, or broader sociocultural factors.
From an applied perspective, the current findings are potentially relevant for temperament-based assessment and for identifying individual differences in behavioral style, emotional responsiveness, and person-environment fit in both clinical and everyday contexts. The clear differentiation among the five profiles may also facilitate more personalized approaches in psychological assessment, counseling, and workplace or interpersonal settings by linking characteristic patterns of activity and approach-withdrawal tendencies to adaptive functioning and social behavior. The cross-national similarity of profiles further indicates that these configurations reflect broad, culturally generalizable dimensions of temperament rather than sample-specific artifacts. Regarding developmental continuity, the present typology could facilitate integration of the NYLS framework across the lifespan if replicated in younger samples. Establishing whether a similar structure emerges in childhood will require empirical testing using existing caregiver-based assessment instruments rather than self-report measures (Carey and McDevitt, 2016). Such research would clarify whether the five-profile solution reflects a stable organizational pattern of temperament from early life into adulthood.
Several limitations of the present study should be acknowledged, some of which also suggest promising directions for future research. First, although the five-profile solution demonstrated theoretical coherence and statistical robustness, internal validation procedures, such as cross-validation or sample splitting, were not conducted. Future research should assess the stability and replicability of the profiles using resampling methods, alternative model validation strategies, or analyses on independent samples, and could also apply multiple-group LPA to examine population-level differences more directly. Second, although the Difficult profile is well documented in the clinical literature, the Curious and Shy profiles remain less understood. Their psychological, behavioral, and health-related correlates warrant further investigation to determine their predictive and practical significance. Incorporating external validation measures, such as personality or adjustment indicators, would provide additional insight into the functional significance of these profiles. Third, the study relied on a convenience sample that was predominantly female, which may limit generalizability of the findings. Although no meaningful gender-based differences were observed, future research should aim for greater demographic balance and include gender-diverse participants. Fourth, temperament was assessed through a self-report instrument, which is inherently susceptible to biases in self-perception and response style. Although data quality was monitored through a careless responding screening procedure, which partially controlled for response bias, reliance on self-report therefore remains a limitation of the study. Fifth, beyond country of residence, no additional sociodemographic variables, such as education, occupation, or income, were collected. These factors may influence or moderate temperament profiles and should be addressed in future research. Finally, longitudinal studies are needed to examine intraindividual changes in temperament, transitions between profiles, and the stability of the five-profile model over time. Extending this typology to childhood and adolescence is essential for assessing developmental continuity and identifying early predictors of adult temperament configurations.
The current study re-evaluated the classic NYLS temperament typology using modern person-centered statistical methods in a large adult sample. Five temperament profiles—Easy, Difficult, Slow-to-warm-up, Curious, and Shy—were identified. Three profiles closely aligned with the original NYLS categories, while two extended the model in theoretically meaningful ways and demonstrated conceptual connections to other temperament and personality typologies. Notably, profile membership was largely independent of age, gender, and country, suggesting broad applicability across demographic groups.
By offering greater structural clarity and conceptual refinement, the updated typology advances efforts to understand individual differences in temperament across the lifespan. Future research should aim to replicate this model in diverse populations, evaluate its predictive validity, and explore its relevance across developmental, clinical, and applied contexts.
The data that support the findings of this study are available from the authors upon reasonable request.
SM played a lead role in supervision and an equal role in conceptualization, data curation, investigation, methodology, writing—original draft, writing—review and editing. TL played a lead role in formal analysis and visualization and an equal role in conceptualization, data curation, investigation, methodology, writing—original draft, writing—review and editing. Both authors contributed to editorial changes in the manuscript. Both authors read and approved the final manuscript. Both authors have participated sufficiently in the work and agreed to be accountable for all aspects of the work.
The study was conducted in accordance with the Declaration of Helsinki. The research protocol adhered to herein was approved by the Vilnius University Committee on Research Ethics in Psychology (No. 31/(1.3 E) 250000-KP-50). Authorization for the use of anonymous server data was granted by the Project Manager at Behavioral–Developmental Initiatives. Informed consent was obtained from all participants included in the study.
The authors wish to express their gratitude to Roy P. Martin, Professor Emeritus at the University of Georgia, for his valuable contribution to this paper. His thoughtful review of an earlier version of the manuscript and helpful comments greatly enhanced the quality and clarity of this paper.
This research received no external funding.
The authors declare no conflict of interest.
Supplementary material associated with this article can be found, in the online version, at https://doi.org/10.31083/BP45740.
References
Publisher’s Note: IMR Press stays neutral with regard to jurisdictional claims in published maps and institutional affiliations.