


 , José Luis González Gutiérrez 1,*
 , Almudena López-López 1
1 Department of Psychology, Faculty of Health Sciences, Universidad Rey Juan Carlos, 28922 Alcorcón, Spain
2 Faculty of Psychology, Universidad El Bosque, 110121 Bogotá, D.C., Colombia
Abstract
Sensory Processing Sensitivity (SPS) is a personality trait that characterizes Highly Sensitive Persons (HSPs), who are distinguished by deep information processing, heightened emotional reactivity, and marked sensitivity to subtle environmental stimuli. Although the Highly Sensitive Person Scale (HSPS), developed by Aron and Aron (1997), has been adapted to various cultural contexts, no version had yet been adapted or psychometrically validated for the Colombian population.
The study was conducted in two phases. First, the HSPS was culturally adapted to the Colombian context through translation and expert review by a panel of six specialists (five psychologists and one linguist). A pilot study with 50 participants was conducted to refine the instrument, resulting in the Colombian version (EPAS-COL). In the second phase, the EPAS-COL was administered to a sample of 1222 Colombian participants (917 women and 305 men). Confirmatory factor analysis (CFA) was performed to assess its internal structure, testing nine previously reported models. Reliability was estimated using McDonald’s omega coefficient, and test-retest stability was evaluated in a subsample of 173 participants. Convergent validity was assessed through Spearman correlations with the Activation Proneness Scale (APS), the Behavioral Inhibition System and Behavioral Activation System Scales (BIS/BAS), and the Perceived Stress Scale (PSS).
The EPAS-COL showed a good fit to a bifactor model, comprising a general sensitivity factor and three specific factors, with high internal consistency and temporal stability. Significant correlations with related constructs supported its convergent and divergent validity.
The EPAS-COL proved to be a valid and reliable tool for assessing sensory processing sensitivity in the Colombian population. Its application may be valuable in clinical, educational, organizational, and health settings, facilitating the identification of the trait and the development of interventions to enhance well-being and quality of life.
Keywords
- highly sensitive person
- sensory processing sensitivity
- personality
- validation
Highly Sensitive Persons (HSPs) possess the personality trait known as Sensory Processing Sensitivity (SPS; (Aron and Aron, 1997), a construct that has garnered interest and significant evidence due to its impact on well-being, quality of life and the functional challenges faced by more sensitive individuals (Aron et al, 2012). These individuals are more affected by their environment, leading to implications for health, education and work (Greven et al, 2019). The profile description includes characteristics such as deep information processing, strong emotional reactivity, susceptibility to environmental stimuli, perception of subtle stimuli and ease of over-stimulation (Aron et al, 2012).
Initial studies on the SPS trait identified highly sensitive persons as processors of highly heterogeneous information: they detected subtle differences in the environment; they were sensitive to hunger, the effect of caffeine and the perception of the mood of others; they tended to process and respond to auditory, olfactory, visual and tactile information at lower sensory thresholds than the rest of the population (e.g., pain sensitivity); they were sensitive to over-stimulation and strong sensory inputs; they perceived changes in the environment and demonstrated sensitivity to the arts, violence in audiovisual media or feeling observed. In general, they processed environmental, social and emotional experiences more fully (Aron and Aron, 1997).
It is estimated that the SPS trait is present in approximately 15 to 30% of the population (Aron and Aron, 1997; Lionetti et al, 2018) and literature supports that it has a solid genetic basis (Assary et al, 2021; Peel et al, 2023). It is a common, hereditary trait that has been evolutionarily preserved (Greven et al, 2019). Several studies have shown that the sensory processing sensitivity trait tends to be stable and consistent over time; however, it may exhibit some variability due to environmental factors (Acevedo et al, 2014; Jagiellowicz et al, 2016; Pluess and Boniwell, 2015) such as life experiences and changes in physical and mental health.
To measure the SPS, Aron and Aron (1997) developed a self-reporting measure called the Highly Sensitive Person Scale (HSPS), which has been adapted to various populations: Norwegian (Listou Grimen and Diseth, 2016); Japanese (Takahashi, 2016); German (Konrad and Herzberg, 2017); Turkish (Şengül-İnal and Sümer, 2020); Russian (Ershova et al, 2018); Mexican (Montoya-Pérez et al, 2019); with South African (May et al, 2022); Portuguese (Pereira and Monteiro, 2020); and Spanish samples (Chacón et al, 2021).
The internal structure of the HSPS has been examined across different populations to verify the unidimensionality initially proposed by its authors (Aron and Aron, 1997). However, despite the high genetic dependency identified for this trait, which suggests significant intercultural stability in its factorial structure (Assary et al, 2021; Peel et al, 2023), the various studies have not yielded results.
In this regard, there is evidence of two-factor (Ershova et al, 2018; Evans and Rothbart, 2008; Montoya-Pérez et al, 2019), three-factor (Listou Grimen and Diseth, 2016; Konrad and Herzberg, 2017; Pereira and Monteiro, 2020; Takahashi, 2016), four-factor (Şengül-İnal and Sümer, 2020; Smolewska et al, 2006) and five-factor models (Chacón et al, 2021; May et al, 2022). In the study by Lionetti et al (2018), a bifactorial structure was tested for the HSPS, i.e., a construct with one factor for general sensitivity and three factors for sensitivity to sensory stimuli: (Lionetti et al, 2018). These studies were conducted with populations from different countries, a significant number of participants and the inclusion of relevant criteria variables. It should be noted that methodological limitations were also present, such as homogeneous university samples, data collection processes, and cultural differences even within the same countries. However, the findings provide consistent support for a construct of at least three sensitivity factors: Low Sensory Threshold (LST), Ease of Excitation (EOE) and Aesthetic Sensitivity (AES), mentioned in 92.3% of the thirteen studies reviewed.
As evidence of external validity, scores on the HSPS have been shown to be associated with measures from key theories and models of temperament and personality traits that, in some way, imply sensitivity to environmental stimuli. These include the three traits in Eysenck’s personality theory (Eysenck, 2006), the two dimensions of Gray’s reinforcement sensitivity model (1970), and the five-factor model of personality (Goldberg, 1993).
The importance of the SPS trait lies in its positive association with different negative biopsychosocial variables such as: anxiety (Ben-Avi et al, 2012; Blach and Egger, 2014; Hofmann and Bitran, 2007), stress (Ahadi and Basharpoor, 2010; Benham, 2006; Blach and Egger, 2014; Gerstenberg, 2012; Redfearn et al, 2020; Wu et al, 2021), depression (Ahadi and Basharpoor, 2010; Blach and Egger, 2014; Pluess and Boniwell, 2015; Wu et al, 2021; Yano et al, 2019), burnout (Redfearn et al, 2020; Stefan Lindsay, 2017), physical and psychological variables or symptoms associated with poor health or health complaints and discomfort (Benham, 2006; Listou Grimen and Diseth, 2016); autistic symptoms (Liss et al, 2008), and difficulties in social interaction (Ahadi and Basharpoor, 2010; Ben-Avi et al, 2012).
The trait of high sensory sensitivity modulates and negatively impacts individuals’ interaction with their environment in general, due to the high vulnerability to external influences it entails (Aron et al, 2012), its association with low mental health (Ahadi and Basharpoor, 2010; Costa-López et al, 2021a), and its negative effect on quality of life across physical, cognitive, emotional and social domains (Costa-López et al, 2021b). It also affects well-being, coping with environmental situations and individuals’ general functioning. An individual’s life may be significantly affected by physiological and psychological reactions to stimulation from various contexts, such as work, family and social environments (Ben-Avi et al, 2012). The Highly Sensitive Person Scale-Colombian version (Escala de Personas Altamente Sensibles-versión colombiana; EPAS-COL), as a tool capable of identifying individuals’ levels of sensory sensitivity, is a valuable instrument for use in health, clinical, educational and organizational contexts.
Despite its potential utility, this scale has not yet been adapted for the Colombian population. Therefore, the aim of this study was to adapt the original version of the HSPS scale (Aron and Aron, 1997), using a sample of Colombian individuals to examine psychometric properties and internal structure.
Following the recommendation of Mundfrom et al (2005), the objective was to achieve a sample size of more than 1000 participants. The sample was made up of 1222 Colombian individuals over the age of 18, of whom 917 were women (75%) and 305 were men (25%). The age range was between 18 and 72 years, with an average of 28.4 years (SD = 11.1 years), 28.0 years for women (SD = 10.5 years) and 29.8 years for men (SD = 12.7 years). The socio-demographic characteristics of the sample can be seen in Table 1.
| Variable | n | % | |
| Age group | |||
| Young person (18–24 years) | 645 | 52.8 | |
| Young adult (25–44 years) | 444 | 36.3 | |
| Middle-aged (45–64 years) | 126 | 10.3 | |
| Senior ( |
7 | 0.6 | |
| Civil status | |||
| Single | 897 | 73.4 | |
| Married | 184 | 15.1 | |
| Common-law partnership | 90 | 7.4 | |
| Divorced | 26 | 2.1 | |
| Widowed | 4 | 0.3 | |
| No answer | 21 | 1.7 | |
| Level of education | |||
| Primary | 3 | 0.2 | |
| Secondary | 549 | 44.9 | |
| University | 338 | 27.7 | |
| Postgraduate | 310 | 25.4 | |
| No answer | 22 | 1.8 | |
| Occupation | |||
| Student | 672 | 55.0 | |
| Employed | 373 | 30.5 | |
| Independent worker | 96 | 7.9 | |
| Unemployed | 48 | 3.9 | |
| Pensioner | 11 | 0.9 | |
| No answer | 22 | 1.8 | |
After six months following the initial application, 173 participants were randomly selected from the original sample to complete the scale in order to examine the stability of the EPAS-COL over time. Of these, 129 were women (74.6%) and 44 were men (25.4%), with an average age of 30.0 years (SD = 11.5), 29.6 years for women, and 31.1 years for men.
(a) Highly Sensitive Person Scale (HSPS; Aron and Aron, 1997). The HSPS is a self-report instrument to measure the SPS trait. The original version consists of 27 items on a scale from 1 (Not at all) to 7 (Extremely). Higher scores represent higher sensitivity. The scale provides a total score that has been used as a continuous variable (Jagiellowicz et al, 2011) or using cut-off points (high, moderate or low sensitivity) (Lionetti et al, 2018). The 27-item version demonstrated high internal consistency, as measured by Cronbach’s alpha, with values of 0.87, in two studies by Aron and Aron (1997). The scale was translated and adapted for this study by the authors following the criteria outlined by Muñiz et al (2013) and the principles described in the Cross-Cultural Survey Guidelines (CCSG; Survey Research Center, 2016).
(b) Arousal Predisposition Scale (APS; Coren, 1990). The APS is an inventory of 12 items measuring individual differences in arousability. The total APS score is the sum of the scores of the items. The response scale ranges from “Never” (1) to “Always” (5). High scores indicate more arousal. The APS has good internal consistency, with Cronbach’s alpha coefficients of 0.84 and 0.83, respectively, for the two samples calculated by the author (Coren, 1990).
(c) Behavioural Inhibition System and Behavioural Arousal System Scales (BIS/BAS; Carver and White, 1994). The BIS/BAS evaluate individual differences in sensitivity to two basic motivational systems: the Behavioural Inhibition System (BIS) and the Behavioural Arousal System (BAS). The BIS/BAS Scales consist of 20 items that are answered using a four-option Likert scale, ranging from “strongly agree” to “strongly disagree”. There are two major sub-scales: (a) BIS with 7 items; and (b) BAS with 13 items. The BAS Scale is divided into three factors: (a) Drive (D), (b) Fun-seeking (FS), and (c) Reward responsiveness (RR). For this study, the adaptation of the instrument carried out by Jiménez et al (2009) was used, who reported internal consistency measured by Cronbach’s alpha of 0.63 for the BIS and 0.72 for the Total BAS.
(d) Perceived Stress Scale (PSS; Cohen et al, 1983), Spanish
adaptation by Remor (2006). The PSS evaluates the perception of stress over
the last month. It consists of 14 items (PPS-14) with a response range from zero
to four from “never” to “very often”. The total score of the scale is
obtained by inverting the scores of items 4, 5, 6, 7, 9, 10 and 13 (0 = 4, 1 = 3,
2 = 2, 3 = 1 and 4 = 0), and then adding the 14 items. The direct score obtained
indicates that a higher score corresponds to a higher level of perceived stress.
In the original study of the Spanish adaptation (Remor, 2006), the PSS
demonstrated adequate reliability, with an internal consistency of
The study was structured into two phases: adapting the scale and obtaining evidence of its psychometric properties. In the first phase, the HSPS adaptation process was developed according to the criteria outlined by Muñiz et al (2013) and the principles of the CCSG (Survey Research Center, 2016). The authors’ permission was obtained to validate the test. The translation and linguistic adaptation of the original English language version of the HSPS (Aron and Aron, 1997) was carried out in the Colombian context, involving six experts (5 psychologists and one linguist), who met the required profile (expertise in the subject, level of English, psychometric experience, having lived in the country of origin of the test and in the target country of the test).
A pilot study was conducted with 50 participants from Colombia, who reviewed the preliminary instrument and responded on the clarity of the items and understanding of the language. They could also suggest a better way to formulate questions or modify any wording that was difficult to understand. 92.6% of the items were considered understandable, four were reviewed in terms of linguistic and semantic equivalence. As a result of the process, the Colombian adaptation, the EPAS-COL, was obtained. The transcultural adaptation process can be seen in Fig. 1.
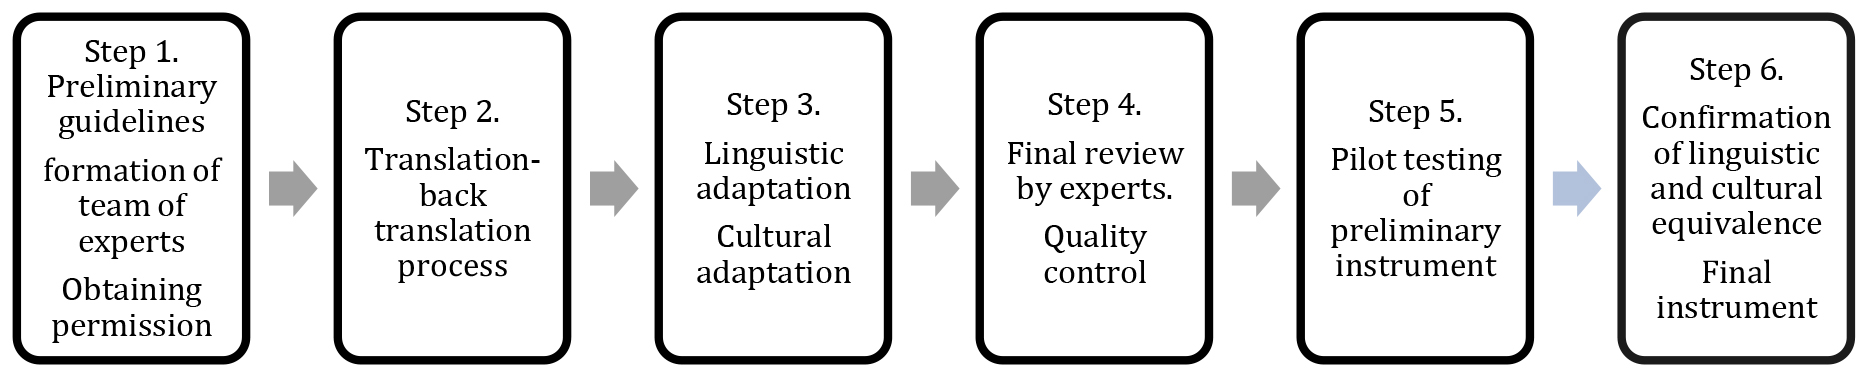 Fig. 1.
Process of translating and adapting the HSPS to the Colombian context. HSPS, Highly Sensitive Person Scale.
In the second phase, the EPAS-COL was applied along with the other instruments, following the “snowball” sampling technique, via email and social networks. With the collected data, the internal structure and psychometric properties of the instrument were explored. Thirteen validation studies of the instrument were found, and several models were selected based on the number of factors identified and those most frequently cited in the literature.
After calculating the descriptive statistics (median, standard deviation,
skewness and kurtosis) for the items of the EPAS-COL, the internal structure of
the instrument was analysed using confirmatory factor analysis (CFA), testing the
factorial solutions of nine alternative models that different studies reported as
some of the best-fitting for the structure of the original HSPS scale (one, two,
three, four and five factors, as well as a bifactorial model). When multiple
proposals with the same number of factors coexisted in the literature, the
alternatives with the strongest empirical support were chosen. The selected
models are shown in Table 2. It was previously verified, using Bartlett’s test of
Sphericity and the Kaiser-Meyer-Olkin (KMO) test, that the correlation matrix was
suitable for this type of analysis. Given that the nature of the data was
ordinal, the polychoric correlation matrix and the diagonal weighted least
squares (DWLS) estimation method were used. To evaluate the model’s fit to the
data, the chi-squared value was employed (
| Models | Country | Factors | Items |
| 1. Aron and Aron (1997) | USA | F1 = Sensory Processing Sensitivity | All 27 items |
| 2. Evans and Rothbart (2008) | USA | F1 = Negative Affect | 18 items: 1, 4, 5, 7, 9, 11, 13, 14, 16, 17, 18, 19, 20, 21, 23, 24, 25, 26 |
| F2 = Sensitivity Orientation | 7 items: 2, 3, 8, 10, 15, 22, 27 | ||
| Miscellaneous | 2 items removed: 6, 12 | ||
| 3. Ershova et al (2018) | Russia | Two related factors | |
| F1 = Ease of Excitation | 10 items: 3, 4, 5, 11, 13, 14, 16, 20, 21, 26 | ||
| F2 = Low Sensory Threshold | 4 items: 1, 7, 9, 25 | ||
| Miscellaneous | Items removed: 6, 12, 17, 18, 19, 23, 24, 27 | ||
| 4. Konrad and Herzberg (2017) | Germany | F1 = Ease of Excitation | 9 items: 3, 5, 13, 14, 19, 21, 23, 24, 26 |
| F2 = Low Sensory Threshold | 4 items: 1, 7, 9, 25 | ||
| F3 = Aesthetic Sensitivity | 4 items: 2, 8, 10, 22 | ||
| F4 = Sensory Processing Sensitivity, poor fit of the data | 11 items removed: 4, 6, 11, 12, 15, 16, 17, 18, 20, 22, 27 | ||
| 5. Listou Grimen and Diseth (2016) | Norway | F1 = Ease of Excitation | 5 items: 16, 21, 23, 24 and 26 |
| F2 = Aesthetic Sensitivity | 5 Items: 2, 8, 10, 15 and 22 | ||
| F3 = Low Sensory Threshold | 3 items: 7, 9, 25 | ||
| 6. Smolewska et al (2006) | Canada | Three first-order factors and one second order factor. | 7 items: 2, 5, 8, 10, 12, 15, 22 |
| F1 = Aesthetic Sensitivity | |||
| F2 = Low Sensory Threshold | 6 items: 6, 7, 9, 18, 19, 25 | ||
| F3 = Ease of Excitation | 12 items: 3, 4, 13, 14, 16, 17, 20, 21, 23, 24, 26, 27 | ||
| SOF = Sensory Processing Sensitivity | |||
| Miscellaneous | Items removed: 1, 11 | ||
| 7. Şengül-İnal and Sümer (2020) | Türkiye | F1 = Sensitivity to Overstimulation | 10 items: 5, 11, 14, 16, 19, 20, 21, 23, 26, 27 |
| F2 = Sensitivity to External Stimuli | 5 items: 1, 7, 9, 13, 25 | ||
| F3 = Aesthetic Sensitivity | 7 items: 2, 3, 4, 8, 10, 15, 22 | ||
| F4 = Harm Avoidance | 4 items: 12, 17, 18, 24 | ||
| 8. May et al (2022) | South Africa | F1 = Negative Affectivity | 6 items: 14, 16, 20, 21, 23, 26 |
| F2 = Neural Sensitivity | 5 items: 3, 4, 5, 11, 13 | ||
| F3 = Tendency to Feel Overwhelmed | 4 items: 7, 9, 19, 25 | ||
| F4 = Aesthetic Sensitivity | 2 items: 10, 22 | ||
| F5 = Careful Processing | 3 items: 12, 17, 24 | ||
| 9. Lionetti et al (2018) | USA and United Kingdom | Bifactorial Model (a general sensitivity construct and three individual subscales) | |
| F1 = Ease of Overstimulation | The items of each factor were not reported. | ||
| F2 = Aesthetic Sensitivity | |||
| F3 = Low Sensory Threshold |
For the reliability analysis, McDonald’s omega coefficient of internal
consistency (
Nine models reported in previous studies were estimated: (a) model 1, with a
unique factor structure with 27 items; (b) models 2 and 3, with a two-factor
solution; (c) models 4, 5 and 6 with a three-factor solution; (d) model 7 with a
four-factor solution; (e) model 8 with a five-factor solution; and (f) model 9
with a bifactorial solution. Table 2 shows the distribution of items for each
model. Previously, the assumptions were verified to ensure that the resulting
correlation matrix was suitable for these confirmatory analyses (Barttlet’s
sphericity test = 10,745.919, p
| Model | RMSEA | SRMR | CFI | TLI | df | |
| 1 | 0.076 [0.073–0.079] | 0.078 | 0.910 | 0.903 | 2607.890*** | 324 |
| 2 | 0.074 [0.071–0.077] | 0.075 | 0.924 | 0.916 | 2089.018*** | 274 |
| 3 | 0.046 [0.040–0.052] | 0.047 | 0.985 | 0.982 | 272.089*** | 76 |
| 4 | 0.048 [0.043–0.053] | 0.051 | 0.977 | 0.973 | 441.342*** | 116 |
| 5 | 0.052 [0.046–0.059] | 0.052 | 0.966 | 0.957 | 269.094*** | 62 |
| 6 | 0.064 [0.061–0.067] | 0.067 | 0.932 | 0.925 | 1621.873*** | 272 |
| 7 | 0.063 [0.060–0.066] | 0.066 | 0.943 | 0.937 | 1697.191*** | 293 |
| 8 | 0.051 [0.048–0.055] | 0.053 | 0.973 | 0.968 | 677.489*** | 160 |
| 9 | 0.048 [0.045–0.051] | 0.052 | 0.964 | 0.957 | 956.274*** | 250 |
Notes: RMSEA, Root mean square error of approximation; SRMR,
Standardised root mean square residual; CFI, Comparative fit index; TLI,
Tucker-Lewis Index; df, degrees of freedom. *** p
The proportion of items with loadings below 0.40 was similar across the three models. However, models 3 and 4 included fewer items from the EPAS-COL in their structure, unlike model 9 (bifactorial), which excluded only two items, specifically items 1 and 11. All item loadings were statistically significant on the specific factors and the general factor that constitute the bifactorial model (Fig. 2).
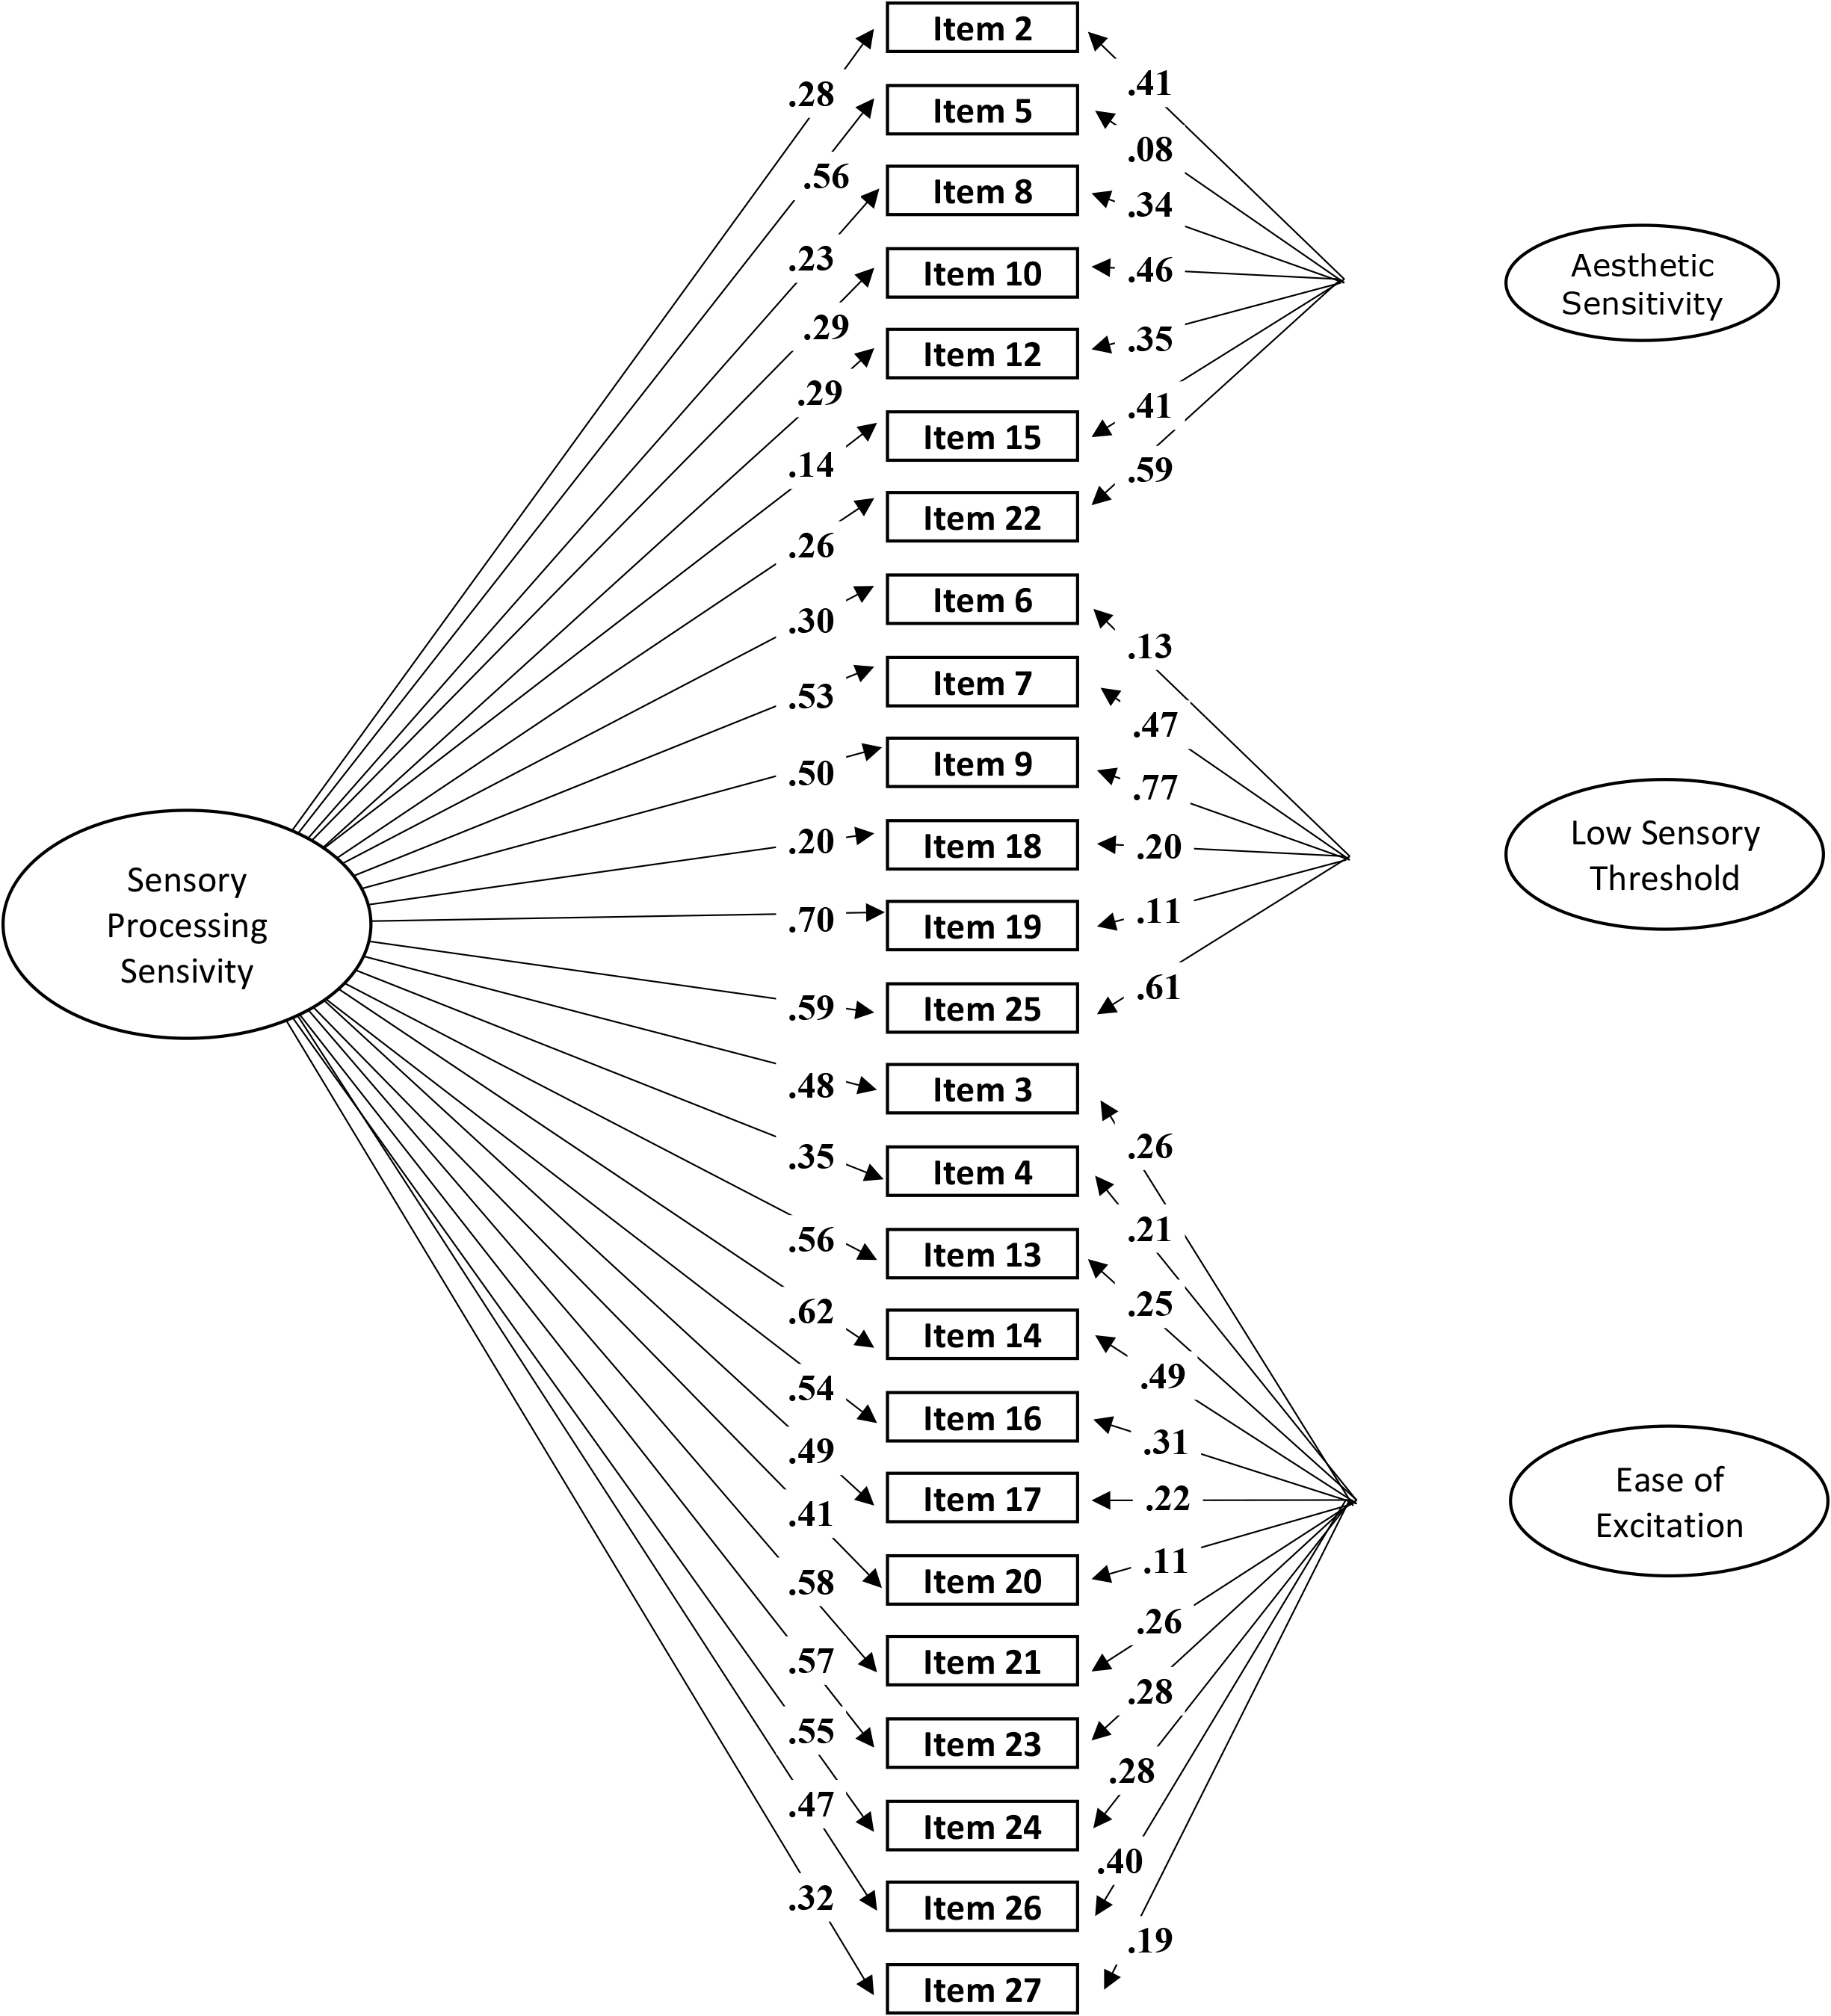 Fig. 2.
Bifactorial model of the internal structure of the Highly Sensitive Person Scale-Colombian Version (EPAS-COL).
The total scores of the EPAS-COL obtained according to the bifactorial model for
the study population ranged from 44 to 185 (M = 115.873; SD =
23.104). Following the quartile segmentation method (Aron and Aron, 1997),
26.2% of the sample participants were classified as highly sensitive, while
25.5% were placed in the low sensitivity range. Regarding differences by sex,
21.2% of women and 5.0% of men obtained scores identifiable with high sensory
sensitivity. Statistically significant differences were observed between the
proportions of men and women in the SPS variable at all levels (high, moderate
and low) (
The McDonald’s omega coefficient of internal consistency (
Table 4 shows the item-test correlations for both the original EPAS-COL (27
items) and the EPAS-COL bifactorial model (25 items). According to Kline’s
(1999) reference values, a homogeneity level of
| Item | M | SD | Skew | Kurtosis | 27 items (original) | 25 items (bifactorial) | ||
| Item-test correlation | Item-test correlation | |||||||
| 1 | 3.798 | 1.613 | –0.026 | –0.748 | 0.541 | 0.881 | - | - |
| 2 | 4.645 | 1.443 | –0.297 | –0.496 | 0.322 | 0.886 | 0.312 | 0.868 |
| 3 | 4.108 | 1.586 | 0.005 | –0.766 | 0.492 | 0.882 | 0.486 | 0.863 |
| 4 | 3.741 | 1.763 | 0.206 | –0.997 | 0.352 | 0.885 | 0.349 | 0.867 |
| 5 | 4.484 | 1.988 | –0.347 | –1.129 | 0.530 | 0.881 | 0.501 | 0.862 |
| 6 | 2.689 | 1.763 | 0.925 | –0.175 | 0.313 | 0.886 | 0.312 | 0.868 |
| 7 | 3.483 | 1.920 | 0.294 | –1.119 | 0.578 | 0.880 | 0.558 | 0.859 |
| 8 | 4.360 | 1.397 | –0.082 | –0.223 | 0.265 | 0.887 | 0.264 | 0.869 |
| 9 | 4.354 | 1.876 | –0.205 | –1.125 | 0.570 | 0.880 | 0.558 | 0.859 |
| 10 | 4.932 | 1.710 | –0.460 | –0.766 | 0.342 | 0.885 | 0.335 | 0.868 |
| 11 | 4.431 | 1.924 | –0.220 | –1.173 | 0.615 | 0.879 | - | - |
| 12 | 4.863 | 1.490 | –0.432 | –0.487 | 0.308 | 0.886 | 0.311 | 0.862 |
| 13 | 3.909 | 1.640 | 0.164 | –0.806 | 0.531 | 0.881 | 0.528 | 0.860 |
| 14 | 4.561 | 1.647 | –0.237 | –0.824 | 0.595 | 0.879 | 0.594 | 0.871 |
| 15 | 4.240 | 1.580 | –0.241 | –0.640 | 0.187 | 0.888 | 0.189 | 0.863 |
| 16 | 4.429 | 1.682 | –0.181 | –0.879 | 0.512 | 0.881 | 0.508 | 0.866 |
| 17 | 5.528 | 1.310 | –0.831 | 0.227 | 0.403 | 0.884 | 0.405 | 0.872 |
| 18 | 3.390 | 2.066 | 0.366 | –1.204 | 0.198 | 0.888 | 0.205 | 0.858 |
| 19 | 3.679 | 1.662 | 0.127 | –0.914 | 0.641 | 0.878 | 0.640 | 0.866 |
| 20 | 4.502 | 1.898 | –0.257 | –1.098 | 0.380 | 0.885 | 0.373 | 0.862 |
| 21 | 4.381 | 1.616 | –0.054 | –0.757 | 0.549 | 0.881 | 0.544 | 0.868 |
| 22 | 5.227 | 1.519 | –0.733 | –0.108 | 0.323 | 0.886 | 0.323 | 0.862 |
| 23 | 4.191 | 1.705 | –0.090 | –0.820 | 0.528 | 0.881 | 0.531 | 0.865 |
| 24 | 5.122 | 1.529 | –0.574 | –0.419 | 0.423 | 0.884 | 0.430 | 0.857 |
| 25 | 4.605 | 1.814 | –0.409 | –0.948 | 0.628 | 0.879 | 0.618 | 0.864 |
| 26 | 4.228 | 1.844 | –0.112 | –1.122 | 0.458 | 0.883 | 0.453 | 0.869 |
| 27 | 3.993 | 2.139 | –0.035 | –1.402 | 0.315 | 0.886 | 0.312 | 0.862 |
To verify the temporal stability of the EPAS-COL, based on the bifactorial
model, the Spearman-Brown rank correlation was utilised rSB between
the first and second application of the instrument. The results showed a
statistically significant relationship between both (rSB = 0.763, p
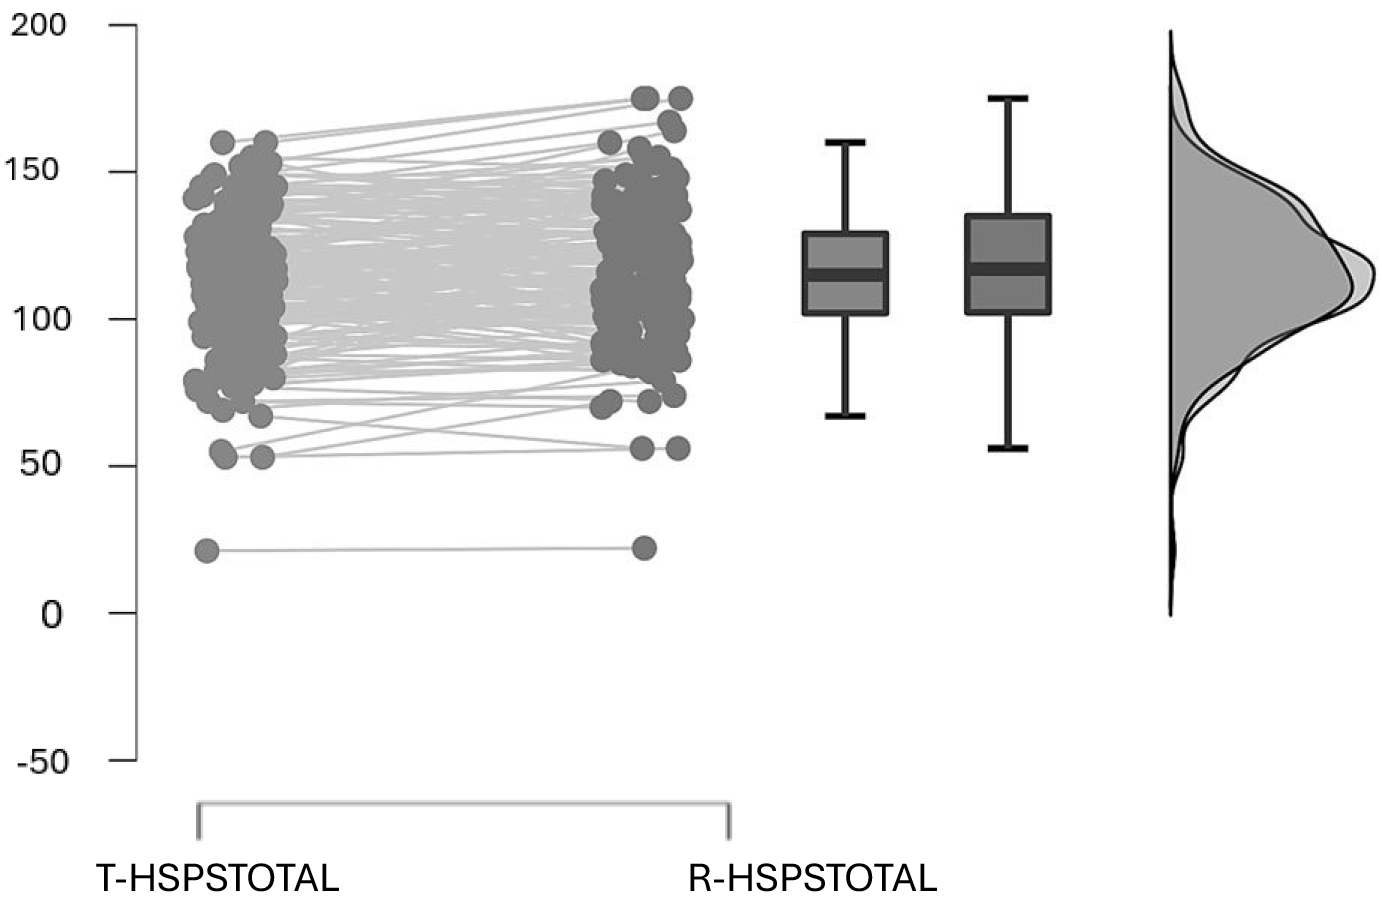 Fig. 3.
EPAS-COL test-retest application. Note: T, test; R, retest; EPAS-COL, Highly Sensitive Person Scale-Colombian version; HSPSTOTAL, Total Score Highly Sensitive Person Scale.
To obtain evidence of convergence with other variables, the Spearman-Brown
correlation was calculated (rSB) between the HSPS, APS, BIS/BAS
scales and PSS. It was hypothesised that scores on the HSPS would show a high
correlation with APS, the BIS and Perceived Stress Scale (PES). All correlations were statistically
significant and occurred in the expected direction (Table 5). Cohen’s effect size
values were used as a reference: 0.1 to 0.29 indicates a small effect, 0.3 to
0.49 indicates a medium effect, 0.5 to 0.69 indicates a large effect and
| Scales and Dimensions | HSPS’s factors | ||||
| Total | AES | LST | EOE | ||
| APS | 0.611** | 0.269** | 0.400** | 0.674** | |
| BIS/BAS | |||||
| Drive (BAS) | 0.069* | 0.197** | 0.047 | –0.013 | |
| Fun-Seeking (BAS) | 0.081* | 0.076* | 0.007 | 0.097** | |
| Reward Responsiveness (BAS) | 0.074* | 0.080* | 0.050 | 0.060* | |
| BAS Total | 0.108** | 0.182** | 0.052 | 0.061* | |
| Avoidance/Escape Motivations (BIS) | 0.381** | 0.107** | 0.271** | 0.440** | |
| BIS/BAS Total | 0.278** | 0.189** | 0.172** | 0.277** | |
| PSS | |||||
| Negative Perception of Stress (NPS) | 0.484** | 0.202** | 0.288** | 0.544** | |
| Positive Perception of Stress (PPS) | –0.184** | –0.027 | –0.070* | –0.262** | |
| PSS Total | 0.397** | 0.180** | 0.266** | 0.418** | |
Notes: HSPS, Highly Sensitive Person Scale; AES, Aesthetic Sensitivity;
LST, Low Sensory Threshold; EOE, Ease of Excitation; APS, Arousal Predisposition
Scale; BIS/BAS, Behavioural Inhibition System and Behavioural Arousal System
Scales; PSS, Perceived Stress Scale. *p
Regarding the factors of the EPAS-COL, the association of the Ease of Excitation factor with the arousal predisposition trait and with the Negative Perception of Stress dimension is noteworthy, exhibiting positive correlations with a large effect size. Finally, the Low Sensory Threshold factor showed a positive correlation with a medium effect size with the arousal predisposition trait.
This study aimed to adapt the HSPS (Aron and Aron, 1997) and examine its psychometric properties and internal structure in a sample of the Colombian population. The adaptation followed a rigorous process based on the involvement of experts and a pilot study with 50 participants, which resulted in an instrument with adequate conceptual, linguistic and cultural equivalence applicable to the Colombian population and potentially to the general Spanish-speaking population. However, in the latter case, it is essential to exercise caution until the results of studies conducted with this adaptation in other Spanish-speaking countries are known.
The internal structure of the Colombian version of the EPAS-COL was examined, along with its internal consistency and the temporal stability of the scores obtained by means of the instrument. Furthermore, evidence of its construct validity was provided by calculating the correlations between this instrument and the measures of the variables related to the arousal predisposition trait, the behavioural arousal/inhibition systems, and perceived stress.
The study provided evidence in favour of a bifactorial solution comprising 25 items, consisting of a general SPS factor along with various components of sensitivity: Low Sensory Threshold, i.e., sensitivity to subtle external stimuli; Ease of Excitation, understood as the tendency to become overwhelmed by internal and external stimuli; and Aesthetic Sensitivity, which refers to the openness or pleasure derived from aesthetic experiences and positive stimuli. These three components have been mentioned in previous studies (Listou Grimen and Diseth, 2016; Konrad and Herzberg, 2017; Pereira and Monteiro, 2020; Smolewska et al, 2006) and have also been found in child populations (Pluess et al, 2018). They measure specific and distinct aspects of the trait, while underlying a global measure of sensitivity to environmental stimuli. This confirms the notion of a construct of SPS with a robust internal structure, while also providing favourable evidence for the multidimensionality of the scale. This aligns with the bifactorial solution proposed by Lionetti et al (2018) and contrasts with the initial studies by Aron and Aron (1997), which supported the unidimensionality of the scale.
The results show good psychometric properties for the EPAS-COL. The identified bifactorial model maintained high internal consistency for both the general scale and for two of the three factors: Low Sensory Threshold and Ease of Excitation. The lowest value (although acceptable) was for Aesthetic Sensibility. These results are consistent with those obtained in studies using different versions of the HSPS with various populations (Konrad and Herzberg, 2017; Lionetti et al, 2018; May et al, 2022; Montoya-Pérez et al, 2019; Şengül-İnal and Sümer, 2020; Smolewska et al, 2006).
Regarding the item-test correlations, they ranged between very good, acceptable and weak. Only items 8 (“Do you have a rich and complex inner life?”), 15 (“When people are uncomfortable in a physical environment do you tend to know what needs to be done to make it more comfortable (like changing the lighting or the seating)?”), and 18 (“Do you make a point to avoid violent movies and TV shows?”) obtained an insufficient level of homogeneity, which aligns with other studies (Ershova et al, 2018; Konrad and Herzberg, 2017; May et al, 2022).
The test-retest analysis of the EPAS-COL, bifactorial model, revealed the stability of the scores obtained by the instrument, both in the overall index and in the three factors: Aesthetic Sensitivity, Low Sensory Threshold, and Ease of Excitation, with values in almost all cases exceeding (or being close to) 0.70.
Regarding the evidence obtained on the concurrent validity of the EPAS-COL, bifactorial model, the results showed significant associations between the high sensitivity scales, predisposition to arousal, behavioural inhibition and perceived stress, which was as expected given the common component of physiological and cognitive arousal linked to the threatening perception of environmental stimuli. In particular, the correlation of the high sensitivity scale with predisposition to arousal was high due to the characteristics of strong sensitivity and subtle information processing associated with high arousal or general excitation. Similarly, the findings of the relationship between the high sensitivity scale and the BIS/BAS scales revealed a positive association with the Behavioural Inhibition System (BIS) (avoidance/escape motivations), supporting Aron and Aron’s (1997) hypothesis that the primary role of the BIS is the processing of new stimuli, and that individuals with a high level of SPS would also have a high level of BIS functioning. It was found that the correlations of the BAS components were weak with the SPS trait, which confirms findings in the literature (Smolewska et al, 2006). Highly sensitive individuals do not appear to be engaged in the pursuit of pleasurable activities, nor do they tend to take risks or behave impulsively.
Regarding the association of the EPAS-COL with the variable of perceived stress, the correlation was positive and high with the component of negative perception of stress, which aligns with what has been reported in the literature, indicating that high sensitivity is associated with a greater perception of stress (Benham, 2006; Blach and Egger, 2014; Mateo Castillo, 2019; Redfearn et al, 2020; Stefan Lindsay, 2017; Yano et al, 2019). It should be noted that, in the study sample, 98.5% of participants reported significant stress levels (moderate and high on the PSS).
On the other hand, the dependence between the variables of sex and sensitivity was confirmed, with statistically significant differences observed between the proportions of men and women in the variable of SPS at all levels (high, moderate, and low). Similarly, the hypothesis that women reported greater sensitivity than men was supported, consistent with findings in the literature (Aron and Aron, 1997; Greven et al, 2019; Konrad and Herzberg, 2017), which would provide evidence of validity for this adaptation of the EPAS-COL. Studies have suggested that high sensitivity in women could be related to biological and psychosocial factors, in particular, to increased activity in some areas of the brain linked to sensory integration and emotion processing (Acevedo et al, 2014; Jagiellowicz et al, 2011).
A strength of this study was the inclusion of measurement instruments for different variables to obtain evidence of convergent and divergent validity of the scale. Additionally, as a novel approach, the potential association between high sensitivity and predisposition to arousal was explored, opening up this line of research, which differs from the more classical personality traits addressed in other studies, such as introversion (Aron and Aron, 1997), neuroticism, openness to experience and extroversion (Listou Grimen and Diseth, 2016). Predisposition to arousal is a variable that determines the response threshold and, in this sense, it is related to the general mobilisation of the person in response to environmental stimuli, supporting the hypothesis that the degree of hyperactivation could be linked to individual differences in sensory sensitivity.
Another notable aspect was the breadth of the study sample and the inclusion of participants from various age groups, not only young university students, as was the case in most previous studies. On the other hand, the collection of information through non-probability sampling is a limitation, as it does not guarantee the representativeness of the sample; therefore, caution must be taken in interpretation. However, this allows for comparison with previous factorial structures. Additionally, another limitation of the study was the lack of an existing instrument that measured the SPS trait in the Spanish language and that would allow for the examination of criterion-related validity through a measure of the same construct. The comparison with other conceptually relevant measures for high sensitivity (predisposition to excitation, behavioural inhibition and perceived stress) provided favourable data for this type of validity. Furthermore, both for the original version of the EPAS-COL and the EPAS-COL bifactorial model, the item-test correlations ranged from very good to acceptable; however, the level of homogeneity of the items in relation to the entire scale could be questioned. Items 8, 15 and 18 (below 0.30) are items that could be reviewed and reformulated, given that their level of homogeneity was insufficient. The difficulty may have been due to the translation or adaptation to the context, despite having been reviewed with the pilot study results.
The Colombian version of the EPAS-COL appears to be a reliable tool with evidence of validity, supported by a systematic adaptation and validation process, a robust internal structure and suitable correspondence with measures of related constructs. This makes it applicable in various fields of psychology, such as health, clinical, educational and occupational settings, among others. High sensory sensitivity, due to its characteristics, can negatively impact the well-being, physical and mental health, and quality of life of those who possess it. Therefore, having a reliable tool to identify it could help both in developing their potential and in implementing necessary actions to address its adverse effects. This work contributes to the current literature on the trait of sensitivity in sensory processing by confirming its multidimensional structure, with a clear component of general sensitivity and three specific complementary components.
The datasets used and analyzed during the current study are available from the corresponding author on reasonable request.
LMR, JLGG, and AL designed the research study. LMR collected and analyzed the data. All authors drafted and revised the manuscript. All authors read and approved the final manuscript. They have all contributed significantly to the work and agreed to be accountable for all aspects of the study.
The study was conducted in accordance with the Declaration of Helsinki. The research was approved by the Ethics Committee of the Universidad Rey Juan Carlos (January 30, 2019, approval number 0511201813118) and endorsed by the Institutional Ethics Committee of the Universidad El Bosque (Colombia). Participants were informed about the objectives, the research process, the voluntary nature and the confidentiality of the study, as well as the possibility of obtaining psychological support if required. Informed consent was obtained.
Not applicable.
This research received no external funding.
The authors declare no conflict of interest.
References
Publisher’s Note: IMR Press stays neutral with regard to jurisdictional claims in published maps and institutional affiliations.