


 , Emine Vural Yalçın 1
1 Department of Intensive Care, Ankara Etlik City Hospital, 06170 Ankara, Turkey
Abstract
Malnutrition represents a major clinical concern in geriatric populations and is strongly associated with adverse outcomes and increased mortality, particularly among patients admitted to the intensive care unit (ICU). This study aimed to compare the predictive performance of the modified Nutrition Risk in the Critically Ill (mNUTRIC) score and the Prognostic Nutritional Index (PNI) for 30-day mortality in geriatric ICU patients.
This retrospective study included 704 geriatric patients admitted to the ICU between December 2023 and June 2025 with a length of stay exceeding 24 hours. The mNUTRIC score and PNI were calculated using data obtained within the first 24 hours following ICU admission. Demographic and clinical characteristics were also evaluated and compared between groups according to these nutritional scoring systems. The primary outcome was 30-day mortality.
Of the 704 patients, 301 (42.76%) died during ICU follow-up, and 257 patients (36.51%) died within 30 days. Both the mNUTRIC score and PNI differed significantly between survivors and non-survivors (p < 0.001 for both). Patients with high mNUTRIC scores demonstrated significantly higher rates of both 30-day mortality and ICU mortality compared with those with low scores (p < 0.001 for all comparisons). Receiver operating characteristic (ROC) curve analysis showed that the mNUTRIC score had an area under the curve (AUC) of 0.753, with a cut-off value of 5.5, sensitivity of 0.743, and specificity of 0.638. In contrast, PNI demonstrated the lowest predictive performance among the evaluated scores, with an AUC of 0.624 and a cut-off value of 36.175.
Both the mNUTRIC score and PNI are useful for predicting 30-day mortality and clinical outcomes in geriatric ICU patients; however, the mNUTRIC score demonstrates superior predictive performance. Future research should further investigate their integration with established scoring systems and their utility in longitudinal trend monitoring.
Keywords
- intensive care units
- mortality
- geriatrics
- nutrition assessment
- prognostic nutritional index
In the context of global population aging, the increasing proportion of individuals aged 65 years and older represents a substantial and growing patient population in many countries [1]. This group, defined as geriatric, is characterized by increased frailty, reduced functional capacity, and a higher burden of comorbid conditions; consequently, it is associated with elevated healthcare utilization, as well as higher rates of hospitalization and mortality [2, 3]. Moreover, the coexistence of malnutrition and inflammation has been consistently associated with adverse hospital outcomes, particularly in the intensive care unit (ICU) setting [4]. Accordingly, the timely identification, continuous monitoring, and appropriate management of malnutrition and inflammatory status are essential to reduce disease-related complications, improve clinical outcomes, and optimize the utilization of ICU resources [5].
Aging is associated with progressive deterioration in tissue integrity, diminished regenerative capacity, mitochondrial dysfunction, and cellular senescence, ultimately leading to disruption of physiological homeostasis [6, 7]. These changes manifest as structural and functional impairments across multiple organ systems, resulting in reduced organ reserve and functional decline. Concurrent weakening of the immune system increases susceptibility to infections and impairs the host response to pathogens [8]. Malnutrition is a critical contributor to this process. Conditions such as decreased nutritional intake due to anorexia and dental loss, gastrointestinal dysfunction affecting absorption and motility, and inadequate protein intake contribute to the development of malnutrition and sarcopenia. These processes promote systemic inflammation and immune dysregulation, thereby contributing to adverse clinical outcomes in geriatric patients [9, 10].
Advanced age alone does not fully account for poor clinical outcomes in geriatric populations; rather, multiple interrelated factors, including reduced physiological reserve, immune dysfunction, malnutrition, multimorbidity, and polypharmacy, collectively contribute to disease burden [2, 5, 7]. These factors interact in a self-reinforcing cycle that exacerbates clinical deterioration. Loss of muscle mass is associated with increased catabolism and weakening of respiratory musculature, which may predispose patients to respiratory complications and complicate ventilator weaning in the ICU setting. In addition, impaired immune function increases vulnerability to infections and progression to sepsis [8, 10].
Nutrition plays a fundamental role in both health maintenance and the management of critically ill patients. Despite its recognized importance, malnutrition is highly prevalent among ICU patients and is associated with increased rates of complications, morbidity, and mortality [11]. Early identification and appropriate intervention are therefore essential. In this context, a variety of parameters and scoring systems have been developed to assess nutritional status and predict clinical outcomes. Commonly utilized tools include the Nutritional Risk Screening 2002 (NRS 2002), the Controlling Nutritional Status (CONUT) score, the Prognostic Nutritional Index (PNI), the Geriatric Nutritional Risk Index (GNRI), the Nutrition Risk in the Critically Ill (NUTRIC) score, the Mini Nutritional Assessment (MNA), and the modified NUTRIC (mNUTRIC) score [12, 13, 14, 15, 16].
The mNUTRIC score was specifically developed for critically ill patients and is designed to quantify the impact of nutritional risk on mortality. Unlike the original NUTRIC score, it does not incorporate interleukin-6 levels, and in contrast to the PNI, it does not include albumin measurements [17]. The PNI, calculated using serum albumin and lymphocyte counts, provides an integrated assessment of nutritional and immunological status. It has been widely used as a prognostic indicator in oncologic and surgical populations, although its applicability in critically ill patients remains less clearly defined [14, 18].
Based on these considerations, the present retrospective study aimed to evaluate the mNUTRIC score and PNI in assessing the nutritional status of geriatric patients admitted to the ICU and to determine their respective associations with clinical outcomes and 30-day mortality.
This retrospective study was conducted through the review of medical records of geriatric patients managed in the general ICU of Ankara Etlik City Hospital between 1 December 2023 and 1 June 2025. All investigators adhered to the principles of the Declaration of Helsinki and conducted the study in accordance with its ethical standards. The study protocol was reviewed and approved by the Ethics Committee of Ankara Etlik City Hospital (approval number: AEŞH-BADEK1-2025-291). Given the retrospective design, informed consent was waived by the Ankara Etlik City Hospital because all data were anonymized and no interventional procedures were performed.
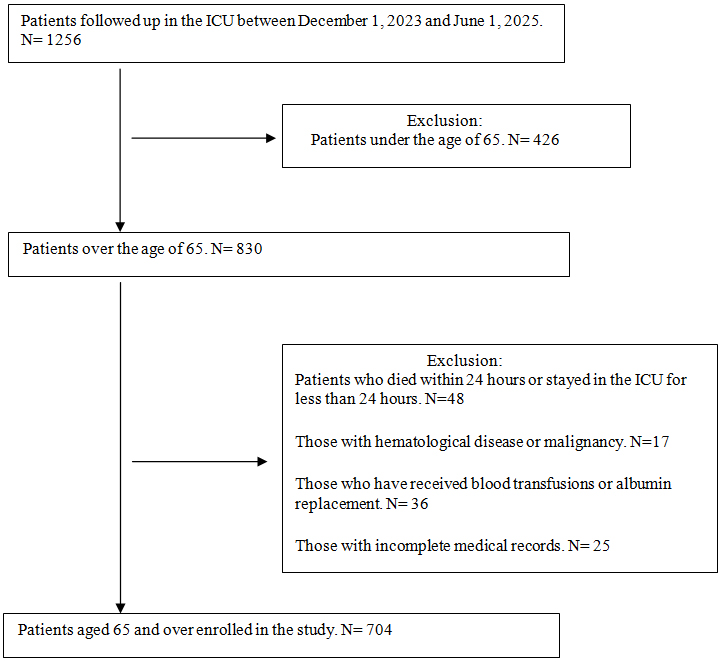
The study included geriatric patients who were followed in the ICU for more than 24 hours. Patients with an ICU stay of less than 24 hours, those younger than 65 years, and those with hematologic disorders or malignancies associated with abnormal lymphocyte counts, including acute or chronic lymphocytic leukemia, myelodysplastic or myeloproliferative syndromes, non-Hodgkin lymphoma, aplastic anemia, and immunodeficiency syndromes, were excluded. Patients with incomplete medical records were also excluded. In addition, patients who had received blood product transfusions or albumin replacement prior to ICU admission were excluded. Because PNI is calculated using albumin and lymphocyte values, albumin levels may increase following albumin or fresh frozen plasma administration, and lymphocyte counts may fluctuate after blood product transfusion; therefore, these patients were excluded to avoid distortion of calculated values. Such interventions may influence both nutritional and inflammatory status, potentially altering the patient’s true physiological condition and introducing bias in favor of PNI compared with the mNUTRIC score. During the study period, 1256 patients were admitted to the ICU. Of these, 426 were younger than 65 years. Among the remaining 830 patients, 126 were excluded based on the predefined criteria, resulting in a final study population of 704 patients (Fig. 1).
 Fig. 1.
Flowchart of the study. ICU, intensive care unit.
Nutritional risk was assessed using the mNUTRIC score and PNI. The mNUTRIC score
was calculated based on the length of hospital stay prior to ICU admission, the
Sequential Organ Failure Assessment (SOFA) score, patient age, the Acute
Physiology and Chronic Health Evaluation II (APACHE II) score, and the number of
comorbidities. The duration prior to ICU admission was defined as the number of
days between the patient’s initial presentation to the outpatient clinic,
hospital ward, or emergency department and subsequent ICU admission. The mNUTRIC
score was calculated using the most severe physiological parameters recorded
within the first 24 hours following ICU admission. Scores ranged from 0 to 9;
patients with a score of 5 or higher were classified as having high nutritional
risk, whereas those with scores below 5 were classified as having low nutritional
risk [17]. PNI was calculated at the time of admission using serum albumin and
lymphocyte values according to the following formula: PNI = albumin (g/L) + 0.005
| Variable | Range | Points |
| Age | 0 | |
| 50–74 | 1 | |
| 2 | ||
| Number of co-morbidities | 0–1 | 0 |
| 1 | ||
| Days from hospital to ICU admission | 0 | |
| 1 | ||
| SOFA score | 0 | |
| 6–9 | 1 | |
| 2 | ||
| APACHE II score | 0 | |
| 15–19 | 1 | |
| 20–28 | 2 | |
| 3 | ||
| High modified NUTRIC score: 5–9 points | ||
| Low modified NUTRIC score: 0–4 points | ||
| The PNI: serum albumin (g/L) + 0.005 | ||
Abbreviations: APACHE II, Acute Physiology and Chronic Health Evaluation II; SOFA, Sequential Organ Failure Assessment; ICU, intensive care unit; mNUTRIC, modified Nutrition Risk in the Critically Ill; PNI, Prognostic Nutritional Index.
Data regarding patient age, sex, primary diagnoses, diagnostic categories, comorbidities, laboratory findings, Glasgow Coma Scale (GCS) score, ICU length of stay, total hospital length of stay, 30-day mortality, and overall clinical outcome (survival or mortality) were obtained from patient records and the hospital information management system. Biochemical analyses, complete blood counts, and arterial blood gas measurements were performed at ICU admission. Hematologic parameters were measured using a Sysmex XN blood analyzer (Sysmex, Kobe, Japan). Laboratory variables, including hemoglobin, neutrophil count, white blood cell count, platelet count, lymphocyte count, C-reactive protein (CRP), procalcitonin, creatinine, albumin, and lactate levels, were recorded at admission. The neutrophil-to-lymphocyte ratio was calculated. The mNUTRIC score and PNI were calculated within the first 24 hours of ICU admission, along with SOFA and APACHE II scores. During follow-up, the requirement for vasopressor support, the need for invasive mechanical ventilation, the occurrence of acute kidney injury, and the use of renal replacement therapy (intermittent or continuous) were documented. The primary outcome was defined as 30-day mortality, and the secondary outcome was ICU mortality. All clinical characteristics, scores, and study parameters were compared between the two groups: survivors and non-survivors (mortality group).
The distribution of continuous variables was assessed using the
Kolmogorov-Smirnov test. Normally distributed data are presented as mean
A total of 704 geriatric patients were included in the analysis. The mean age
was 78.74
| n (%) | ||
| Gender | ||
| Male | 343 (48.72) | |
| Female | 361 (51.28) | |
| Disease groups | ||
| Neurological | 73 (10.38) | |
| Sepsis | 124 (17.61) | |
| Oncological | 14 (1.99) | |
| Respiratory | 267 (37.92) | |
| Renal/Metabolic | 41 (5.83) | |
| Gastrointestinal | 40 (5.68) | |
| Cardiovascular | 45 (6.39) | |
| Trauma | 30 (4.26) | |
| Postoperative | 70 (9.94) | |
| Number of comorbidities | ||
| 0 | 21 (2.98) | |
| 1 | 51 (7.24) | |
| 632 (89.77) | ||
| Age groups | ||
| 65–69 | 92 (13.07) | |
| 70–79 | 266 (37.78) | |
| 80–89 | 278 (39.49) | |
| 90–99 | 68 (9.66) | |
| Patient outcome | ||
| Surviving | 403 (57.24) | |
| Exitus | 301 (42.76) | |
| 30-day mortality | 257 (36.51) | |
| Invasive mechanical ventilation requirement | 338 (48.01) | |
| Requirement for vasopressors in ICU | 397 (56.39) | |
| Acute kidney injury | 353 (50.14) | |
| Requirement for dialysis and/or CRRT | 179 (25.43) | |
Abbreviations: CRRT, continuous renal replacement therapy; ICU, intensive care unit.
The median APACHE II, GCS, and SOFA scores for the overall cohort were 21
(interquartile range [IQR]: 17–26), 14 (IQR: 11–15), and 6 (IQR: 4–8),
respectively. The median ICU length of stay was 8 days (IQR: 5–14), and the
median total hospital length of stay was 17 days (IQR: 10–30). Among patients
who died within 30 days, 134 were male, and the mean age was 79.04
| Total (n = 704) | Survival group (n = 447) | 30-day mortality group (n = 257) | z score/t score/Chi2 | p value | |
| Age, years | 78.74 |
78.57 |
79.04 |
–0.8* | 0.427* |
| Gender (male) (%) | 343 (48.72) | 209 (46.76) | 134 (52.14) | 1.89** | 0.169** |
| Length of ICU stay (days) | 8 (5–14) | 7 (5–14) | 9 (5–15) | –1.93*** | 0.054*** |
| Length of hospital stay (days) | 17 (10–30) | 19 (12–36) | 14 (7–24) | –6.11*** | |
| GCS | 14 (11–15) | 14 (13–15) | 12 (9–14) | –10.08*** | |
| APACHE II score | 21 (17–26) | 19 (16–23) | 26 (21–30) | –11.25*** | |
| SOFA score | 6 (4–8) | 5 (3–7) | 8 (6–10) | –12.32*** | |
| mNUTRIC score | 6 (4–7) | 5 (4–6) | 7 (5–8) | –11.38*** | |
| PNI | 35.28 (30.95–40.15) | 36.45 (32.05–41.4) | 33.5 (29.3–37.65) | –5.48*** | |
| Creatinine mg/dL | 1.3 (0.86–2.09) | 1.18 (0.8–1.85) | 1.51 (0.99–2.56) | –4.48*** | |
| CRP mg/L | 88.27 (37.07–162.23) | 75.19 (30.69–148.82) | 107.53 (50.4–177) | –3.47*** | |
| Procalcitonin ng/mL | 0.41 (0.16–1.85) | 0.28 (0.12–0.92) | 0.94 (0.3–3.57) | –7.4*** | |
| Albumin g/L | 30.46 |
31.49 |
28.69 |
6.33* | |
| WBC |
12.02 (8.7–16.31) | 11.53 (8.34–15.81) | 13.03 (9.19–17.26) | –2.39*** | 0.017*** |
| Lymphocyte |
0.88 (0.55–1.29) | 0.91 (0.59–1.29) | 0.82 (0.47–1.3) | –1.61*** | 0.108*** |
| Hemoglobin g/dL | 10.64 |
10.76 |
10.43 |
1.8* | 0.072* |
| Thrombocytes |
223 (159–296.25) | 234 (172.5–296.5) | 211 (132–293) | –2.51*** | 0.012*** |
| Neutrophil/lymphocyte ratio | 11.47 (6.55–19.35) | 10.7 (5.95–17.54) | 13.16 (7.77–22.48) | –3.54*** | |
| Lactate mmol/L | 2.04 (1.48–2.85) | 1.86 (1.42–2.61) | 2.32 (1.74–3.24) | –5.18*** |
Abbreviations: GCS, Glasgow Coma Scale; APACHE II, Acute Physiology and Chronic Health Evaluation II;
SOFA, Sequential Organ Failure Assessment; WBC, white blood cell; CRP, C-reactive
protein; mNUTRIC score, modified Nutrition Risk in the Critically Ill score; PNI,
Prognostic Nutritional Index; Chi2, Chi-square test. Data are expressed as
median (interquartile range [IQR1–IQR3]) or mean
Comparison of nutritional indices revealed statistically significant differences
between survivors and the mortality group for both the mNUTRIC score and PNI
(p
When patients were stratified according to the mNUTRIC score, 504 patients were
classified as high risk (score
| High mNUTRIC score ( |
Low mNUTRIC score ( |
z score/t score/Chi2 | p value | |
| Age, years | 79.45 |
76.97 |
–3.96* | |
| Gender (male) (%) | 253 (50.20) | 90 (45) | 1.55** | 0.213 |
| Length of ICU stay (days) | 9 (5–16) | 6 (4–11) | –4.32*** | |
| Length of hospital stay (days) | 18 (10.75–32.25) | 16 (10–29) | –0.89*** | 0.376 |
| GCS | 13 (10–14) | 15 (14–15) | –10.49*** | |
| APACHE II score | 24 (20–28) | 15 (11–18) | –17.52*** | |
| SOFA score | 7 (5–9) | 4 (2–5) | –15.4*** | |
| PNI | 34.28 (30.04–38.59) | 38.42 (33.35–42.4) | –5.82*** | |
| Lactate mmol/L | 2.18 (1.6–3.01) | 1.71 (1.32–2.38) | –5.32*** | |
| Creatinine mg/dL | 1.48 (0.97–2.47) | 0.99 (0.75–1.34) | –7.59*** | |
| CRP mg/L | 99.66 (43.37–171.62) | 65.38 (24.18–129.97) | –3.94*** | |
| Procalcitonin ng/mL | 0.61 (0.22–2.68) | 0.2 (0.11–0.59) | –7.75*** | |
| Albumin g/L | 29.71 |
32.38 |
5.63* | |
| WBC |
12.52 (8.8–16.73) | 11.28 (8.55–15.04) | –2*** | 0.046 |
| Lymphocyte |
0.89 (0.54–1.28) | 0.87 (0.58–1.3) | –0.63*** | 0.532 |
| Hemoglobin g/dL | 10.48 |
11.03 |
2.87* | 0.004 |
| Thrombocytes |
217 (145.75–288.5) | 244 (180.5–309.25) | –3.4*** | 0.001 |
| Neutrophil/lymphocyte ratio | 12.22 (7.13–20.14) | 9.91 (5.18–16.77) | –3.02*** | 0.003 |
| Invasive mechanical ventilator requirement n (%) | 303 (60.1) | 35 (17.5) | 104.19** | |
| Requirement for vasopressors in ICU n (%) | 345 (68.5) | 52 (26) | 104.93** | |
| Acute kidney injury n (%) | 307 (60.9) | 46 (23) | 82.32** | |
| Requirement for dialysis and/or CRRT n (%) | 173 (34.3) | 6 (3) | 74.1** | |
| 30-day mortality n (%) | 234 (46.4) | 23 (11.5) | 75.36** | |
| Intensive care mortality n (%) | 274 (54.4) | 27 (13.5) | 97.69** |
Abbreviations: APACHE II, Acute Physiology and Chronic Health Evaluation II;
SOFA, Sequential Organ Failure Assessment; WBC, white blood cell; CRP, C-reactive
protein; mNUTRIC score, modified Nutrition Risk in the Critically Ill score; PNI,
Prognostic Nutritional Index; CRRT, continuous renal replacement therapy; ICU,
intensive care unit; Chi2, Chi-square test. Data are expressed as median
(interquartile range [IQR1–IQR3]) or mean
Receiver operating characteristic curve analysis demonstrated that the SOFA
score had the highest discriminative performance, with an AUC of 0.777. The
optimal cut-off value was 5.5, with a sensitivity of 0.821 and a specificity of
0.597. The APACHE II score showed the next highest performance, with an AUC of
0.754 and a cut-off value of 20.5. The mNUTRIC score demonstrated comparable
predictive ability, with an AUC of 0.753, a cut-off value of 5.5, a sensitivity
of 0.743, and a specificity of 0.638. In contrast, PNI exhibited the lowest
predictive performance, with an AUC of 0.624 and a cut-off value of 36.175, along
with the lowest sensitivity and specificity values among the evaluated scores.
Comparative ROC analysis using the DeLong test indicated that the mNUTRIC score
had a significantly higher AUC for predicting 30-day mortality than PNI (0.753
vs. 0.624; difference = 0.129; 95% confidence interval [CI]:
0.077–0.181, Z = 4.89; p
| AUC | Cut-off value | Sensitivity | Specificity | 95% CI | Youden index | p value | |
| Glasgow Coma Scale | 0.723 | 13.50 | 0.696 | 0.640 | 0.685–0.761 | 0.336 | |
| APACHE II score | 0.754 | 20.50 | 0.809 | 0.617 | 0.717–0.791 | 0.427 | |
| SOFA score | 0.777 | 5.50 | 0.821 | 0.597 | 0.742–0.812 | 0.418 | |
| mNUTRIC score | 0.753 | 5.50 | 0.743 | 0.638 | 0.718–0.789 | 0.381 | |
| PNI | 0.624 | 36.175 | 0.677 | 0.528 | 0.581–0.666 | 0.205 |
Abbreviations: ROC, receiver operating characteristic; AUC, area under the curve; APACHE II, Acute Physiology and Chronic Health Evaluation II; SOFA, Sequential Organ Failure Assessment; PNI, Prognostic Nutritional Index; mNUTRIC score, modified Nutrition Risk in the Critically Ill score; CI, confidence interval.
Univariate logistic regression and Cox proportional hazards analyses were
performed to identify predictors of 30-day mortality. The mNUTRIC score was
significantly associated with mortality (odds ratio [OR] = 1.887, 95% CI:
1.676–2.124, p
| Univariate logistic regression analysis | Cox regression analysis | ||||||
| OR | 95% CI | p value | HR | 95% CI | p value | C-index | |
| SOFA score | 1.464 | 1.368–1.566 | 1.250 | 1.200–1.300 | 0.714 | ||
| mNUTRIC score | 1.887 | 1.676–2.124 | 1.332 | 1.234–1.452 | 0.656 | ||
| GCS | 0.768 | 0.724–0.815 | 0.933 | 0.900–0.967 | 0.600 | ||
| APACHE II score | 1.144 | 1.114–1.175 | 1.067 | 1.049–1.086 | 0.670 | ||
| PNI | 0.941 | 0.919–0.965 | 0.963 | 0.945–0.982 | 0.591 | ||
| Lactate | 1.249 | 1.132–1.377 | 1.097 | 1.047–1.150 | 0.599 | ||
| Creatinine | 1.245 | 1.107–1.402 | 1.144 | 1.053–1.242 | 0.579 | ||
| Albumin | 0.915 | 0.889–0.942 | 0.941 | 0.920–0.963 | 0.616 | ||
Abbreviations: APACHE II, Acute Physiology and Chronic Health Evaluation II; SOFA, Sequential Organ Failure Assessment; GCS, Glasgow Coma Scale; PNI, Prognostic Nutritional Index; mNUTRIC score, Modified Nutrition Risk in the Critically Ill score; CI, confidence interval; OR, odds ratio; HR, hazard ratio; C-index, Concordance index.
In multivariate Cox regression analysis. Among the scoring systems, SOFA (HR = 1.079, 95% CI: 1.024–1.137, p = 0.004) and APACHE II (HR = 1.023, 95% CI: 1.003–1.044, p = 0.021) remained independently associated with mortality. Although mNUTRIC and PNI were significant in univariate analyses, they were not independently associated with mortality in the multivariate model (HR = 1.051, p = 0.295; HR = 0.993, p = 0.533, respectively). Results are summarized in Table 7.
| Hazard ratio | 95% CI (lower bound-upper bound) | p value | VIF | |
| Albumin | 0.963 | 0.943–0.982 | 3.055 | |
| SOFA Score | 1.079 | 1.024–1.137 | 0.004 | 2.955 |
| APACHE II | 1.023 | 1.003–1.044 | 0.021 | 2.909 |
| Lactate | 1.052 | 1.000–1.106 | 0.048 | 1.078 |
| mNUTRIC Score | 1.051 | 0.957–1.154 | 0.295 | 3.363 |
| PNI | 0.993 | 0.974–1.013 | 0.533 | 2.988 |
| GCS | 1.025 | 0.985–1.067 | 0.215 | 1.871 |
| Creatinine | 1.016 | 0.926–1.114 | 0.731 | 1.426 |
Abbreviations: APACHE II, Acute Physiology and Chronic Health Evaluation II; SOFA, Sequential Organ Failure Assessment; GCS, Glasgow Coma Scale; PNI, Prognostic Nutritional Index; mNUTRIC score, modified Nutrition Risk in the Critically Ill score; IMV, invasive mechanical ventilation; CRP, C-reactive protein; RRT, renal replacement therapy; CI, confidence interval; VIF, variance inflation factor.
Receiver operating characteristic curves are illustrated in Fig. 2. Kaplan-Meier
survival analyses based on nutritional risk demonstrated that patients with high
mNUTRIC scores and those with PNI values below the cut-off of 36.175 had
significantly higher 30-day mortality (p
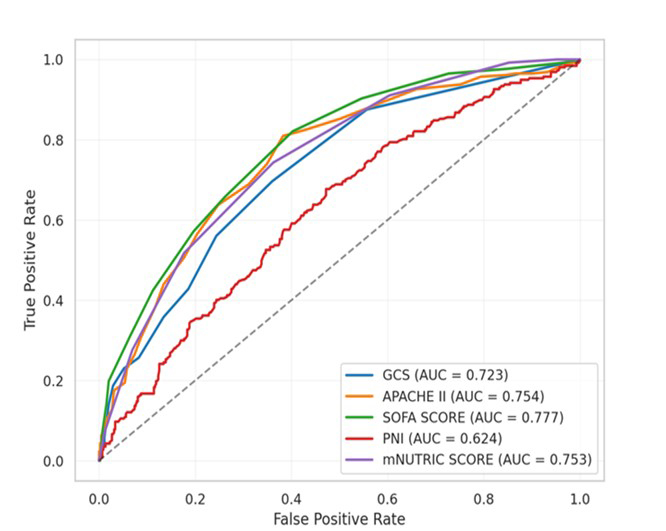 Fig. 2.
Receiver operating characteristic (ROC) curve of scoring systems for predicting mortality. Abbreviations: AUC, area under the curve; APACHE II, Acute Physiology and Chronic Health Evaluation II; SOFA, Sequential Organ Failure Assessment; GCS, Glasgow Coma Scale; mNUTRIC score, modified Nutrition Risk in the Critically Ill score; PNI, Prognostic Nutritional Index.
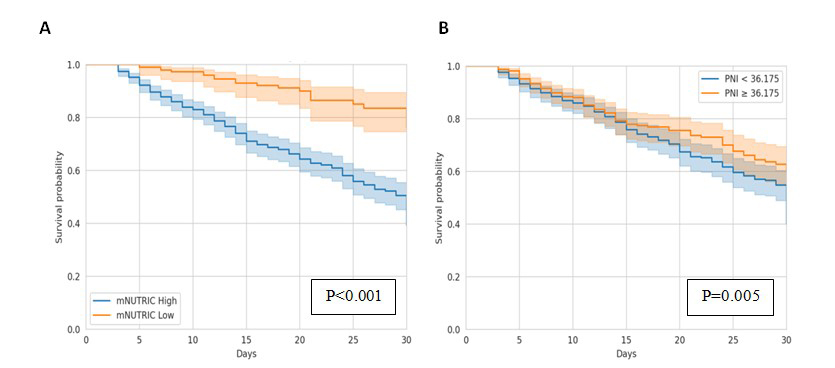 Fig. 3.
Kaplan-Meier survival analyses for modified Nutrition Risk in the Critically Ill (mNUTRIC) score and Prognostic Nutritional Index (PNI). (A) Kaplan-Meier curve showing 30-day mortality according to mNUTRIC score values. (B) Kaplan-Meier curve showing 30-day mortality according to PNI values.
In the present study, the mNUTRIC score and PNI were evaluated to determine the
predictive value of nutritional risk in geriatric patients admitted to the ICU,
with a specific focus on 30-day mortality and associated clinical outcomes. Both
the mNUTRIC score and PNI were found to be significant predictors of 30-day
mortality; however, the mNUTRIC score demonstrated superior discriminative
performance. Notably, patients with an mNUTRIC score of
The evaluation of malnutrition in critically ill patients extends beyond nutritional intake alone and necessitates comprehensive consideration of underlying inflammatory and catabolic processes. This interplay is particularly pronounced in geriatric populations, in whom physiological reserve is diminished, and vulnerability to metabolic stress is increased [19]. Malnutrition driven by inflammatory cytokine activity, together with inflammation exacerbated by inadequate nutritional status, establishes a self-perpetuating cycle that contributes to increased morbidity and mortality in critically ill patients [20]. In addition, the assessment of nutritional status in geriatric ICU patients is further complicated by the limited reliability of anthropometric measures and challenges in neurological evaluation, as well as the influence of systemic inflammation, infection, and organ dysfunction on laboratory parameters. These limitations have led to the development of structured scoring systems designed to more accurately characterize nutritional risk [21].
Although the mNUTRIC score, as introduced by Rahman and colleagues, does not incorporate conventional nutritional parameters, it has demonstrated substantial clinical utility by integrating indicators of both disease severity and nutritional risk in critically ill populations [17]. A key distinction from the original NUTRIC score is the exclusion of interleukin 6, a biomarker that is not routinely measured in many clinical settings, including the present ICU [15, 17]. For this reason, the mNUTRIC score was selected for use in this study. Its prognostic relevance has been evaluated extensively and compared with other scoring systems in recent years [16, 21, 22]. In a study of septic patients, Toscano and colleagues identified the mNUTRIC score as a strong predictor of mortality, reporting an AUC of 0.814 and a cut-off value of 4.5 [23].
Similarly, Kollu and colleagues [21] evaluated 153 ICU patients aged
In the present cohort, patients with high mNUTRIC scores demonstrated significantly greater requirements for invasive mechanical ventilation and vasopressor support, as well as a higher incidence of acute kidney injury, compared with those with lower scores. Despite the increased severity of illness and higher mortality rates observed in this group, no significant difference was identified in total hospital length of stay. This finding may be attributable to the elevated baseline severity of illness and anticipated mortality risk in patients with high mNUTRIC scores, who may experience earlier mortality, thereby limiting the duration of hospitalization. Conversely, patients with lower mNUTRIC scores, although exhibiting lower mortality rates, may require prolonged ICU and post-ICU care due to comorbid conditions and ongoing treatment needs, including transfer to step-down or palliative care units, which may contribute to longer overall hospital stays.
Especially following the Coronavirus Disease 2019 (COVID-19) pandemic, the
mNUTRIC score has been extensively evaluated across diverse disease groups, most
notably among patients with COVID-19, with particular emphasis on its prognostic
utility in critically ill populations managed in intensive care settings. A
consistent finding across studies is that elevated mNUTRIC scores are associated
with adverse clinical outcomes and increased mortality; however, variability
exists regarding the optimal threshold values. Yildirim and colleagues [25], in a
cohort of 397 critically ill COVID-19 patients, identified a cut-off value of 4,
with a sensitivity of 0.77 and a specificity of 0.74. Leoni and colleagues [26],
in a study conducted in Italy, determined a cut-off value of 5 in COVID-19
patients, corresponding to the highest Youden index. Hai and colleagues [27]
compared the mNUTRIC score with conventional scoring systems, including APACHE II
and SOFA, in patients with sepsis and reported comparable AUC values of 0.79,
0.78, and 0.77, respectively, with a cut-off value of 5 for the mNUTRIC score. In
the present study, which included a larger cohort of patients aged
Park and colleagues [28] provided an alternative perspective by evaluating
nutritional status and mNUTRIC scores at different time points during
hospitalization. Their findings demonstrated that elevated mNUTRIC scores during
the recovery phase, rather than during the acute inflammatory phase, were
associated with increased 28-day mortality. They proposed that distinct
pathophysiological mechanisms characterize the acute and recovery phases,
necessitating different nutritional strategies and highlighting the importance of
timing in mNUTRIC score assessment [28]. In the present study, the mNUTRIC score
was calculated within the first 24 hours of ICU admission. Wang and colleagues
[29] further reported that the mNUTRIC score exhibits strong predictive
performance for mortality in patients aged
PNI is derived from serum albumin and lymphocyte levels and reflects both immune
function and the interplay between inflammation and nutritional status [30].
Although initially applied predominantly in oncological populations, its
prognostic relevance has since been investigated across a wide range of clinical
conditions [31, 32, 33]. Li and colleagues [31] conducted a retrospective analysis of
two independent hospital cohorts of patients with colorectal cancer and
demonstrated that a lower preoperative PNI, with a cut-off value of 48.65, was
associated with reduced overall and progression-free survival. Wang and
colleagues [34] followed 3351 patients with hip fractures over a 22-year period
and reported that patients with a PNI
In the present study, the mNUTRIC score and PNI were evaluated alongside conventional ICU scoring systems to assess the relationship between nutritional status and clinical outcomes in geriatric patients. The selection of these indices was guided by their applicability in critically ill populations and their ability to capture both nutritional and immunological dimensions of patient status. Conditions that could confound anthropometric assessment, including cachexia, edema, and obesity, which are prevalent in geriatric populations, were excluded to minimize bias. Furthermore, the retrospective design enabled the use of objective, routinely available clinical and laboratory data, without reliance on parameters requiring direct measurement. Data related to appetite, detailed longitudinal weight loss, dietary patterns, and anthropometric measurements, such as arm and calf circumference, were not consistently available and therefore could not be incorporated. Consequently, the mNUTRIC score and PNI were selected as the most appropriate tools for this analysis compared with other nutritional scoring systems. Compared with existing literature, the present study includes a relatively large patient cohort, which enhances the robustness and generalizability of the findings. The focus on a geriatric population may account for differences in observed results, potentially reflecting the higher burden of comorbidities and postoperative conditions in this group. In the present analysis, the mNUTRIC score demonstrated an AUC of 0.753 with a cut-off value of 5.5, whereas PNI showed an AUC of 0.624 with a cut-off value of 36.175. Kaplan-Meier analysis revealed a statistically significant difference in survival between groups stratified by PNI (p = 0.005); however, the relatively modest AUC value indicates limited predictive performance. These findings are not contradictory; rather, they suggest that although PNI is associated with mortality, its discriminative capacity is weaker than that of the mNUTRIC score.
Although PNI demonstrated a statistically significant association with 30-day mortality in the present study, its predictive performance was comparatively limited relative to the mNUTRIC score in both ROC and regression analyses. In logistic regression analysis, the odds ratio for the mNUTRIC score was 1.887, whereas the odds ratio for PNI was 0.941. The integration of the mNUTRIC score with established severity indices, such as APACHE II and SOFA, together with its incorporation of patient age and comorbidity burden, may contribute to its superior performance in geriatric populations. In contrast, PNI relies on lymphocyte and albumin levels, both of which are susceptible to fluctuation in the context of systemic inflammation, infection, and acute physiological stress, particularly in critically ill and elderly patients. Consequently, its discriminatory and predictive capacity may be attenuated under such conditions, as observed in the present study.
In a study of 478 geriatric patients with pneumonia examining the relationship
between frailty and mortality, Eraslan Doganay and colleagues [37] reported that
frailty indices, comorbidity scores, APACHE II, and SOFA scores were all
associated with mortality and the need for non-invasive and invasive mechanical
ventilation. Consistent with the present findings, the 28-day mortality group
exhibited higher APACHE II and SOFA scores. While univariate logistic regression
demonstrated significant associations between these scores and 28-day mortality,
multivariate analysis identified an increase in SOFA score (odds ratio = 2.452,
p
A central consideration in the present study is the distinction between indices reflecting acute physiological severity and those capturing baseline nutritional and immunological reserve. APACHE II and SOFA scores primarily reflect acute illness severity and organ dysfunction, whereas the mNUTRIC score and PNI provide insight into nutritional risk and underlying physiological reserve. In the context of critically ill geriatric patients, mortality is influenced not only by baseline nutritional status but also by age, comorbidities, and the extent of organ failure. Accordingly, scoring systems such as SOFA, which directly quantify organ dysfunction and inflammatory burden, and APACHE II, which incorporates age and disease severity, remain highly effective for predicting acute clinical deterioration and short-term mortality [27]. The stronger performance of these indices relative to mNUTRIC and PNI in the present study suggests that acute physiological derangement and organ failure may play a more immediate role in mortality than nutritional status alone. Given that APACHE II and SOFA components are incorporated within the mNUTRIC score, this integration likely contributes to its prognostic relevance and its superiority over PNI.
Because PNI is derived exclusively from albumin and lymphocyte values, it is inherently influenced by factors such as systemic inflammation, fluid status, and acute-phase responses, which may limit its ability to capture the complexity of organ dysfunction. Albumin, as a negative acute-phase reactant, may decrease in inflammatory states independent of nutritional status, while lymphocyte counts may fluctuate in response to stress and immunological changes, particularly in geriatric populations [31]. As a result, PNI may more accurately reflect chronic physiological reserve rather than acute disease severity. In clinical practice, it may therefore be more informative when used alongside other scoring systems to identify patients who may benefit from intensified nutritional and metabolic support, rather than as a standalone predictor of short-term mortality [18]. In the present study, the DeLong test further demonstrated the comparatively lower discriminative performance of PNI relative to the mNUTRIC score and other indices. Although the mNUTRIC score showed a significant association with 30-day mortality, its effect was attenuated in multivariate analysis, suggesting that its predictive contribution is partly mediated through components shared with APACHE II and SOFA. While mNUTRIC retained significance in univariate analysis, its independent effect diminished after adjustment for other variables, reflecting the dominant influence of acute physiological parameters in mortality prediction.
In the present study, the mNUTRIC score demonstrated superior performance
compared with PNI in predicting 30-day mortality among geriatric patients.
Notably, patients with mNUTRIC scores
Several limitations should be acknowledged. Although the sample size was not limited, the single-center and retrospective design may have introduced selection and information bias. In addition, heterogeneity among patient subgroups may have influenced the observed outcomes. mNUTRIC and PNI values were derived from data obtained within the first 24 hours of ICU admission, and measurements at subsequent time points were not available; therefore, temporal trend analysis could not be performed. Larger, multicenter, prospective studies involving more homogeneous patient populations are warranted to further validate and extend these findings.
The present study demonstrates that the mNUTRIC score provides superior predictive performance relative to PNI for 30-day mortality in geriatric patients. Its association with APACHE II and SOFA scores underscores the combined importance of nutritional risk and acute physiological severity in mortality prediction. Early identification of patients with elevated mNUTRIC scores may facilitate the implementation of timely, individualized, and intensive nutritional support strategies. In this context, prognostic scoring systems serve not only as indicators of mortality risk but also as practical tools to inform clinical management. Such an approach may contribute to mitigating sarcopenia and frailty following intensive care, thereby supporting improvements in functional capacity and overall quality of life. Future research should extend beyond baseline assessment to incorporate longitudinal evaluation of score dynamics throughout hospitalization and explore the integrated use of multiple scoring systems.
• Malnutrition is common in geriatric patients and is closely associated with adverse clinical outcomes and mortality.
• Identification of the nutritional and inflammatory status of geriatric patients may facilitate improved clinical outcomes through early intervention.
• The mNUTRIC score and PNI are practical tools, as they are easy to calculate using routinely available parameters and do not require additional costs.
• A high mNUTRIC score is an effective predictor of 30-day mortality in geriatric intensive care patients.
All data included in this study are available from the corresponding author upon reasonable request.
BK designed the research study and wrote the first draft. BK and EVY performed the research. BK and EVY analyzed the data. Both authors contributed to the important editorial changes in the manuscript. Both authors read and approved the final manuscript. Both authors have participated sufficiently in the work and agreed to be accountable for all aspects of the work.
The study protocol was reviewed and approved by the Ethics Committee of Ankara Etlik City Hospital (approval number: AEŞH-BADEK1-2025-291). All procedures were carried out in accordance with the principles of the Declaration of Helsinki, and all investigators confirmed adherence to these ethical standards. Informed consent was waived by the Ankara Etlik City Hospital because all data were anonymized and no interventional procedures were performed.
Not applicable.
This research received no external funding.
The authors declare no conflicts of interest.
References
Publisher’s Note: IMR Press stays neutral with regard to jurisdictional claims in published maps and institutional affiliations.