


1 Department of Rehabilitation Medicine, Shanghai Tianyou Hospital, 200331 Shanghai, China
Abstract
Knee hyperextension during walking is a common clinical concern in stroke patients that worsens lower limb dysfunction and reduces quality of life. This condition is commonly managed through repetitive transcranial magnetic stimulation (rTMS) and lower limb rehabilitation robots. This study aims to explore the therapeutic effect of combining rTMS with lower limb rehabilitation robots on knee hyperextension in stroke patients.
This retrospective study included 158 stroke patients who underwent rehabilitation treatment in the Department of Rehabilitation Medicine, Shanghai Tianyou Hospital between January 2024 and May 2025. Based on the treatment, the patients were divided into a rTMS group, a lower limb rehabilitation robot (UGO) group, and a repetitive transcranial magnetic stimulation combined with lower limb rehabilitation robot (rTMS+UGO) group. Brunnstrom staging and knee hyperextension angle were applied to evaluate lower limb motor recovery and knee joint alignment. The lower limb motor function was assessed with the Fugl-Meyer Assessment for Lower Extremity (FMA-LE) score, and balance was examined using the Berg balance scales. The modified Barthel Index (MBI) was used to evaluate activities of daily living. Quadriceps and hamstring co-contraction patterns were assessed using surface electromyography and isokinetic muscle strength testing.
After 4 weeks of treatment, the Brunnstrom stage, FMA-LE, Berg score, and MBI score were significantly higher in all three groups compared with before treatment (p < 0.05). The therapeutic effect in the combined-treatment (rTMS+UGO) group was significantly better than that observed in the rTMS and UGO groups (p < 0.05). The knee hyperextension angle decreased over time in all three groups. However, after 4 weeks, the knee hyperextension angle was significantly lower in the rTMS+UGO group than in the rTMS and UGO groups (p < 0.05). Isokinetic muscle strength testing showed that, after 4 weeks of treatment, peak torque (PT), peak torque relative to body weight (PT/W), and total work (TW) during knee extension were significantly higher in all three groups (p < 0.05), with the greatest improvement observed in the combined-treatment group (p < 0.05). Surface electromyography findings showed that average electromyographic (AEMG) of the affected vastus medialis and rectus femoris was higher (p < 0.05) whereas AEMG of the affected hamstring muscles and gastrocnemius was substantially lower after treatment in the three groups (p < 0.05). Additionally, these therapeutic effects were more pronounced in the combined-treatment group than in the other two groups (p < 0.05).
Both rTMS and lower limb rehabilitation robotics can reduce knee hyperextension in stroke patients with hemiplegia to a certain extent. However, their combination demonstrates a more pronounced therapeutic effect, substantially improving lower limb motor function and enhancing the stability of the knee joint.
Keywords
- stroke
- knee hyperextension
- transcranial magnetic stimulation
- robot
- clinical effectiveness
The incidence of knee hyperextension after stroke is reported to be 40–68% [1]. It is typically manifested as excessive knee hyperextension during the support phase of the gait cycle [2]. This abnormal pattern not only accelerates degenerative alterations in the knee joint but may also induce compensatory gait, repeated falls, and significant impairment in the recovery of lower limb motor function. The underlying mechanisms may be related to the dysfunction of knee flexion and extension muscles, proprioception impairment, and early initiation of standing and walking activities [3].
Existing therapeutic interventions include traditional physical therapy, orthotic devices, and traditional Chinese rehabilitation strategies. Although these approaches can provide short-term symptom relief, the rehabilitation evaluation tools with both high validity and reliability are still lacking in clinical practice. Consequently, patients remain highly dependent on passive treatment, and the imbalance between central nervous system injury and peripheral muscle regulation is often disregarded. Therefore, there is an urgent need for reliable synergistic approaches that promote both cerebral nerve plasticity and restore biomechanical balance around the knee joint.
Repetitive transcranial magnetic stimulation (rTMS) is a critical modality for
improving lower limb motor function after stroke [4]. Its core mechanism involves
modulating interhemispheric suppression by either inhibiting cortical
excitability in the unaffected hemisphere or improving excitability in the
affected hemisphere, thereby restoring balance between the cerebral hemispheres
and exerting a therapeutic effect [5]. Evidence demonstrates that rTMS can
modulate the excitability of
The lower limb rehabilitation robots can reduce knee hyperextension after stroke
through various mechanisms. In the central nervous system, combined rTMS and
robot-assisted training effectively promote synaptic plasticity and
At present, most studies have focused on general lower limb motor recovery and gait training after stroke [12, 13, 14], while evidence regarding the specific effect of combining rTMS with a lower limb rehabilitation robot on knee hyperextension remains unclear. Therefore, this study retrospectively assessed whether a combination of repetitive transcranial magnetic stimulation with robotic lower limb rehabilitation offers superior improvement in knee hyperextension after stroke, intending to guide future clinical applications.
This retrospective study enrolled 1263 patients with unilateral lower limb hemiplegia secondary to acute stroke who underwent rehabilitation in the Department of Rehabilitation Medicine, Shanghai Tianyou Hospital, China, between January 2024 and May 2025. Based on the rehabilitation modality, patients were divided into a repetitive transcranial magnetic stimulation (rTMS) group, a lower limb rehabilitation robot (UGO) group, and a repetitive transcranial magnetic stimulation combined with lower limb rehabilitation robot (rTMS+UGO) group.
Inclusion criteria for patient selection were as follows: (1) diagnosis
consistent with established stroke criteria [15], with unilateral limb hemiplegia
and confirmed by neuroimaging; (2) clinically stable, with a disease course
between 2 weeks and 1 year; (3) hemiplegic clinical phenotype with lower limb
Brunnstrom stage I–V; (4) modified ashworth scale (MAS) score
However, individuals were excluded from the study cohort if they had (1) progressive stroke or subarachnoid hemorrhage; (2) severe systemic diseases within the past year, such as organ failure (heart, lung, liver, kidney), active infection, diabetes, or inadequately controlled hypertension; (3) severe hip and knee osteoarthritis, lower limb joint diseases, rheumatoid arthritis, ischemic femoral head necrosis, or other conditions affecting body movement or posture control; (4) history of primary or secondary epilepsy; (5) severe cognitive dysfunction; (6) history of metal implants such as pacemakers, cardiac or intracranial stents, or other implanted devices; (7) long-term use of therapeutics that affect neuro-excitability (such as antidepressants and antiepileptic drugs); and (8) history of undergone knee surgery or severe ligament injury.
Following these predetermined inclusion-exclusion criteria, a total of 158 patients were included in this retrospective study (Fig. 1).
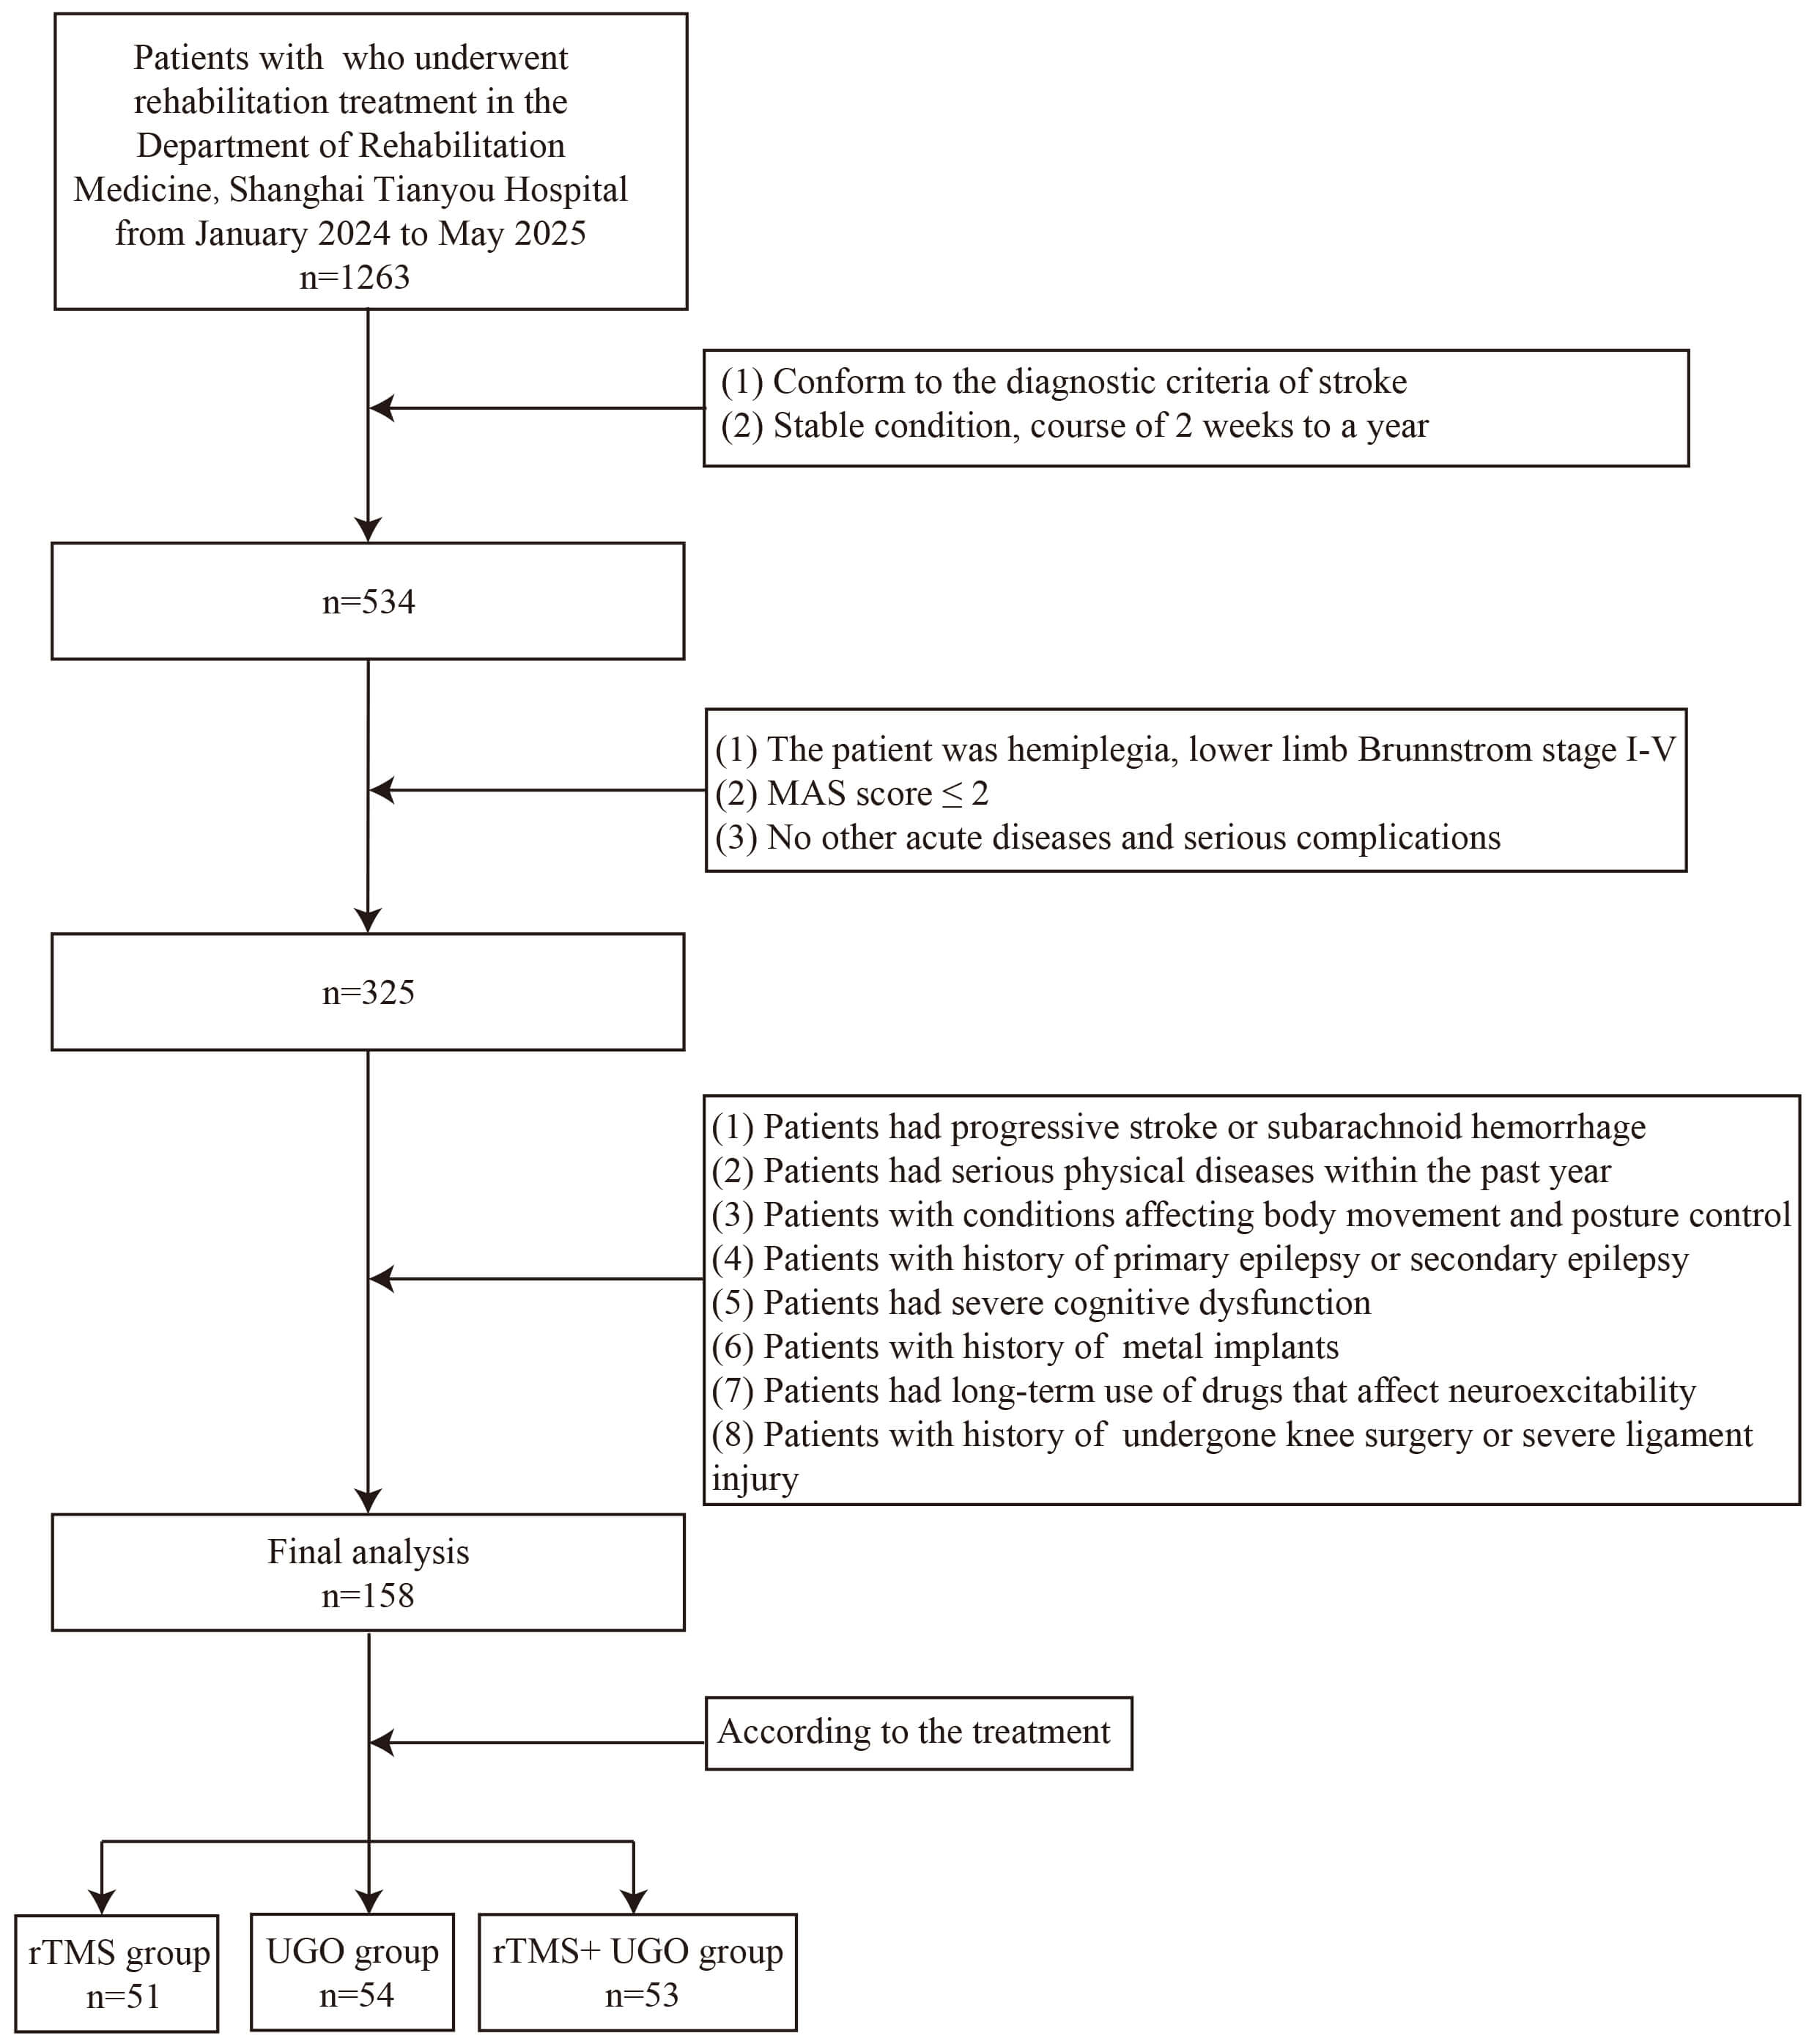 Fig. 1.
A flow chart of the study participant selection. rTMS, repetitive transcranial magnetic stimulation; UGO, lower limb rehabilitation robot; rTMS+UGO, repetitive transcranial magnetic stimulation combined with lower limb rehabilitation robot; MAS, modified ashworth scale.
According to the treatment received, study participants (n = 158) were divided into three groups: rTMS, lower limb rehabilitation robot (UGO), and rTMS+UGO groups. All patients received routine comprehensive rehabilitation which included: (1) Muscle stretching training: using an ankle correction plate to stretch the affected lower limbs; (2) Strength and muscle endurance training of knee flexor and extensor muscles; (3) Knee control training: knee extension control training in supine position and knee flexion control training in prone position within a 0°–30° range; (4) Single-leg weight-bearing, balance training, wall squat exercises, gait training, stairs climbing practice; (5) Proprioception training: improving sensory input using Rood therapy.
All these interventions were performed once daily, 6 days a week, over 4 weeks.
Experimental-group-specific interventions were performed as follows:
(a) rTMS group: In addition to standard rehabilitation, the rTMS group was treated with navigated rTMS once daily. A repetitive transcranial magnetic stimulator (OSF-4/T, Wuhan Oseff Medical Company, Wuhan, China) was used. We used a monopulse TMS with an “8” shaped coil to stimulate the M1 leg region. Resting motor threshold (RMT) was determined by gradually reducing the intensity of stimulation until a motor evoked potential of at least 50 µV amplitude was elicited in the relaxed tibialis anterior muscle on the unaffected side in at least 5 out of 10 trials [16]. During treatment, the patient sat wearing a positioning cap, and the “8” shaped coil was placed over the lower limb motor cortex representative area on the healthy hemisphere. The stimulation parameters were as follows: frequency 1 Hz, intensity 80% RMT, stimulation time 15 seconds, inter-training interval 10 seconds, and a total of 1395 pulses per session. Treatment was administered once a day, 5 days a week, for 4 consecutive weeks.
(b) UGO group: Based on routine rehabilitation, patients in the UGO group received gait training with the UGO lower limb rehabilitation robot (Hangzhou Chengtian Technology Development Co., Ltd., Hangzhou, China). The robot is equipped with a fixed belt for the patient’s waist that can provide 0–50 kg of dynamic body-weight support while allowing free pelvic movement. Before training, the therapist transferred the patient to a robot chair, measured the length of both thighs, calves, and lower limbs, and fitted a weight-support vest and connecting straps. The robot was adjusted to the sitting position, and the length of the thigh and calf were adjusted to match the patient so that the hip and knee joints aligned with the robot’s corresponding joints. The patient’s torso, thigh, and feet were then fixed to the device.
The robot was activated to bring the patient to standing, followed by 1–2 minutes of walking under body-weight support. After examining all the equipment, the therapist selected a passive or active mode based on the patient’s functional status. Passive mode was applied when the patient was unable to overcome gravity to actively extend the knee or when significant fatigue or poor attention prevented high-quality active movement. If the patient could generate certain active movement, the mode was switched to active as soon as they were able to push the leg under weight support. Subsequently, the robot was lowered so that the feet touched the ground, and walking training began. Each training session lasted 20 minutes, 5 times per week, for 4 weeks. They were monitored continuously; if substantial discomfort was reported, training was stopped immediately, the patient’s condition was evaluated, the reason was analyzed, and the training plan was adjusted accordingly.
(c) The UGO+rTMS group: In this group, patients were treated with rTMS once daily in addition to routine rehabilitation, applying the same procedure as in the rTMS group. After a 30-minute interval, UGO training was conducted for 20 minutes using the same protocols as in the UGO group. Training was conducted 5 times per week, for a total of 4 weeks.
All patients were evaluated by an independent therapist, blinded to group allocation and did not participate in the treatment delivery, at baseline, two weeks after the start of treatment, and again at four weeks. The primary evaluation indicators were as follows.
(a) Brunnstrom scale: The Brunnstrom scale was used to evaluate muscle tension, joint movement, and the ability to perform independent movement. The comprehensive score ranges from stage I to VI [17].
• Stage I: No voluntary movement is observed.
• Stage II: Only minimal, involuntary or synergistic movements appear.
• Stage III: Coordinated flexion of the hip, knee, and ankle can be elicited in both sitting and standing positions.
• Stage IV: In the sitting position, the patient can flex the knee more than 90° so that the foot slides under the chair, and can perform ankle dorsiflexion without lifting heel off the ground.
• Stage V: In the leg-strengthening position, the affected limb can first flex the knee and then extend the hip; with the knee extended and body weight shifted to the unaffected leg, ankle dorsiflexion can be performed.
• Stage VI: In the standing position, the hip can be abducted beyond the range achievable by lifting the ipsilateral pelvis; in sitting, the knee can be extended while the lower limb performs internal and external rotation, allowing combined inversion and eversion movements of the foot.
(b) Fugl-Meyer Assessment for Lower Extremity (FMA-LE) score: The FMA-LE score was used to evaluate the recovery of lower limb motor function [18]. The scale has a total of 34 points, with higher scores indicating better lower limb motor function.
(c) Modified Barthel Index (MBI): The MBI was used to evaluate the patient’s independence in daily life activities [19]. The total score ranges from 0 to 100 points, with higher scores indicating greater functional independence.
(d) Berg balance function scale: The Berg balance scales were used to evaluate the balance performance of patients [20]. The maximum possible score was 56 points, with higher scores reflecting better balance ability.
Knee hyperextension angle measurement: Knee hyperextension was recorded using a disc goniometer. A normal range is considered to be 0° to 5°. A value exceeding 5° was defined as hyperextension, with a larger angle indicating more severe deformity [21].
Surface electromyography: The average electromyographic (AEMG) of the vastus medialis, rectus femoris, hamstrings, and gastrocnemius of both the affected and unaffected sides was measured using an electromyography evoked potential system (NDI-094, Suzhou Haishen Medical Device Associates Co., Ltd., Suzhou, China) at room temperature. Patients were seated with both hips and knees flexed and the ankles fixed in a neutral 90° position. After routine skin preparation with alcohol, electrodes were placed over each target muscle (vastus medialis, rectus femoris, hamstring, and gastrocnemius). Surface electromyography signals were acquired with the NDI-094 instrument. The conductive area of each electrode was 0.5 cm in diameter, with an inter-electrode distance of 2 cm, and the electrodes were aligned parallel to the muscle.
During testing, surface electromyography signals were recorded while patients stood up without assistance and maintained a stable standing posture for 5 seconds, sitting down independently, performing maximum bilateral knee extension and flexion efforts, and maintaining each for five seconds. Patients were instructed to alternate between relaxed states and maximal voluntary isometric contraction (MVIC), and surface electromyography signals were recorded in both conditions. Each operation was repeated three times, and the AEMG during MVIC was calculated from these repetitions, with the average of the three trials used for analysis.
Isokinetic muscle strength testing: The peak torque (PT), peak torque relative to body weight (PT/W), and total work (TW) of the affected knee were evaluated using an A8 isokinetic excitation testing system (Guangzhou Yikang, Guangzhou, China). During testing, patients were seated with the length of the seat and the backrest adjusted so that the thigh lay flat on the seat, and the back was in full contact with the backrest. The backrest angle was set to a comfortable position, ensuring alignment between the dynamometer axis and the anatomical axis of knee joint rotation. The trunk was stabilized with a seat belt and shoulder harness, and the proximal thigh of the tested limb was fixed with a nylon strap. The resistance pad connected to the dynamometer lever arm was positioned 3 cm above the medial malleolus of the affected leg, with the dynamometer axis aligned horizontally with the lateral femoral condyle. Before testing, the knee joint and ankle joint were passively mobilized to minimize the risk of injury, followed by three low-resistance preheating training sessions. The isokinetic dynamometer was set to an angular velocity of 60°/s. Patients were then instructed to extend and flex the knee joint with the maximum force, performing 5 repetitions per set for 3 sets, and the average value was used for analysis.
Adverse event assessment: Throughout the treatment period and after interventions, all adverse events were systematically monitored and recorded. Adverse reactions, such as spasm, fatigue, and rTMS-related headache, were recorded in both groups of patients.
Statistical analyses were conducted using SPSS version 27.0 (IBM Corp., Armonk,
NY, USA). The Shapiro-Wilk was used to assess the normality of data distribution.
Measurement data conforming to a normal distribution were expressed as mean
Categorical variables were expressed as frequencies and percentages (%). When
the number of cases exceeded 5, the
The median age of patients was 58 (53, 64) years in the rTMS group, 61 (54, 66)
years in the UGO group, and 60 (56, 60) years in the rTMS+UGO group, with no
significant age difference observed among the three groups (p
| rTMS (n = 51) | UGO (n = 54) | rTMS+UGO (n = 53) | H/ |
p-value | ||
| Gender | 0.426 | 0.808 | ||||
| Male (n, %) | 33 (64.71) | 33 (61.11) | 31 (58.49) | |||
| Female (n, %) | 18 (35.29) | 21 (38.89) | 22 (41.51) | |||
| Age [years, M (Q1, Q3)] | 58 (53, 64) | 61 (54, 66) | 60 (56, 60) | 1.425 | 0.491 | |
| Time since the stroke [months, M (Q1, Q3)] | 4 (2, 5) | 4 (2, 5) | 4 (2, 7) | 3.871 | 0.144 | |
| Stroke type | 2.318 | 0.314 | ||||
| Infarction (n, %) | 29 (56.86) | 25 (46.30) | 32 (60.38) | |||
| Hemorrhage (n, %) | 22 (43.14) | 29 (53.70) | 21 (39.62) | |||
| Paretic side | 1.489 | 0.475 | ||||
| Right (n, %) | 28 (54.90) | 28 (51.85) | 23 (43.40) | |||
| Left (n, %) | 23 (45.10) | 26 (48.15) | 30 (56.60) | |||
| Hypertension | 0.620 | 0.733 | ||||
| Without (n, %) | 17 (33.33) | 22 (40.74) | 20 (37.74) | |||
| With (n, %) | 34 (66.67) | 32 (59.26) | 33 (62.26) | |||
| Diabetes | 1.507 | 0.471 | ||||
| Without (n, %) | 22 (43.14) | 28 (51.85) | 29 (54.72) | |||
| With (n, %) | 29 (56.86) | 26 (48.15) | 24 (45.28) | |||
| Hyperlipidemia | 1.278 | 0.528 | ||||
| Without (n, %) | 44 (86.27) | 42 (77.78) | 43 (81.13) | |||
| With (n, %) | 7 (13.73) | 12 (22.22) | 10 (18.87) | |||
| Cardiac disease | 4.627 | 0.099 | ||||
| Without (n, %) | 49 (96.08) | 48 (88.89) | 44 (83.02) | |||
| With (n, %) | 2 (3.92) | 6 (11.11) | 9 (16.98) | |||
M, median.
The changes in Brunnstrom staging in the three groups before and after treatment
are presented in Table 2. There was no significant difference in Brunnstrom
staging among the groups before or after 2 weeks of treatment. However, by week
4, the rTMS+UGO group demonstrated a significant improvement over the rTMS group
(p
| Time | Stage | rTMS (n = 51) | UGO (n = 54) | rTMS+UGO (n = 53) | p-value | |
| Before the treatment | II | 30 (58.82) | 33 (61.11) | 31 (58.49) | / | 0.742 |
| III | 17 (33.33) | 20 (37.04) | 19 (35.85) | |||
| IV | 4 (7.84) | 1 (1.85) | 3 (5.66) | |||
| 2 weeks after the treatment | II | 20 (39.22)a | 23 (42.59)a | 13 (24.53)a | 5.884 | 0.208 |
| III | 21 (41.18) | 22 (40.74) | 32 (60.38)a | |||
| IV | 10 (19.61)a | 9 (16.67)a | 8 (15.09)a | |||
| 4 weeks after the treatment | II | 7 (13.73)a,b | 8 (14.81)a,b | 0 (0.00)a,b,c,d | / | 0.013 |
| III | 23 (45.10) | 25 (46.30) | 18 (33.96)a,b | |||
| IV | 15 (29.41)a,b | 16 (29.63)a,b | 27 (50.94)a,b,c | |||
| V | 6 (11.76)a,b | 5 (9.26)a,b | 8 (15.09)a,b | |||
| GEE analysis results | ||||||
| Time effect: Wald |
||||||
| Group effect: Wald |
||||||
| Time |
||||||
Note: Since there were 3 comparisons, the corrected significance level is
The lower limb FMA-LE scores for the three groups at each assessment point are
summarized in Table 3. Before treatment, there were no significant differences in
FMA-LE score among the groups (p
| Time | rTMS (n = 51) | UGO (n = 54) | rTMS+UGO (n = 53) |
| Before the treatment | 16.98 |
17.02 |
16.32 |
| 2 weeks after the treatment | 22.02 |
22.83 |
25.21 |
| 4 weeks after the treatment | 24.29 |
24.37 |
26.23 |
| Repeated measures ANOVA | |||
| Time effect: F = 511.149, p | |||
| Group effect: F = 3.897, p = 0.022 | |||
| Time | |||
FMA-LE, Fugl-Meyer Assessment for Lower Extremity; ANOVA, analysis of variance;
SD, standard deviation. a: p
The changes in balance function among the three groups over time are presented
in Table 4. Before treatment, there was no significant difference in the Berg
scores among the three groups (p
| Time | rTMS (n = 51) | UGO (n = 54) | rTMS+UGO (n = 53) |
| Before the treatment | 12.45 |
11.15 |
12.12 |
| 2 weeks after the treatment | 25.24 |
24.20 |
31.60 |
| 4 weeks after the treatment | 36.76 |
34.15 |
40.89 |
| Repeated measures ANOVA | |||
| Time effect: F = 858.145, p | |||
| Group effect: F = 24.478, p | |||
| Time | |||
a: p
As shown in Table 5, in the baseline, the knee hyperextension angle did not
differ among the three groups (p
| Time | rTMS (n = 51) | UGO (n = 54) | rTMS+UGO (n = 53) |
| Before the treatment | 13.00 |
13.24 |
13.68 |
| 2 weeks after the treatment | 10.02 |
10.41 |
9.21 |
| 4 weeks after the treatment | 6.39 |
6.17 |
3.60 |
| Repeated measures ANOVA | |||
| Time effect: F = 495.044, p | |||
| Group effect: F = 3.927, p = 0.022 | |||
| Time | |||
a: p
Activities of daily living were assessed using the MBI score (Table 6). There
was no significant difference in baseline MBI scores among the three groups
(p
| Time | rTMS (n = 51) | UGO (n = 54) | rTMS+UGO (n = 53) |
| Before the treatment | 45.65 |
45.24 |
45.43 |
| 2 weeks after the treatment | 58.88 |
58.06 |
61.58 |
| 4 weeks after the treatment | 69.45 |
69.30 |
75.89 |
| Repeated measures ANOVA | |||
| Time effect: F = 727.850, p | |||
| Group effect: F = 4.804, p = 0.009 | |||
| Time | |||
MBI, modified Barthel Index; a: p
Table 7 shows that, before treatment, there were no significant differences in
PT, PT/W, and TW for knee extension among the three groups (p
| Time | rTMS (n = 51) | UGO (n = 54) | rTMS+UGO (n = 53) | |
| PT (Nm) | Before the treatment | 19.47 |
18.83 |
17.53 |
| 2 weeks after the treatment | 20.28 |
19.18 |
25.72 | |
| 4 weeks after the treatment | 21.04 |
20.37 |
28.95 | |
| Repeated measures ANOVA | ||||
| Time effect: F = 271.591, p | ||||
| Group effect: F = 5.778, p = 0.004 | ||||
| Time | ||||
| Time | rTMS (n = 51) | UGO (n = 54) | rTMS+UGO (n = 53) | |
| PT/W (Nm/kg) | Before the treatment | 0.35 |
0.35 |
0.36 |
| 2 weeks after the treatment | 0.51 |
0.49 |
0.53 | |
| 4 weeks after the treatment | 0.56 |
0.56 |
0.68 | |
| Repeated measures ANOVA | ||||
| Time effect: F = 172.662, p | ||||
| Group effect: F = 3.263, p = 0.041 | ||||
| Time | ||||
| Time | rTMS (n = 51) | UGO (n = 54) | rTMS+UGO (n = 53) | |
| TW (J) | Before the treatment | 13.48 |
12.81 |
14.01 |
| 2 weeks after the treatment | 16.48 |
15.49 |
18.92 | |
| 4 weeks after the treatment | 17.40 |
17.91 |
21.80 | |
| Repeated measures ANOVA | ||||
| Time effect: F = 642.075, p | ||||
| Group effect: F = 3.899, p = 0.022 | ||||
| Time | ||||
PT, peak torque; PT/W, peak torque relative to body weight; TW, total work; a:
p
Table 8 shows that, at baseline, there were no significant differences in PT,
PT/W, and TW for knee joint flexion among the three groups (p
| Time | rTMS (n = 51) | UGO (n = 54) | rTMS+UGO (n = 53) | |
| PT (Nm) | Before the treatment | 13.57 |
12.53 |
13.20 |
| 2 weeks after the treatment | 14.34 |
14.11 |
14.29 | |
| 4 weeks after the treatment | 15.86 |
15.93 |
16.40 | |
| Repeated measures ANOVA | ||||
| Time effect: F = 24.082, p | ||||
| Group effect: F = 0.178, p = 0.837 | ||||
| Time | ||||
| Time | rTMS (n = 51) | UGO (n = 54) | rTMS+UGO (n = 53) | |
| PT/W (Nm/kg) | Before the treatment | 0.17 |
0.16 |
0.16 |
| 2 weeks after the treatment | 0.18 |
0.19 |
0.18 | |
| 4 weeks after the treatment | 0.19 |
0.19 |
0.19 | |
| Repeated measures ANOVA | ||||
| Time effect: F = 23.971, p | ||||
| Group effect: F = 0.168, p = 0.845 | ||||
| Time | ||||
| Time | rTMS (n = 51) | UGO (n = 54) | rTMS+UGO (n = 53) | |
| TW (J) | Before the treatment | 6.79 |
7.07 |
6.77 |
| 2 weeks after the treatment | 7.80 |
7.48 |
7.05 | |
| 4 weeks after the treatment | 8.75 |
8.58 |
9.14 | |
| Repeated measures ANOVA | ||||
| Time effect: F = 41.832, p | ||||
| Group effect: F = 0.036, p = 0.965 | ||||
| Time | ||||
PT, peak torque; PT/W, peak torque relative to body weight; TW, total work; a:
p
The changes in AEMG of the vastus medialis, rectus femoris, hamstring, and
gastrocnemius before and after treatment in the three groups are summarized in
Table 9. Before treatment, there were no significant differences in AEMG values
of the affected-side muscles among the three groups (p
| Time | rTMS (n = 51) | UGO (n = 54) | rTMS+UGO (n = 53) | |
| VM | Before the treatment | 30.75 |
30.37 |
30.14 |
| 2 weeks after the treatment | 34.87 |
35.28 |
35.33 | |
| 4 weeks after the treatment | 39.60 |
40.29 |
49.62 | |
| Repeated measures ANOVA | ||||
| Time effect: F = 160.276, p | ||||
| Group effect: F = 4.776, p = 0.010 | ||||
| Time | ||||
| Time | rTMS (n = 51) | UGO (n = 54) | rTMS+UGO (n = 53) | |
| RF | Before the treatment | 13.51 |
12.95 |
13.63 |
| 2 weeks after the treatment | 18.83 |
18.38 |
20.13 | |
| 4 weeks after the treatment | 19.10 |
19.71 |
24.81 | |
| Repeated measures ANOVA | ||||
| Time effect: F = 178.919, p | ||||
| Group effect: F = 3.975, p = 0.021 | ||||
| Time | ||||
| Time | rTMS (n = 51) | UGO (n = 54) | rTMS+UGO (n = 53) | |
| Hamstrings | Before the treatment | 31.06 |
31.03 |
31.52 |
| 2 weeks after the treatment | 23.59 |
22.61 |
23.26 | |
| 4 weeks after the treatment | 19.17 |
19.64 |
12.79 | |
| Repeated measures ANOVA | ||||
| Time effect: F = 622.943, p | ||||
| Group effect: F = 3.579, p = 0.030 | ||||
| Time | ||||
| Time | rTMS (n = 51) | UGO (n = 54) | rTMS+UGO (n = 53) | |
| Gastrocnemius | Before the treatment | 29.95 |
30.45 |
31.16 |
| 2 weeks after the treatment | 27.57 |
28.17 |
26.04 | |
| 4 weeks after the treatment | 25.86 |
26.90 |
23.93 | |
| Repeated measures ANOVA | ||||
| Time effect: F = 24.671, p | ||||
| Group effect: F = 4.079, p = 0.019 | ||||
| Time | ||||
VM, vastus medialis; RF, rectus femoris; a: p
Furthermore, there was a marked group effect for the affected-side muscle
(p
In the rTMS group, 4 individuals experienced adverse events, including 1 with
increased spasticity, 1 with fatigue, and 2 with rTMS-related headache. In the
UGO group, 3 patients reported adverse reactions, including 2 with elevated
spasticity (spasm aggravation) and 1 with fatigue. Furthermore, 2 patients
developed adverse events in the rTMS+UGO group (1 with spasticity (spasm
aggravation)) and 1 with rTMS-related headache. However, the overall rate of adverse events did
not differ substantially among all three groups (p
| rTMS (n = 51) | UGO (n = 54) | rTMS+UGO (n = 53) | p-value | ||
| Total | / | 0.886 | |||
| Spasticity | 1 (1.96) | 2 (3.70) | 1 (1.89) | ||
| Fatigue | 1 (1.96) | 1 (1.85) | 0 (0.00) | ||
| rTMS-related headaches | 2 (3.92) | 0 (0.00) | 1 (1.89) |
Patients after stroke commonly exhibit abnormal gait patterns and impaired posture control, with knee joint hyperextension being a frequent manifestation. Knee joint hyperextension can lead to gait instability and an increased risk of falls, thereby limiting activities of daily living. Conventional rehabilitation approaches, including muscle strengthening, balance training, and functional exercises, have only minimal efficacy in reconstructing knee hyperextension and are often unable to achieve satisfactory long-term outcomes. Therefore, there is an urgent need to investigate and develop more effective rehabilitation methods for this clinical condition.
Through comparative analysis, this study found that, compared to rTMS or a lower limb rehabilitation robot used alone, the integration of rTMS with a lower limb rehabilitation robot more effectively enhanced knee hyperextension gait in stroke patients. After systematic rehabilitation, the lower limb motor function, balance ability, activities of daily living, active knee range of motion, and lower limb muscle function were significantly improved in all three groups compared with baseline (before interventions). However, across all these functional domains, the degree of improvement was substantially greater in the combined-treatment group than in the group receiving only rTMS or a lower limb robotic rehabilitation.
During walking, stroke patients often experience difficulty in achieving coordinated movement of the lower limb joints and muscles, which impairs balance and posture control, resulting in walking difficulties and an increased risk of falls. In this study, lower limb motor function and balance improved substantially after training. A possible explanation is that the lower limb rehabilitation robot used here activates proprioceptive afferent pathways through targeted multi-joint stimulation (pelvis, hip, knee, ankle), promoting neural integration of sensory feedback and motor output and supporting remodeling of the sensory-motor loop [22]. By providing accurate, repetitive gait training, the lower limb rehabilitation robot can significantly increase muscle strength and simultaneously improve motor control and posture balance ability, thereby enhancing overall motor performance in stroke patients [23, 24, 25], which is consistent with the results of this study.
Furthermore, compared with normal posture, knee hyperextension is primarily manifested as reduced activation of the agonist muscles, while the antagonistic and posterior chain muscles become overactive to compensate for joint stability. In this study, during knee extension, PT, PT/W, and TW in the rTMS+UGO group were significantly higher than in the rTMS group and the UGO group, indicating that the combined intervention program exerted a more pronounced, muscle-specific effect on the knee extension muscles in the context of knee hyperextension.
There was no significant difference in PT, PT/W, and TW among the three groups during knee flexion, which may be due to compensatory changes in neuromuscular control strategies. Using surface electromyography and isokinetic muscle strength testing, this study objectively evaluated the effect of rTMS combined with UGO on post-stroke knee hyperextension. After treatment, AEMG of the vastus medialis and rectus femoris increased over time, and the AEMG of the hamstring and gastrocnemius decreased, indicating a significant improvement in peri-knee muscle balance. These changes were more pronounced in the rTMS+UGO group, suggesting a superior therapeutic effect compared with either rTMS or UGO.
In this study, the rTMS group demonstrated significant improvement in balance and motor function after treatment compared with baseline (before treatment), reflecting that rTMS can improve both postural control and lower limb motor function in stroke patients. The therapeutic effect of rTMS is mainly frequency-dependent: low-frequency stimulation of the hemisphere contralateral to the lesion decreases cortical excitability, whereas high-frequency stimulation of the ipsilateral hemisphere increases cortical excitability [26, 27].
Based on the interhemispheric imbalance model, this study used low-frequency rTMS to the contralateral hemisphere to inhibit its abnormally increased excitability, thereby relatively improving excitability in the contralateral premotor and primary motor cortices. This modulation of cortical activity enhances motor center control and ultimately improves balance and motor performance. The results are consistent with those reported by Krogh et al. [28]. Most stroke patients experience gait difficulty due to impaired standing balance, decreased muscle strength, and abnormal timing of muscle contraction. Asymmetric loading with excessive weight-bearing on the unaffected limb further limits mobility and restricts functional restoration. Huo et al. [25] reported that the application of a unilateral lower extremity exoskeleton rehabilitation robot for overground gait training is an effective approach to promote neuroplasticity and clinical improvement in patients with subacute stroke. Similarly, Giovannini et al. [29] confirmed that traditional treatment combined with a lower limb robotic rehabilitation significantly improves balance, fatigue, quality of life, and motor function compared with traditional treatment alone, which is consistent with our findings. Therefore, these observations indicated that a combination of rTMS with a lower limb rehabilitation robot may synergistically promote motor function remodeling through central neuromodulation and peripheral reinforcement.
Recovery of lower limb motor function after stroke depends on neural plasticity. Low-frequency repetitive transcranial magnetic stimulation modulates the balance and motor centers by targeting the contralateral M1 area, thereby improving balance and motor function. However, evidence suggests that rTMS may not induce sufficient physiological changes in the brain to support skill acquisition. Instead, rTMS is anticipated to create a transient state of increased learning capability, during which repeated rehabilitation training can significantly enhance functional outcomes [30].
In our study, rTMS was combined with lower limb robotic rehabilitation to enhance the impact of the intervention through cortical modulation. This design supported a bidirectional interaction between central control and peripheral feedback output. The combined-treatment group demonstrated significantly greater improvement in outcome parameters than either the rTMS or UGO groups alone, underscoring the clinical significance of this synergistic modality and indicating its suitability for broader clinical utility.
Despite encouraging outcomes, we acknowledge several limitations that should be considered while interpreting these findings. First, this study included patients 1 year after stroke onset, which may limit the generalizability of the results and does not fully reflect the therapeutic effects in patients with different types or severity levels. Second, this study focused on short-term efficacy and safety, with a 4-week intervention period and no follow-up evaluations. Therefore, the results show only the immediate effect of the combined regimen and do not elucidate the long-term sustainability of its efficacy. Additionally, the specific underlying mechanisms of the combined treatment were not further assessed. When rTMS and lower limb rehabilitation robots were combined, the specific molecular and neurophysiological mechanisms involved in neural function remodeling during rTMS and robotic lower limb rehabilitation remain unclear. Future investigation should incorporate functional magnetic resonance imaging (fMRI) or electroencephalography (EEG) to explore the neural remodeling mechanisms. Moreover, the optimal temporal relationship between rTMS and behavioral training has yet to be verified and should be assessed by directly comparing different intervention schemes in subsequent studies.
In summary, combining rTMS with a lower limb rehabilitation robot exerts a significant therapeutic effect on lower limb motor function in stroke patients. Over a 4-week treatment period, this combined strategy effectively improved lower limb motor function, balance ability, muscle function, and knee hyperextension gait. By combining cortical excitability regulation with exoskeleton-assisted, task-specific gait training, the combined approach creates a positive feedback loop that accelerates neuromuscular reorganization and significantly improves functional recovery of the lower limb during the rehabilitation process. The combined treatment regimen shows high safety and feasibility and exhibits clear advantages over traditional intervention alone. With further investigation and ongoing technological advances, rTMS combined with lower limb rehabilitation robot treatment is expected to provide greater therapeutic effect for stroke rehabilitation and contribute significantly to enhancing the quality of life.
• Knee hyperextension during walking is a frequent clinical concern in stroke patients that worsens lower limb dysfunction and reduces quality of life.
• Combined rTMS and lower limb rehabilitation robot therapy effectively improves Brunnstrom stage, lower limb motor performance, balance ability, and muscle function in stroke patients, demonstrating better therapeutic effects than either intervention alone.
• By combining cortical excitability modulation with exoskeleton-assisted, task-specific gait training, the combined approach forms a positive feedback loop that accelerates neuromuscular remodeling and significantly enhances functional recovery during the treatment period.
The data analyzed in this study are available from the corresponding author upon reasonable request.
BHW, XYZ and QT conceived the study. YMW, XC, YL, and YYW collected the clinical data. XYZ, SC, YYW and ZHZ performed the research. BHW, XYZ and QT drafted the manuscript. All authors contributed to revising the manuscript critically for important intellectual content. All authors read and approved the final manuscript. All authors have participated sufficiently in the work and agreed to be accountable for all aspects of the work.
This study was approved by the Ethics Committee of Shanghai Tianyou Hospital (No. 2025-007), and all procedures complied with the Declaration of Helsinki. This study only analyzed existing treatments, complications, and basic clinical data, and strict privacy protection measures were in place. The research results do not alter current treatment protocols, do not involve commercial interests, pose no risk of infringement, and do not infringe upon the rights or interests of the participants. Based on these factors, the Ethics Committee of Shanghai Tianyou Hospital granted an exemption from the requirement for informed consent.
Not applicable.
This research received no external funding.
The authors declare no conflict of interest.
References
Publisher’s Note: IMR Press stays neutral with regard to jurisdictional claims in published maps and institutional affiliations.