


1 Department of Neurology, Shangyu People’s Hospital of Shaoxing, 312300 Shaoxing, Zhejiang, China
Abstract
Early neurological deterioration (END) after thrombolysis is a serious complication in acute ischemic stroke (AIS); however, its early identification remains challenging. This study aimed to investigate the value of amplitude-integrated electroencephalography (aEEG) combined with CD4+/CD8+ ratio in assessing END in patients with AIS.
The study enrolled 210 AIS patients who underwent thrombolysis at Shangyu People’s Hospital of Shaoxing, China, between May 2020 and May 2025. Based on whether the National Institutes of Health Stroke Scale (NIHSS) score at 24 hours post-thrombolysis increased by ≥4 points compared to the score at admission, patients were divided into an END group (score increase ≥4, n = 61) and a non-END group (score increase <4, n = 149). Clinical data were compared between the two groups. The receiver operating characteristic (ROC) curve was used to analyze the diagnostic value of the aEEG score and CD4+/CD8+ ratio, both individually and in combination, for END after thrombolysis. Multivariate logistic regression analysis was performed to identify factors influencing END post-thrombolysis. Furthermore, two predictive models were constructed and their predictive efficacy evaluated: Model 1 (excluding aEEG score and CD4+/CD8+ ratio) and Model 2 (including aEEG score and CD4+/CD8+ ratio).
The onset-to-needle time in the END group was significantly longer than in the non-END group. NIHSS score at admission, white blood cell count (WBC), Systemic Inflammation Response Index (SIRI), and aEEG score were significantly higher in the END group, while the CD4+/CD8+ ratio was significantly lower (p < 0.001). The area under the ROC curve (AUC) was 0.755 for the aEEG score, 0.776 for the CD4+/CD8+ ratio alone, and 0.862 for their combination. Multivariate logistic regression analysis showed that prolonged onset-to-needle time, higher NIHSS score at admission, increased WBC count, elevated SIRI, and higher aEEG score were independent risk factors for END after thrombolysis, with an increased CD4+/CD8+ ratio serving as a protective factor (p < 0.05). Both Model 1 and Model 2 demonstrated good goodness-of-fit (p = 0.856 and 0.997, respectively), with AUCs of 0.944 and 0.991. In Model 2, the variance inflation factor (VIF) for all six influencing factors ranged from 1.070 to 1.383.
The aEEG score and the CD4+/CD8+ ratio have a significant influence on the occurrence of END in AIS patients after thrombolysis, and their combination improves predictive performance.
Keywords
- acute ischemic stroke
- thrombolytic therapy
- disease progression
- electroencephalography
- CD4/CD8 ratio
- diagnosis
Acute ischemic stroke (AIS) is one of the leading causes of death and long-term disability worldwide [1]. Intravenous thrombolytic therapy is a key ultra-early treatment for AIS, and the application of recombinant tissue plasminogen activator has significantly improved the prognostic outcomes [2]. Despite these advances, early neurological deterioration (END) after thrombolysis remains a major clinical concern, occurring in about 10%–30% of patients, and is strongly associated with poor functional prognosis and increased mortality [3, 4]. The mechanisms underlying END pathogenesis are complex and involve a variety of pathophysiological processes, including reperfusion injury, recurrent thrombosis, hemorrhagic transformation, and the inflammatory responses [5, 6].
In recent years, the role of neuroelectrophysiological measures and immune-inflammatory indicators has received increasing interest in stroke evaluation. Amplitude-integrated electroencephalography (aEEG), a convenient approach for continuous monitoring of brain function, can sensitively reflect the functional status of the cortex and is particularly valuable for evaluating disorders of consciousness and predicting neurological prognosis [7]. Additionally, the CD4+/CD8+ T-cell ratio, a crucial indicator of immune status, has been linked to post-stroke inflammatory responses and recovery of neurological function [8, 9].
Studies indicate that abnormal aEEG patterns are closely associated with the immune-inflammatory responses, contributing to the pathology of END [10, 11]. However, most existing predictive models for END rely heavily on clinical scores (such as the National Institutes of Health Stroke Scale [NIHSS]) and neuroimaging findings [12, 13]. While valuable, these approaches may not fully capture the dynamic interplay between neuroelectrophysiological dysfunction and systemic immune inflammation. Although inflammatory markers such as the Systemic Inflammation Response Index (SIRI) and neutrophil-to-lymphocyte ratio have been associated with stroke prognosis [14], their integration with neurofunctional monitoring tools like aEEG remains underexplored. Integrating aEEG, which directly and continuously reflects cortical functional integrity, with the CD4+/CD8+ ratio, a key indicator of immune homeostasis and T-cell-mediated regulation, may provide a more holistic and pathophysiologically informed framework for risk stratification in END.
We hypothesized that this integrated approach would capture complementary aspects of END pathogenesis, such as real-time neuronal excitability and the systemic inflammatory-immune balance. Therefore, the purpose of this study was to evaluate whether integrating aEEG scores with the CD4+/CD8+ ratio offers incremental diagnostic value beyond established risk factors for END after thrombolysis, thereby supporting earlier and more accurate identification of high-risk patients for individualized interventions.
This study enrolled 210 AIS patients who underwent thrombolytic therapy at
Shangyu People’s Hospital of Shaoxing, China, between May 2020 and May 2025.
Inclusion criteria for patient selection were as follows: (1) diagnosis of AIS
based on established criteria [15], confirmed by cranial imaging examination; (2)
who received alteplase thrombolytic therapy after admission, with
onset-to-thrombolysis time less than 4.5 h; (3) age
This study adhered to the principles of the Declaration of Helsinki and was approved by the Ethics Committee of Shangyu People’s Hospital of Shaoxing (SYRY-REC-2024-A010). All patients provided written informed consent. A flowchart of the study design and participant selection is illustrated in Fig. 1.
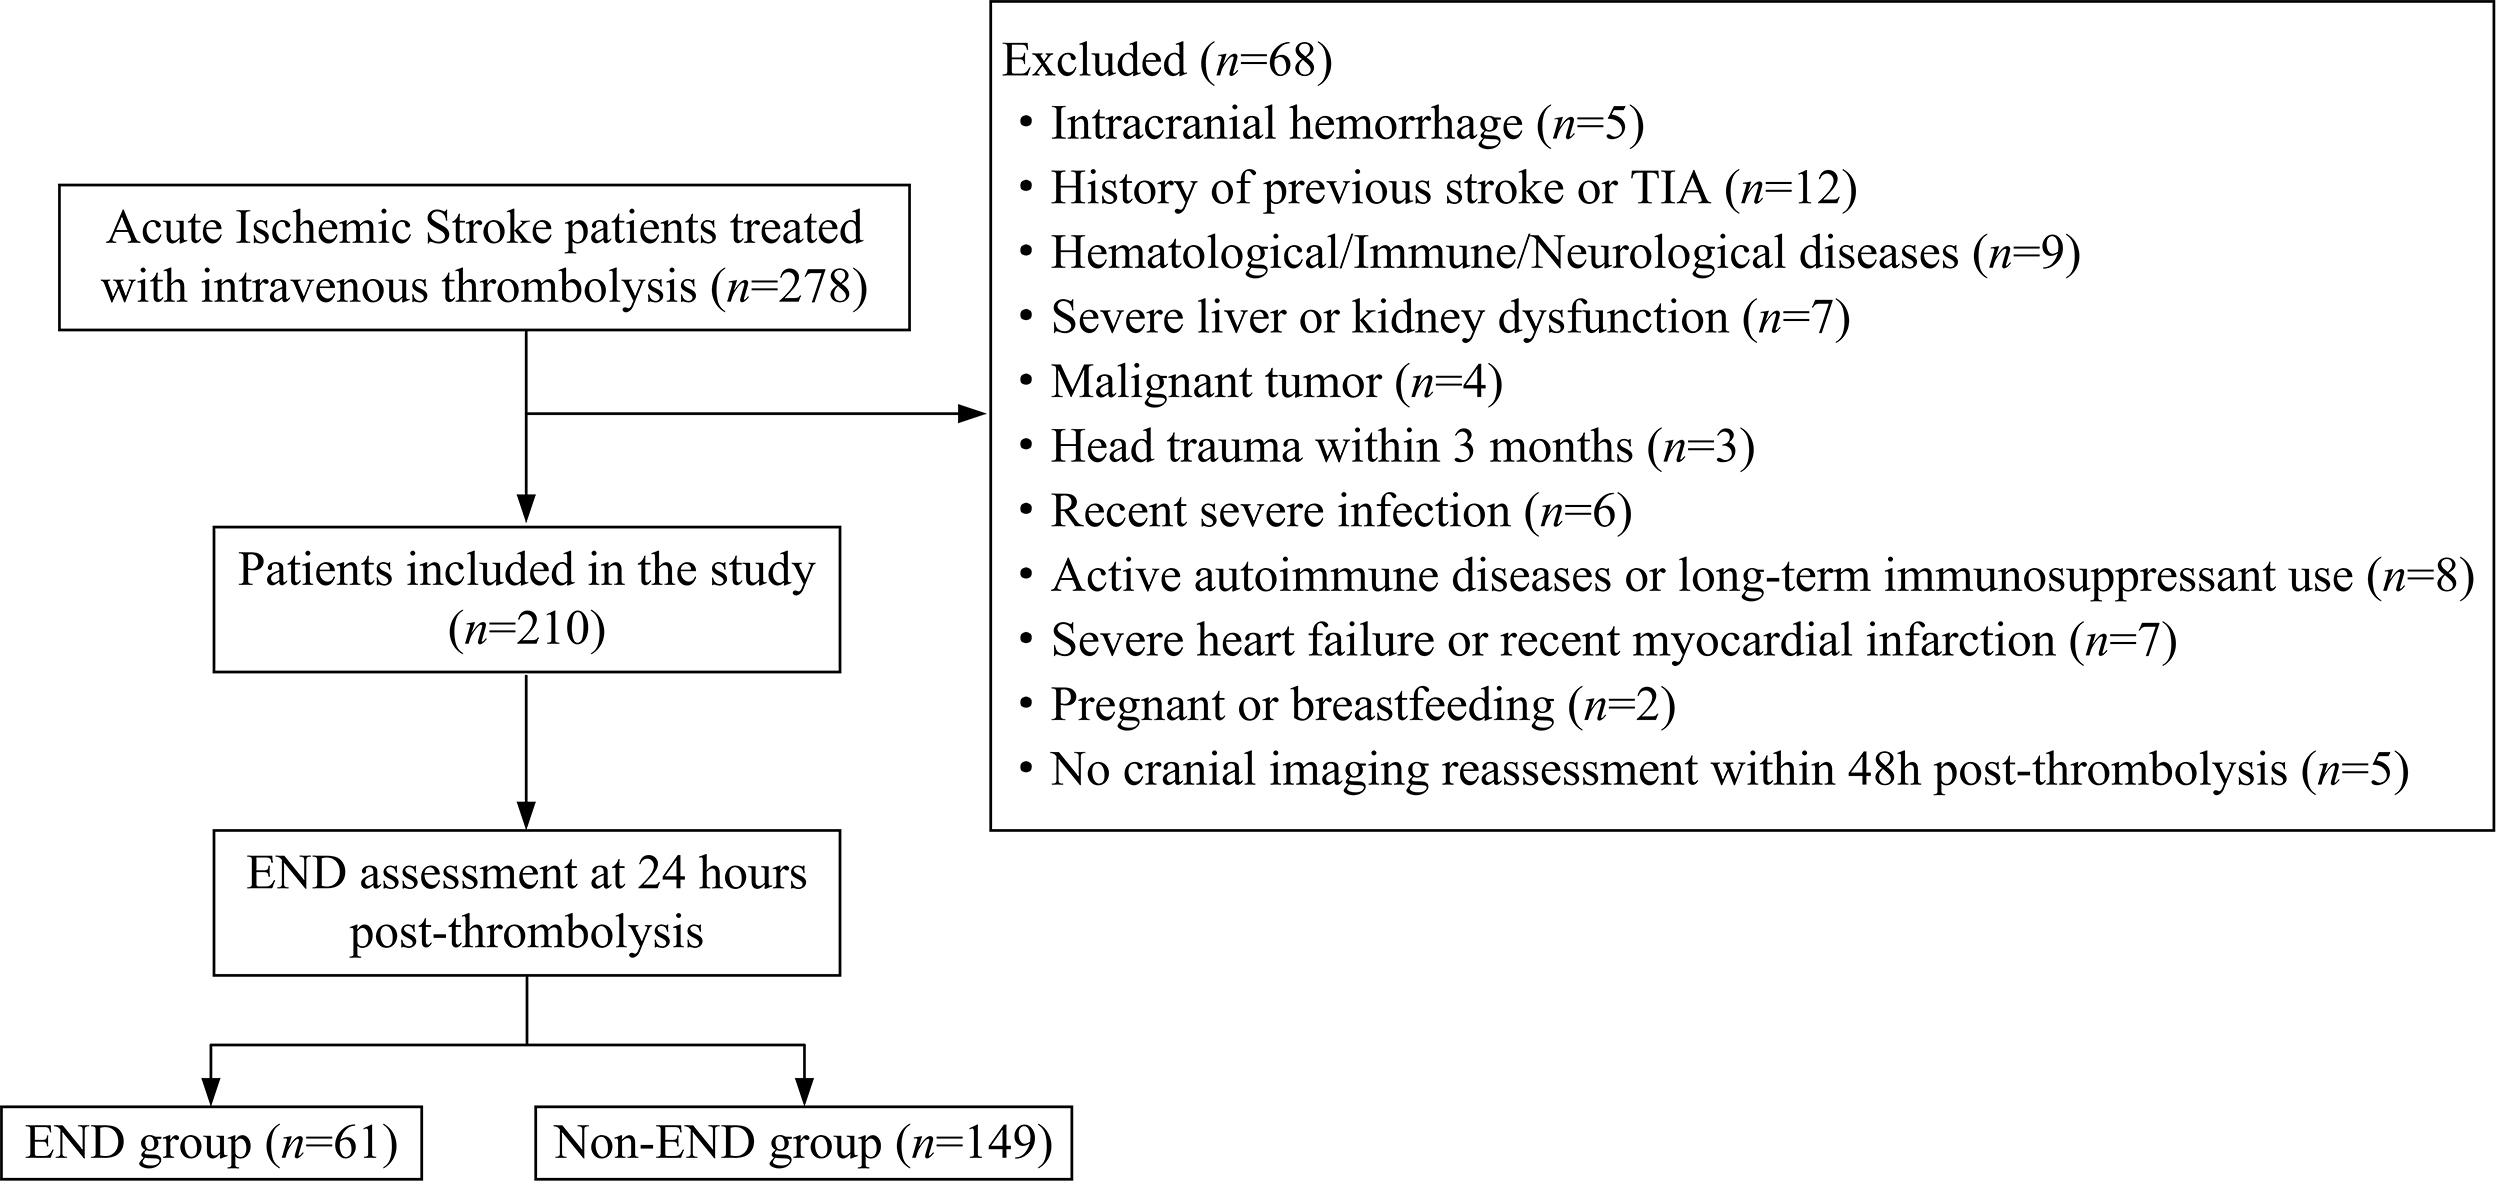 Fig. 1.
A flowchart of patient selection and grouping. END, early neurological deterioration; TIA, transient ischemic attack.
The sample size was calculated a priori using the Events Per Variable (EPV)
approach [16]. Based on statistical recommendations, an EPV of 10 was assumed.
According to a study by Zhang et al. (2024) [12], the incidence of END
in AIS patients was 28.6%. A preliminary review of relevant literature, combined
with clinical experience, identified 6 potential key predictors. Therefore, the
minimum required sample size was calculated as (10
The collected observational indicators were related to baseline features,
laboratory measures, and aEEG findings. (1) Patient-related baseline
characteristics and general information, including gender, age, body mass index
(BMI), smoking status, history of diabetes, hypertension, hyperlipidemia,
coronary heart disease, atrial fibrillation, time from onset to thrombolysis,
NIHSS score on admission [17], systolic blood pressure, and diastolic blood
pressure were collected. (2) Elbow venous blood samples were collected from each
patient at admission, and the following laboratory indicators were assessed:
white blood cell count, neutrophil count, monocyte count, lymphocyte count,
blood glucose, total cholesterol (TC), triglyceride (TG), low-density
lipoprotein cholesterol (LDL-C), high-density lipoprotein cholesterol (HDL-C),
creatinine, urea, uric acid, homocysteine (Hcy), and CD4+ T-cells and CD8+ T-cell
counts. SIRI and the CD4+/CD8+ ratio were then calculated. SIRI was defined as:
SIRI = (neutrophil count
(3) Conventional EEG monitoring was conducted to record cerebral electrical
activity, and aEEG was measured for assessment. The aEEG patterns were evaluated
as follows [18]: continuous normal voltage (upper and lower margins
END was defined as an increase of
Statistical analysis was performed using SPSS 22.0 software (IBM Corporation,
Armonk, NY, USA). The normality of continuous variables was assessed using the
Shapiro-Wilk test. Normally distributed measurement variables were expressed as
mean
Multivariate logistic regression analysis was used to identify factors affecting
END after thrombolysis in AIS patients, and the significant indicators were
included in the logit (P) formula to construct the prediction model.
Multicollinearity among the influencing factors was examined using the variance
inflation factor (VIF); a VIF
Model calibration or goodness of fit was evaluated using the Hosmer-Lemeshow test. The receiver operating characteristic (ROC) curves were developed to evaluate the predictive efficacy of the aEEG score, the CD4+/CD8+ ratio, their combination, and the full prediction model for END. Internal validation of the final multivariable prediction model was performed using bootstrapping with 1000 resamples to quantify and adjust for any optimism in model performance. The overall prediction accuracy was estimated using the Brier score, with lower scores (closer to 0) indicating better accuracy. Furthermore, 10-fold cross-validation was performed for the final prediction model (Model 2) to further assess its generalizability and reduce the risk of overfitting. A p-value of less than 0.05 was considered statistically significant.
The clinical characteristics of patients in the END and non-END groups were
compared. The time from onset to thrombolysis was significantly longer in the END
group than in the non-END group (p
| Experimental group | non-END group (n = 149) | END group (n = 61) | t/ |
p-value | |
| Gender [n (%)] | 0.189 | 0.664 | |||
| Male | 88 (59.06) | 38 (62.30) | |||
| Female | 61 (40.94) | 23 (37.70) | |||
| Age (year, mean |
71.65 |
72.01 |
0.290 | 0.772 | |
| BMI (kg/m2, mean |
23.96 |
24.12 |
0.461 | 0.645 | |
| Smoking [n (%)] | 44 (29.53) | 13 (21.31) | 1.478 | 0.224 | |
| Diabetes [n (%)] | 27 (18.12) | 13 (21.31) | 0.286 | 0.593 | |
| Hypertension [n (%)] | 94 (63.09) | 40 (65.57) | 0.116 | 0.734 | |
| Hyperlipidemia [n (%)] | 48 (32.21) | 21 (34.43) | 0.096 | 0.757 | |
| Coronary heart disease [n (%)] | 23 (15.44) | 11 (18.03) | 0.215 | 0.643 | |
| Atrial fibrillation [n (%)] | 29 (19.46) | 19 (31.15) | 3.351 | 0.067 | |
| Onset-to-needle time (h, mean |
2.60 |
3.08 |
7.083 | ||
| Admission NIHSS score (mean |
8.25 |
11.59 |
12.998 | ||
| Systolic pressure (mmHg, mean |
152.48 |
154.18 |
0.506 | 0.613 | |
| Diastolic pressure (mmHg, mean |
84.87 |
85.69 |
0.370 | 0.712 | |
| WBC ( |
8.37 |
9.45 |
6.770 | ||
| Blood glucose (mmol/L, mean |
6.12 |
6.19 |
0.366 | 0.715 | |
| TG (mmol/L, mean |
1.86 |
1.93 |
0.736 | 0.463 | |
| TC (mmol/L, mean |
4.18 |
4.27 |
0.549 | 0.583 | |
| LDL-C (mmol/L, mean |
2.54 |
2.63 |
0.856 | 0.393 | |
| HDL-C (mmol/L, mean |
1.16 |
1.08 |
1.279 | 0.202 | |
| Creatinine (µmol/L, mean |
81.76 |
81.35 |
0.158 | 0.875 | |
| Urea (mmol/L, mean |
5.63 |
5.81 |
1.022 | 0.308 | |
| Uric acid (µmol/L, mean |
329.96 |
334.68 |
0.349 | 0.728 | |
| Hcy (µmol/L, mean |
16.28 |
16.47 |
0.353 | 0.725 | |
| SIRI ( |
1.55 |
2.18 |
13.435 | ||
| CD4+/CD8+ (mean |
1.18 |
0.87 |
8.476 | ||
| aEEG score (mean |
2.12 |
3.19 |
9.059 | ||
BMI, body mass index; NIHSS, National Institutes of Health Stroke Scale; aEEG, amplitude-integrated electroencephalography; WBC, white blood cell count; TC, total cholesterol; TG, triglyceride; LDL-C, low-density lipoprotein cholesterol; HDL-C, high-density lipoprotein cholesterol; Hcy, homocysteine; SIRI, Systemic Inflammation Response Index; SD, standard deviation.
ROC curve analysis showed that the area under the ROC curves (AUCs) for
predicting END in AIS patients were 0.755 (95% confidence interval [CI]:
0.687–0.822, p
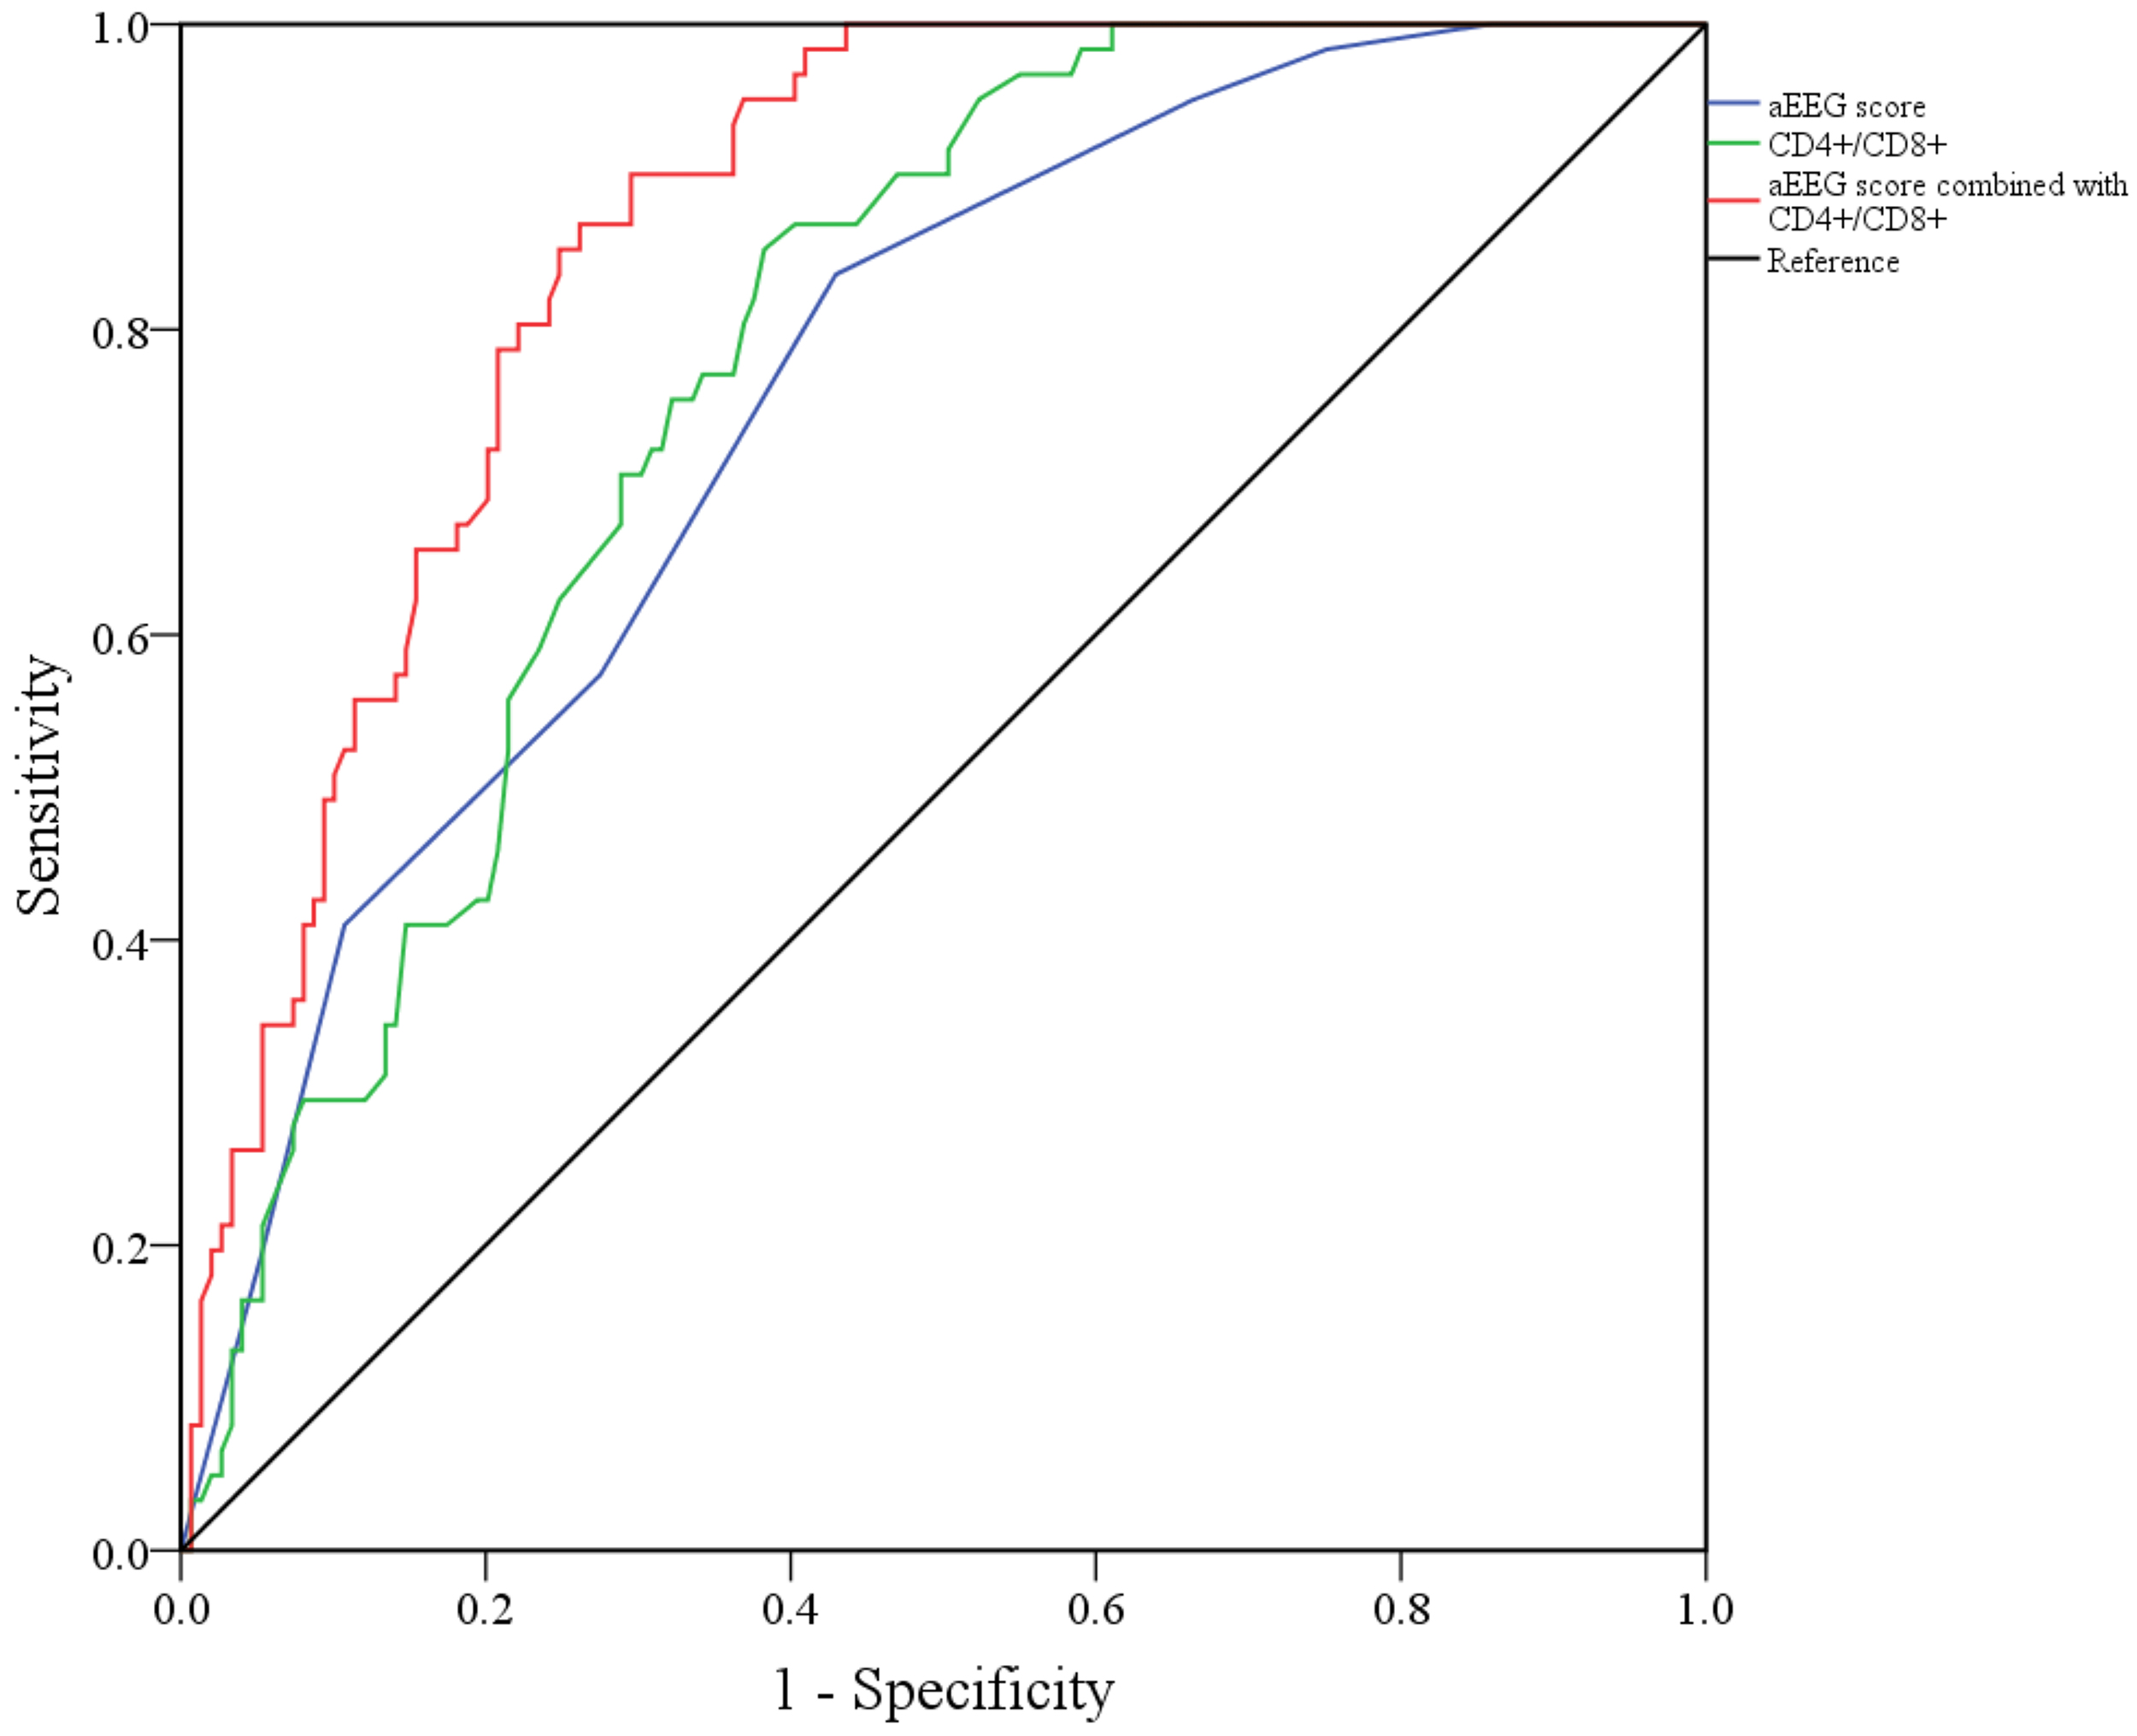 Fig. 2.
ROC curves for aEEG scores, the CD4+/CD8+ ratio alone, and their combination for predicting END after thrombolysis in AIS patients. ROC, receiver operating characteristic; AIS, acute ischemic stroke.
The indicators with statistically significant differences between the non-END
group and the END group, except for CD4+/CD8+ and aEEG scores, were used as
independent variables, and the occurrence of END after thrombolysis (non-END = 0,
END = 1) was used as the dependent variable for multivariate logistic regression
analysis. Prolonged time from onset to thrombolysis, higher NIHSS score at
admission, increased white blood cell count, and elevated SIRI were identified as
independent risk factors for END in AIS patients (p
When the indicators with statistically significant differences between the two
groups, including CD4+/CD8+ and aEEG scores, were included in the model,
multivariate logistic regression analysis showed that the prolonged time from
onset to thrombolysis, higher NIHSS score at admission, elevated white blood cell
count, higher SIRI, and increased aEEG score were independent risk factors for
END after thrombolysis (p
| Index | Forecasting model 1 | ||||
| SE | Wald |
p-value | OR (95% CI) | ||
| Onset-to-needle time | 2.945 | 1.412 | 4.351 | 0.037 | 19.009 (1.194–22.507) |
| Admission NIHSS score | 1.663 | 0.824 | 4.069 | 0.044 | 5.276 (1.048–26.551) |
| WBC | 1.424 | 0.702 | 4.111 | 0.043 | 4.155 (1.049–16.464) |
| SIRI | 2.132 | 0.976 | 4.772 | 0.027 | 8.434 (3.123–17.808) |
| Constant | –58.372 | 24.178 | 5.828 | 0.016 | |
| Index | Forecasting model 2 | ||||
| SE | Wald |
p-value | OR (95% CI) | ||
| Onset-to-needle time | 2.051 | 0.962 | 4.547 | 0.033 | 7.776 (1.183–51.102) |
| Admission NIHSS score | 1.787 | 0.801 | 4.976 | 0.026 | 5.971 (1.242–28.701) |
| WBC | 1.562 | 0.721 | 4.697 | 0.030 | 4.769 (1.162–19.568) |
| SIRI | 2.287 | 1.012 | 5.108 | 0.024 | 9.847 (1.357–71.455) |
| CD4+/CD8+ | –2.105 | 0.873 | 5.821 | 0.016 | 0.122 (0.022–0.674) |
| aEEG score | 0.602 | 0.241 | 6.240 | 0.012 | 1.826 (1.139–2.928) |
| Constant | –52.641 | 21.345 | 6.082 | 0.014 | |
CI, confidence interval; SE, standard error; OR, odds ratio.
The Hosmer-Lemeshow test showed superior calibration for both Model 1 and Model
2 (
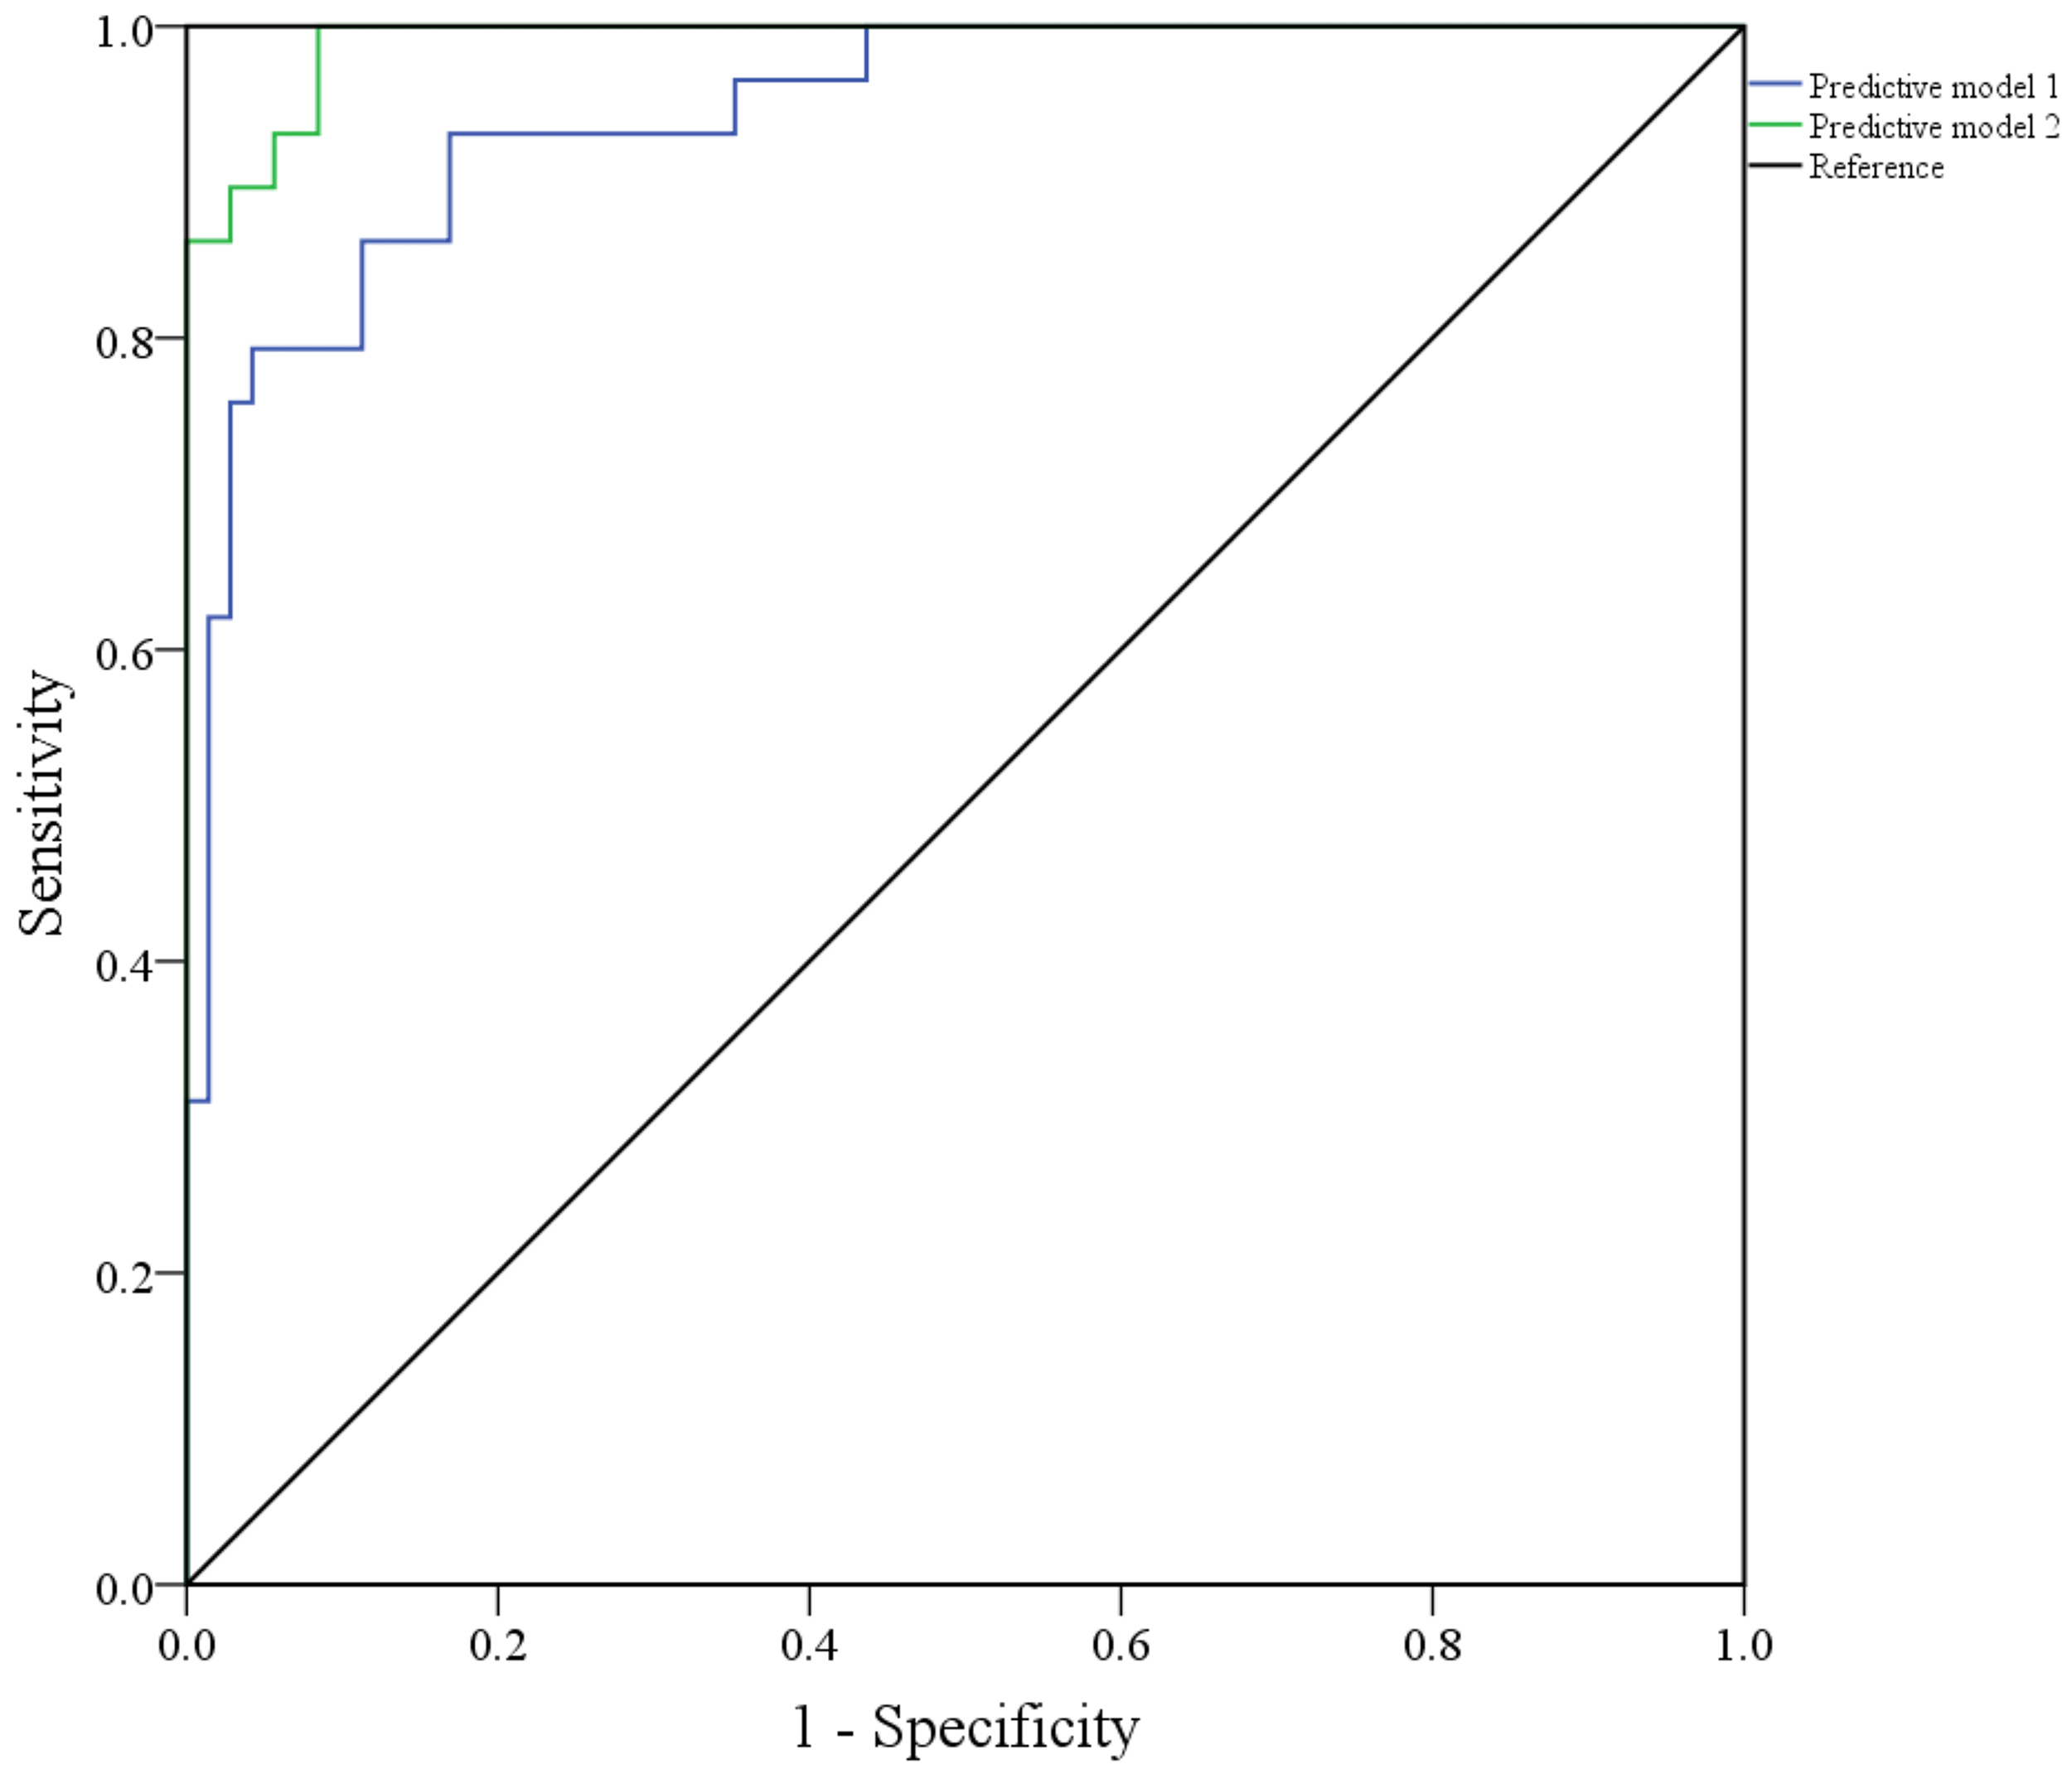 Fig. 3.
ROC curve of Model 1 and Model 2 to predict END efficacy after thrombolysis in AIS patients.
To further address potential overfitting, indicated by the wide confidence
intervals for some predictors in Table 2, internal validation was performed using
bootstrapping with 1000 resamples. The bootstrap-corrected AUC for the final
prediction model (Model 2) was 0.980 (95% CI: 0.965–0.998, p
The multicollinearity analysis revealed that the VIF values of all six variables
in prediction Model 2 were
| Predictor | Collinearity statistics | |
| Tolerance | VIF | |
| Onset-to-needle time | 0.896 | 1.115 |
| Admission NIHSS score | 0.723 | 1.383 |
| WBC | 0.892 | 1.121 |
| SIRI | 0.764 | 1.309 |
| CD4+/CD8+ | 0.935 | 1.070 |
| aEEG score | 0.881 | 1.135 |
VIF, variance inflation factor.
The END after thrombolytic therapy for AIS is a major unresolved concern in clinical practice. At present, the clinical approaches to predict END are still suboptimal. Although the established predictors, such as baseline NIHSS score and imaging findings, have certain predictive applications, their sensitivity and specificity are limited. Furthermore, the pathophysiology of END is highly complex, involving interaction among multiple factors, including ischemia-reperfusion injury, thrombosis, hemorrhagic transformation, and inflammatory response [20, 21]. In particular, the inflammatory response, which serves as a crucial interplay between ischemic injury and subsequent neurological deterioration, has not been fully elucidated in the context of END. Traditional inflammatory markers, such as C-reactive protein and white blood cell count, reflect only a single dimension of the inflammatory response and are inadequate to assess the complex inflammatory-immune regulatory network of the host.
In clinical practice, there is an urgent need for a simple, economical, and efficient biomarker that can accurately identify patients at high risk of END immediately after thrombolysis, thereby facilitating timely intervention. Therefore, exploring the diagnostic value of novel inflammation-related indicators for END is not only theoretically essential but also clinically relevant. Given this unmet clinical need, this study was designed to systematically evaluate the predictive efficacy of aEEG score and the CD4+/CD8+ ratio for END after thrombolysis in AIS patients, aiming to provide new insights and evidence for early risk stratification and the early warning of END.
Amplitude-integrated EEG (aEEG), a simple approach for continuous monitoring of brain function, can sensitively reflect the functional status of the cortex. The higher aEEG score indicate more severe cerebral injury. The correlation between aEEG score and END likely reflects its ability to quantitatively evaluate the degree of inhibition of neuronal electrical activity after cerebral ischemia. Cerebral ischemia-induced impairments in neuronal energy metabolism destabilize the cell membrane potential and lead to weakening or loss of electrical activity. aEEG can identify neuronal dysfunction at an early stage by monitoring integrated changes in EEG amplitude [7].
In this study, patients in the END group showed significantly higher aEEG scores than those in the non-END group, and multivariate logistic regression analysis revealed that a higher aEEG score was an independent risk factor for END. These observations suggest that aEEG is crucial for evaluating neurological impairment and predicting the occurrence of END. The decreased CD4+/CD8+ ratio, as a key predictor of immune status, may indicate impaired immune regulatory function, aggravate inflammatory responses, and consequent deterioration of neurological function. A reduction in this ratio reflects a shift in the T helper/T cytotoxic (Th/Tc) cell balance toward a pro-inflammatory state. The relative increase in CD8+ cytotoxic T-cells may aggravate neural injury by directly targeting neurons within the ischemic penumbra or by promoting the release of inflammatory mediators [8, 9].
In our study, the CD4+/CD8+ ratio was significantly lower in the END group than in the non-END group, and this higher ratio emerged as a protective factor against END. Furthermore, the combined application of aEEG score and CD4+/CD8+ ratio further improved the predictive efficacy for END (AUC = 0.862), indicating that combining EEG neurophysiological evaluation with immune-inflammatory indicators provides more comprehensive and informative risk stratification for early END identification.
The mechanisms underlying END in AIS patients after thrombolysis are complicated
and likely reflect the synergistic effect of multiple factors. A study by Zhang
et al. [22] showed that the time from onset to thrombolysis and white
blood cell count were linked to the occurrence of END after thrombolysis in AIS
patients. The present study similarly confirmed that prolonged time from onset to
thrombolysis and increased white blood cell count at admission were independent
risk factors for END after thrombolysis in AIS patients. The impact of delayed
thrombolysis on END is primarily attributed to irreversible damage within the
ischemic penumbra and the aggravation of reperfusion injury [23, 24]. With
prolonged ischemia time, the core area of infarction expands, metabolic
impairments of penumbral neurons aggravate, and mitochondrial dysfunction leads
to excessive accumulation of reactive oxygen species. When the blood flow is
restored after thrombolysis, reperfusion triggers a sudden increase in oxidative
stress. Reactive oxygen species activate the nuclear factor kappa B
(NF-
The study also found a high NIHSS score at admission as a risk factor for END
after thrombolysis in AIS patients, consistent with the results of Liu et
al. [25]. An increased NIHSS score at admission suggests more severe
neurological deficits, and the mechanism underlying END may involve the following
aspects [26, 27]: (1) Larger infarct size; high NIHSS scores often reflect
extensive infarction or involvement of key functional areas such as cortex and
basal ganglia, which are more prone to neurological deterioration due to edema or
microcirculatory dysfunction after reperfusion. (2) Insufficient collateral
circulation compensation: patients with severe defects show poor collateral blood
flow and are more prone to ineffective reperfusion, for example, persistent
microvascular occlusion, after thrombolysis, which aggravates
ischemia-reperfusion injury. (3) Higher susceptibility to secondary injury:
patients with high NIHSS scores have compromised cerebral metabolic reserve,
which reduces tolerance to secondary injury, such as inflammatory factors (e.g.,
TNF-
SIRI is a comprehensive inflammatory marker which reflects the inflammatory state by integrating neutrophil, monocyte, and lymphocyte counts [28]. Li et al. [29] reported that high SIRI was an independent risk factor for END in patients with minor ischemic stroke. Consistent with these observations, our study also confirmed that SIRI levels were substantially higher in the END group than in the non-END group, and multivariate logistic regression analysis showed increased SIRI as an independent risk factor for END. The diagnostic value of SIRI for END may be due to its involvement in multiple aspects of underlying pathophysiological processes.
Neutrophils, as the first-line effector cells in the inflammatory response,
rapidly infiltrate brain tissue after ischemia-reperfusion, where they release
reactive oxygen species and proteases, directly destroying the blood-brain
barrier and exacerbating brain edema. After ischemia, monocytes differentiate
into macrophages and amplify the inflammatory cascade by secreting
pro-inflammatory factors such as IL-1
To further assess the incremental diagnostic value of aEEG scores and the CD4+/CD8+ ratio, two predictive models were constructed in this study. Model 1, which excluded aEEG score and CD4+/CD8+, demonstrated an AUC of 0.944, whereas the AUC of Model 2, which combined both aEEG score and CD4+/CD8+, increased to 0.991. Comparison of these models showed that integrating aEEG score and CD4+/CD8+ improved predictive performance, with sensitivity increasing from 87.21% to 91.34% and specificity from 87.40% to 100%. These observations indicate that aEEG scores and CD4+/CD8+ ratios provide predictive information beyond traditional risk factors, and their inclusion improves model discrimination and clinical applicability. However, the ROC curves of the two models showed relatively fewer inflection points, suggesting certain limitations in risk stratification, which may be related to the predominant use of continuous variables. Future studies should optimize the model’s stratification capability by introducing categorical variables or applying more detailed categorization of continuous variables.
This study has several limitations that should be acknowledged before interpreting these findings. First, its single-center, retrospective design may introduce potential selection bias and limit the generalizability of the findings, as the characteristics of our patient population and local clinical practices may not fully represent those at other institutions or regions. Second, although internal validation techniques (e.g., bootstrapping and cross-validation) were used, the model’s exceptional performance (e.g., AUC of 0.991) should be interpreted with caution. In the absence of a truly independent, external validation cohort, the risk of overfitting cannot be excluded, and the general applicability of the model requires further confirmation. Furthermore, the aEEG scoring system (1–5 scale) used in this study was adapted from scales originally validated in neonatal encephalopathy. While it provides a structured framework for quantifying background EEG suppression, its application and interpretation in adult AIS patients require further validation. The underlying pathophysiology of brain injury in adult stroke differs from that in neonates, which may affect the clinical interpretation of these scores. Therefore, our findings regarding the aEEG score should be interpreted with caution. Future prospective, multi-center studies with larger sample sizes are required to validate the robustness and clinical utility of the model and to further elucidate the predictive contribution of aEEG and immune markers in END.
In summary, this study confirms that both the aEEG score and the CD4+/CD8+ ratio are independent predictors of END in AIS patients after thrombolysis, and combining these two significantly improves predictive efficacy. The multifactorial prediction model incorporating these variables showed excellent discriminative ability (AUC = 0.991) and holds potential clinical transformation value. The implementation of individualized monitoring and early intervention is advisable for patients with these high-risk factors, including improved neurological assessment, optimized blood pressure management, and rational use of anti-inflammatory and neuroprotective treatments. Future multi-center and large-sample studies are needed to further validate the clinical applicability of this model and to explore targeted intervention strategies based on aEEG and immune markers to improve neurological prognosis after thrombolysis in AIS.
• This study identifies the aEEG score and the CD4+/CD8+ ratio as significant and independent predictors for END following thrombolysis in patients with AIS.
• The combination of the aEEG score, which reflects cortical functional integrity, and the CD4+/CD8+ ratio, which indicates systemic immune-inflammatory status, provides superior predictive performance for END than either marker alone, with a combined area under the curve of 0.862.
• A diagnostic model incorporating these novel biomarkers alongside established risk factors demonstrated outstanding discriminative ability (AUC = 0.991), highlighting its potential for clinical translation to identify high-risk patients.
• These findings underscore the critical interplay between neuroelectrophysiological dysfunction and the immune response in the pathogenesis of END, suggesting that integrated monitoring strategies could enable earlier intervention and improved prognostic outcomes.
The data used to support the findings of this study are available from the corresponding author upon request.
QR designed the research study. HW performed the research. LY and SZ collected the data. QR and JZ analyzed the data and drafted the manuscript. All authors contributed to the important editorial changes in the manuscript. All authors read and approved the final manuscript. All authors have participated sufficiently in the work and agreed to be accountable for all aspects of the work.
This study adhered to the principles of the Declaration of Helsinki and was approved by the Ethics Committee of Shangyu People’s Hospital of Shaoxing (SYRY-REC-2024-A010). All patients provided written informed consent.
Not applicable.
This work was supported by the Shaoxing Health Commission Science and Technology Plan Project [Grant No. 2024SKY110] and the 2024 District-Level Social Development Science and Technology Project of Shangyu District, Shaoxing City [Grant No. 2024-10].
The authors declare no conflicts of interest.
References
Publisher’s Note: IMR Press stays neutral with regard to jurisdictional claims in published maps and institutional affiliations.