


 , Shengju Yang 2,*
1 Department of Dermatology, Punan Branch of Renji Hospital, Shanghai Jiaotong University School of Medicine (Shanghai Punan Hospital of Pudong New District), 200125 Shanghai, China
2 Department of Dermatology, Affiliated Hospital of Nantong University, 226001 Nantong, Jiangsu, China
Abstract
Urticaria is a common inflammatory skin disease that significantly impairs the quality of life and mental health of adolescents and young adults. Despite its increasing impact, comprehensive long-term epidemiological data focusing specifically on the young population across diverse Asian regions remain limited. This study aimed to assess the burden of urticaria among adolescents and young adults in Asia from 1990 to 2021, and to project its changes through 2036.
A repeated cross-sectional analysis using Global Burden of Disease (GBD) Study 2021 data was conducted to estimate the burden of urticaria prevalence, incidence, and disability-adjusted life years (DALYs) among Asian adolescents and young adults (ages 10–24) from 1990 to 2021. Data analysis was performed from November 2024 to April 2025.
From 1990 to 2021, the prevalence, incidence, and DALYs for urticaria increased among Asian adolescents and young adults, with rates consistently higher in females. In 2021, there were 16,347,995 new cases (95% uncertainty interval [UI]: 12,625,370 to 21,681,388). The prevalence rose from 863.13 (95% UI: 761.99 to 983.08) to 877.84 (95% UI: 775.68 to 1000.20) per 100,000 population (average annual percent change [AAPC] = 0.055%, 95% confidence interval [CI]: 0.053% to 0.056%). The incidence increased from 1525.51 (95% UI: 1341.63 to 1728.55) to 1552.60 (95% UI: 1369.05 to 1758.22) per 100,000 population (AAPC = 0.057%, 95% CI: 0.055% to 0.057%). The DALY rate grew from 51.74 (95% UI: 34.15 to 74.31) to 52.78 (95% UI: 34.65 to 76.09) per 100,000 population (AAPC = 0.064%, 95% CI: 0.063% to 0.065%). Overall, Central Asia has the highest age-standardized prevalence, incidence, and DALYs. Health inequality assessments indicated that the disease burden has intensified in low socio-demographic index (SDI) regions due to unequal medical resources. The incidence is projected to continue rising over the next 15 years, reaching 1568.89 (95% prediction interval [PI]: 1552.24 to 1592.05) per 100,000 population by 2036.
Over the past three decades, urticaria has shown significant increases in prevalence, incidence, and DALYs across the region, with females exhibiting higher morbidity rates than males. This trend is expected to persist through 2036. These findings underscore the urgent need for targeted public health interventions and more equitable distribution of medical resources to mitigate the escalating disease burden, particularly in high-burden, low-SDI regions.
Keywords
- global burden of disease
- urticaria
- Asian
- adolescent
- young adult
- age-period-cohort analysis
- autoregressive integrated moving average model
Urticaria, a common skin disorder characterized by transient wheals and angioedema, poses a significant burden on patients’ quality of life and psychological well-being [1, 2]. The pathogenesis is mainly driven by the activation of dermal mast cells. Emerging evidence also implicates contributory roles for dysregulation of the coagulation cascade, fibrinolytic pathways, and specific autoantibodies [3, 4]. While epidemiological factors such as population density, atopic history, and socioeconomic status are linked to acute urticaria [5], chronic urticaria shows a distinct and increased susceptibility among individuals with underlying autoimmune disorders [6].
Patients with urticaria often experience sleep disturbances, physical and emotional discomfort, and impaired performance at school or work [7]. Latest research indicates that the global prevalence of urticaria is increasing year by year. A particularly significant rise is observed among children, women, and populations in low-income countries [8]. Chronic spontaneous urticaria is the most predominant subtype, accounting for approximately 70–80% of cases. While epidemiological data from Asian and European countries are gradually improving, there is still a lack of long-term surveillance data from developing nations [9]. Urticaria significantly affects patients’ quality of life and imposes a substantial economic burden, highlighting the need to strengthen early identification and long-term management of the condition [10].
In this study, data from the Global Burden of Disease (GBD) 2021 were utilized to evaluate the burden of urticaria among adolescents and young adults aged 10–24 years across Asia, stratified by age and sex. Trends in incidence, prevalence, and disability-adjusted life years (DALYs) were analyzed using Joinpoint regression and the age-period-cohort model. Socioeconomic influences were also evaluated, and future burden was projected through 2036.
The Global Burden of Disease Study 2021 provides comprehensive estimates for numerous diseases and conditions; based on these data, we analyzed the burden of urticaria. Coordinated by the Institute for Health Metrics and Evaluation (IHME), in the GBD project, the impact of diseases, injuries, and risk factors across 204 countries and territories is quantified [11]. The GBD study provides comprehensive estimates on incidence, prevalence, mortality, years of life lost (YLL), years lived with disability (YLD), and DALYs for 369 diseases and injuries [12]. The data for this analysis were obtained from the GBD results tool, an open-access online database. The data were accessed and downloaded via the Global Health Data Exchange (GHDx) platform [13] (http://ghdx.healthdata.org/gbd-results-tool).
Estimates of prevalence, incidence, and DALYs of urticaria were retrieved directly from the GBD 2021 database via the GHDx. These metrics were pre-calculated by the IHME using Disease Modeling-Meta-Regression (DisMod-MR) 2.1—a Bayesian meta-regression framework that synthesizes diverse data sources while adjusting for biases and ensuring internal consistency between epidemiological parameters [14]. Our study involved the extraction and analysis of these existing estimates, and we did not independently perform DisMod-MR modeling or manual data imputation. This study has strictly adhered to the statement of Guidelines for Accurate and Transparent Health Estimates Reporting (GATHER) and the GBD citation policy throughout the manuscript. Additional methodological details, including the full GATHER Checklist, Supplementary Tables 1–13, and Supplementary Figs. 1,2 are provided in the Supplementary Materials.
To account for demographic variations, we calculated the age-standardized prevalence rate (ASPR) and age-standardized incidence rate (ASIR). The disease burden was expressed as the age-standardized DALY rate (ASDR). All rates are presented per 100,000 population and were calculated using the GBD world standard population. We investigated the relationship between disease burden and the socio-demographic index (SDI) using a linear mixed-effects model in the Meta-Regression–Bayesian, Regularized, Trimmed (MR-BRT) framework. All analyses were performed using R software (Version 4.4.3, R Foundation for Statistical Computing, Vienna, Austria). The p-values less than 0.05 were considered statistically significant. The processed data and R scripts used for analysis are available at https://github.com/E1H-zy/GBD2021.
Trends in incidence, prevalence, and DALY rates were analyzed using the Joinpoint Regression Program (Version 5.2.0.0, Information Management Services, Inc., Calverton, MD, USA). We employed the log-linear model to calculate the annual percent change (APC) for each temporal segment and the average annual percent change (AAPC) for the entire period (1990–2021). The APC and AAPC derived from the Joinpoint models are expressed as percentage changes per year.
To determine the optimal number of joinpoints, we used the Monte Carlo Permutation method with 4499 permutations and a significance level of 0.05. The Grid Search method was applied, and standard errors were assumed to be constant (homoscedasticity model). A maximum of five joinpoints was allowed for the analysis, consistent with the length of the time series.
The age-period-cohort model is recognized as an advanced analytical approach that surpasses traditional methods in studying health and socioeconomic development. To independently assess the effects of age, period, and birth cohort on the incidence of urticaria, we employed the age-period-cohort model using the Intrinsic Estimator method to address the exact collinearity among these temporal dimensions (https://analysistools.cancer.gov/apc/). To comply with the model’s requirement for synchronized 5-year intervals, data from 1990 to 1991 were excluded, and the analysis period for age-period-cohort modeling was set from 1992 onward. Data were then organized into synchronized 5-year intervals—comprising three age groups (10–24) and six consecutive 5-year temporal periods spanning 1992–2021—to ensure model identifiability and facilitate the derivation of successive birth cohorts. The model estimated net drift and local drift to quantify overall and age-specific temporal trends. The statistical superiority of the full age-period-cohort model was confirmed via goodness-of-fit testing, and it consistently yielded the lowest Akaike Information Criterion (AIC) and Bayesian Information Criterion (BIC) compared to the age-period (AP) and age-cohort (AC) sub-models (Supplementary Table 1).
Health inequality related to socioeconomic development was assessed using the slope index of inequality (SII) and the concentration index (CnI), following World Health Organization guidelines for measuring disparities across countries ranked by the socio-demographic index (SDI) [15].
To project the future burden of urticaria up to 2036, we employed an autoregressive integrated moving average (ARIMA) model, a standard approach for forecasting based on historical time-series data [16]. Model selection was based on the autocorrelation and partial autocorrelation functions, and the best-fitting model was used for projections.
The optimal model order
The detailed mathematical derivations for age-standardized rates (ASR), APC/AAPC, and the age-period-cohort model are provided in the Supplementary Materials.
Overall, the global burden of urticaria continues to grow. In Asia, there were 16,347,995 new cases of urticaria in 2021 (95% uncertainty interval (UI): 12,625,370 to 21,681,388). The ASRs per 100,000 population of urticaria in Asia for 2021 were as follows: 877.84 cases (95% UI: 775.68 to 1000.20) for prevalence, 1552.60 new cases (95% UI: 1369.05 to 1758.22) for incidence, and 52.78 cases (95% UI: 34.65 to 76.09) for DALYs. It is evident that females experience a higher disease burden than males (Supplementary Table 3).
The burden of disease in Asia exhibited an overall upward trend from 1990 to 2021. The ASPR per 100,000 population increased from 863.13 (95% UI: 761.99 to 983.08) to 877.84 (95% UI: 775.68 to 1000.20), with an AAPC of 0.055% (95% confidence interval (CI): 0.053% to 0.056%). Similarly, the ASIR rose from 1525.51 (95% UI: 1341.63 to 1728.55) to 1552.60 (95% UI: 1369.05 to 1758.22), with an AAPC of 0.057% (95% CI: 0.055% to 0.057%). Furthermore, the ASDR increased from 51.74 (95% UI: 34.15 to 74.31) to 52.78 (95% UI: 34.65 to 76.09), with an AAPC of 0.064% (95% CI: 0.063% to 0.065%) (Table 1, Fig. 1).
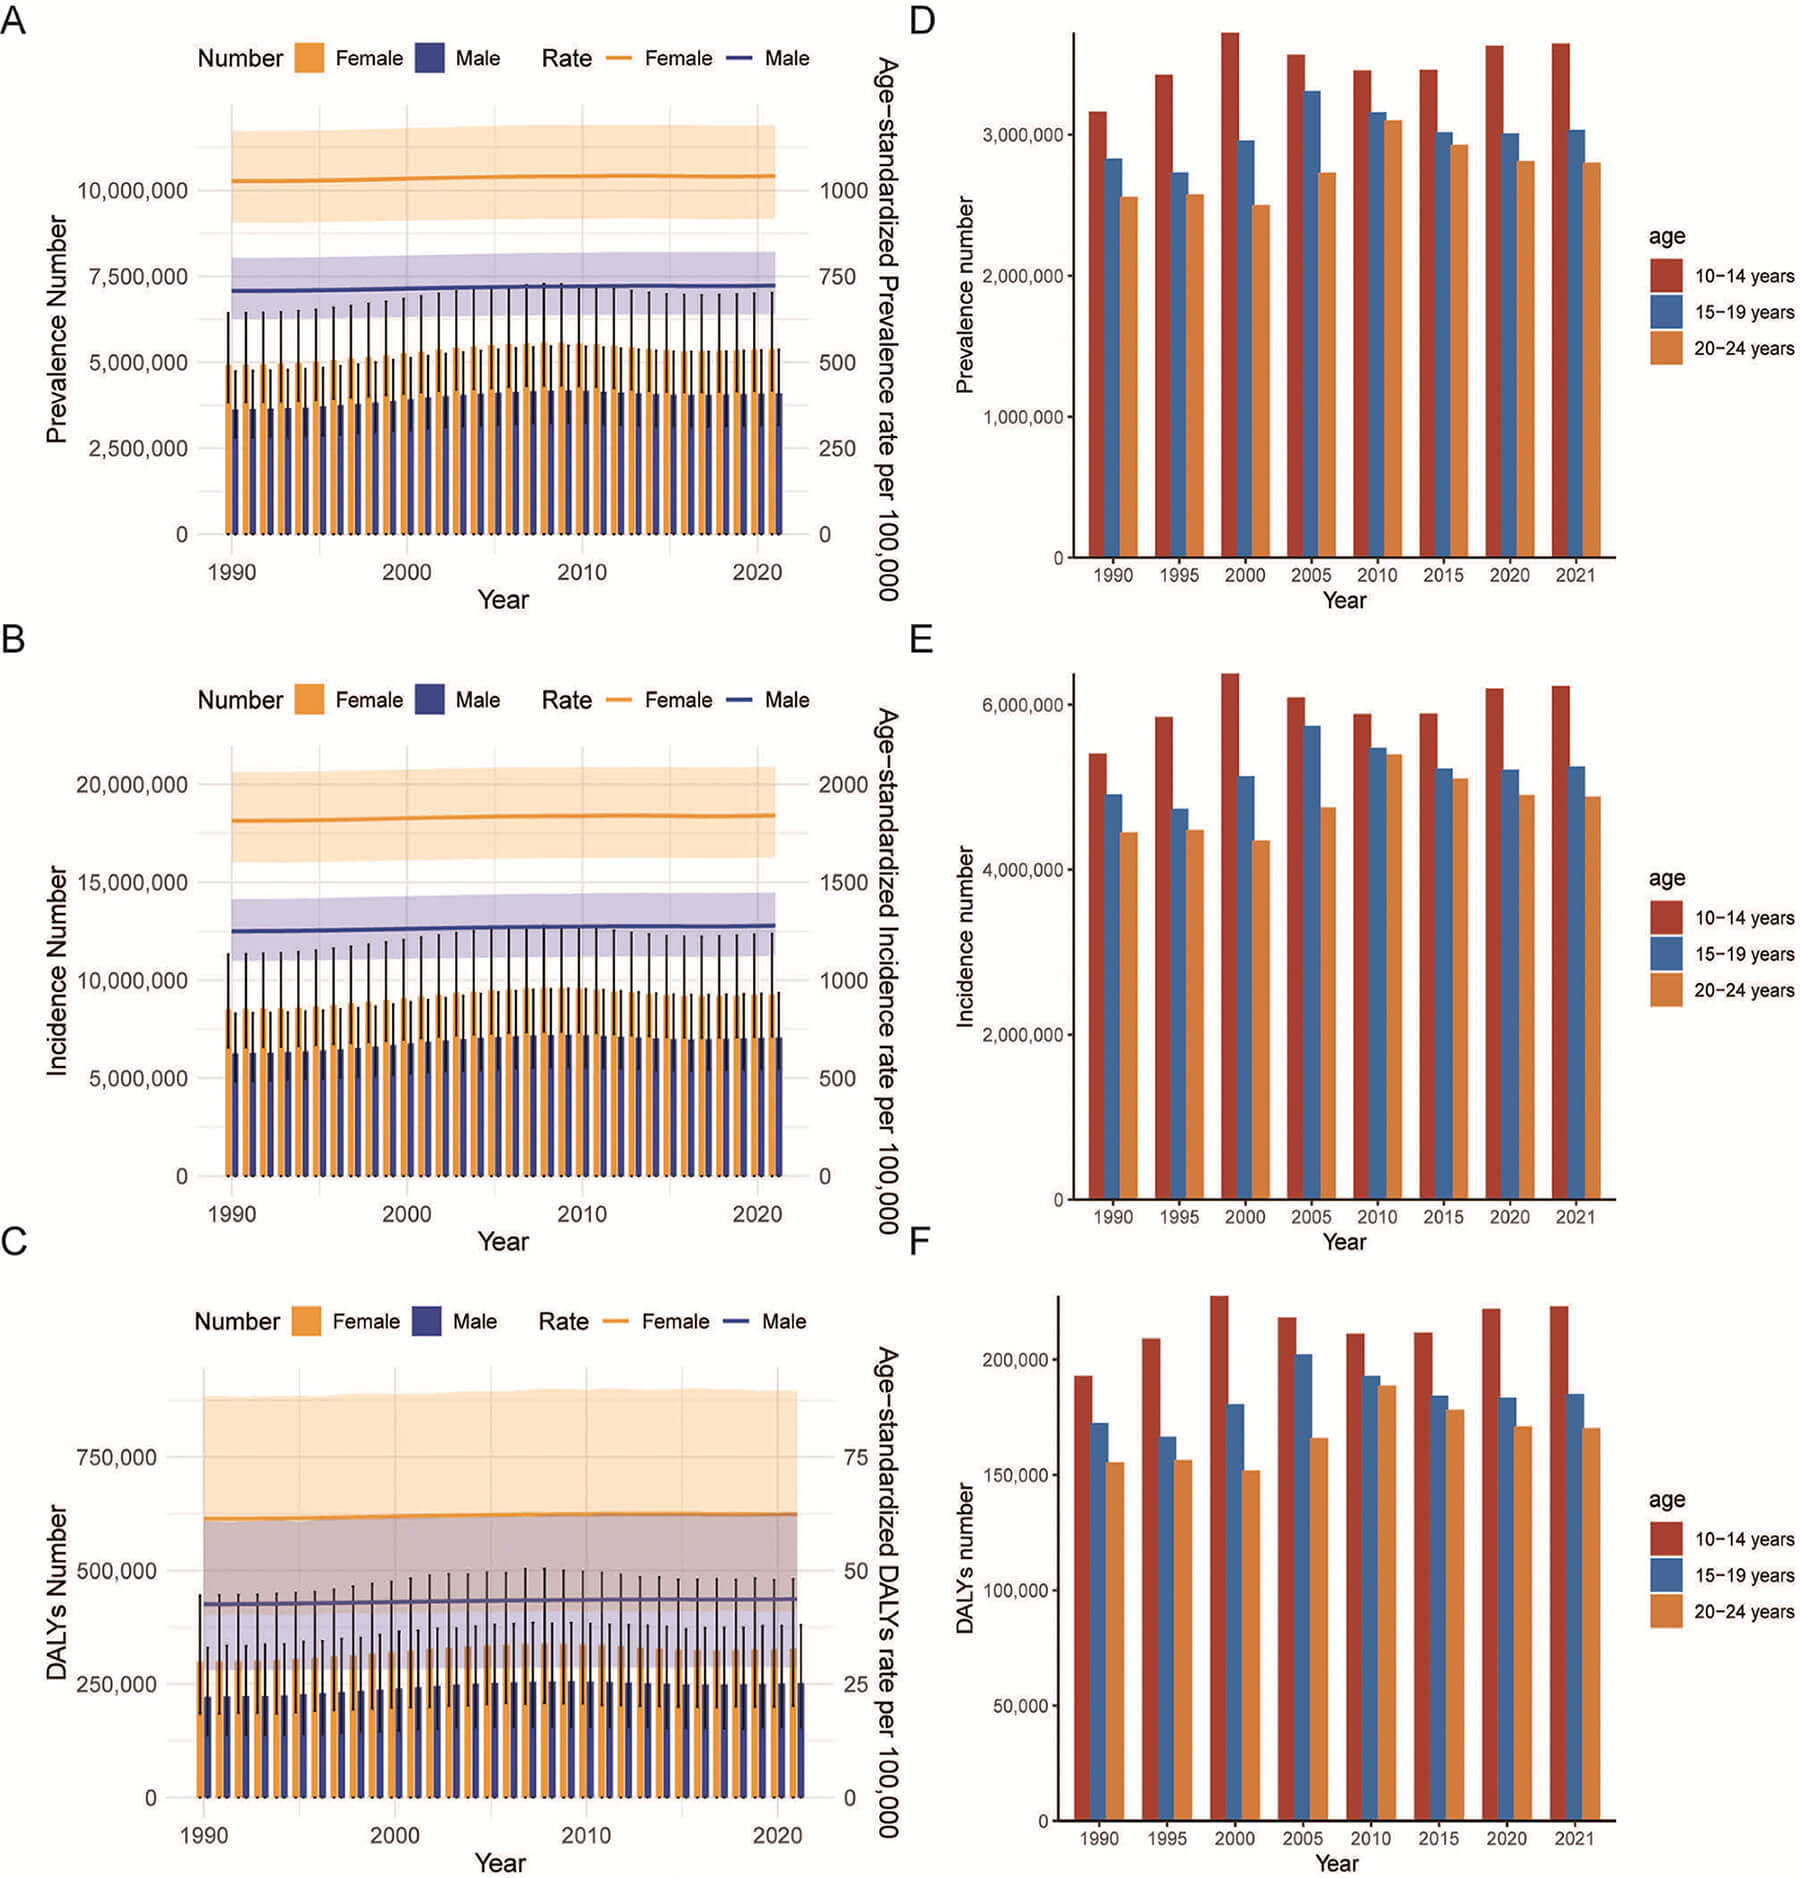 Fig. 1.
Trends in incidence, prevalence, and DALYs of urticaria among adolescents and young adults aged 10–24 years from 1990 to 2021. (A) Trends in prevalence cases and prevalence rate. (B) Trends in incidence cases and incidence rate. (C) Trends in DALYs cases and DALYs rate. (D) Trends in prevalence cases by age group. (E) Trends in incidence cases by age group. (F) Trends in DALYs cases by age group. Abbreviation: DALYs, disability-adjusted life years.
| Location | Number (n), 1990, (95% UI) | Age-standardized rate (per 100,000 population), 1990, (95% UI) | Number (n), 2021, (95% UI) | Age-standardized rate (per 100,000 population), 2021, (95% UI) | AAPC (%), 1990–2021, (95% CI) | p-value |
| Prevalence | ||||||
| Asia | 8,550,525 (6,634,065, 11,172,906) | 863.13 (761.99, 983.08) | 9,480,132 (7,370,005, 12,395,178) | 877.84 (775.68, 1000.20) | 0.055 (0.053, 0.056) | |
| East Asia | 3,250,647 (2,500,129, 4,224,157) | 757.92 (668.24, 859.60) | 2,107,032 (1,635,261, 2,751,388) | 755.03 (666.00, 855.88) | –0.012 (–0.012, –0.012) | |
| South Asia | 2,983,906 (2,307,724, 3,879,198) | 981.1 (865.00, 1118.10) | 4,672,351 (3,647,402, 6,087,502) | 1053.78 (928.51, 1210.16) | 0.032 (0.032, 0.033) | |
| Central Asia | 179,316 (138,532, 232,275) | 1055.52 (930.03, 1211.74) | 199,452 (154,655, 258,678) | 1051.20 (926.00, 1207.30) | –0.013 (–0.013, –0.013) | |
| Southeast Asia | 1,439,320 (1,116,308, 1,885,111) | 770.44 (673.90, 878.97) | 1,653,825 (1,281,792, 2,165,176) | 772.28 (675.82, 881.40) | 0.008 (0.008, 0.008) | |
| Incidence | ||||||
| Asia | 14,767,369 (11,394,133, 19,628,286) | 1525.51 (1341.63, 1728.55) | 16,347,995 (12,625,370, 21,681,388) | 1552.60 (1369.05, 1758.22) | 0.057 (0.055, 0.057) | |
| East Asia | 5,657,915 (4,310,332, 7,488,999) | 1340.63 (1174.89, 1518.79) | 3,669,138 (2,789,738, 4,853,803) | 1335.66 (1170.92, 1512.77) | –0.012 (–0.012, –0.012) | |
| South Asia | 5,111,409 (3,910,537, 6,726,964) | 1732.92 (1532.88, 1964.07) | 8,016,202 (6,143,137, 10,603,881) | 1750.38 (1549.58, 1983.76) | 0.032 (0.032, 0.033) | |
| Central Asia | 302,632 (234,353, 398,285) | 1858.39 (1631.88, 2128.08) | 336,439 (260,486, 442,522) | 1850.83 (1624.93, 2118.64) | –0.013 (–0.013, –0.013) | |
| Southeast Asia | 2,491,075 (1,939,029, 3,266,406) | 1364.00 (1195.71, 1552.36) | 2,862,780 (2,225,785, 3,759,562) | 1367.36 (1198.53, 1557.15) | 0.008 (0.008, 0.008) | |
| DALYs | ||||||
| Asia | 520,772 (318,812, 771,149) | 51.74 (34.15, 74.31) | 578,332 (356,164, 855,628) | 52.78 (34.65, 76.09) | 0.064 (0.063, 0.065) | |
| East Asia | 199,209 (121,634, 300,111) | 45.79 (30.24, 65.52) | 129,465 (78,668, 194,307) | 45.74 (30.08, 65.31) | –0.004 (–0.005, –0.003) | |
| South Asia | 180,424 (111,459, 272,717) | 58.29 (38.49, 83.21) | 284,046 (174,231, 418,356) | 59.23 (38.94, 85.47) | 0.052 (0.051, 0.053) | |
| Central Asia | 10,931 (6749, 16,617) | 63.53 (42.49, 90.00) | 12,195 (7512, 18,349) | 63.43 (42.24, 89.23) | –0.005 (–0.008, –0.003) | 0.008 |
| Southeast Asia | 87,803 (54,045, 134,045) | 46.28 (30.35, 66.38) | 101,144 (62,038, 154,879) | 46.55 (30.63, 66.94) | 0.022 (0.019, 0.023) | |
Abbreviations: UI, uncertainty interval; CI, confidence interval.
The prevalence of urticaria has increased across all age groups. The most substantial rise was observed in the 10–14 age group (13.29%) and the smallest increase was observed in the 15–19 age group (6.68%) (Fig. 1D). Incidence rose most significantly in the 10–14 age group (14.91%) and least in the 15–19 age group (6.46%) (Fig. 1E). In terms of DALYs, the 10–14 age group experienced the greatest increase (13.56%), whereas the 15–19 age group had the smallest increase (6.75%) (Fig. 1F).
Joinpoint regression analysis revealed distinct temporal shifts in the burden of urticaria in Asia. The ASPR trend was best described by a model with four joinpoints (five segments). A period of peak sustained growth occurred from 1994 to 2005 (APC = 0.12%, 95% CI: 0.11 to 0.12). Following a significant reversal in 2013, a steady decline persisted until 2019 (APC = –0.03%, 95% CI: –0.04 to 0.02). However, a sharp resurgence was observed in the most recent segment from 2019 to 2021 (APC = 0.10%, 95% CI: 0.06 to 0.14) (Supplementary Table 4, Fig. 2A).
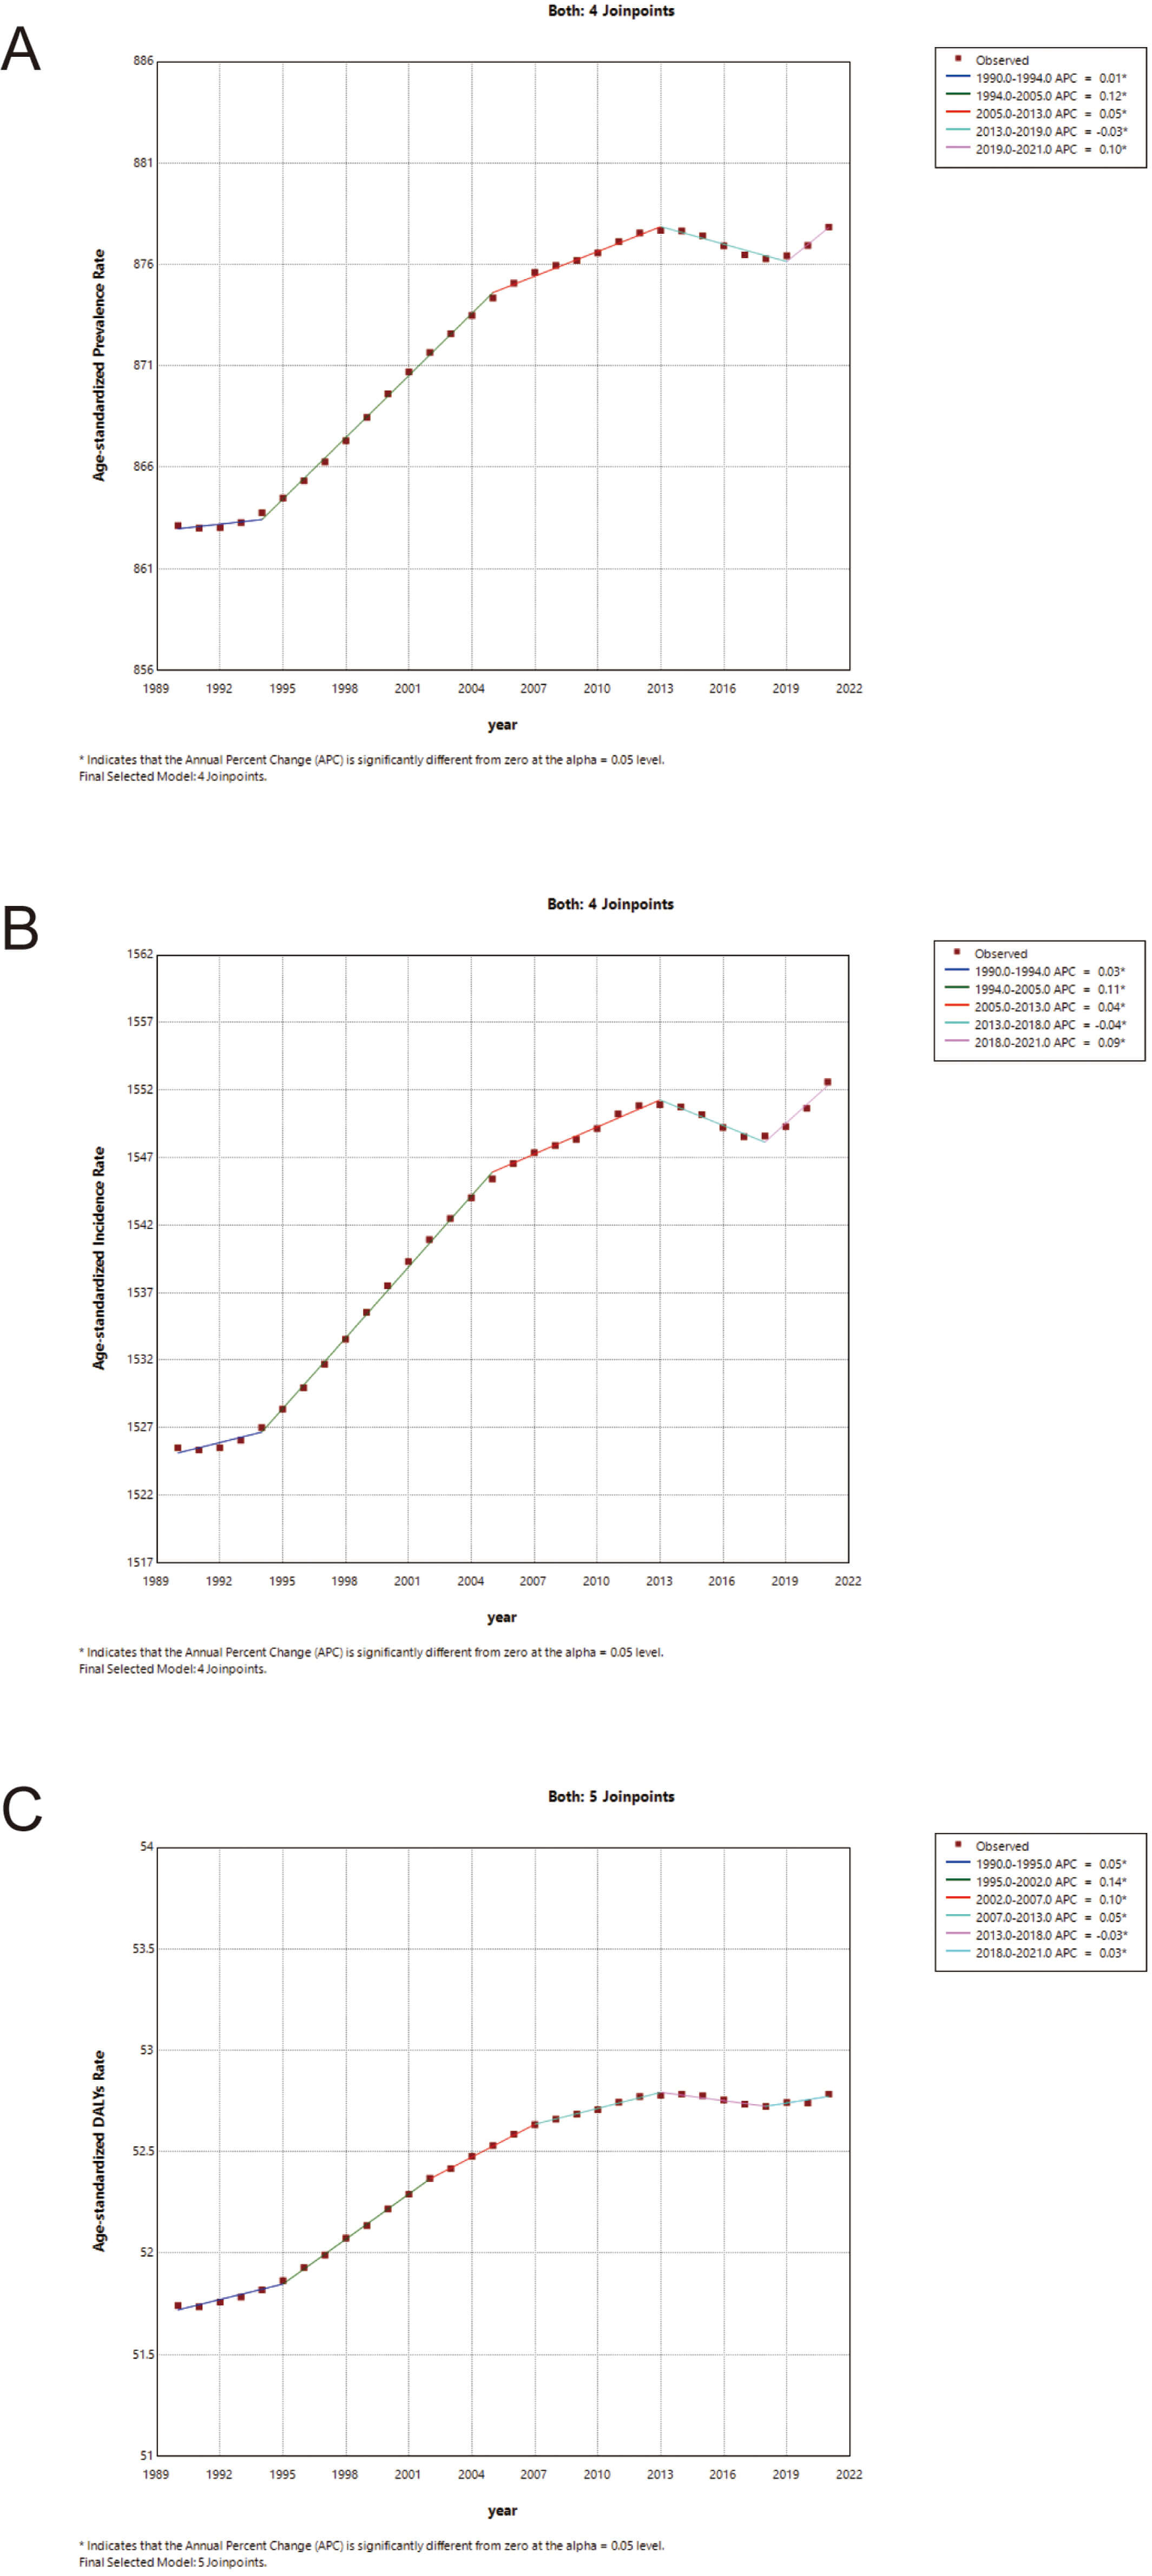 Fig. 2.
Joinpoint regression analysis of age-standardized rates of urticaria among adolescents and young adults in Asia from 1990 to 2021. (A) Trends in age-standardized prevalence rate (ASPR). (B) Trends in age-standardized incidence rate (ASIR). (C) Trends in age-standardized DALYs rate (ASDR). The dots represent observed values, and the colored lines represent the best-fitting segments identified by the joinpoint model. APC denotes the annual percent change for each segment. * indicates that the APC is significantly different from zero at the alpha = 0.05 level. Abbreviation: DALYs, disability-adjusted life years.
Similarly, the ASIR trend was characterized by four joinpoints (five segments). An initial increase occurred from 1990 to 1994 (APC = 0.03%, 95% CI: 0.01 to 0.04), followed by the most robust growth from 1994 to 2005 (APC = 0.11%, 95% CI: 0.11 to 0.12). After a notable downturn from 2013 to 2018 (APC = –0.04%, 95% CI: –0.05 to –0.03), the incidence shifted upward again in the final segment from 2018 to 2021 (APC = 0.09%, 95% CI: 0.07 to 0.11) (Supplementary Table 5, Fig. 2B).
Finally, the ASDR trend involved five joinpoints (six segments). The steepest rise occurred from 1995 to 2002 (APC = 0.14%, 95% CI: 0.13 to 0.15). Following periods of more moderate change, a significant decline was observed from 2013 to 2018 (APC = –0.03%, 95% CI: –0.04 to –0.01), which eventually transitioned into a renewed increase from 2018 to 2021 (APC = 0.03%, 95% CI: 0.01 to 0.06) (Supplementary Table 6, Fig. 2C).
In east Asia, the ASPR per 100,000 population decreased from 757.92 (95% UI: 668.24 to 859.60) in 1990 to 755.03 (95% UI: 666.00 to 855.88) in 2021, with an AAPC of –0.012% (95% CI: –0.012% to –0.012%). The ASIR also declined from 1340.63 (95% UI: 1174.89 to 1518.79) in 1990 to 1335.66 (95% UI: 1170.92 to 1512.77) in 2021, reflecting an AAPC of –0.012% (95% CI: –0.012% to –0.012%). Additionally, the ASDR reduced from 45.79 (95% UI: 30.24 to 65.52) to 45.74 (95% UI: 30.08 to 65.31), with an AAPC of –0.004% (95% CI: –0.005% to –0.003%). The results for central Asia also indicated a declining trend. The AAPCs were –0.013% (95% CI: –0.013% to –0.013%) for prevalence, –0.013% (95% CI: –0.013% to –0.013%) for incidence, and –0.005% (95% CI: –0.008% to –0.003%) for DALYs (Table 1, Fig. 3).
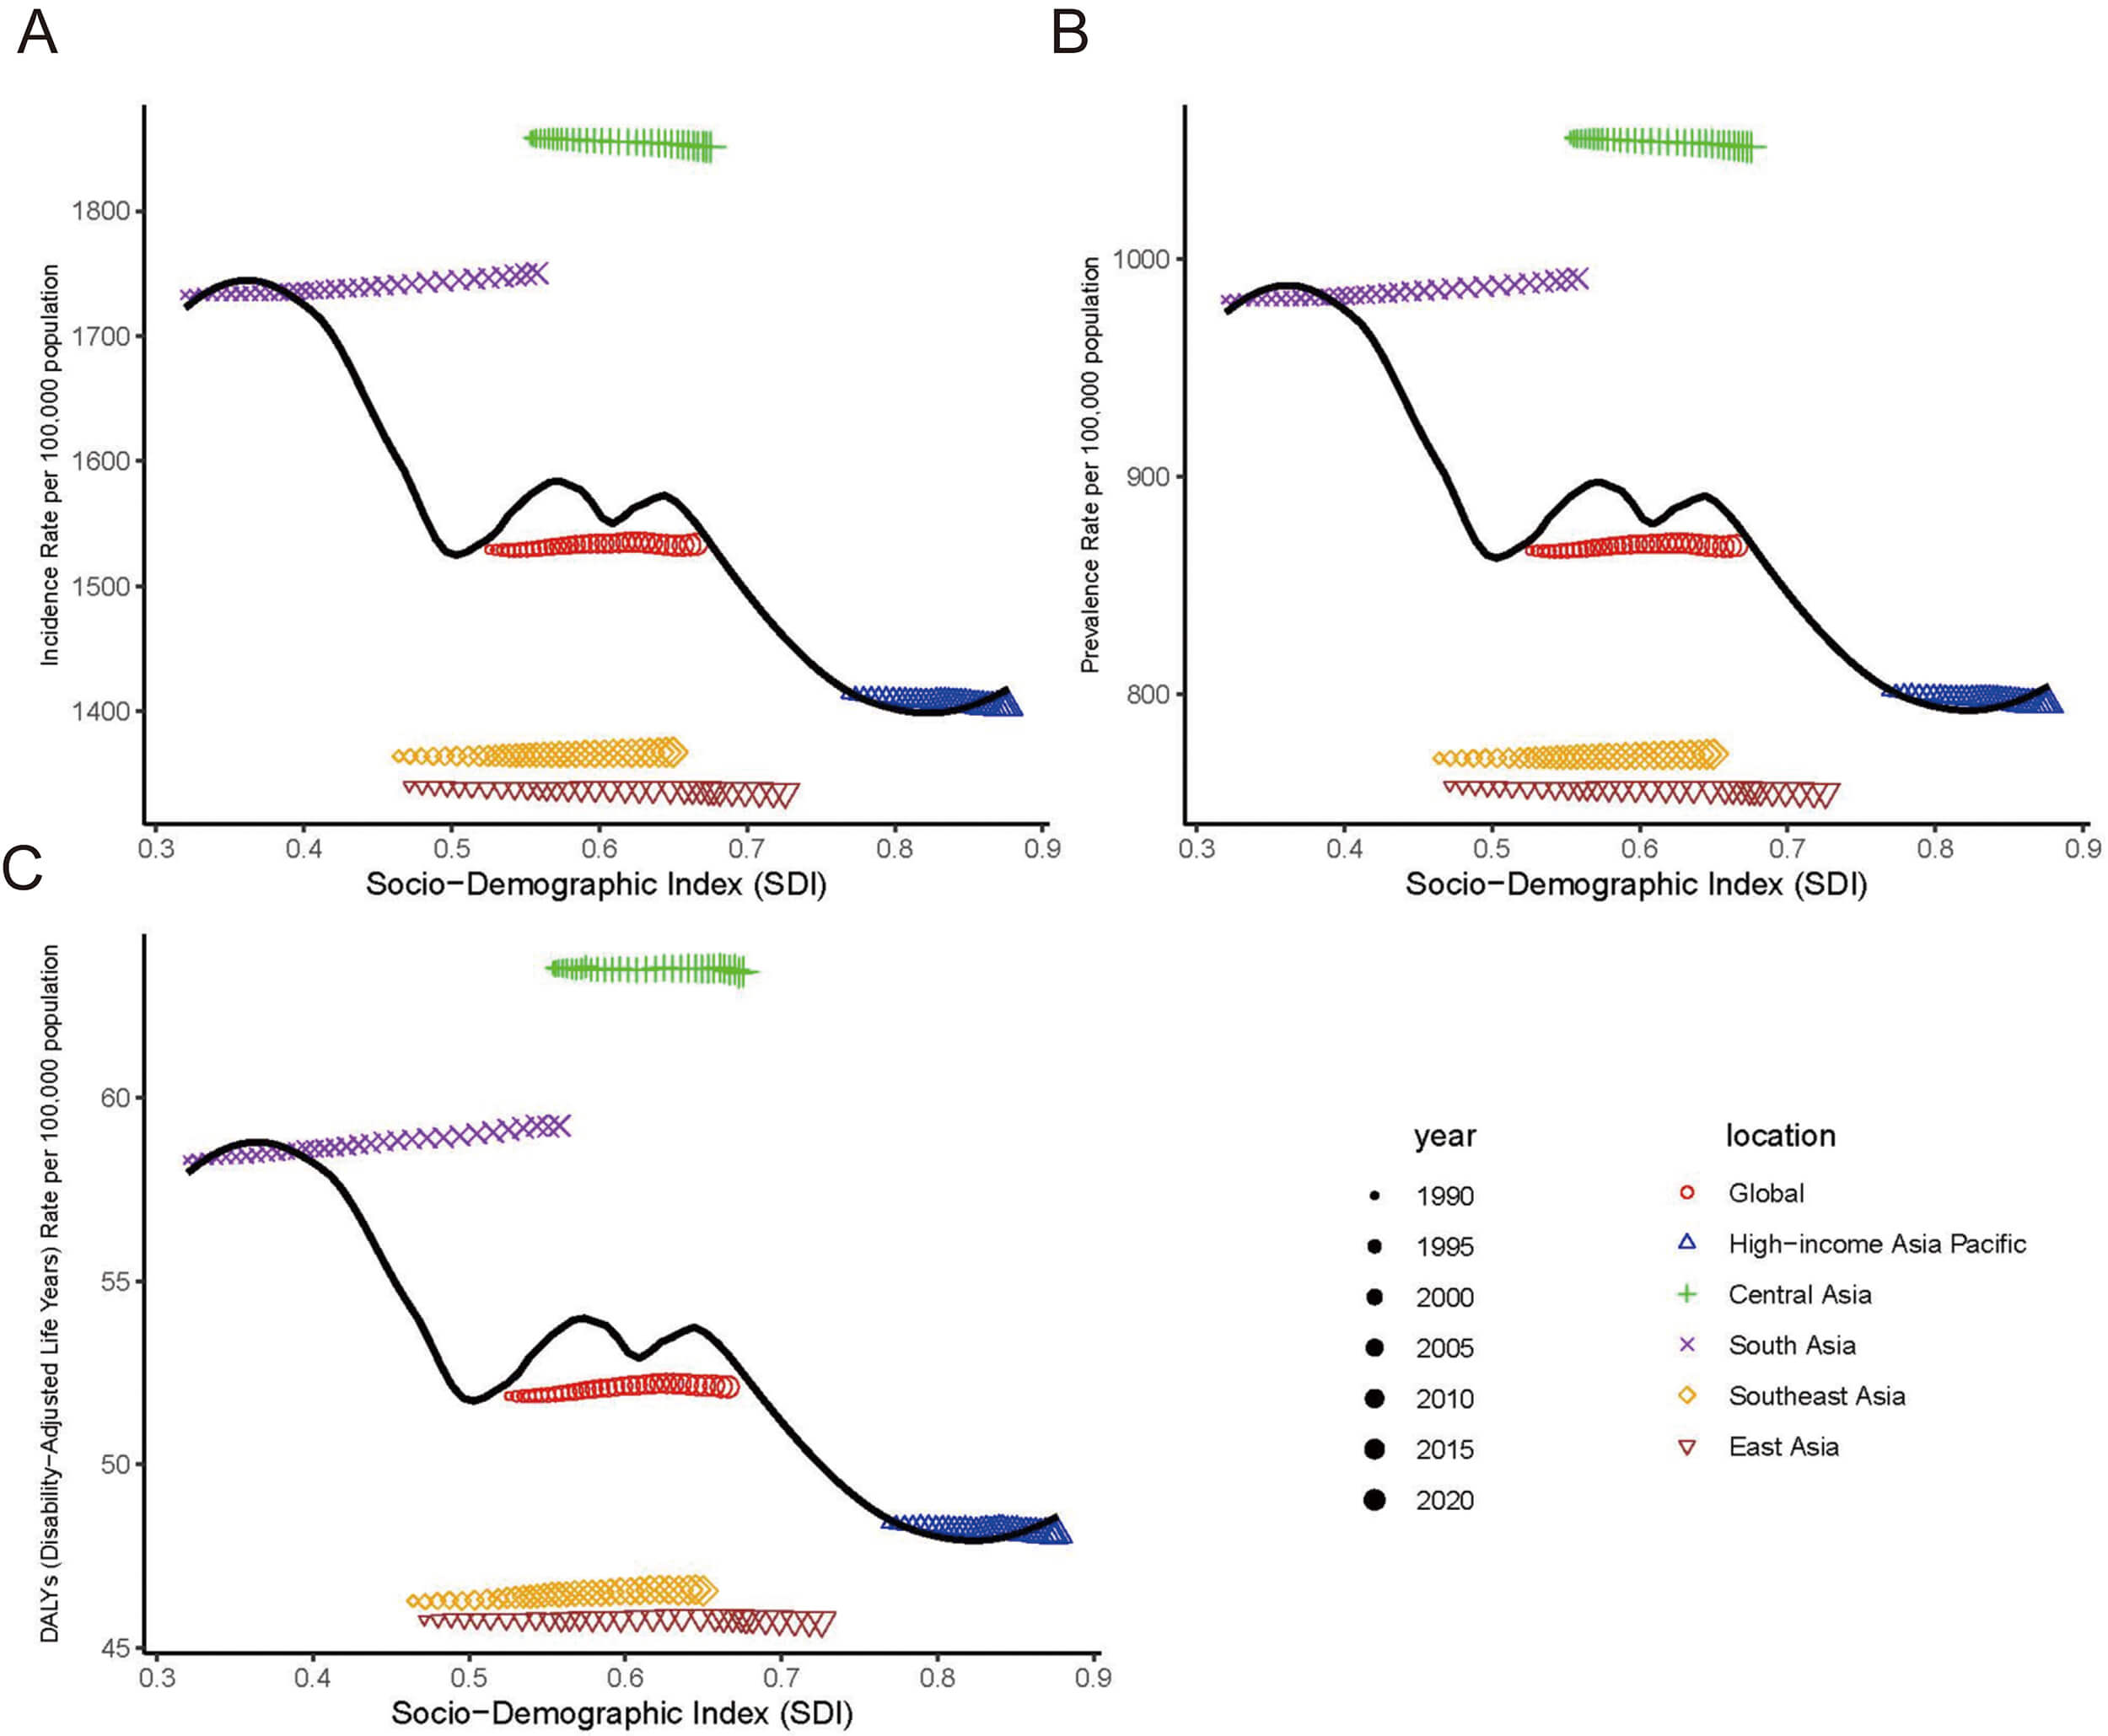 Fig. 3.
Trends in incidence, prevalence, and DALYs rates for adolescents and young adults aged 10–24 years urticaria in 5 regions from 1990 to 2021. This figure demonstrates age-standardised rate of prevalence, incidence and DALYs attributable to urticaria associated with the socio-demographic index (SDI). (A) Incidence rate. (B) Prevalence rate. (C) DALYs rate. The black line represents a nonlinear fit curve based on all data from 1990 to 2021 across all 5 regions. Abbreviation: DALYs, disability-adjusted life years.
The results for central Asia indicated a statistically significant but numerically minimal decline in age-standardized rates. Specifically, the ASIR decreased marginally from 1858.39 (95% UI: 1631.88 to 2128.08) per 100,000 population in 1990 to 1850.83 (95% UI: 1624.93 to 2118.64) in 2021, representing a decrease of only 0.41% (an absolute decrease of 7.56 per 100,000 population) over the 31-year period. Given this minimal change, the burden of urticaria in central Asia remained the highest among all five regions in 2021 (Table 1, Fig. 3). On the contrary, east Asia recorded the lowest incidence rate. South Asia experienced the largest incidence increase (AAPC: 0.032%; 95% CI: 0.032% to 0.033%).
The country-specific distribution of ASRs for urticaria is detailed in Fig. 4 and Supplementary Table 7. In 2021, Nepal (1476.34 per 100,000 population; 95% UI: 1317.43 to 1605.27), Pakistan (1140.70 per 100,000 population; 95% UI: 1055.86 to 1357.49), and Bangladesh (1140.70 per 100,000 population; 95% UI: 1007.53 to 1299.71) reported the highest ASPRs. From 1990 to 2021, the most significant increases in ASPR were observed in Syria (AAPC: 0.041%; 95% CI: 0.040% to 0.043%), the Maldives (AAPC: 0.038%; 95% CI: 0.038% to 0.039%), and Kuwait (AAPC: 0.035%; 95% CI: 0.034% to 0.036%). In contrast, the Republic of Korea (AAPC: –0.043%; 95% CI: –0.043% to –0.043%), Bahrain (AAPC: –0.037%; 95% CI: –0.039% to –0.036%), and Afghanistan (AAPC: –0.033%; 95% CI: –0.034% to –0.031%) showed the largest decreases.
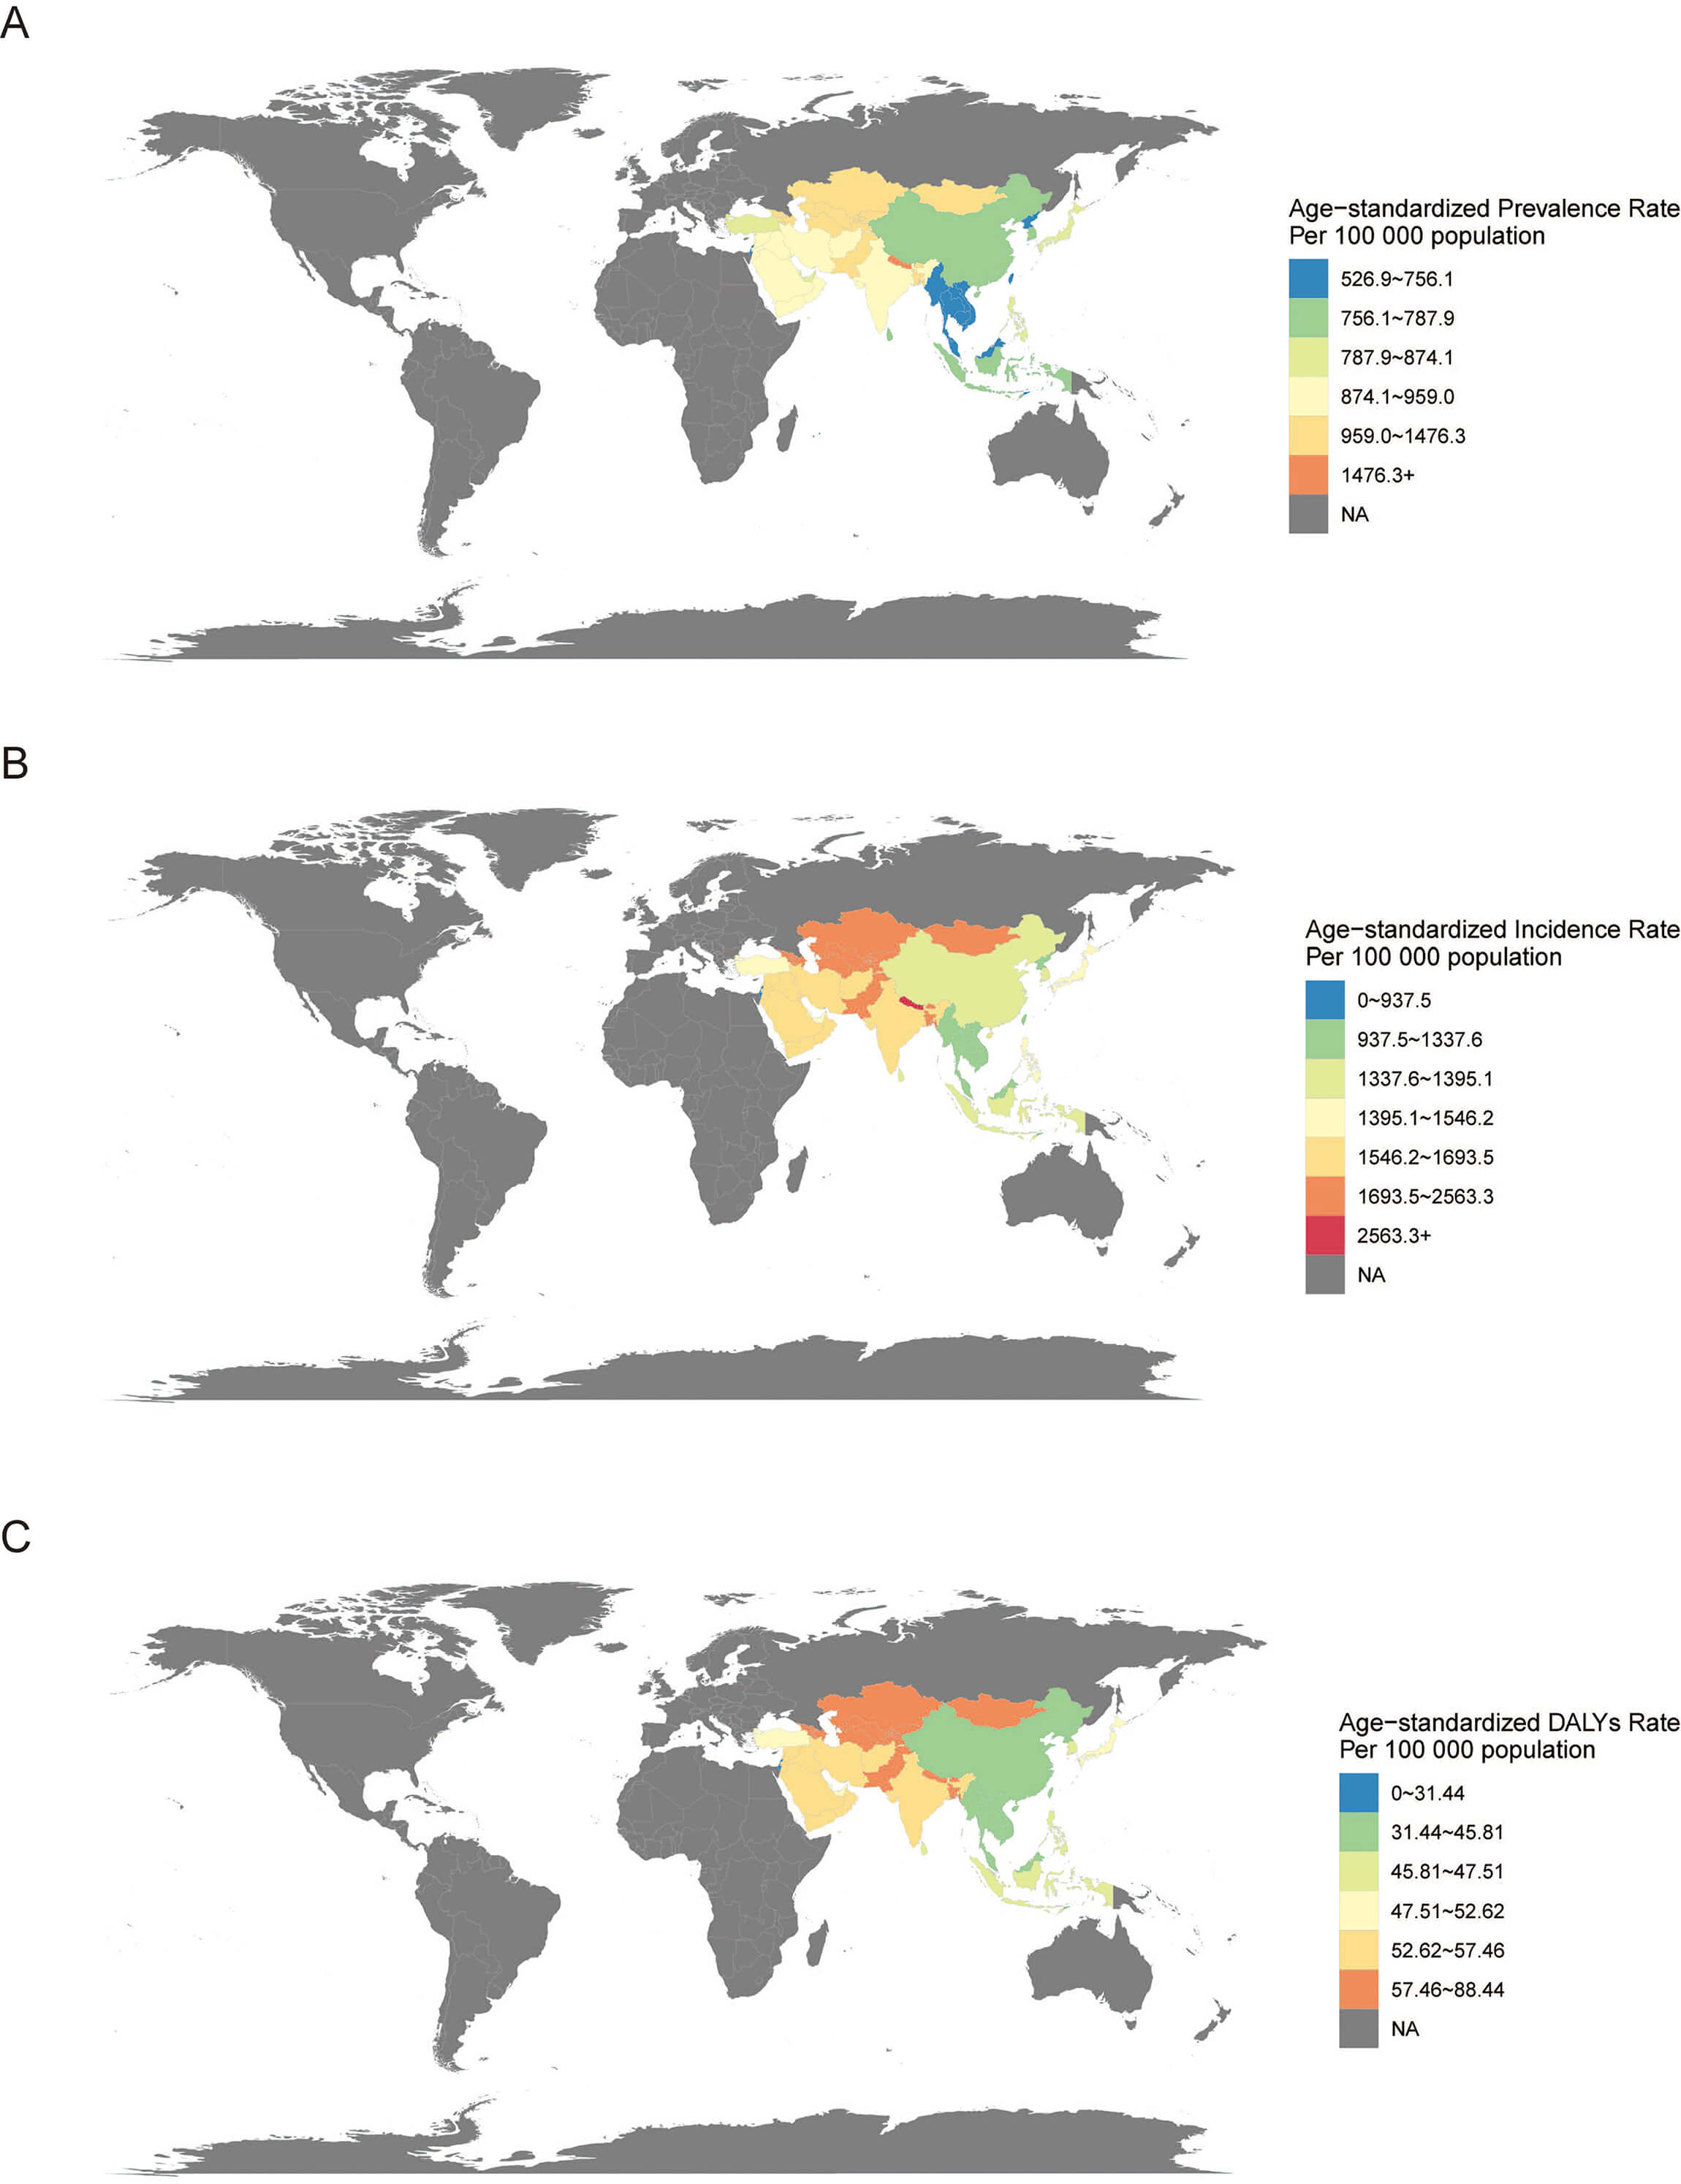 Fig. 4.
Distribution of urticaria among adolescents and young adults in the Asia region in 2021. This figure demonstrates age-standardised rate of prevalence, incidence and DALYs attributable to urticaria. (A) Age-standardized prevalence rate. (B) Age-standardized incidence rate. (C) Age-standardized DALYs rate. Abbreviation: DALYs, disability-adjusted life years.
In 2021, the highest ASIRs were observed in Nepal (2563.35 per 100,000 population; 95% UI: 2274.38 to 2794.79), Bangladesh (2011.38 per 100,000 population; 95% UI: 1780.58 to 2278.57), and Bhutan (1996.36 per 100,000 population; 95% UI: 1767.02 to 2261.61). The most significant increases in ASIR from 1990 to 2021 were recorded in Kuwait (AAPC: 0.042%; 95% CI: 0.041% to 0.043%), the Maldives (AAPC: 0.039%; 95% CI: 0.038% to 0.039%), and Nepal (AAPC: 0.033%; 95% CI: 0.032% to 0.033%). The steepest declines occurred in the Republic of Korea (AAPC: –0.042%; 95% CI: –0.042% to –0.042%), Bahrain (AAPC: –0.036%; 95% CI: –0.038% to –0.035%), and Afghanistan (AAPC: –0.032%; 95% CI: –0.034% to –0.031%) (Supplementary Table 7).
For ASDR, Nepal (88.44 per 100,000 population; 95% UI: 57.09 to 124.89), Pakistan (71.43 per 100,000 population; 95% UI: 47.38 to 101.49), and Bangladesh (68.61 per 100,000 population; 95% UI: 45.24 to 97.19) had the highest rates in 2021. The most significant increases in ASDR from 1990 to 2021 were observed in the Maldives (AAPC: 0.065%; 95% CI: 0.059% to 0.071%), Bangladesh (AAPC: 0.056%; 95% CI: 0.050% to 0.061%), and Nepal (AAPC: 0.053%; 95% CI: 0.048% to 0.057%). In contrast, the Republic of Korea (AAPC: –0.039%; 95% CI: –0.042% to –0.035%), Bahrain (AAPC: –0.028%; 95% CI: –0.033% to –0.023%), and Afghanistan (AAPC: –0.025%; 95% CI: –0.031% to –0.018%) experienced the most substantial reductions (Supplementary Table 7).
The age effect analysis illustrates a clear age-related gradient in the annual percentage change in incidence. During early adolescence, specifically between the ages of 12 and 14, incidence shows a yearly increase. This is reflected in positive local drift values, particularly among females, which were estimated at 0.049 (95% CI: 0.010 to 0.088). Local drift becomes negative beyond the age of 16. The most significant decline is observed in females by the age of 22.5, reaching –0.052 (95% CI: –0.095 to –0.009). The net drift was close to zero across all groups, indicating no significant overall temporal trend in the average annual rate of change, and substantial heterogeneity was present across different age groups (Supplementary Table 8, Fig. 5A).
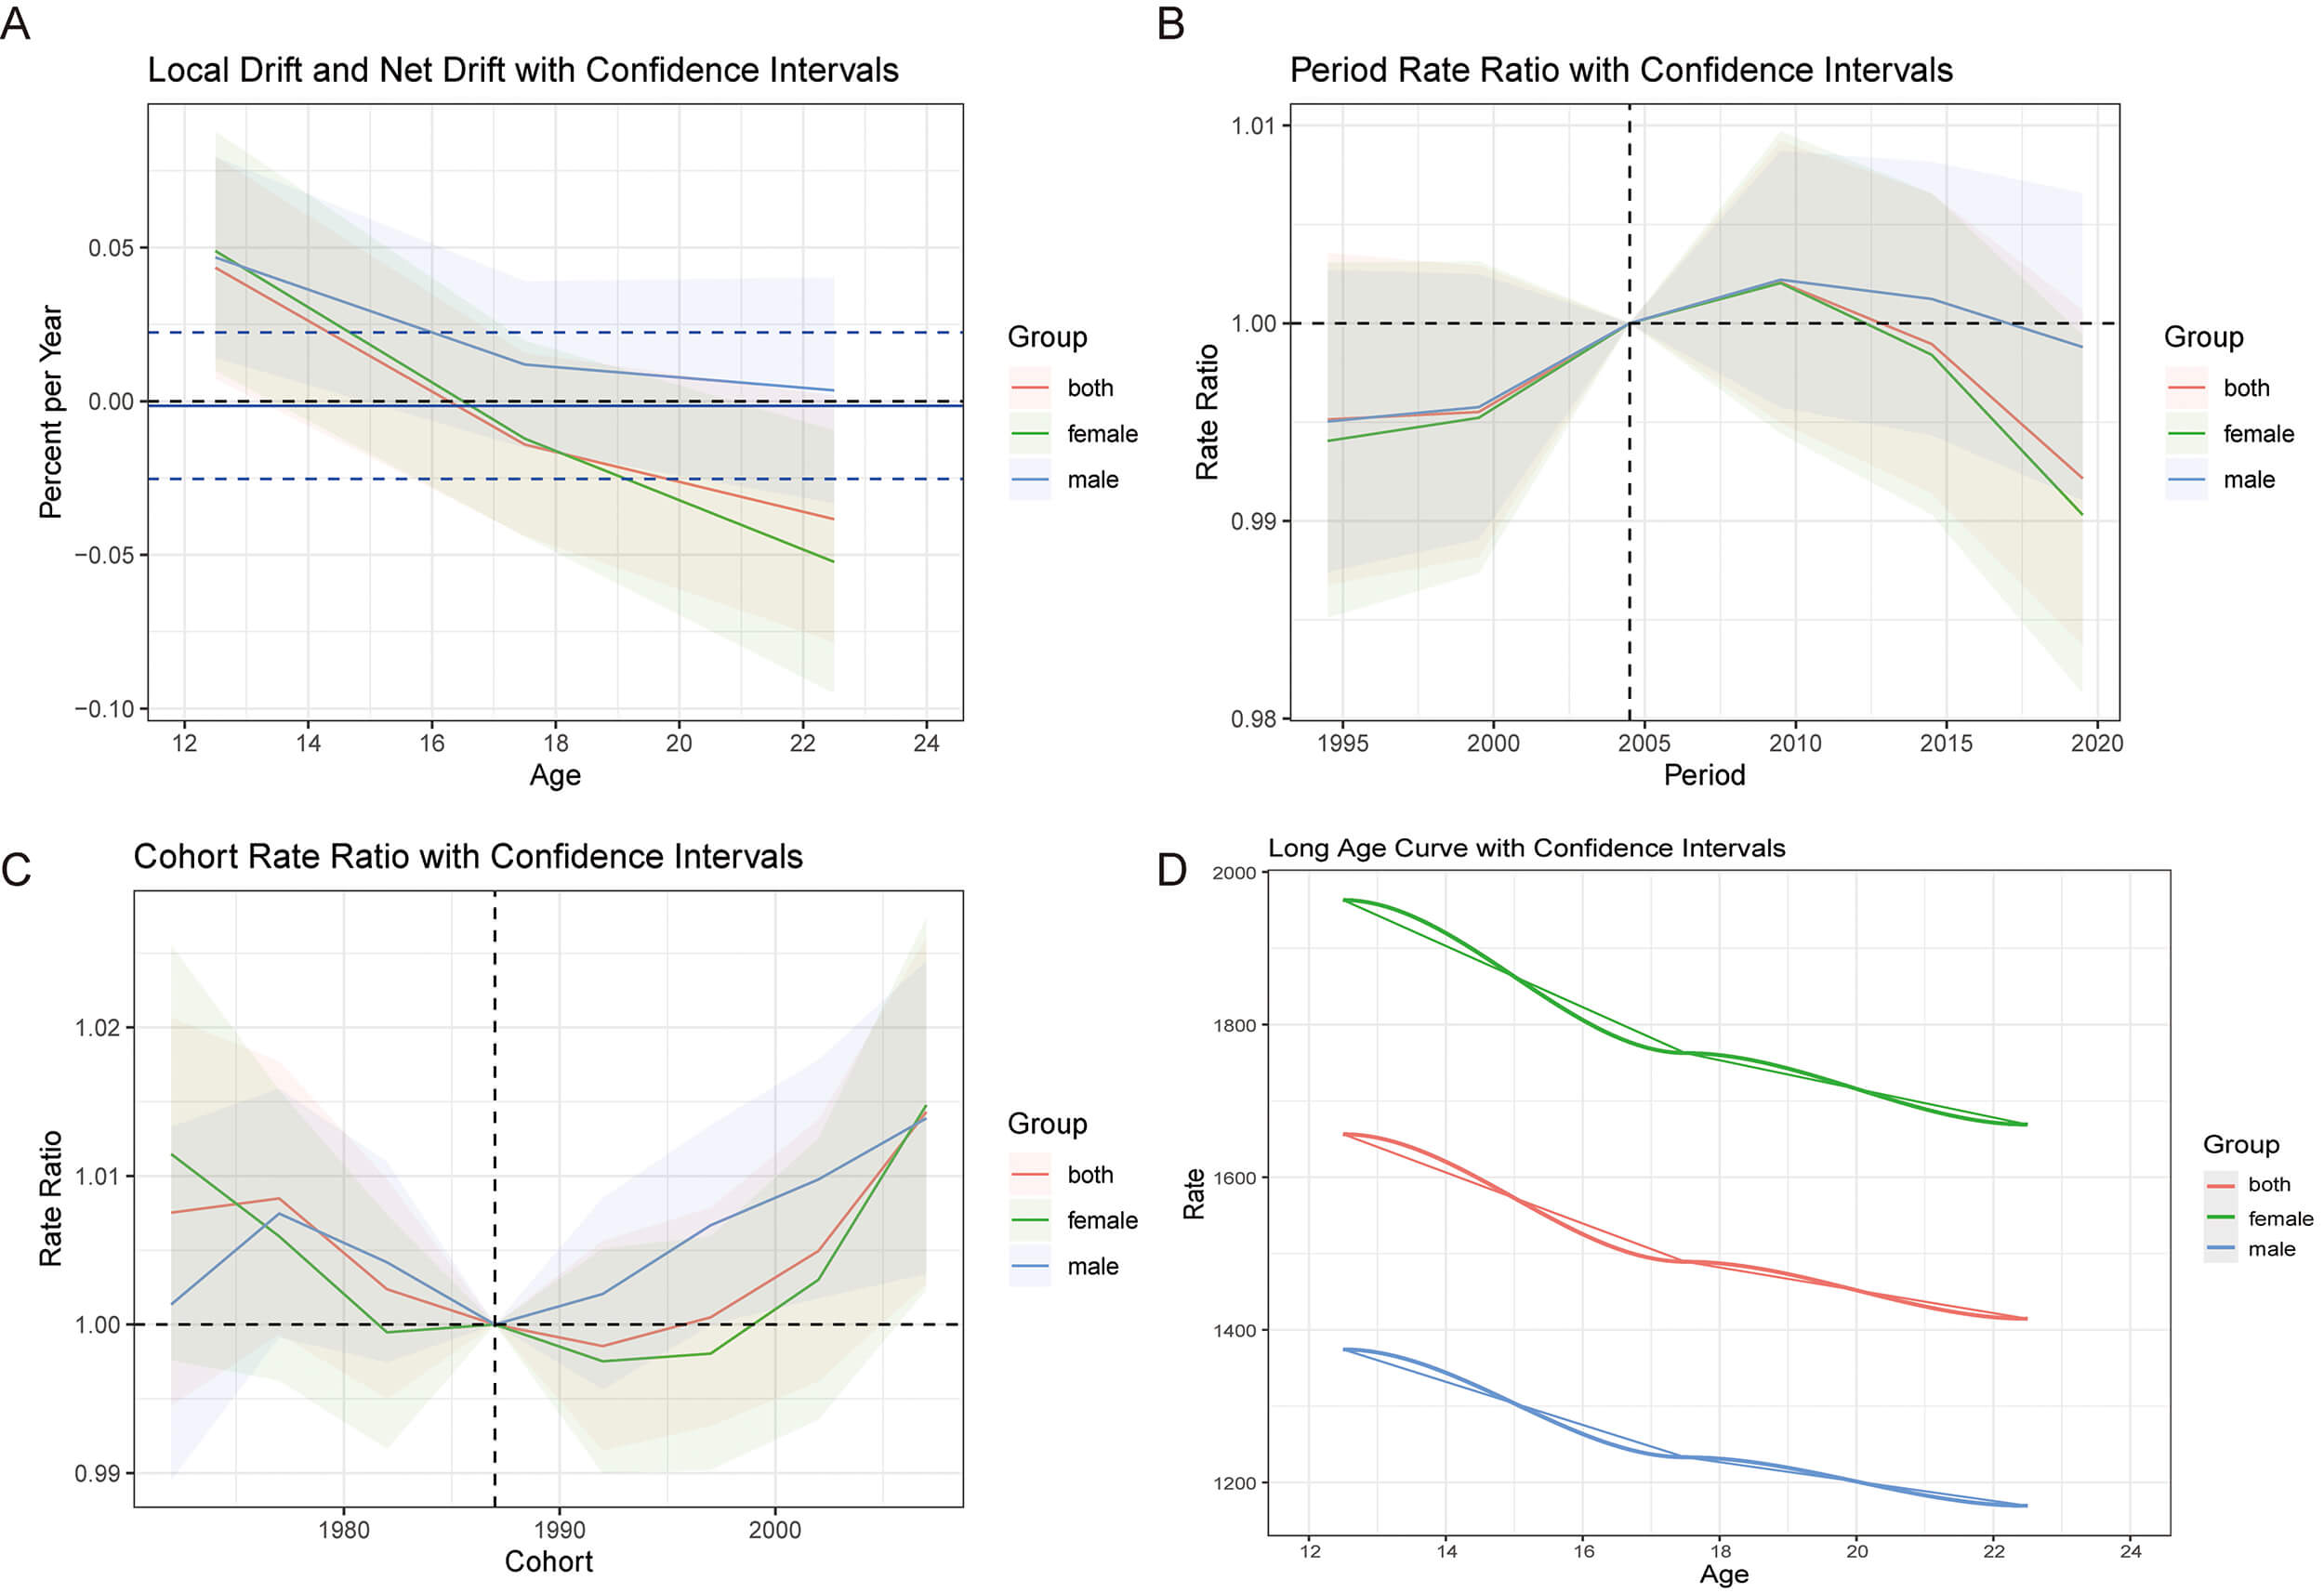 Fig. 5.
Age, period and cohort effects on urticaria for adolescents and young adults aged 10–24 years urticaria in 5 regions from 1990 to 2021. This figure demonstrates the incidence rates of urticaria in Asia. (A) Local and net drift. Local drifts (percent change per year) with 95% CIs are plotted at the midpoints of three consecutive 5-year age groups: 12.5, 17.5, and 22.5 years (labeled as 12, 17, and 22 on the x-axis, respectively). The net drift (dashed line) represents the overall average annual percentage change across the study period. (B) Period effects. RRs with 95% CIs are shown for six successive 5-year calendar periods (1992–1996 through 2017–2021), relative to the reference period of 1992–1996 (assigned RR = 1). The x-axis labels indicate the central year of each period. (C) Cohort effects. RRs with 95% CIs are shown for successive 5-year birth cohorts relative to the reference cohort. The reference cohort (centered on 1990, corresponding approximately to births in 1988–1992) is derived from the age groups and the reference period. The x-axis represents the central birth year of each cohort. (D) Longitudinal age curve. Fitted age-specific incidence rates (per 100,000 population) with 95% CIs are plotted at the midpoints of the 5-year age groups (12.5, 17.5, and 22.5 years). Abbreviations: CI, confidence interval; RR, rate ratio.
The period effect analysis reveals the trends in urticaria among Asians aged 10–24 years. From 1995 to 2005, the rate ratios exhibited a slight increase across all groups. After 2009, a gradual decline was observed, particularly among females. By 2019, the rate ratios had fallen below 1.00 for all groups, indicating a reduced disease burden over time. The confidence intervals were wider at both ends, reflecting greater uncertainty during those periods (Supplementary Table 9, Fig. 5B).
The cohort rate ratio plot revealed a U-shaped trend across birth cohorts. Compared to the reference cohort (approximately 1988–1990), individuals born in both earlier and later cohorts exhibited elevated rate ratios. This pattern was consistent across all groups. Notably, cohorts born after 1995 showed a gradual increase in the rate ratio, a trend that was evident in both sexes, suggesting a potential resurgence in the incidence of urticaria among more recent birth cohorts (Supplementary Table 10, Fig. 5C).
As illustrated in the long age curve, the overall incidence rate of urticaria showed a consistent decline with advancing age. Females consistently exhibited the highest incidence rates across all age groups, followed by the total population and males. For example, at the age of 12, the incidence rate for females reached approximately 1950 per 100,000 population, while it was around 1650 and 1350 per 100,000 population for the total population and males, respectively. By the age of 24, these rates had decreased in all groups, with the disparity between sexes narrowing (Supplementary Table 11, Fig. 5D).
In 1990, the SII for DALY rates due to urticaria was –5.542 (95% CI: –8.534 to –2.550), with a CnI of 0.359. By 2021, the SII had decreased to –6.773 (95% CI: –10.328 to –3.218), and the CnI declined to 0.234. This indicates that the absolute inequality gap (SII) widened by 1.231 DALYs per 100,000 population between 1990 and 2021, while the relative inequality gap (CnI) narrowed by 0.125 (from 0.359 to 0.234, a reduction of approximately 35%). These findings illustrate the well-known phenomenon that absolute and relative inequality can move in opposite directions during periods of shifting disease burden (Supplementary Table 12, Figs. 6,7).
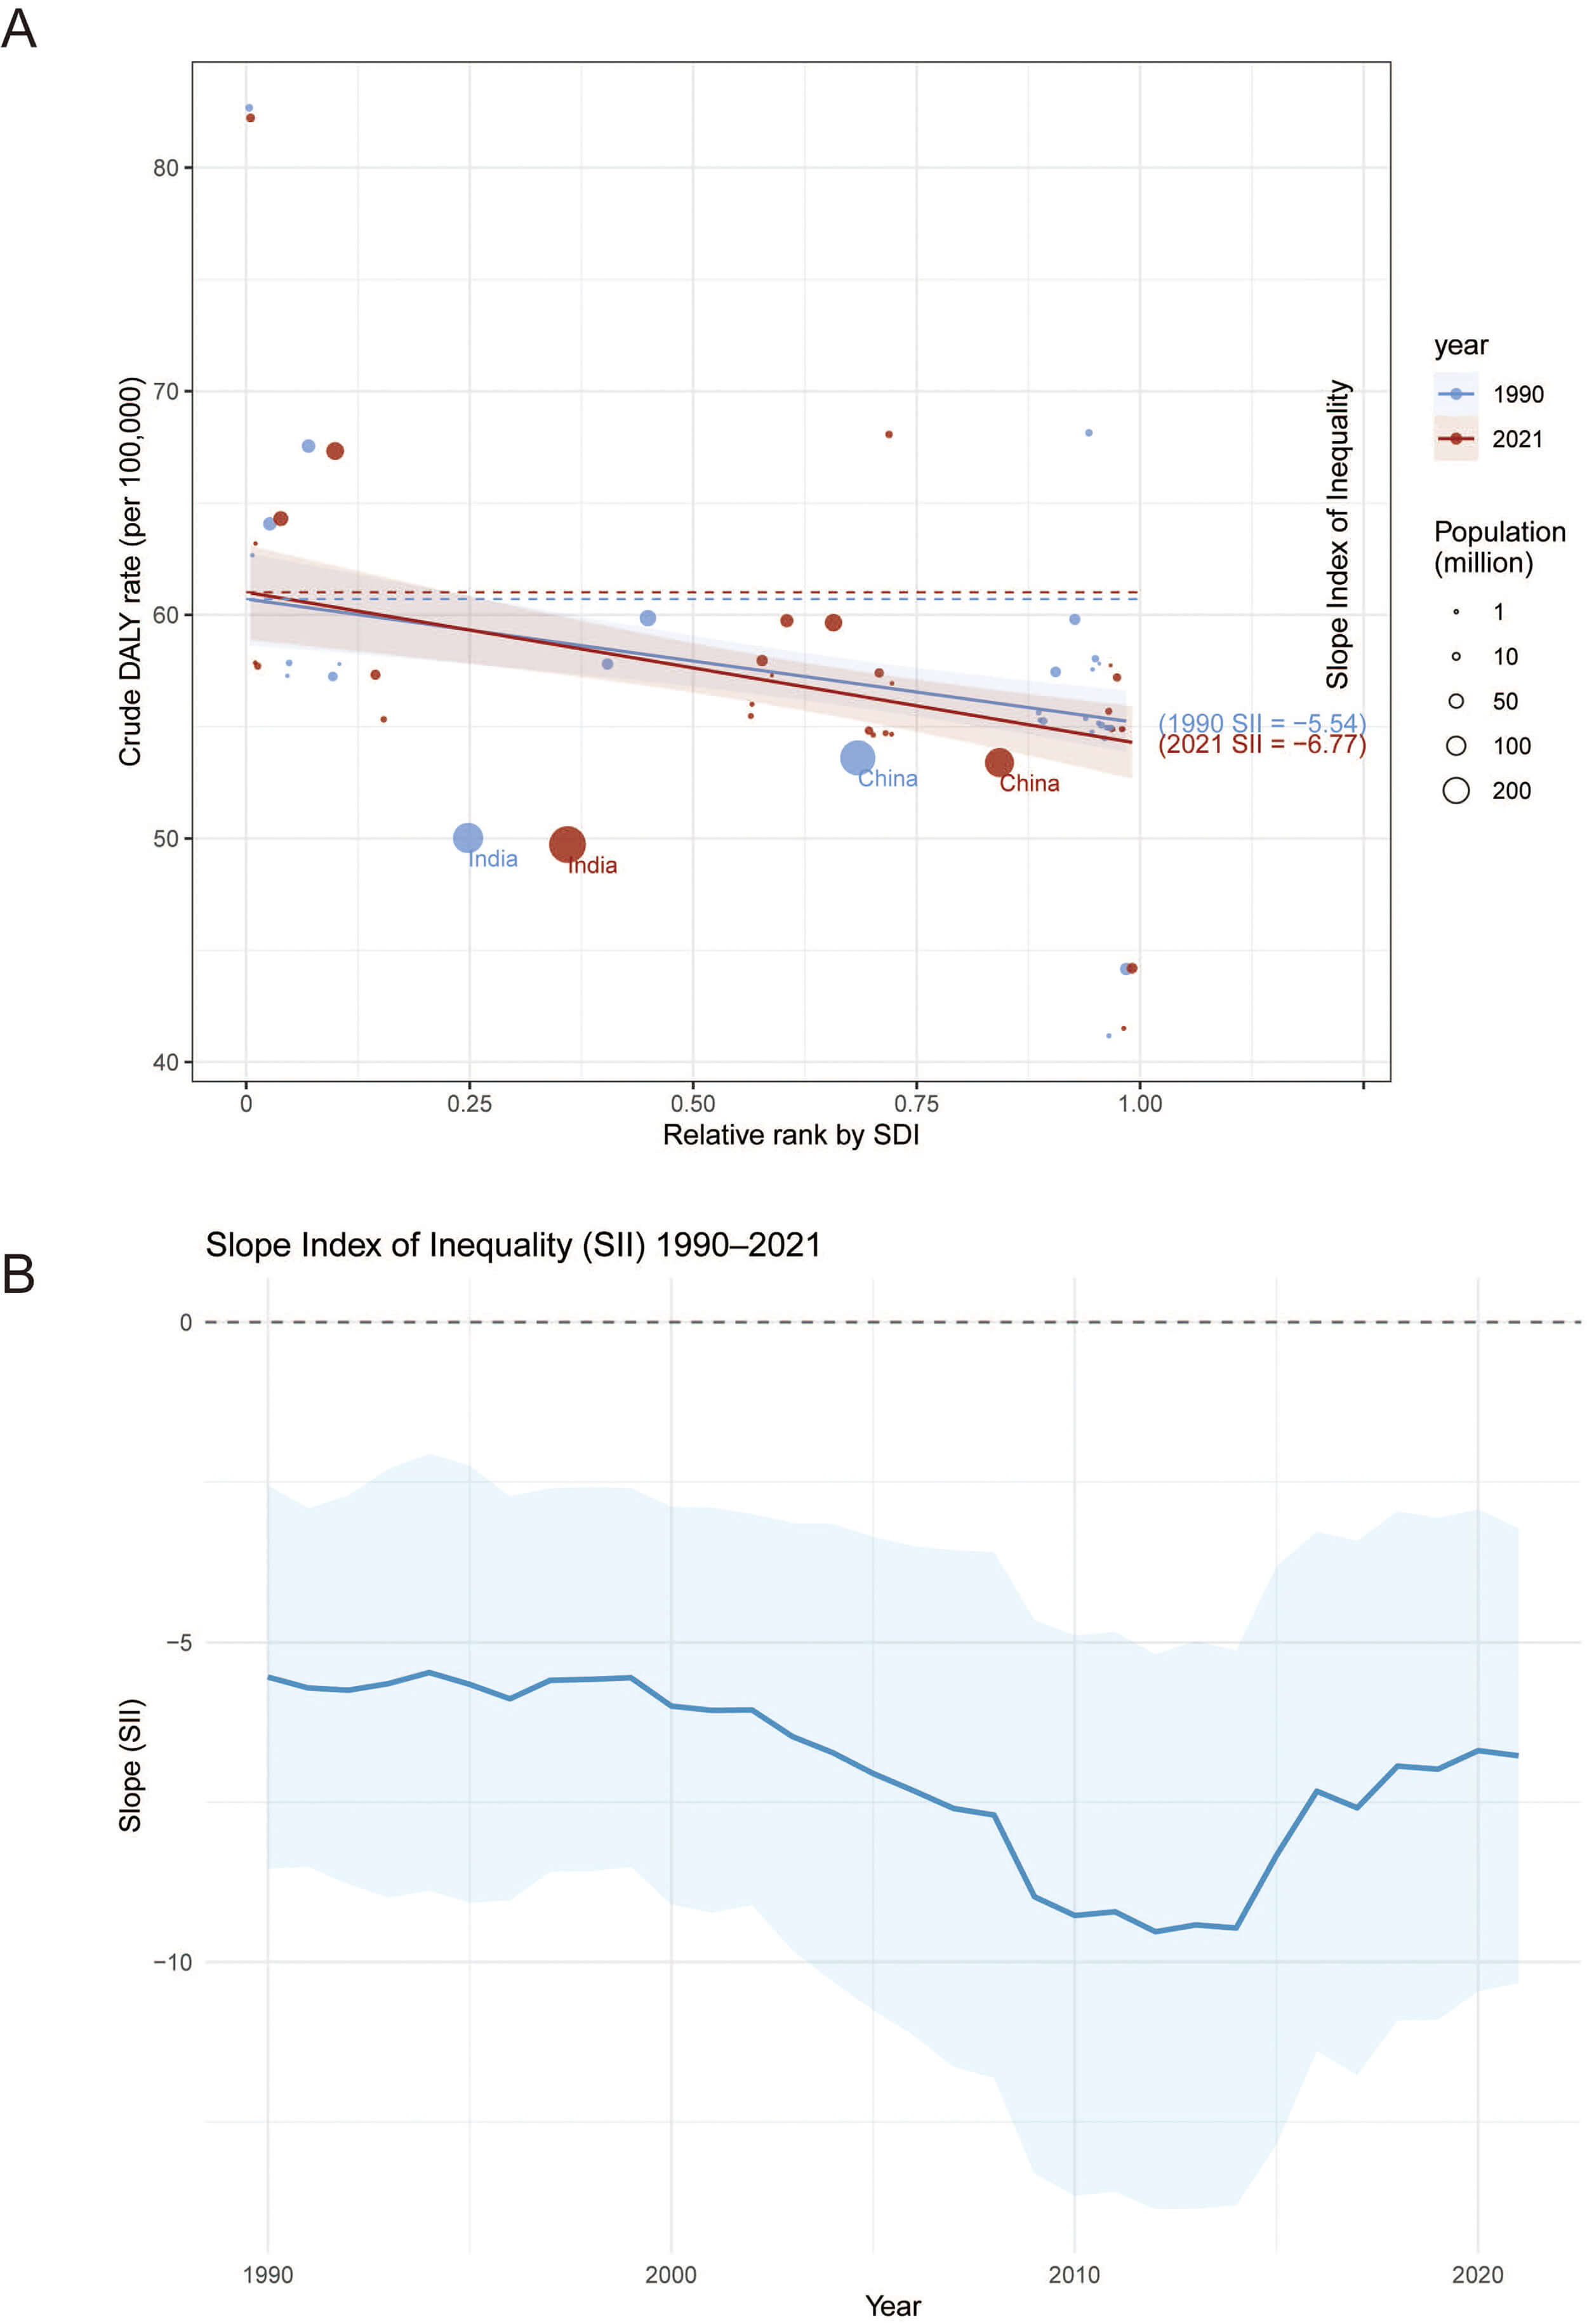 Fig. 6.
Health inequality regression curves on urticaria for adolescents and young adults aged 10–24 years urticaria in 5 regions from 1990 to 2021. (A) Absolute income-related health inequality in the burden of urticaria, illustrated using regression lines. The dashed line indicates the intercept. (B) The trendline illustrates the change in SII from 1990 to 2021. This figure demonstrates health inequality analysis for DALYs of urticaria from 1990 to 2021. The top 2 most populous countries in Asia are highlighted, with red solid points and curves representing 2021 data and blue solid points and curves representing 1990 data. The size of the points reflects the population size of each country or region. Abbreviation: DALYs, disability-adjusted life years.
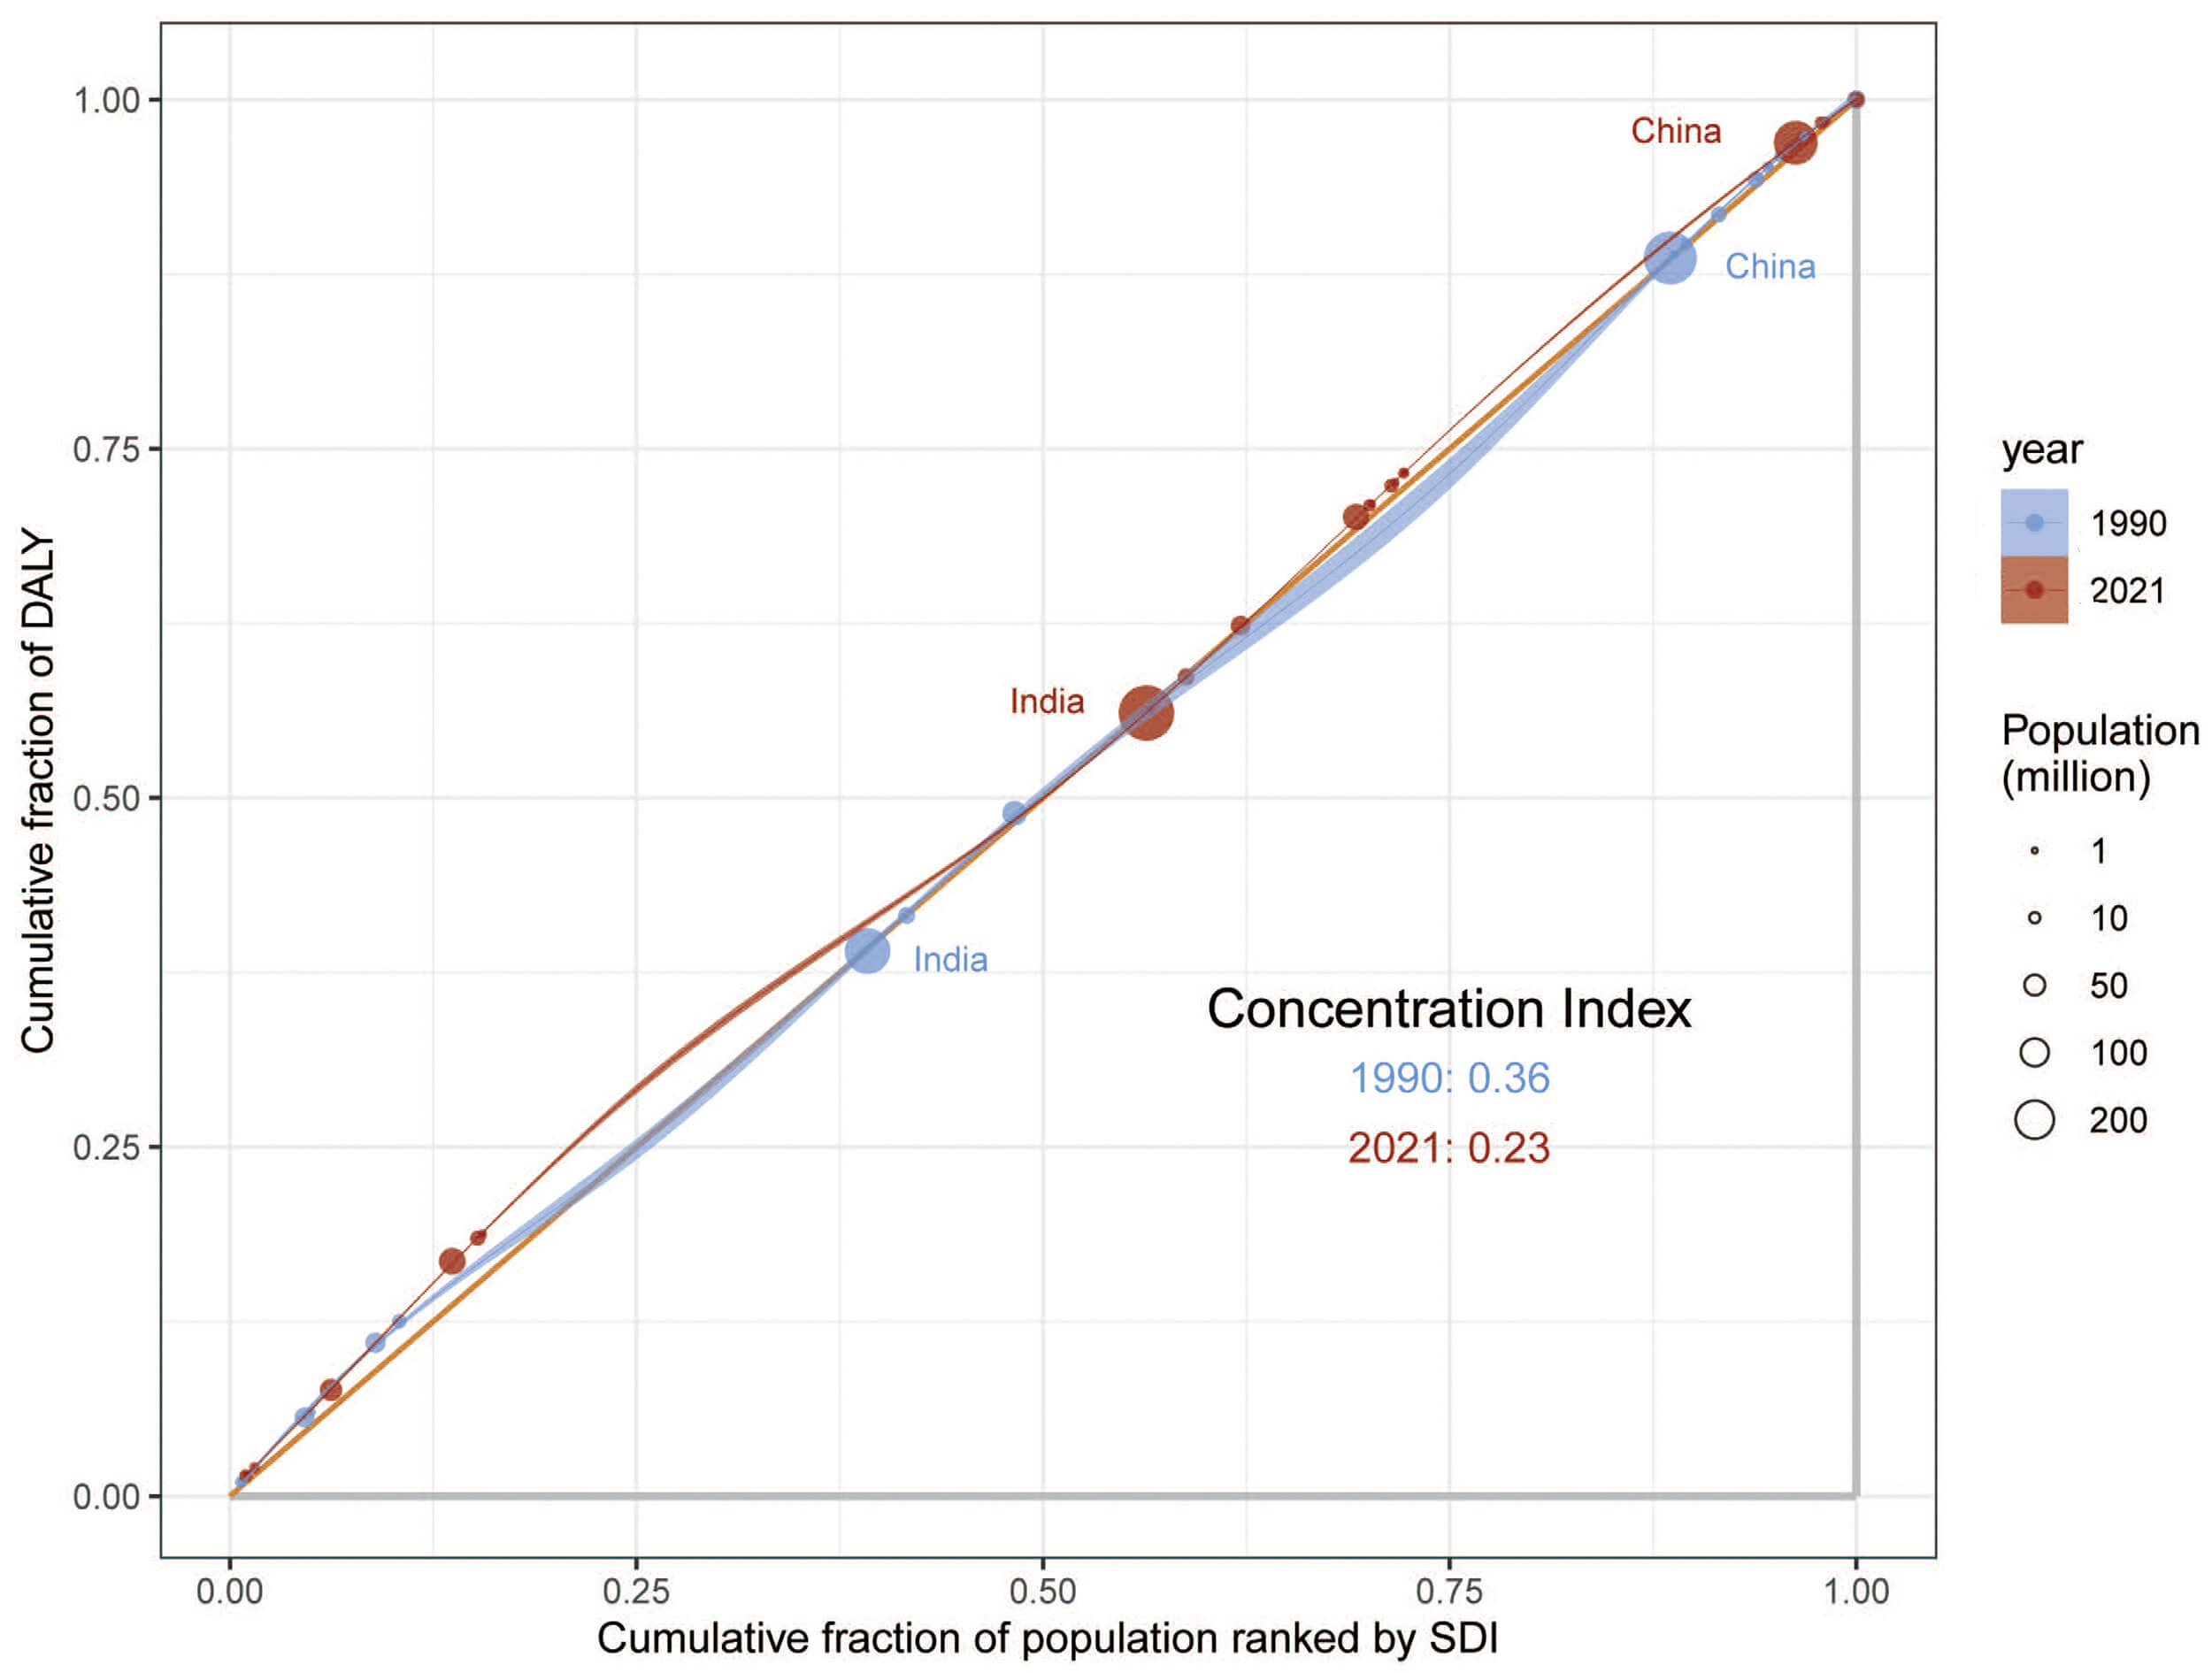 Fig. 7.
Concentration index of relative income-related health inequality in urticaria burden, illustrated by concentration curves from 1990 to 2021.
This apparent contradiction reflects a common phenomenon in public health inequality: Absolute inequality can worsen even as relative inequality improves, particularly when overall disease burden decreases unevenly across socioeconomic groups. In this case, while disease burden reductions were achieved across the region, they were not evenly distributed. Low-SDI countries still bear a disproportionately higher burden.
Between 2021 and 2036, the prevalence of urticaria among individuals aged 10–24 years in Asia is projected to increase across all evaluated metrics. The ASPR in males is estimated to increase from 722.90 to 750.47 (95% prediction interval [PI]: 659.26 to 798.87) per 100,000 population, representing a 3.81% rise. In females, the ASPR is expected to increase from 1041.51 to 1056.53 (95% PI: 990.98 to 1094.90) per 100,000 population, reflecting a 1.44% increase. For both sexes combined, the ASPR is projected to rise by 1.70%, from 877.84 to 892.74 (95% PI: 815.07 to 934.33) per 100,000 population.
A similar upward trend is observed in the ASIR, with projected increases of 1.76% for males (from 1279.04 to 1301.60 (95% PI: 1197.67 to 1358.12) per 100,000 population), 1.16% for females (from 1841.68 to 1863.01 (95% PI: 1764.36 to 1920.17) per 100,000 population), and 1.05% overall (from 1552.60 to 1568.89 (95% PI: 1552.24 to 1592.05) per 100,000 population) during the 15-year period.
The ASDR is expected to exhibit a modest increase, rising from 43.70 to 44.35 (95% PI: 43.42 to 45.29) per 100,000 population in males (1.49%), from 62.40 to 62.58 (95% PI: 61.33 to 63.82) per 100,000 population in females (0.29%), and from 52.78 to 53.42 (95% PI: 51.66 to 54.81) per 100,000 population overall (1.21%) (Supplementary Table 13, Fig. 8).
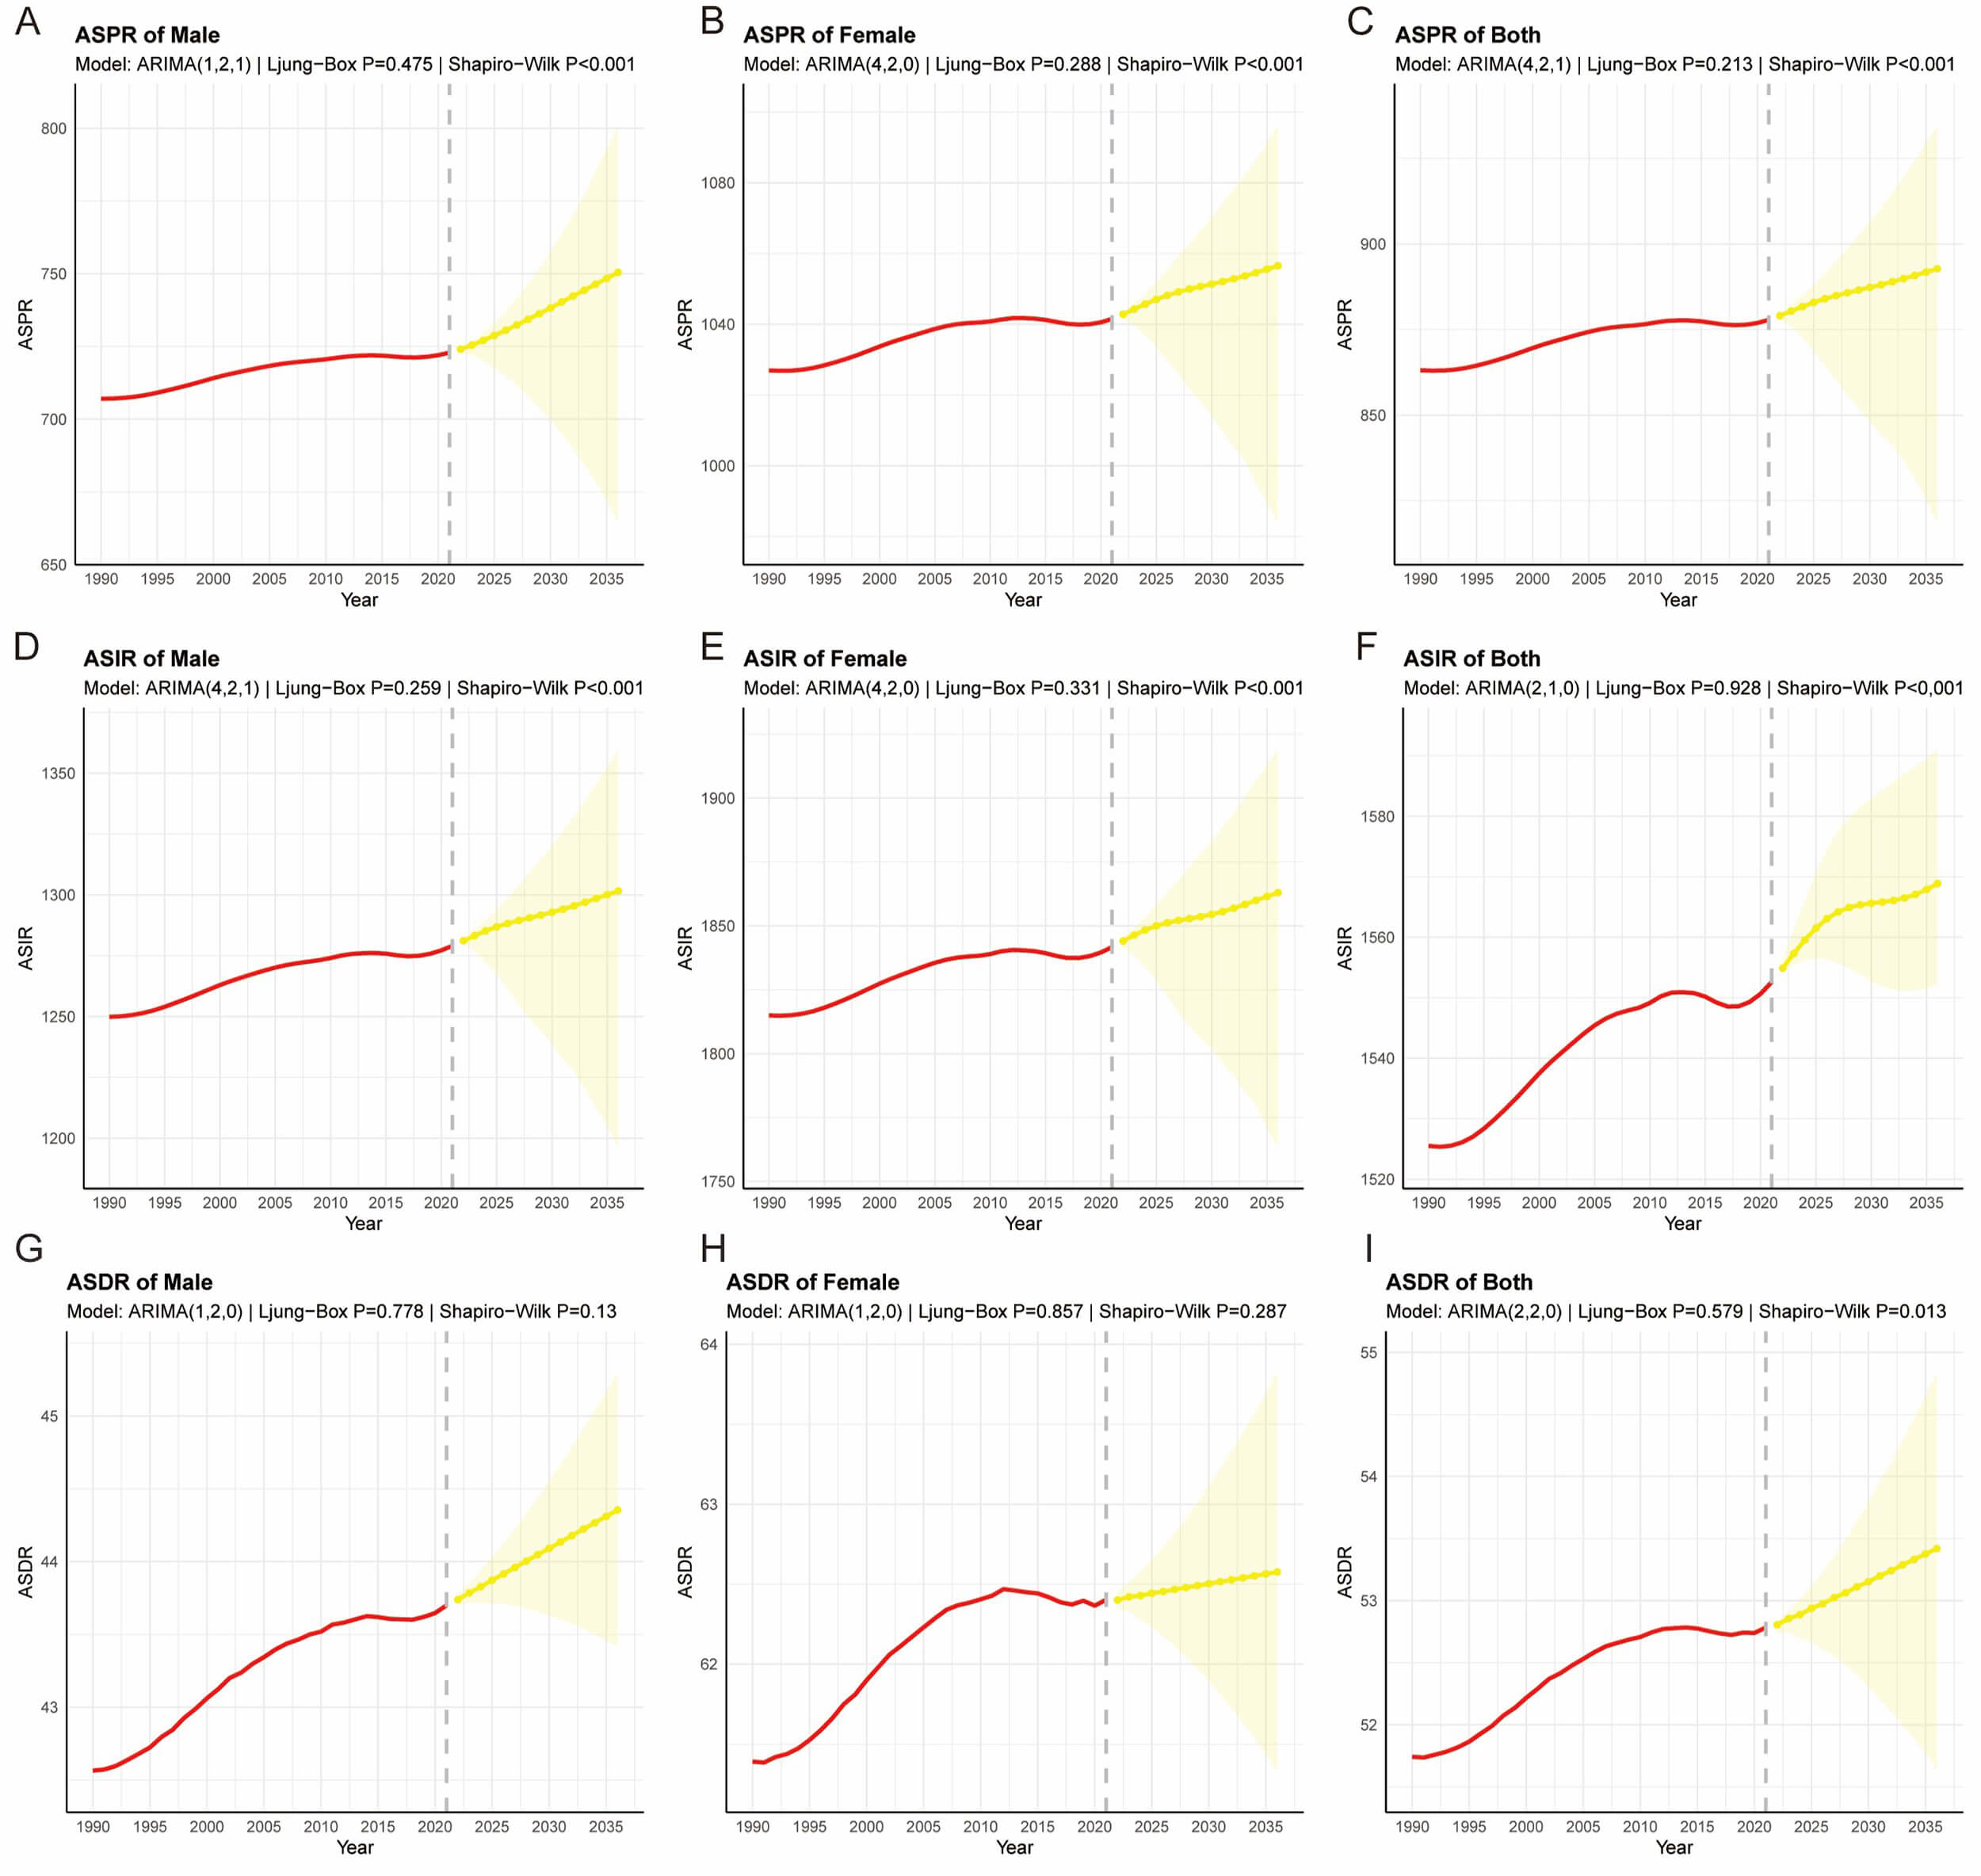 Fig. 8.
The ARIMA model predicts the changes in different age
standardized rates by 2036. (A) ASPR in males; (B) ASPR in females; (C) ASPR in both sexes; (D) ASDR in males; (E) ASDR in females; (F) ASDR in both sexes; (G) ASIR in males; (H) ASIR in females; (I) ASIR in both sexes. This figure demonstrates historical trends and
future trajectories of the ASPR, ASDR, and ASIR in Asia from 1990 to 2036. The
solid red lines represent observed historical data from 1990 to 2021. The dashed
lines indicate the projected trends from 2022 to 2036 based on the optimal ARIMA
models. The yellow shaded areas represent the 95% PIs. Notably, for measures
where residual normality was rejected (Shapiro-Wilk test p
Our study examined the patterns and trends of the burden of urticaria in Asia from 1990 to 2021. The prevalence, incidence, and DALYs of urticaria in 2021 were higher than those recorded in 1990. Furthermore, the ASPR, ASIR, and ASDR increased by 1.6%, 1.7%, and 1.9%, respectively, between 1990 and 2021.
One of the main findings of our study is the higher prevalence of urticaria among women compared to men. As illustrated in previous research in different countries, both acute urticaria and chronic urticaria are more common in women [17]. Several factors, including hormonal differences (such as the menstrual cycle, pregnancy, menopause, and the use of hormonal contraceptives or hormone replacement therapy), genetic predispositions, and environmental exposures, may contribute to the higher prevalence of urticaria observed in women [18, 19, 20]. Immune modulation by hormonal fluctuations, particularly estrogen, is one mechanism underlying women’s heightened susceptibility to autoimmune diseases [21]. Furthermore, the presence of immune-relevant genes on the X chromosome provides a sex-specific genetic basis for the elevated risk observed in our female cohort [22, 23].
The significant difference between incidence and prevalence rates indicates that urticaria is usually short-lived, with frequent emergence of new cases. The burden of urticaria in the age group of 10 to 14 is higher than that in other age groups in Asia. Our findings underscore the importance of considering sex and age differences in urticaria research and early childhood care. Infections are the predominant triggering factors for acute urticaria in children under the age of 18, followed by the use of prescription drugs and food allergies. Infections, medication intake, and food ingestion have also been reported as precipitating factors for chronic urticaria [24]. During infancy and early childhood, the immune system exhibits a T helper cell type 2 (Th2) response bias while regulatory T cell (Treg) function remains immature. This peak burden in early adolescence can be attributed to a lingering Th2-biased immune profile and immature regulatory T cell (Treg) function, which heightens susceptibility to common immunoglobulin E (IgE)-mediated triggers such as infections, medications, and food allergens [25, 26]. Furthermore, the activation of skin mast cells by neurotrophic factors, which is often driven by modern stressors, sleep disruption, and dietary changes, likely exacerbates this vulnerability in younger populations [27, 28]. On the contrary, the gradual decline in immune responsiveness associated with aging explains the lower prevalence observed in older cohorts [29].
Regional variations in urticaria rates across Asia likely reflect a complex interplay of climatic, biological, and socioeconomic factors [30]. Our findings regarding the high incidence in central Asia align with the region’s extreme thermal instability, specifically diurnal temperature fluctuations exceeding 25 °C, which may trigger cutaneous vascular responses [31]. Unlike temperate zones, where allergic disease often follows a typical IgE-mediated progression [32], tropical regions in our study exhibit distinct patterns driven by high humidity and perennial exposure to indoor allergens such as dust mites and moulds [33]. The observed inverse correlation between ambient temperature and incidence suggests that colder conditions may facilitate respiratory viral infections, including adenovirus and influenza, thus increasing post-infectious urticaria cases [34]. The disease distribution is widened by healthcare disparities: While high-SDI regions benefit from robust allergen screening and early antihistamine intervention [35], the burden in low-SDI areas like Nepal may be underestimated due to limited primary dermatology resources [36]. Finally, the youthful demographic structure in central Asia further contributes to the high prevalence rates observed in our data.
Some research indicates that residents of high-SDI countries frequently encounter elevated levels of pollution and allergens, adopt less healthy lifestyles and diets, and have reduced early-life microbial exposure [37]. These factors collectively predispose the immune system to allergic responses, increasing the risk of skin disorders related to allergies. Our findings indicate that the simultaneous deterioration of the SII and improvement in the CnI reveal a complex evolution of urticaria disparities in Asia. The deepened negative SII signifies an exacerbation of absolute inequality, where low-SDI regions are experiencing disproportionately increasing burdens due to persistent healthcare gaps and environmental risks [38]. On the contrary, the declining CnI indicates a reduction in relative inequality, driven by emerging allergy triggers in affluent groups that have partially homogenized disease distribution. This paradox highlights urbanization’s dual impact: While low-SDI regions remain ensnared by legacy health threats, high-SDI groups increasingly face modern environmental risks [39, 40]. Targeted interventions must address this divergence by strengthening access to essential medicines in disadvantaged regions while regulating novel allergens in urbanized areas [41].
Monitoring disease epidemic trends and making predictions constitutes a critical link in disease prevention and control. According to the ARIMA model, the burden of urticaria among individuals aged 10 to 24 years is projected to remain persistently high in the next 15 years [42]. The model further indicates that the ASPR, ASIR, and ASDR of urticaria are all exhibiting an upward trend. However, it is noteworthy that the projected rate of increase for these age-standardized indicators appears to be slowing in some models, suggesting a potential future moderation in the growth of the disease burden. This newly revealed epidemiological pattern suggests that future prevention and control strategies should place greater emphasis on rapid response and personalized treatment.
This study has some limitations that we need to declare. First, while data
sources were adjusted to account for the heterogeneity of different studies and
standardized data in the GBD 2021, these revisions inevitably increased the
uncertainty of analytical data. Second, this study included only Asian patients
aged 10 to 24 years, which undermines external validity by introducing selection
bias through unrepresentative age and geographic sampling. This limitation
restricts the generalizability of burden estimates to global or lifespan
contexts. Third, the ARIMA model may be compromised when confronted with
unforeseen events, and the potential impact of other influential factors may also
be underestimated. Additionally, when employing the ARIMA model for forecasting,
we noted that the residual distributions of some models significantly deviated
from normality (Shapiro-Wilk test, p
In this study, the temporal trends in the prevalence, incidence, and DALYs of urticaria among Asian adolescents and young adults aged 10 to 24 years from 1990 to 2021 were estimated. Over the past three decades, urticaria demonstrated significant increases in prevalence, incidence, and DALYs across the region. Females exhibited higher morbidity rates than males. Projections indicate that this upward trend will persist through 2036. Age-period-cohort modeling revealed that incidence slightly declined with advancing age, while environmental pollution and inadequate healthcare resources contributed to elevated disease burden. Health inequality assessments indicated an expanded overall incidence base. The inequitable distribution of medical resources exacerbated the burden in low-SDI regions.
• In the study, the burden of urticaria among adolescents and young adults in Asia from 1990 to 2021 was comprehensively evaluated, providing a long-term perspective.
• Various advanced statistical models were employed, such as the Joinpoint regression and age-period-cohort models, to deeply analyze disease trends and disentangle underlying factors.
• This paper quantifies health inequalities related to socioeconomic development using methods like the slope index of inequality, revealing disparities in disease burden.
• The ARIMA model used in this study could only be used to project the disease burden for the next 15 years, which may not be sufficient for long-term strategic planning.
• Due to the absence of multi-center domestic data, the robustness and generalizability of the findings in specific countries are reduced.
All data included in this study are available from the corresponding author upon reasonable request.
YZ and SJY conceived and designed the study, and supervised the work. SJY contributed to the original idea. YZ acquired, analyzed, and interpreted the data, including data processing, model construction, bioinformatics analysis, statistical analysis, table and figure generation, and drafted the manuscript. Both authors contributed to the important editorial changes in the manuscript. Both authors read and approved the final manuscript. Both authors have participated sufficiently in the work and agreed to be accountable for all aspects of the work.
Not applicable.
We sincerely thank the Institute for Health Metrics and Evaluation at the University of Washington, the Global Burden of Disease collaborators, and all staff who provided data for this study.
This research was funded by grants from Nantong Commission of Health (MS2024003), Jiangsu Provincial Research Hospital (YJXYY202204), and Jianghai Talents Project of Nantong City (2022-III-610).
The authors declare no conflicts of interest.
Supplementary material associated with this article can be found, in the online version, at https://doi.org/10.31083/BJHM54058.
References
Publisher’s Note: IMR Press stays neutral with regard to jurisdictional claims in published maps and institutional affiliations.