


1 Department of Endocrinology and Metabolism, Quzhou Municipal People’s Hospital, 324000 Quzhou, Zhejiang, China
2 Wound Dressing Clinic, Quzhou Municipal People’s Hospital, 324000 Quzhou, Zhejiang, China
3 Department of Nursing, Quzhou Municipal People’s Hospital, 324000 Quzhou, Zhejiang, China
4 Department of Urology, Quzhou Municipal People’s Hospital, 324000 Quzhou, Zhejiang, China
5 Department of Geriatrics, Quzhou Municipal People’s Hospital, 324000 Quzhou, Zhejiang, China
Abstract
The incidence of hyperuricemia is increasing globally, and febuxostat is a commonly used therapeutic agent. Investigating the relationship between febuxostat therapy and cardiovascular events in patients with hyperuricemia is of significant clinical value. This study aimed to construct a cardiovascular event prediction model for patients with hyperuricemia treated with febuxostat and to analyze factors associated with cardiovascular events, to provide a basis for clinical risk management.
This single-center retrospective cohort study enrolled patients with hyperuricemia who were treated with febuxostat at Quzhou Municipal People’s Hospital between January 2021 and January 2024 and were followed up at 3, 6, and 12 months after treatment. Baseline information, including age, body mass index, and medical history, was collected. Univariate and multivariate analyses were performed using binary logistic regression to identify influencing and predictive factors, and a cardiovascular event risk prediction model was established. The predictive performance and clinical applicability of the model were evaluated using nomograms, receiver operating characteristic (ROC) curves, calibration curves, and decision curve analysis (DCA).
A total of 700 patients with hyperuricemia receiving febuxostat were included, and the incidence of cardiovascular events during follow-up was 19.0%. Multivariate logistic regression analysis identified age (odds ratio [OR] = 1.05), prior hypertension (OR = 5.10), and body mass index (BMI, OR = 1.22) as independent predictors of cardiovascular events. Based on these variables, the established prediction model demonstrated good discriminatory ability, with a high area under the curve (AUC). The AUC of the nomogram model was 0.80 (0.74–0.85) in the training set and 0.78 (0.69–0.87) in the validation set. The calibration curve showed good agreement (Hosmer-Lemeshow test, p > 0.05). Decision curve analysis indicated a significant net clinical benefit.
The cardiovascular event prediction model developed in this study demonstrates good predictive performance and may serve as a useful clinical tool for cardiovascular risk assessment in patients with hyperuricemia. Age, BMI, and prior hypertension are important independent risk factors for cardiovascular events in patients with hyperuricemia. Future multicenter, long-term prospective studies are warranted to further validate the generalizability of this model and the cardiovascular safety of febuxostat treatment.
Keywords
- hyperuricemia
- febuxostat
- cardiovascular diseases
- retrospective studies
Hyperuricemia is a metabolic disorder caused by abnormal purine metabolism or impaired uric acid excretion. Its prevalence has been increasing worldwide, particularly in the context of population aging and lifestyle changes. Consequently, hyperuricemia has emerged as a significant global public health concern [1, 2]. Accumulating evidence indicates that hyperuricemia is not only closely associated with the development of gout but is also significantly linked to the occurrence and progression of hypertension, diabetes, chronic kidney disease, and cardiovascular events [3]. Within the cardiovascular system, elevated uric acid levels may increase the risk of cardiovascular events through multiple pathophysiological mechanisms, including increased oxidative stress, inflammatory activation, endothelial dysfunction, and accelerated atherosclerosis [4].
Febuxostat is a selective xanthine oxidase inhibitor that effectively lowers serum uric acid levels by suppressing uric acid production. In recent years, it has been widely applied in the management of hyperuricemia and gout [5]. Compared with the conventional agent allopurinol, febuxostat has demonstrated certain advantages in renal protection and cardiovascular-related outcomes [5, 6]. However, according to a safety warning issued by the U.S. Food and Drug Administration, the cardiovascular safety of febuxostat in patients with hyperuricemia remains a matter of concern [7]. Several studies have suggested that febuxostat therapy may be associated with an increased risk of cardiovascular mortality, although findings remain inconsistent across different populations and follow-up periods [8, 9]. Therefore, exploring the relationship between febuxostat treatment and cardiovascular events in patients with hyperuricemia and developing a reliable risk prediction model for this population are of great clinical and scientific relevance.
In this study, patients with hyperuricemia who attended Quzhou Municipal People’s Hospital and received febuxostat therapy were enrolled as the study population. A 12-month follow-up period was conducted after treatment initiation to assess the occurrence of cardiovascular events. Potential risk factors were systematically evaluated using statistical modeling, and a cardiovascular event prediction model was constructed to provide evidence-based reference for clinical decision-making and facilitate early identification and intervention in high-risk patients.
This was a single-center retrospective cohort study involving patients with hyperuricemia who were treated with febuxostat at Quzhou Municipal People’s Hospital between January 2021 and January 2024. The primary objective of this study was to construct a predictive model for cardiovascular events in patients with hyperuricemia receiving febuxostat therapy. The primary outcome measure was the occurrence of cardiovascular events. Sample size estimation was performed according to the “events-per-variable” principle for predictive models. Assuming approximately 5 independent variables would be retained in the final multivariate model, an events-per-variable (EPV) value of 10 was applied to ensure adequate statistical power, requiring at least 50 endpoint events. Based on clinical experience and the high-risk characteristics of the study population, the incidence of cardiovascular events was estimated at approximately 20%. With a training set proportion of 0.7, a minimum of 250 patients were required for the training cohort. After accounting for an anticipated 10% rate of invalid samples, the minimum total sample size was calculated to be 397 patients.
All patients were followed for 12 months, with scheduled follow-up assessments at 3, 6, and 12 months. All included patients completed the full 12-month follow-up period, with no loss to follow-up and no death from non-cardiovascular causes during the study period. The primary outcome was the occurrence of cardiovascular events during follow-up. Cardiovascular events included myocardial infarction (MI), stroke, heart failure (HF), peripheral vascular disease (PVD), unstable angina, or other acute coronary syndromes (ACS).
The inclusion criteria were as follows: (1) age between 18 and 80 years; (2)
receipt of standard treatment or intervention measures involved in this study
with complete baseline clinical data; (3) fulfilment of the diagnostic criteria
for hyperuricemia (fasting blood uric acid
The technical roadmap of the study is shown in Fig. 1.
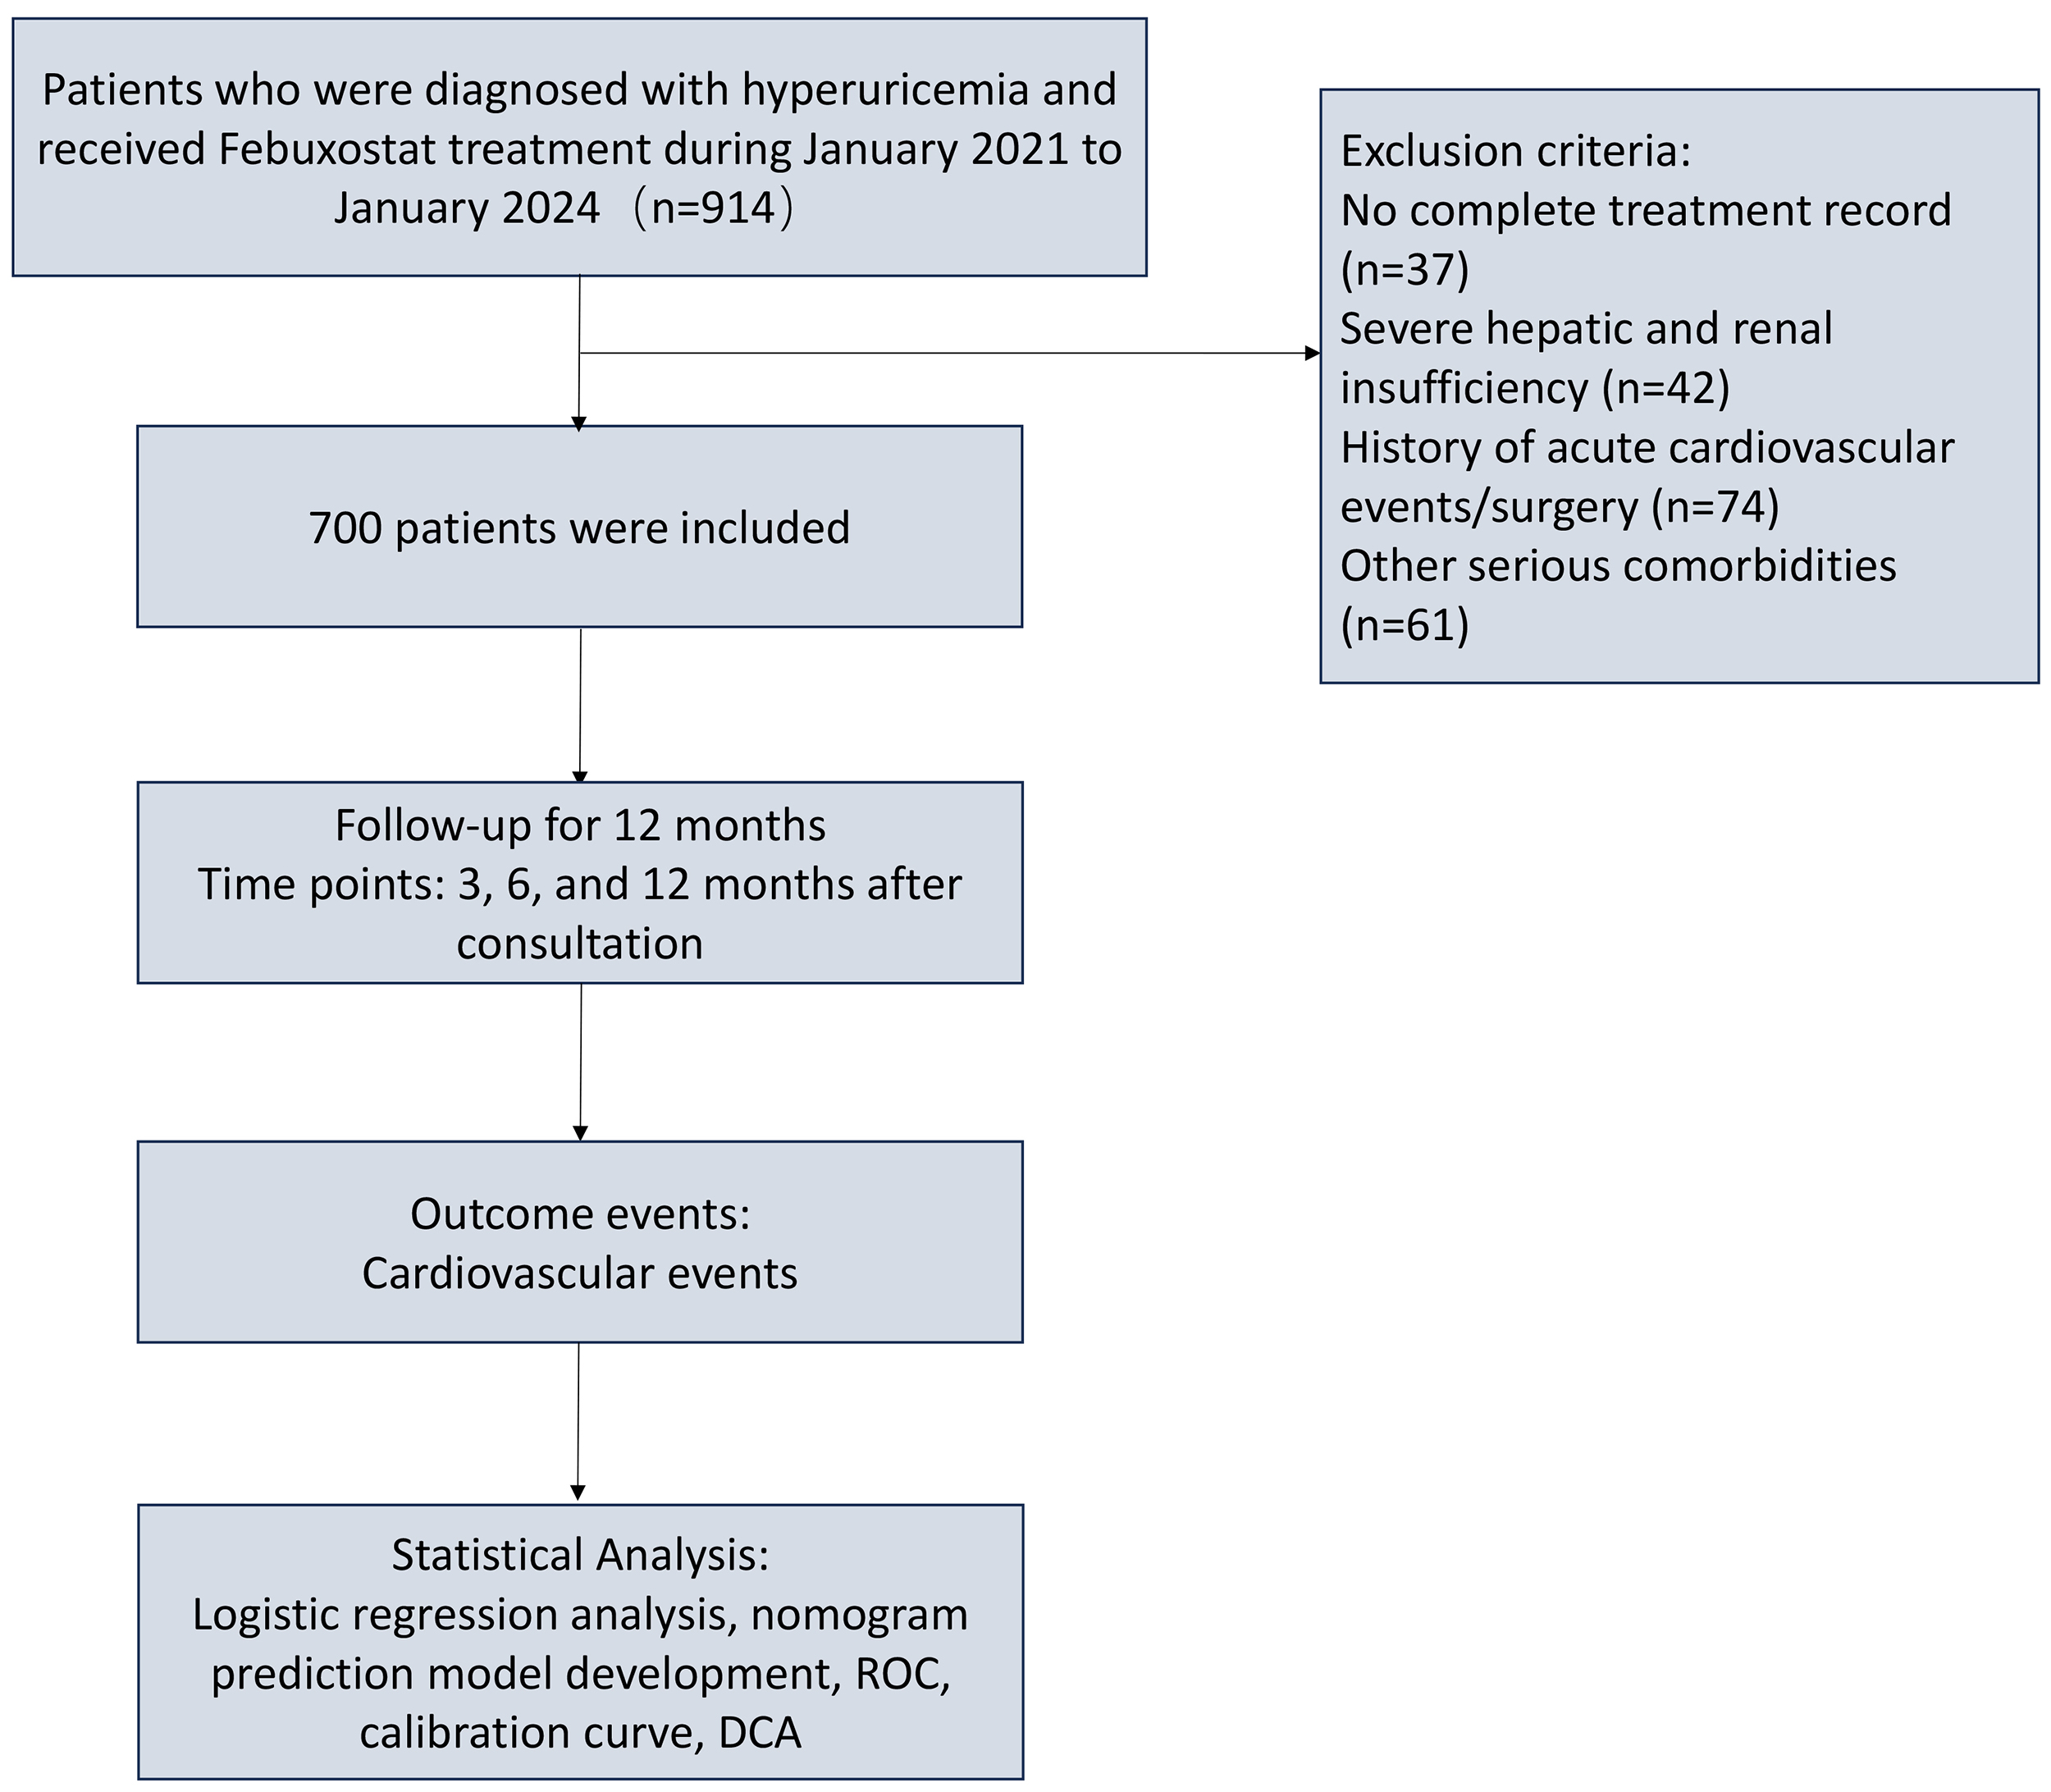 Fig. 1.
Study design and analytical workflow. ROC, receiver operating characteristic; DCA, decision curve analysis.
Baseline data collected from all patients included age, sex, anthropometric measurements (height, weight, and body mass index [BMI]), blood pressure parameters (systolic and diastolic), laboratory tests (fasting blood glucose, glycated hemoglobin, lipid profile, serum uric acid, triglyceride-glucose (TyG) index, and renal function indicators), as well as medical histories of hypertension, diabetes, dyslipidemia, smoking, and alcohol consumption. All cardiovascular events were confirmed through review of follow-up medical records.
Data processing and statistical analysis were performed using IBM SPSS
Statistics version 22.0 (IBM Corp., Armonk, NY, USA), Stata version 15.1
(StataCorp LLC, College Station, TX, USA), and R software version 4.2.2 (R
Foundation for Statistical Computing, Vienna, Austria). Categorical variables are
presented as frequencies and percentages (n, %), and intergroup comparisons were
conducted using the chi-square test. The Kolmogorov–Smirnov test was used to
assess the normality of continuous variables. For data with normal distribution,
independent-sample t tests were used for intergroup comparisons, and the
results are expressed as mean
Model construction and analysis were conducted in three phases. In the first
phase, simple random sampling was applied to divide the dataset into a training
set and a validation set at a 7:3 ratio. The training dataset was
used for model development, and the validation dataset was used for model
performance evaluation. To comprehensively assess baseline balance between the
two groups, standardized mean differences (SMDs) were calculated as effect-size
indicators, in addition to p-values obtained from hypothesis testing.
According to commonly accepted criteria, an absolute SMD value
In the second stage, univariate logistic regression analysis was performed using
the training dataset to identify candidate variables associated with
cardiovascular events (p
In the third stage, the discriminative ability of the model was evaluated using
receiver operating characteristic (ROC) curves and the area under the curve
(AUC). Model calibration was evaluated using the Hosmer-Lemeshow (HL)
goodness-of-fit test and calibration curves. Decision curve analysis (DCA) was
performed to evaluate the clinical utility of the model. All statistical analyses
were two-sided, and p
A total of 700 patients were included in the study, comprising 559 males
(79.9%) and 141 females (20.1%). The median age was 69 years (interquartile
range [IQR]: 62.00–77.00 years). During the 12-month follow-up, 133 patients
(19.0%) experienced composite cardiovascular events. The patients were randomly
allocated to a training set (n = 489) and a validation set (n = 211) at a 7:3
ratio. No statistically significant differences were observed between the
training and validation sets in baseline characteristics, including age, sex,
physique, blood pressure, lipid and glucose profiles, renal function, serum uric
acid levels, comorbidities, and lifestyle factors (p
| Variables | Validation (n = 211) | Training (n = 489) | Statistic | p-value | SMD | |
| Age (years) | 68.00 (62.00, 76.50) | 69.00 (62.00, 77.00) | Z = –0.45 | 0.655 | 0.026 | |
| Height (m) | 1.61 (1.56, 1.66) | 1.62 (1.57, 1.68) | Z = –1.61 | 0.108 | 0.122 | |
| Weight (kg) | 65.90 (56.98, 74.45) | 68.00 (59.00, 78.10) | Z = –1.75 | 0.080 | 0.135 | |
| BMI (kg/m2) | 24.80 (22.04, 27.75) | 25.29 (22.37, 27.95) | Z = –0.94 | 0.347 | 0.097 | |
| Systolic blood pressure (mmHg) | 128.50 (116.75, 142.50) | 129.00 (116.00, 145.00) | Z = –0.21 | 0.836 | 0.021 | |
| Diastolic blood pressure (mmHg) | 75.00 (68.00, 84.25) | 76.80 (68.30, 85.80) | Z = –1.26 | 0.209 | 0.100 | |
| TyG index (%) | 9.12 (8.71, 9.59) | 9.13 (8.73, 9.55) | Z = –0.13 | 0.900 | 0.004 | |
| Blood urea nitrogen (mg/dL) | 16.53 (14.01, 20.03) | 17.09 (14.01, 20.73) | Z = –1.41 | 0.158 | 0.100 | |
| Fasting blood glucose (mg/dL) | 99.10 (90.09, 111.14) | 100.20 (91.69, 115.94) | Z = –1.13 | 0.258 | 0.133 | |
| Serum creatinine (mg/dL) | 0.99 (0.89, 1.13) | 0.98 (0.85, 1.15) | Z = –0.22 | 0.826 | –0.077 | |
| Total cholesterol (mg/dL) | 184.94 (164.20, 214.42) | 190.73 (165.64, 215.72) | Z = –0.76 | 0.447 | 0.030 | |
| Triglycerides (mg/dL) | 184.77 (116.92, 269.97) | 176.35 (119.34, 258.65) | Z = –0.54 | 0.589 | –0.046 | |
| HDL cholesterol (mg/dL) | 47.49 (39.58, 56.60) | 45.23 (39.00, 53.74) | Z = –1.59 | 0.112 | –0.102 | |
| LDL cholesterol (mg/dL) | 102.70 (81.52, 128.57) | 104.25 (83.01, 127.03) | Z = –0.14 | 0.886 | –0.031 | |
| Glycated hemoglobin (%) | 5.70 (5.33, 6.10) | 5.70 (5.30, 6.10) | Z = –0.70 | 0.486 | 0.094 | |
| Serum uric acid (mg/dL) | 7.80 (7.50, 8.40) | 7.90 (7.50, 8.60) | Z = –1.57 | 0.117 | 0.126 | |
| Sex | 0.918 | 0.008 | ||||
| Female (%) | 43 (20.38) | 98 (20.04) | ||||
| Male (%) | 168 (79.62) | 391 (79.96) | ||||
| Previous hypertension | 0.449 | 0.062 | ||||
| No (%) | 132 (62.56) | 291 (59.51) | ||||
| Yes (%) | 79 (37.44) | 198 (40.49) | ||||
| Previous dyslipidemia | 0.437 | 0.065 | ||||
| No (%) | 152 (72.04) | 366 (74.85) | ||||
| Yes (%) | 59 (27.96) | 123 (25.15) | ||||
| Previous diabetes | 0.936 | 0.007 | ||||
| No (%) | 189 (89.57) | 439 (89.78) | ||||
| Yes (%) | 22 (10.43) | 50 (10.22) | ||||
| Alcohol consumption | 0.704 | 0.031 | ||||
| No (%) | 106 (50.24) | 238 (48.67) | ||||
| Yes (%) | 105 (49.76) | 251 (51.33) | ||||
| Smoking status | 0.562 | 0.048 | ||||
| No (%) | 69 (32.70) | 171 (34.97) | ||||
| Yes (%) | 142 (67.30) | 318 (65.03) | ||||
| Cardiovascular events | 0.201 | 0.103 | ||||
| No (%) | 177 (83.89) | 390 (79.75) | ||||
| Yes (%) | 34 (16.11) | 99 (20.25) | ||||
SMD, standardized mean difference; BMI, body mass index; TyG, triglyceride-glucose; HDL, high-density lipoprotein; LDL, low-density lipoprotein.
During analysis of the training set, significant differences were observed
between patients who experienced cardiovascular events and those who did not in
terms of age, weight, BMI, history of hypertension, history of dyslipidemia, and
triglyceride levels (p
| Variables | No event (n = 390) | Event (n = 99) | Statistic | p-value | |
| Age (years) | 68.00 (61.00, 75.00) | 73.00 (64.50, 82.00) | Z = –3.55 | ||
| Height (m) | 1.63 (1.57, 1.68) | 1.61 (1.54, 1.67) | Z = –1.39 | 0.165 | |
| Weight (kg) | 67.00 (58.12, 77.10) | 71.50 (62.75, 82.00) | Z = –2.71 | 0.007 | |
| BMI (kg/m2) | 24.53 (21.94, 27.41) | 27.29 (25.49, 29.94) | Z = –6.01 | ||
| Systolic blood pressure (mmHg) | 129.00 (115.50, 145.50) | 129.50 (117.25, 142.25) | Z = –0.01 | 0.990 | |
| Diastolic blood pressure (mmHg) | 76.80 (68.92, 85.80) | 77.30 (67.80, 84.80) | Z = –0.59 | 0.553 | |
| TyG index | 9.14 (8.78, 9.55) | 9.05 (8.67, 9.49) | Z = –1.22 | 0.221 | |
| Blood urea nitrogen (mg/dL) | 17.09 (14.16, 20.70) | 17.37 (13.64, 21.39) | Z = –0.30 | 0.761 | |
| Fasting blood glucose (mg/dL) | 100.20 (91.69, 116.44) | 98.90 (89.62, 111.46) | Z = –0.81 | 0.419 | |
| Serum creatinine (mg/dL) | 0.98 (0.85, 1.14) | 0.98 (0.87, 1.15) | Z = –0.52 | 0.601 | |
| Total cholesterol (mg/dL) | 191.05 (164.19, 215.35) | 189.19 (169.88, 216.02) | Z = –0.50 | 0.620 | |
| Triglycerides (mg/dL) | 169.80 (112.70, 254.31) | 204.22 (135.36, 283.61) | Z = –2.61 | 0.009 | |
| HDL cholesterol (mg/dL) | 45.95 (39.00, 53.74) | 44.79 (39.00, 53.93) | Z = –0.05 | 0.963 | |
| LDL cholesterol (mg/dL) | 103.86 (82.42, 126.25) | 106.56 (86.54, 129.92) | Z = –0.92 | 0.357 | |
| Glycated hemoglobin (%) | 5.70 (5.30, 6.10) | 5.80 (5.20, 6.20) | Z = –0.32 | 0.748 | |
| Serum uric acid (mg/dL) | 7.90 (7.50, 8.69) | 7.94 (7.60, 8.35) | Z = –0.37 | 0.715 | |
| Sex | 0.147 | ||||
| Female (%) | 73 (18.72) | 25 (25.25) | |||
| Male (%) | 317 (81.28) | 74 (74.75) | |||
| Previous hypertension | |||||
| No (%) | 262 (67.18) | 29 (29.29) | |||
| Yes (%) | 128 (32.82) | 70 (70.71) | |||
| Previous dyslipidemia | 0.004 | ||||
| No (%) | 303 (77.69) | 63 (63.64) | |||
| Yes (%) | 87 (22.31) | 36 (36.36) | |||
| Previous diabetes | 0.070 | ||||
| No (%) | 355 (91.03) | 84 (84.85) | |||
| Yes (%) | 35 (8.97) | 15 (15.15) | |||
| Alcohol consumption | 0.854 | ||||
| No (%) | 189 (48.46) | 49 (49.49) | |||
| Yes (%) | 201 (51.54) | 50 (50.51) | |||
| Smoking status | 0.745 | ||||
| No (%) | 135 (34.62) | 36 (36.36) | |||
| Yes (%) | 255 (65.38) | 63 (63.64) | |||
Univariate logistic regression analysis was performed on baseline variables to
screen candidate predictors (p
Before model construction, multicollinearity among all included variables was assessed. The variance inflation factors ranged from 1.009 to 1.989, all below the threshold of 5, indicating no significant multicollinearity and confirming the stability and reliability of the model estimates (Table 3).
| Variables | Univariate analysis | SE | Multivariate analysis | VIF | ||||||||
| SE | Z | p-value | OR (95% CI) | Z | p-value | OR (95% CI) | ||||||
| Age (years) | 0.04 | 0.01 | 3.65 | 1.04 (1.02–1.07) | 0.04 | 0.01 | 3.26 | 0.001 | 1.05 (1.02–1.07) | 1.064 | ||
| Height (m) | –2.09 | 1.34 | –1.56 | 0.118 | 0.12 (0.01–1.70) | |||||||
| Weight (kg) | 0.02 | 0.01 | 2.31 | 0.021 | 1.02 (1.01–1.03) | –0.03 | 0.01 | –1.94 | 0.052 | 0.97 (0.95–1.00) | 1.989 | |
| BMI (kg/m2) | 0.14 | 0.03 | 5.37 | 1.15 (1.09–1.21) | 0.20 | 0.04 | 4.77 | 1.22 (1.12–1.32) | 1.840 | |||
| Systolic blood pressure (mmHg) | –0.00 | 0.01 | –0.14 | 0.886 | 1.00 (0.99–1.01) | |||||||
| Diastolic blood pressure (mmHg) | –0.00 | 0.01 | –0.38 | 0.705 | 1.00 (0.98–1.01) | |||||||
| TyG index | –0.24 | 0.22 | –1.13 | 0.259 | 0.78 (0.51–1.20) | |||||||
| Blood urea nitrogen (mg/dL) | –0.01 | 0.02 | –0.50 | 0.616 | 0.99 (0.96–1.03) | |||||||
| Fasting blood glucose (mg/dL) | –0.01 | 0.00 | –1.34 | 0.181 | 0.99 (0.98–1.00) | |||||||
| Serum creatinine (mg/dL) | –0.01 | 0.34 | –0.02 | 0.988 | 0.99 (0.52–1.92) | |||||||
| Total cholesterol (mg/dL) | 0.00 | 0.00 | 0.59 | 0.555 | 1.00 (1.00–1.01) | |||||||
| Triglycerides (mg/dL) | 0.01 | 0.00 | 2.54 | 0.011 | 1.01 (1.01–1.01) | 0.00 | 0.00 | 1.83 | 0.067 | 1.00 (1.00–1.00) | 1.009 | |
| HDL cholesterol (mg/dL) | 0.00 | 0.01 | 0.23 | 0.817 | 1.00 (0.99–1.02) | |||||||
| LDL cholesterol (mg/dL) | 0.00 | 0.00 | 1.10 | 0.272 | 1.00 (1.00–1.01) | |||||||
| Glycated hemoglobin (%) | 0.07 | 0.12 | 0.60 | 0.550 | 1.08 (0.84–1.37) | |||||||
| Uric acid (mg/dL) | –0.16 | 0.13 | –1.18 | 0.238 | 0.85 (0.65–1.11) | |||||||
| Sex | ||||||||||||
| Female | 1.00 (Reference) | |||||||||||
| Male | –0.38 | 0.27 | –1.44 | 0.149 | 0.68 (0.41–1.15) | |||||||
| Previous hypertension | 1.016 | |||||||||||
| No | 1.00 (Reference) | 1.00 (Reference) | ||||||||||
| Yes | 1.60 | 0.25 | 6.50 | 4.94 (3.05–8.00) | 1.63 | 0.27 | 6.14 | 5.10 (3.03–8.59) | ||||
| Previous dyslipidemia | 1.094 | |||||||||||
| No | 1.00 (Reference) | 1.00 (Reference) | ||||||||||
| Yes | 0.69 | 0.24 | 2.85 | 0.004 | 1.99 (1.24–3.20) | 0.51 | 0.28 | 1.78 | 0.075 | 1.66 (0.95–2.89) | ||
| Previous diabetes | ||||||||||||
| No | 1.00 (Reference) | |||||||||||
| Yes | 0.59 | 0.33 | 1.79 | 0.073 | 1.81 (0.95–3.47) | |||||||
| Alcohol consumption | ||||||||||||
| No | 1.00 (Reference) | |||||||||||
| Yes | –0.04 | 0.23 | –0.18 | 0.854 | 0.96 (0.62–1.49) | |||||||
| Smoking status | ||||||||||||
| No | 1.00 (Reference) | |||||||||||
| Yes | –0.08 | 0.23 | –0.33 | 0.745 | 0.93 (0.59–1.47) | |||||||
SE, Standard Error; CI, confidence interval; VIF, variance inflation factor; OR, odds ratio.
Based on the three independent predictors identified in the final multivariate logistic regression model (age, previous hypertension, and BMI), a nomogram was constructed to predict the risk of composite cardiovascular events in patients with hyperuricemia receiving febuxostat treatment. The nomogram is shown in Fig. 2.
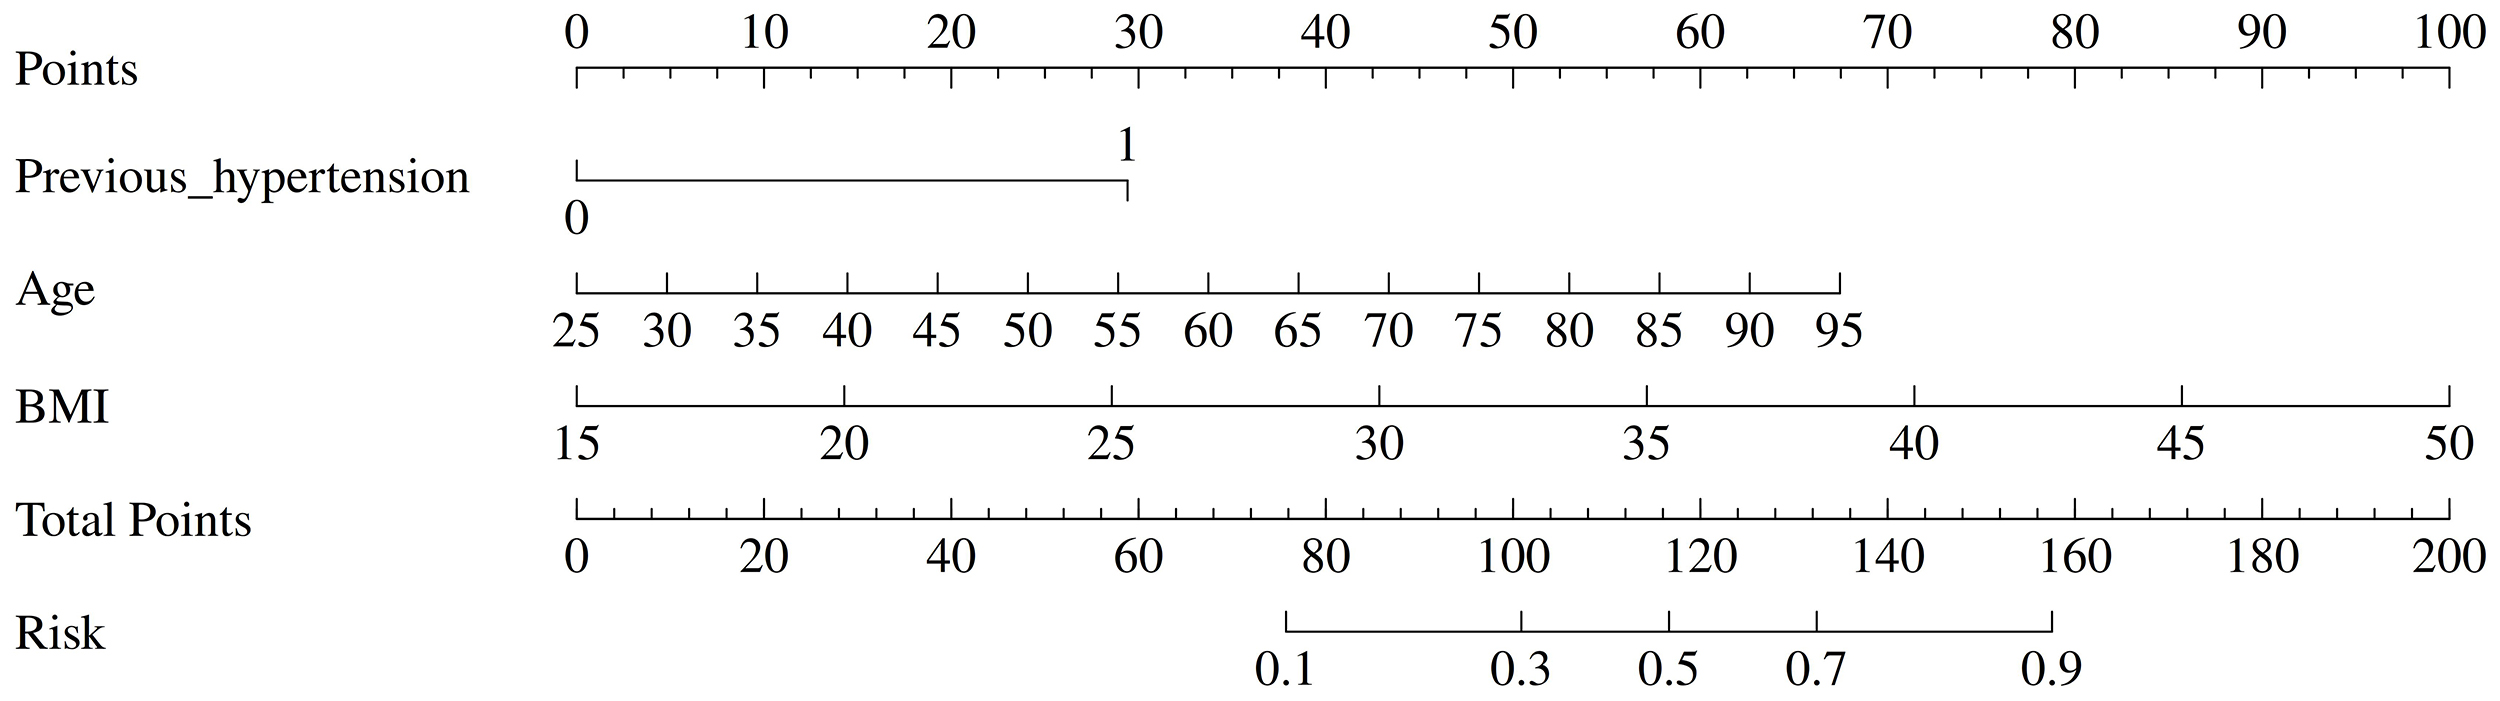 Fig. 2.
Nomogram for predicting the risk of the composite cardiovascular events in patients with hyperuricemia receiving febuxostat treatment.
The predictive performance of the constructed model was evaluated using receiver
operating characteristic curves (ROC) analysis. The area under the curve (AUC)
was 0.80 (95% CI: 0.74–0.85; p
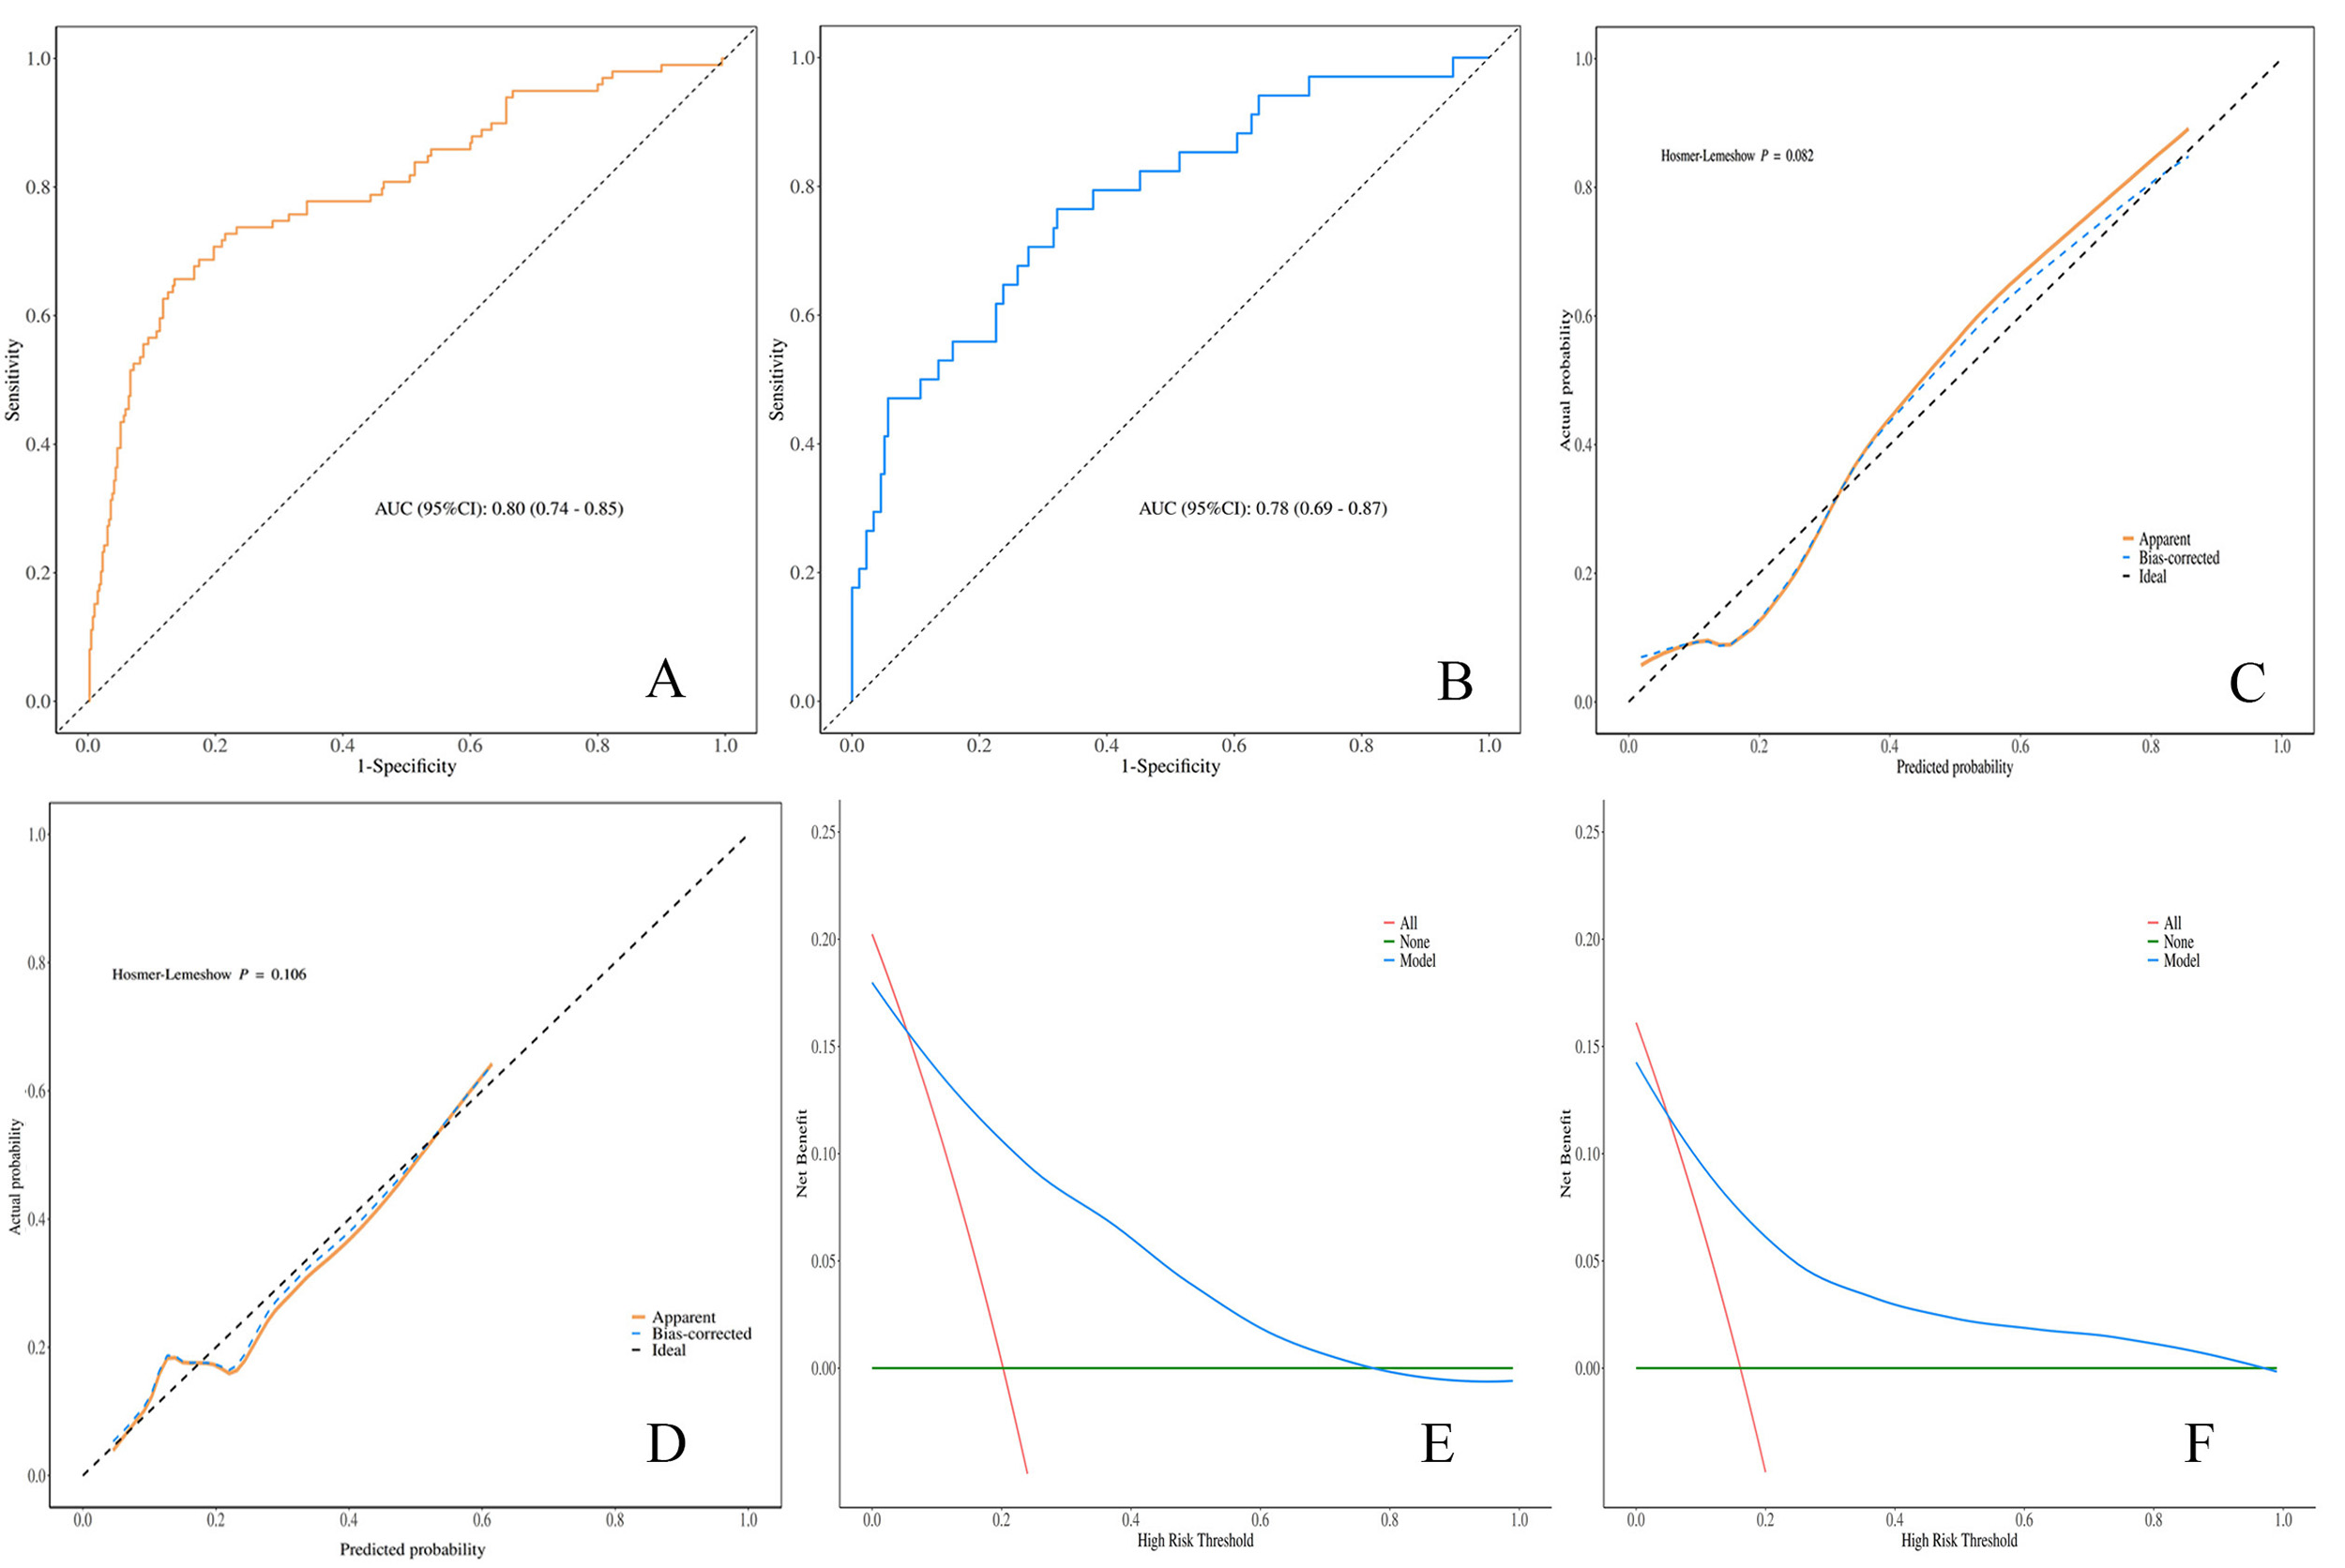 Fig. 3.
Validation of the predictive model. (A) ROC curve for the training set. (B) ROC curve of the validation set. (C) Calibration curve for the training set. (D) Calibration curve for the validation set. (E) DCA curve for the training set. (F) DCA curve for the validation set. AUC, area under the curve.
At the optimal cut-off value of 0.288, the sensitivity and specificity were 0.66
(95% CI: 0.56–0.75) and 0.86 (95% CI: 0.83–0.90), respectively in the
training set, and 0.56 (95% CI: 0.39–0.73) and 0.82 (95% CI: 0.77–0.88),
respectively in the validation set. Calibration curves demonstrated good
agreement between predicted probabilities and observed event rates (Fig. 3C,D),
with no statistically significant difference (p
The findings of this study demonstrated that the overall incidence of cardiovascular events within 12 months among patients with hyperuricemia receiving febuxostat therapy was 19.0%. Binary logistic regression analysis demonstrated that age, body mass index, and prior hypertension were independent risk factors for cardiovascular events. These findings indicate that traditional cardiovascular risk factors continue to exert a significant impact on patients with hyperuricemia, and that other potential contributors, such as triglyceride levels, body weight, and prior dyslipidemia, should not be overlooked in cardiovascular risk prediction.
Multivariate logistic regression analysis revealed that age was a statistically significant independent risk factor for cardiovascular events (OR = 1.05, 95% CI: 1.02–1.07). This association may be explained by age-related reductions in arterial elasticity, endothelial dysfunction, and the accumulation of chronic inflammatory processes, all of which contribute to increased cardiovascular risk [10, 11, 12]. Elevated BMI indicates obesity, which is closely associated with insulin resistance and dyslipidemia and may further exacerbate the metabolic disorders associated with hyperuricemia, thereby promoting cardiovascular damage [13, 14]. The increased cardiovascular risk observed in patients with prior hypertension is consistent with epidemiological evidence indicating that elevated blood pressure accelerates atherosclerosis and left ventricular hypertrophy, leading to a higher incidence of cardiovascular events [15, 16].
In the univariate analysis, elevated triglyceride levels were associated with cardiovascular events. Hypertriglyceridemia is a well-established risk factor for atherosclerosis and frequently coexists with hyperuricemia, and the two conditions may interact through shared metabolic pathways [17].
Previous studies have reported inconsistent findings regarding the cardiovascular risk associated with febuxostat compared with other urate-lowering therapies. For instance, Wang et al. [18] reported no significant difference in cardiovascular outcomes. Although the present study was not a prospective randomized controlled trial but rather a retrospective analysis based on follow-up data and medical records, the results suggest that, in a real-world clinical setting, febuxostat treatment does not fully mitigate the impact of traditional cardiovascular risk factors. This observation underscores the continued need for comprehensive cardiovascular risk stratification and management in patients receiving febuxostat therapy.
A major strength of this study is the development and validation of a cardiovascular event prediction model using multiple evaluation methods, including a nomogram, ROC curve analysis, and DCA, all of which demonstrated good discrimination and potential clinical utility. Notably, the model exhibited higher specificity than sensitivity, indicating reliable identification of low-risk individuals while exhibiting relatively limited ability to detect all potential high-risk cases. This performance characteristic should be carefully considered in clinical practice, as low predicted risk does not completely exclude the possibility of future cardiovascular events and should be interpreted alongside a comprehensive clinical assessment.
Several limitations of this study should be acknowledged. First, the single-center retrospective design may introduce selection bias. Second, the prediction model was specifically developed for patients with hyperuricemia receiving febuxostat, and its generalizability requires further validation in external cohorts; future studies should also compare this model with established cardiovascular risk scores to determine its incremental clinical value. Third, the absence of a parallel control group limits direct comparison of cardiovascular risk between febuxostat and other urate-lowering agents. Fourth, although the follow-up period was 12 months, potential misclassification of certain outcome events, such as deaths with complex etiologies, cannot be excluded, and longer-term follow-up is warranted. Fifth, biological indicators closely related to atherosclerosis, including systemic inflammatory indicators and imaging markers such as carotid intima-media thickness, were not included; incorporation of these variables in future prospective studies may further elucidate underlying mechanisms and optimize model performance. Finally, expansion of the sample size is necessary to enhance model stability and enable more robust analysis of subgroups.
The predictive model developed in this study demonstrated good predictive performance, confirming its potential clinical value as a cardiovascular risk assessment tool for patients with hyperuricemia. The model identified age, BMI, history of hypertension, and dyslipidemia as key independent predictors of cardiovascular events. Based on these findings, future research should prioritize external validation of the model and further evaluation of the long-term cardiovascular safety of febuxostat treatment through multicenter, prospective cohort studies, thereby providing higher-level evidence to support individualized clinical management.
• In this single-center retrospective cohort study, a predictive
model incorporating age, history of hypertension, and BMI was developed and
validated, demonstrating good discriminatory ability (AUC
• In this retrospective cohort, age, BMI, and history of hypertension were identified as independent predictors of short-term cardiovascular events, suggesting that these traditional risk factors may remain relevant even in patients receiving urate-lowering therapy.
• The model showed good calibration and net clinical benefit in internal validation, indicating that it may serve as a useful adjunctive tool for cardiovascular risk stratification, though its generalizability requires further external validation.
The data used to support the findings of this study are available from the corresponding author upon request.
XJC and YXC designed the research study and wrote the first draft. YQC, WXX and YL performed the research. YQC, WXX and YL analyzed the data. All authors contributed to the important editorial changes in the manuscript. All authors read and approved the final manuscript. All authors have participated sufficiently in the work and agreed to be accountable for all aspects of the work.
This study was conducted in accordance with the principles of the Declaration of Helsinki, and the research protocol was approved by the Ethics Committee of Quzhou Municipal People’s Hospital (Ethics Approval No.: 2026-007). Written informed consent was obtained from all participants.
Not applicable.
This research received no external funding.
The authors declare no conflict of interest.
References
Publisher’s Note: IMR Press stays neutral with regard to jurisdictional claims in published maps and institutional affiliations.