


1 Department of Cardiology, Affiliated Hospital of Yangzhou University, Yangzhou University, 225001 Yangzhou, Jiangsu, China
Abstract
Existing pulmonary arterial hypertension (PAH) risk stratification, based on hemodynamics and functional parameters, is often inadequate in critical illness. The platelet-to-lymphocyte ratio (PLR), reflecting inflammatory and thrombotic pathways, may enhance outcome prediction. This study aimed to determine the prognostic value of PLR for 28-day mortality in critically ill PAH patients, evaluate nonlinear thresholds, and validate predictive performance using machine learning.
A retrospective cohort of 1512 PAH patients was extracted from the Medical Information Mart for Intensive Care IV (MIMIC-IV) v3.0 database (2008–2022). PLR was derived from admission hematologic parameters. Multivariable Cox regression, restricted cubic spline (RCS) models, and machine learning algorithms were employed to assess associations between PLR and mortality.
RCS analysis revealed a U-shaped relationship with mortality, identifying critical thresholds: PLR <67.32 was associated with reduced risk, while PLR >75.92 indicated an abrupt risk escalation (adjusted hazard ratio (HR) = 2.261, 95% confidence interval (CI): 1.053–4.854, p = 0.014). Machine learning models incorporating PLR achieved moderate discrimination (concordance index [C-index] = 0.700). Subgroup analyses confirmed consistent prognostic value across age, sex, chronic kidney disease (CKD), and chronic obstructive pulmonary disease (COPD) subgroups (all p-interaction > 0.05).
PLR represents an independent predictor of short-term mortality in critically ill PAH patients, with nonlinear thresholds offering actionable risk stratification. Integration of PLR into prognostic models may strengthen early risk assessment and guide timely interventions in critical care settings.
Keywords
- pulmonary hypertension
- platelet-to-lymphocyte ratio
- critical illness
- mortality
- nonlinear threshold
- prognostic models
Pulmonary arterial hypertension (PAH) is a life-threatening disorder
characterized by progressive vascular remodeling and elevated pulmonary artery
pressure, associated with substantial morbidity and mortality despite therapeutic
advances [1]. As a subtype of precapillary pulmonary hypertension, PAH has an
estimated prevalence of 10–50 per 1 million population and represents a minority
among pulmonary hypertension etiologies, where left heart disease predominates [2, 3]. Definitive diagnosis requires right heart catheterization demonstrating a
mean pulmonary artery pressure
The platelet-to-lymphocyte ratio (PLR), a composite index derived from routine hematologic measurements, has emerged as a potential prognostic biomarker in cardiovascular diseases, reflecting both thrombotic propensity and systemic inflammation [9, 10]. Elevated PLR has been associated with adverse outcomes in chronic PAH cohorts. However, its predictive value in critically ill patients, particularly regarding nonlinear mortality associations, remains insufficiently explored [11]. Existing evidence is limited by single-center designs and inadequate adjustment for illness severity.
To address these gaps, we conducted a retrospective cohort study using the Medical Information Mart for Intensive Care IV (MIMIC-IV) 3.0 database (2008–2022) to evaluate the prognostic value of PLR in 1512 critically ill PAH patients. A multidimensional analytical framework incorporating survival analysis, restricted cubic spline modeling, and machine learning algorithms was applied to address three critical knowledge gaps: (1) the quantitative association between PLR and 28-day mortality, (2) the presence of nonlinear threshold effects in intensive care unit (ICU) populations, and (3) the stability of PLR’s predictive performance across clinical subgroups.
This investigation addressed critical knowledge gaps in understanding the prognostic implications of PLR in critically ill PAH populations. Specifically, we examined the relationship between PLR levels and clinical outcomes and explored potential nonlinear associations. By employing complementary analytical approaches, we aim to evaluate the consistency of PLR’s predictive capacity across diverse clinical endings, strengthening early risk assessment strategies and informing timely interventions in this vulnerable patient population.
This retrospective cohort study utilized the MIMIC-IV database (version 3.0; https://mimic.mit.edu/), which contains de-identified clinical records of more than 300,000 patients admitted to Beth Israel Deaconess Medical Center (Boston, MA, USA) between 2008 and 2022. Patients with PAH were identified using International Classification of Diseases (ICD) codes in conjunction with World Health Organization (WHO) diagnostic criteria [12]. Laboratory variables were extracted from each patient’s first clinical measurement obtained within 24 hours of ICU admission, establishing baseline values for analysis. Structured Query Language (SQL) queries were used to retrieve demographics, time-stamped laboratory data (including platelet and lymphocyte counts for PLR calculation), vital signs, and clinical outcomes.
(a) Adult patients (aged 18–90 years) with PAH confirmed by standard diagnostic criteria [12].
(b) ICU admission records with complete first blood sample results (platelet count and lymphocyte count) obtained within 24 hours of ICU entry.
(c) The length of hospital stay in the ICU exceeds 24 hours.
(a) ICU stay shorter than 24 hours.
(b) Missing initial hematological measurements within the first 24 hours of ICU admission.
(c) Multiple ICU admissions (only the first admission episode included).
(d) Concurrent sepsis diagnosis defined by Sepsis-3 criteria [13]. Sepsis was excluded to ensure PAH remained the primary driver of critical illness, preventing confounding of PAH-specific manifestations and treatment responses.
(e) Active malignancy or a diagnosis of malignancy within the previous 5 years (excluding localized skin cancers).
(f) Documented hematological disorders with significant impact on blood counts (e.g., myeloproliferative neoplasms, myelodysplastic syndromes, primary immune thrombocytopenia, active hemolysis).
(g) Systemic immunosuppressive therapy (e.g.,
(h) Known active autoimmune diseases (e.g., systemic lupus erythematosus, rheumatoid arthritis, scleroderma) or clinically evident systemic inflammatory conditions.
All hematologic parameters were derived exclusively from the first available measurement within 24 hours of ICU admission.
Application of these criteria yielded a study population of 1512 critically ill patients with PAH.
The primary endpoint was 28-day all-cause mortality, defined as death from any medical cause occurring within 28 days after ICU admission. This included fatal events related to pulmonary hypertension, comorbid conditions, or incidental triggers, regardless of hospital discharge status.
Variables with
Outliers were detected using interquartile range (IQR) thresholds and visually
confirmed by boxplot analysis. Continuous variables were normalized using Z-score
transformation, while non-normally distributed data underwent logarithmic
transformation. PLR was calculated as platelet count
(
Patients were stratified by PLR tertiles (Tertile 1 [T1]: 1.10–105.42, Tertile 2 [T2]: 105.52–235.82,
Tertile 3 [T3]: 237.24–5300). Distributional normality of continuous variables was evaluated
using the Shapiro-Wilk test. All parameters were non-normally distributed
(normality rejected at p
Kaplan-Meier curves were generated to visualize 28-day survival probabilities across PLR tertiles, with survival differences evaluated by log-rank tests. The discriminative performance of multivariable Cox regression models was quantified using Harrell’s concordance index (C-index), which estimated the probability that a randomly selected patient who died had a higher predicted risk than one who survived.
Cox proportional hazards models were used to evaluate predictors of 28-day mortality. Candidate variables were selected based on:
Clinical relevance: Sequential Organ Failure Assessment (SOFA) score (organ failure severity), age, and sex (established predictors in critical illness).
Cardiorespiratory status: systolic blood pressure (SBP), heart rate, respiratory rate (RR), and oxygen saturation (SpO2), reflecting hemodynamic and respiratory compromise in PAH.
Key comorbidities: chronic kidney disease (CKD) and chronic obstructive pulmonary disease (COPD), both known to exacerbate PAH progression and mortality.
Biological rationale: weight was included as a surrogate for nutritional status and fluid balance.
Multicollinearity control was controlled by excluding variables with a variance
inflation factor (VIF)
Restricted cubic splines (RCSs) with three knots (optimized by Akaike
information criterion [AIC]) were employed to examine nonlinear associations
between PLR and mortality. Threshold effects were quantified by
Feature selection was performed using the Boruta algorithm with 100 iterations and Bonferroni correction, identifying 15 predictive features from 27 candidate variables. Stratified random sampling preserved the distribution of the target outcome (28-day mortality) across training and test sets (70% and 30%, respectively). Class imbalance was addressed using Stratified ShuffleSplit in scikit-learn (v1.2.2).
Hyperparameters were calibrated through manual tuning to balance
interpretability and complexity. Decision tree structure depth was restricted to
three levels, prioritizing clinically interpretable decision paths while limiting
overfitting. Minimum leaf samples (1) and split size (2) retained default values
to capture granular mortality signals. Ensemble design comprised 100 decision
trees, providing stable predictions without excessive computational burden
(
Model validity was assessed using three inferential frameworks. Joint covariate
significance was determined via likelihood ratio testing, contrasting saturated
models with intercept-only models. Wald statistics quantified partial effects of
individual predictors, with emphasis on PLR-derived risk estimators. Log-rank
procedures examined concordance between risk-stratified groups and survival
timelines without parametric assumptions. All inferences used a two-tailed
significance threshold of
Stratified Cox models were applied to evaluate effect modification using key
variables. Age (
All analyses were conducted in R version 4.2.1 (R Foundation for Statistical
Computing, Vienna, Austria) with the packages survival, rms, and random forest.
Graphical and statistical representations were generated using the following
open-source packages within the R environment: survminer (version 0.4.9,
Kaplan-Meier survival curves, Alboukadel Kassambara, Montpellier, France), rms
(v6.7-0, restricted cubic splines, Frank E. Harrell Jr., Vanderbilt University,
Nashville, TN, USA), Boruta (v8.0.0, variable importance plots, Miron B. Kursa,
Warsaw University of Life Sciences, Warsaw, Poland), pROC (v 1.18.4, receiver
operating characteristic curves, Xavier Robin, University of Paris, Paris,
France), forestplot (v3.1.1, subgroup analysis forest plots, Max Gordon,
University of Auckland, Auckland, New Zealand). Statistical significance was
defined as two-tailed
A total of 1512 critically ill PAH patients (Fig. 1) were identified from the
MIMIC-IV 3.0 database (2008–2022) and stratified into PLR tertiles (T1:
1.10–105.42, T2: 105.52–235.82, T3: 237.24–5300) [16]. Baseline analysis
revealed significant associations between PLR levels and multiple clinical
indicators (Table 1). Compared with patients in the lowest tertile (T1), those in
the highest tertile (T3) exhibited elevated cardiorespiratory markers, including
increased heart rate and respiratory rate (p
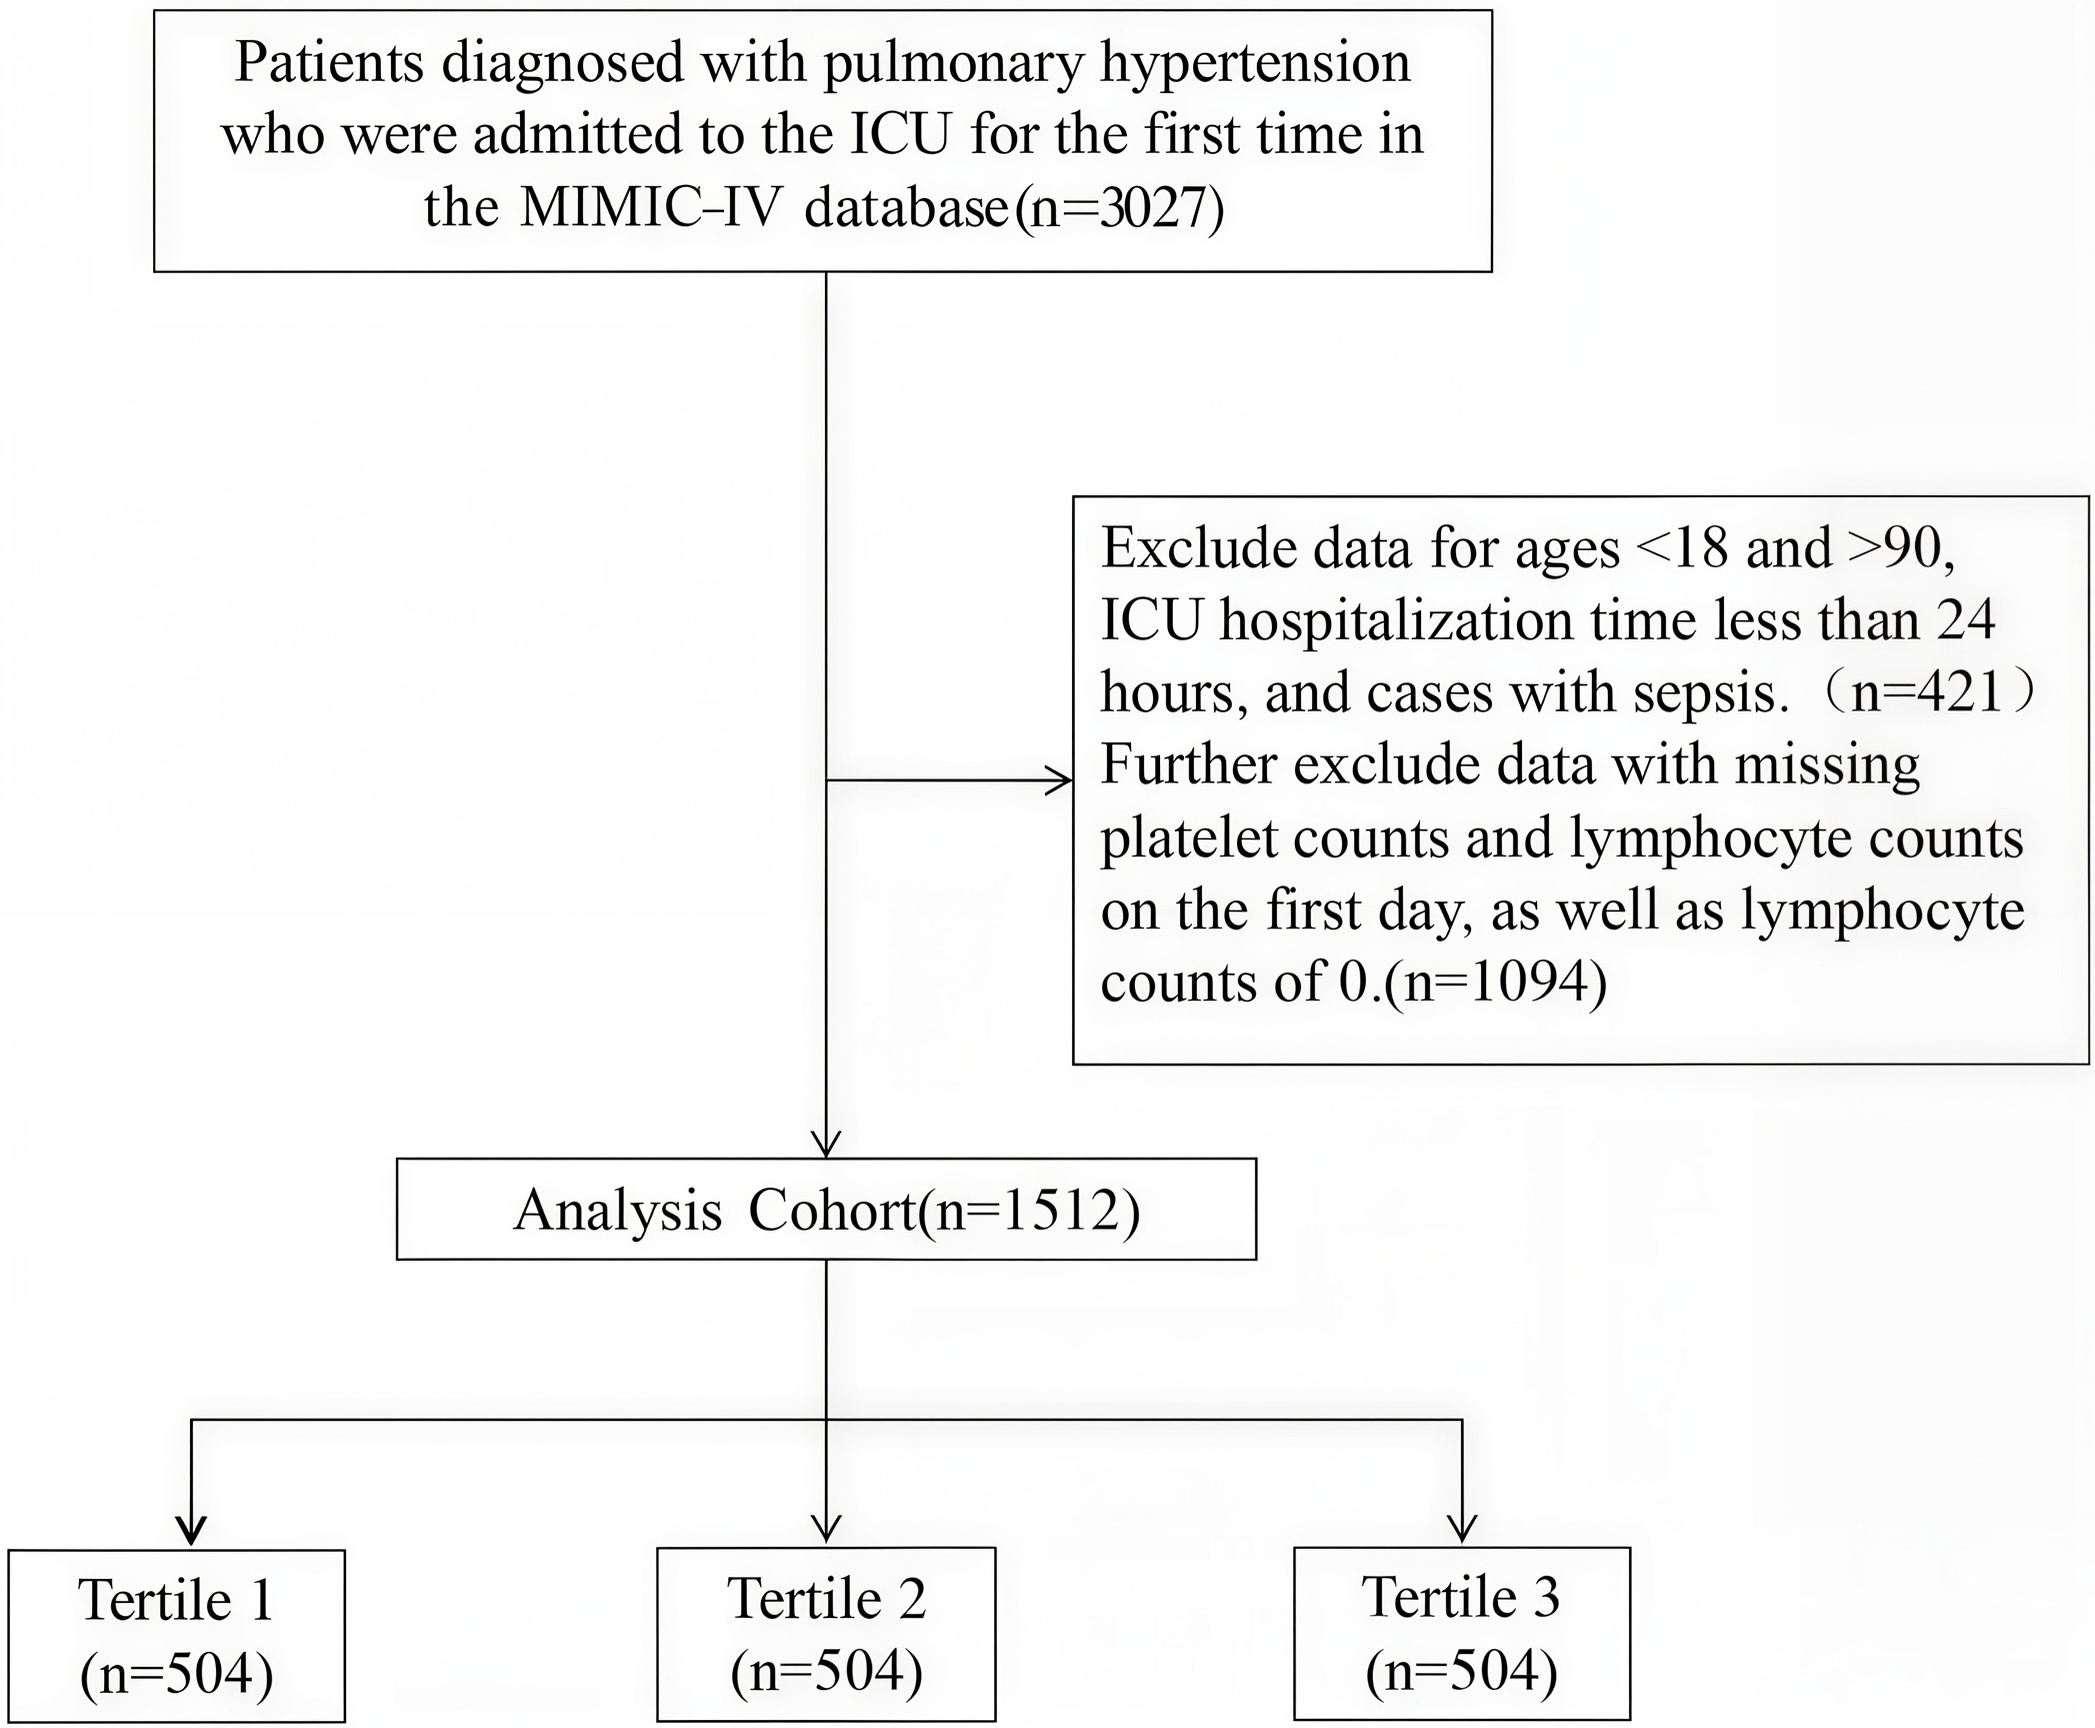 Fig. 1.
Workflow for selection of the study population from the MIMIC-IV database. ICU, intensive care unit; MIMIC-IV, Medical Information Mart for Intensive Care IV.
| Variable | Levels | Overall (n = 1512) | PLR | H/ |
p-value | ||
| T1 (n = 504) | T2 (n = 504) | T3 (n = 504) | |||||
| Heart rate (beats/min) | 85 (75–99.5) | 81 (75–91) | 85 (73–99) | 90 (77–105.5) | 32.03 | ||
| Respiratory rate (breaths/min) | 19 (15–24) | 16 (14–20) | 20 (16–24) | 22 (17–26) | 147.7 | ||
| SpO2 (%) | 98 (94–100) | 99 (96–100) | 97 (94–100) | 96 (93–99) | 108.93 | ||
| SBP (mmHg) | 114 (100–131) | 111.5 (99–125.5) | 115 (101–132) | 116 (100–135) | 9.6 | 0.008 | |
| SOFA score | 5.00 (3.00–8.00) | 7.00 (5.00–9.00) | 5.00 (3.00–8.00) | 5.00 (3.00–7.00) | 86.39 | ||
| Age (years) | 73 (63–80) | 70 (60–78) | 72 (61.5–81) | 75 (65.5–83) | 34.91 | ||
| Weight (kg) | 80.30 (66–97.05) | 81.95 (69.03–95.98) | 81.3 (66.35–100.05) | 76.35 (62.73–95.2) | 12.78 | 0.002 | |
| PLR | 160.39 (84.13–292.99) | 63.97 (44.23–84.13) | 160.39 (127.5–191.66) | 382.32 (292.99–527.37) | 1343.11 | ||
| RDW (%) | 15.4 (13.9–17.3) | 14.5 (13.3–16) | 15.5 (14.1–17.6) | 15.9 (14.6–17.8) | 101.14 | ||
| WBC (109/L) | 11.30 (8.00–16.00) | 12.20 (8.60–16.40) | 10.70 (7.55–15.20) | 11.40 (8.00–16.25) | 11.62 | 0.003 | |
| ANC (109/L) | 9.21 (6.08–13.21) | 9.25 (6.18–13.45) | 8.48 (5.65–12.24) | 9.71 (6.53–13.71) | 10.84 | 0.004 | |
| Total calcium (mg/dL) | 8.50 (8.00–8.90) | 8.30 (7.90–8.80) | 8.60 (8.10–9.00) | 8.50 (8.10–9.00) | 20.11 | ||
| Glucose (mg/dL) | 127 (107–160) | 122.5 (106–146) | 125 (104–158) | 138 (112.5–177.5) | 33.65 | ||
| Potassium (mmol/L) | 4.30 (3.90–4.80) | 4.30 (4.00–4.70) | 4.30 (3.80–4.80) | 4.30 (3.90–4.90) | 1.35 | 0.508 | |
| iCa2+ (mmol/L) | 1.12 (1.06–1.17) | 1.12 (1.07–1.19) | 1.11 (1.06–1.16) | 1.12 (1.07–1.17) | 5.46 | 0.065 | |
| Lactate (mmol/L) | 1.70 (1.20–2.50) | 2.00 (1.40–2.70) | 1.60 (1.20–2.40) | 1.60 (1.10–2.30) | 33.84 | ||
| PaO2 (mmHg) | 82 (43–237.5) | 254 (64.5–346.5) | 72 (39.5–148) | 62 (41–106) | 208.06 | ||
| APTT (sec) | 31.50 (27.80–39.30) | 31.65 (27.85–38.10) | 31.9 (28–43.25) | 30.8 (27.6–38.3) | 7.36 | 0.025 | |
| Total bilirubin (mg/dL) | 0.70 (0.40–1.20) | 0.80 (0.50–1.45) | 0.70 (0.40–1.20) | 0.60 (0.40–1.00) | 45.7 | ||
| Serum creatinine (mg/dL) | 1.20 (0.80–2.00) | 1.00 (0.80–1.50) | 1.30 (0.90–2.10) | 1.40 (0.90–2.30) | 58.87 | ||
| BUN (mg/dL) | 26 (16–45) | 19 (14–30) | 27 (17–46) | 33 (20.5–53.5) | 120.85 | ||
| LDH (U/L) | 306 (232–439.5) | 338 (253–472) | 299.5 (221–417) | 288.5 (224.5–429.5) | 20.63 | ||
| PLT (109/L) | 171 (122.5–241) | 122.5 (90–151) | 182 (139.5–233.5) | 239 (180–298) | 479.1 | ||
| ALC (109/L) | 1.11 (0.67–1.77) | 2.00 (1.43–2.67) | 1.17 (0.86–1.47) | 0.58 (0.38–0.81) | 813.45 | ||
| Sex (%) | Female | 742.00 (49.07%) | 230.00 (45.63%) | 248.00 (49.21%) | 264.00 (52.38%) | 4.59 | 0.101 |
| Male | 770.00 (50.93%) | 274.00 (54.37%) | 256.00 (50.79%) | 240.00 (47.62%) | |||
| CKD (%) | No | 954.00 (63.10%) | 372.00 (73.81%) | 301.00 (59.72%) | 281.00 (55.75%) | 38.98 | |
| Yes | 558.00 (36.90%) | 132.00 (26.19%) | 203.00 (40.28%) | 223.00 (44.25%) | |||
| COPD (%) | No | 1105.00 (73.08%) | 418.00 (82.94%) | 374.00 (74.21%) | 313.00 (62.10%) | 56.08 | |
| Yes | 407.00 (26.92%) | 86.00 (17.06%) | 130.00 (25.79%) | 191.00 (37.90%) | |||
| In-hospital mortality (%) | No | 1236.00 (81.75%) | 453.00 (89.88%) | 422.00 (83.73%) | 361.00 (71.63%) | 58.27 | |
| Yes | 276.00 (18.25%) | 51.00 (10.12%) | 82.00 (16.27%) | 143.00 (28.37%) | |||
| 28-day all-cause mortality (%) | No | 1221.00 (80.75%) | 452.00 (89.68%) | 413.00 (81.94%) | 356.00 (70.63%) | 59.52 | |
| Yes | 291.00 (19.25%) | 52.00 (10.32%) | 91.00 (18.06%) | 148.00 (29.37%) | |||
PLR: Tertile 1 (T1: 1.10–105.42), Tertile 2 (T2: 105.52–235.82), Tertile 3 (T3: 237.24–5300).
PLR, platelet-to-lymphocyte ratio; SpO2, oxygen saturation; SBP, systolic blood pressure; SOFA, Sequential Organ Failure Assessment; RDW, Red Blood Cell Distribution Width; WBC, white blood cell; ANC, absolute neutrophil count; PaO2, partial pressure of arterial oxygen; APTT, Activated Partial Thromboplastin Time; BUN, blood urea nitrogen; LDH, lactate dehydrogenase; PLT, platelet; ALC, absolute lymphocyte count; CKD, chronic kidney disease; COPD, chronic obstructive pulmonary disease; iCa2+, ionized calcium.
Metabolic and biochemical disturbances were also associated with higher PLR,
including increased glucose levels (p
Notably, mortality outcomes differed substantially across tertiles. T3 patients
demonstrated significantly higher in-hospital mortality (p
Kaplan-Meier analysis (Fig. 2) demonstrated significant divergence in survival
curves across PLR tertiles (log-rank p
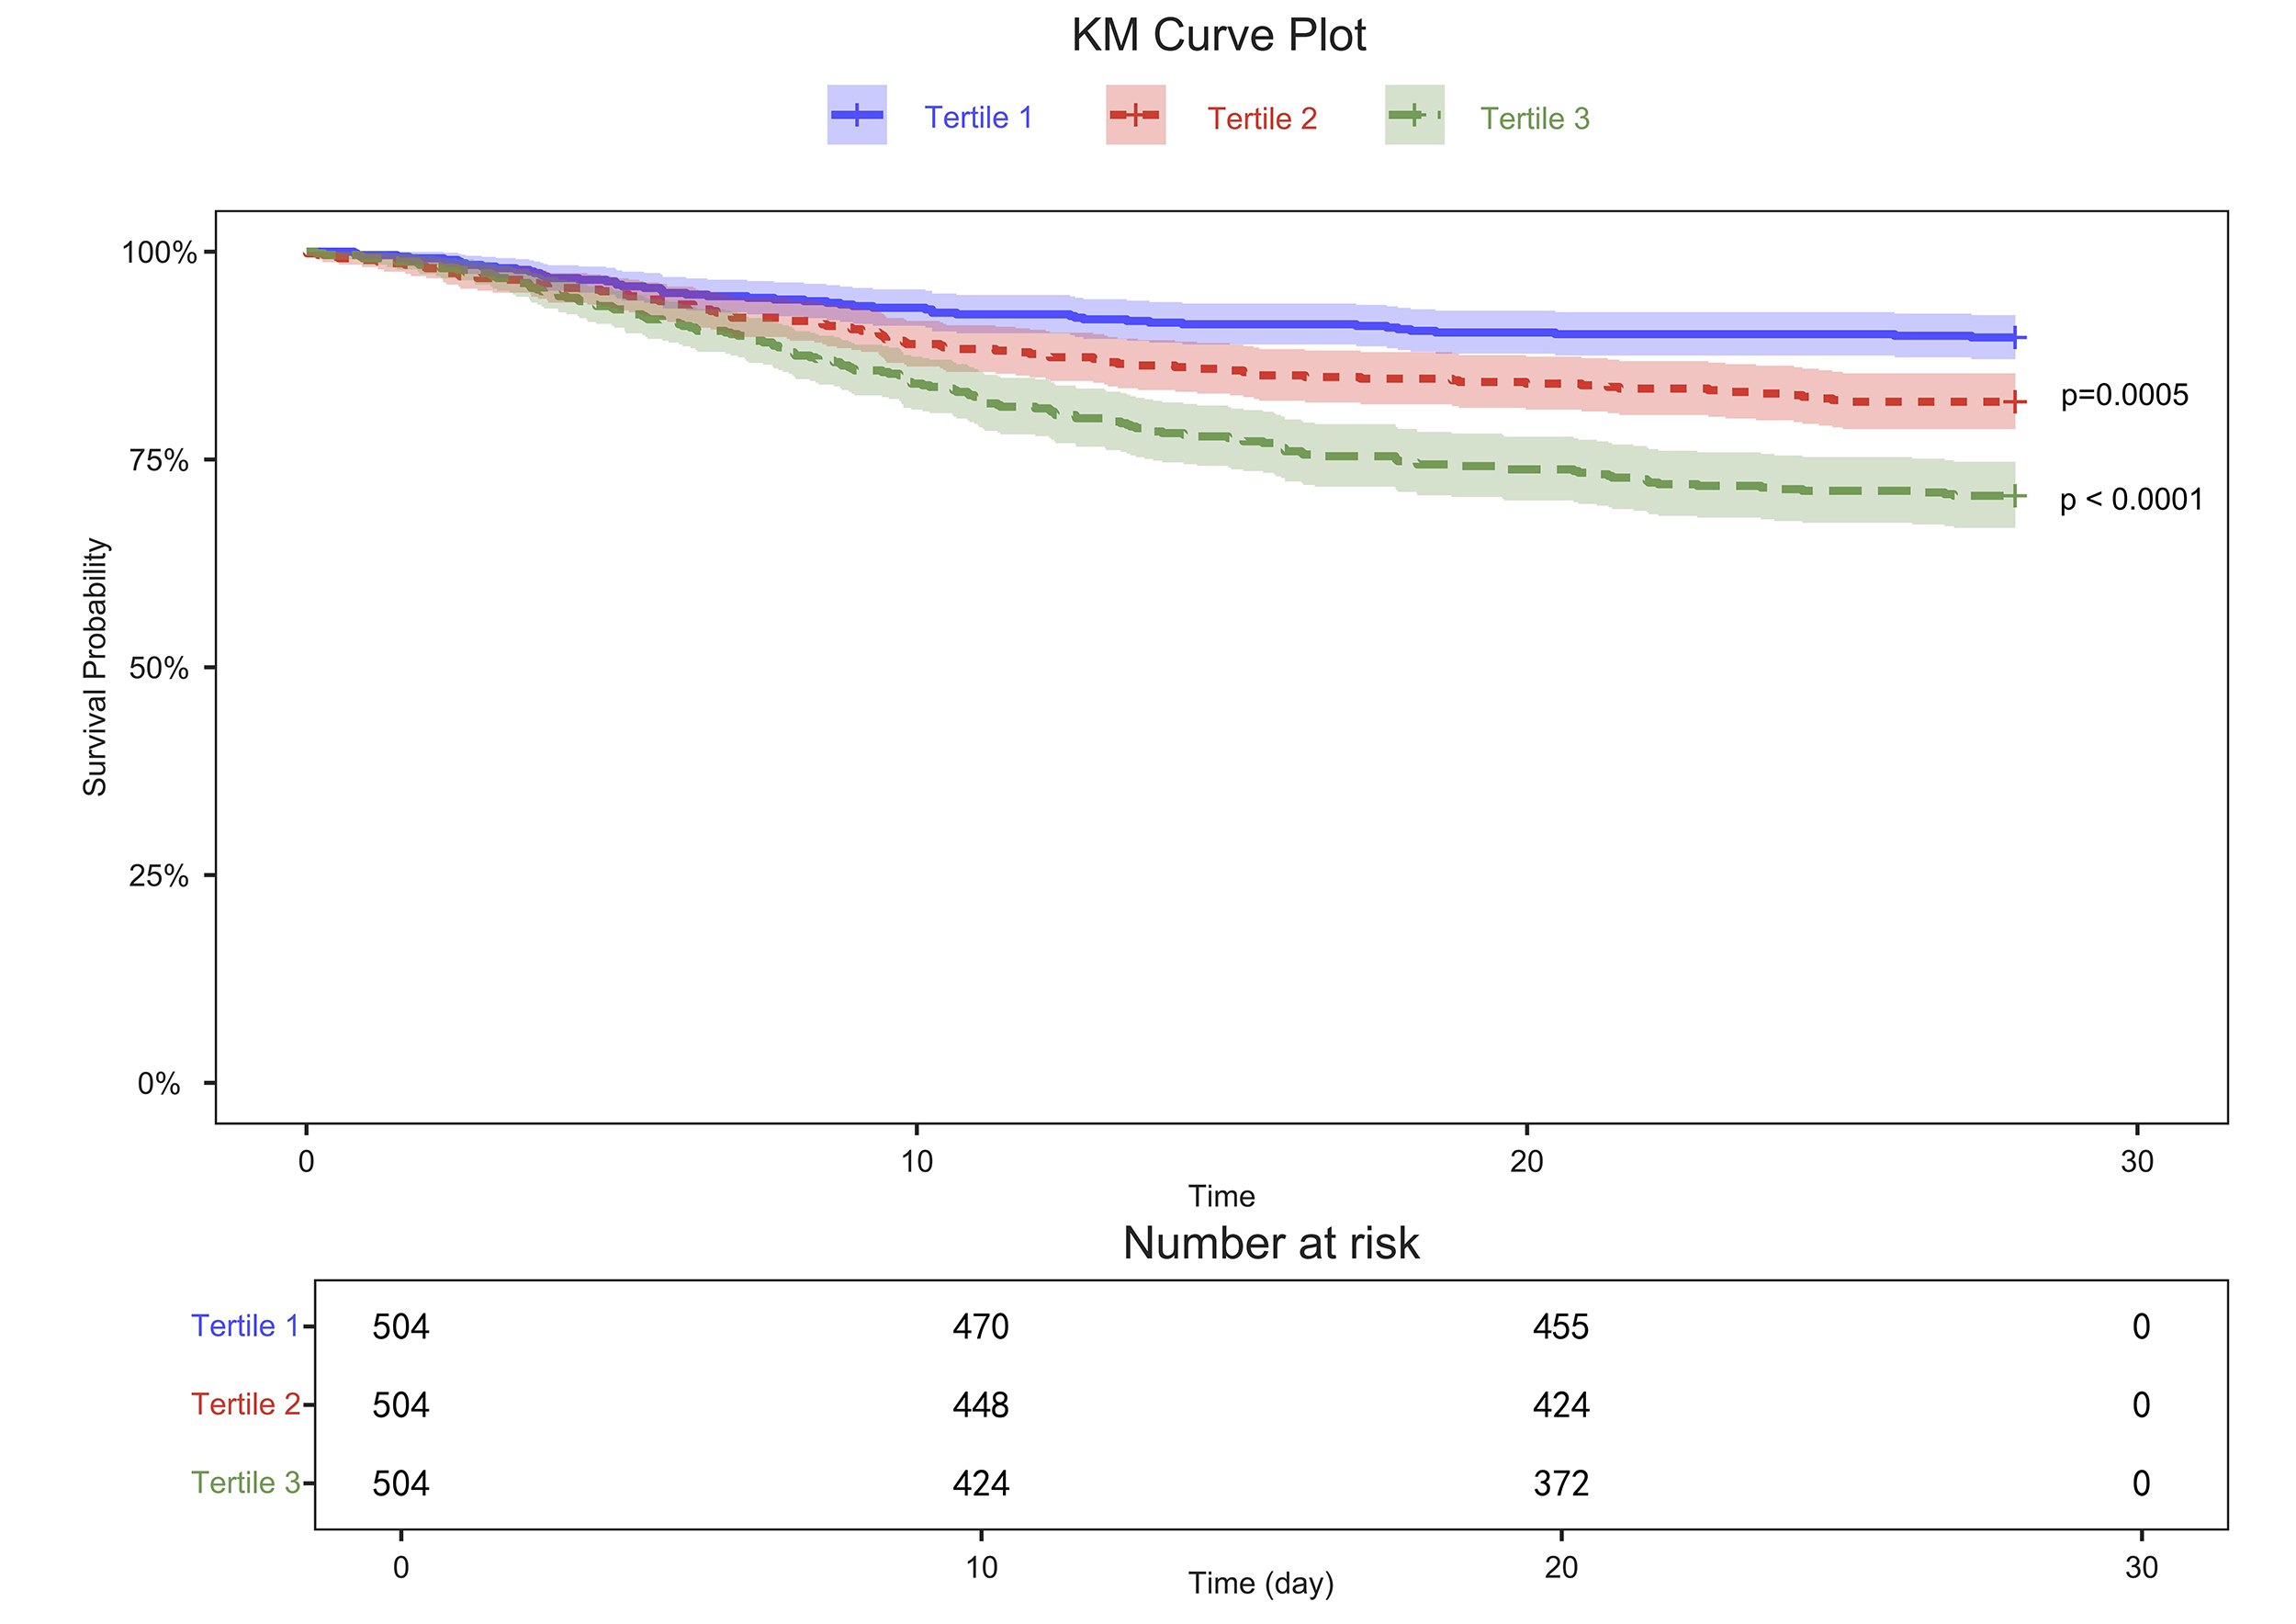 Fig. 2.
Kaplan-Meier (KM) survival curves for 28-day outcomes in patients with pulmonary arterial hypertension. Survival rates are shown by platelet-to-lymphocyte ratio (PLR) tertiles: Tertile 1 (1.10–105.42), Tertile 2 (105.52–235.82), Tertile 3 (237.24–5300).
In multivariable Cox regression models, adjustments were made for sex, age,
weight, CKD, COPD, heart rate, respiratory rate, systolic blood pressure,
SpO2, and SOFA score. Cox regression revealed a dose-dependent mortality
risk (Table 2). Unadjusted models showed a 3.102-fold increased hazard in the
highest PLR tertile (hazard ratio (HR) = 3.102, 95% confidence interval (CI):
2.253–4.271, p
| PLR | Unadjusted HR (95% CI) | p-value | PLR | Adjusted HR (95% CI) | Adjusted p-value |
| T1 | Reference | T1 | Reference | ||
| T2 | 1.667 (1.175–2.364) | 0.004 | T2 | 1.787 (1.243–2.569) | 0.002 |
| T3 | 3.102 (2.253–4.271) | T3 | 3.047 (2.16–4.298) |
HR, hazard ratio; CI, confidence interval.
| PLR | Unadjusted HR (95% CI) | p-value | PLR | Adjusted HR (95% CI) | Adjusted p-value |
| T1 | Reference | T1 | Reference | ||
| T2 | 1.818 (1.293–2.556) | 0.001 | T2 | 1.928 (1.355–2.743) | |
| T3 | 3.125 (2.278–4.286) | T3 | 3.064 (2.18–4.305) |
Unadjusted model, Cox proportional hazards regression without covariate adjustment; Adjusted model, multivariable Cox regression adjusted for covariates; HR (95% CI), hazard ratio with 95% confidence interval; Reference group, T1 (lowest PLR tertile). T1 = 1.10–105.42; T2 = 105.52–235.82; T3 = 237.24–5300.
Restricted cubic spline analyses revealed nonlinear associations between PLR and
mortality outcomes in critically ill PAH patients. For in-hospital mortality
(Fig. 3A,B), the unadjusted model identified an optimal inflection point at PLR =
75.92. Below this value, mortality risk plateaued, while above it, risk increased
significantly (HR = 2.967, 95% CI: 1.448–6.078, p
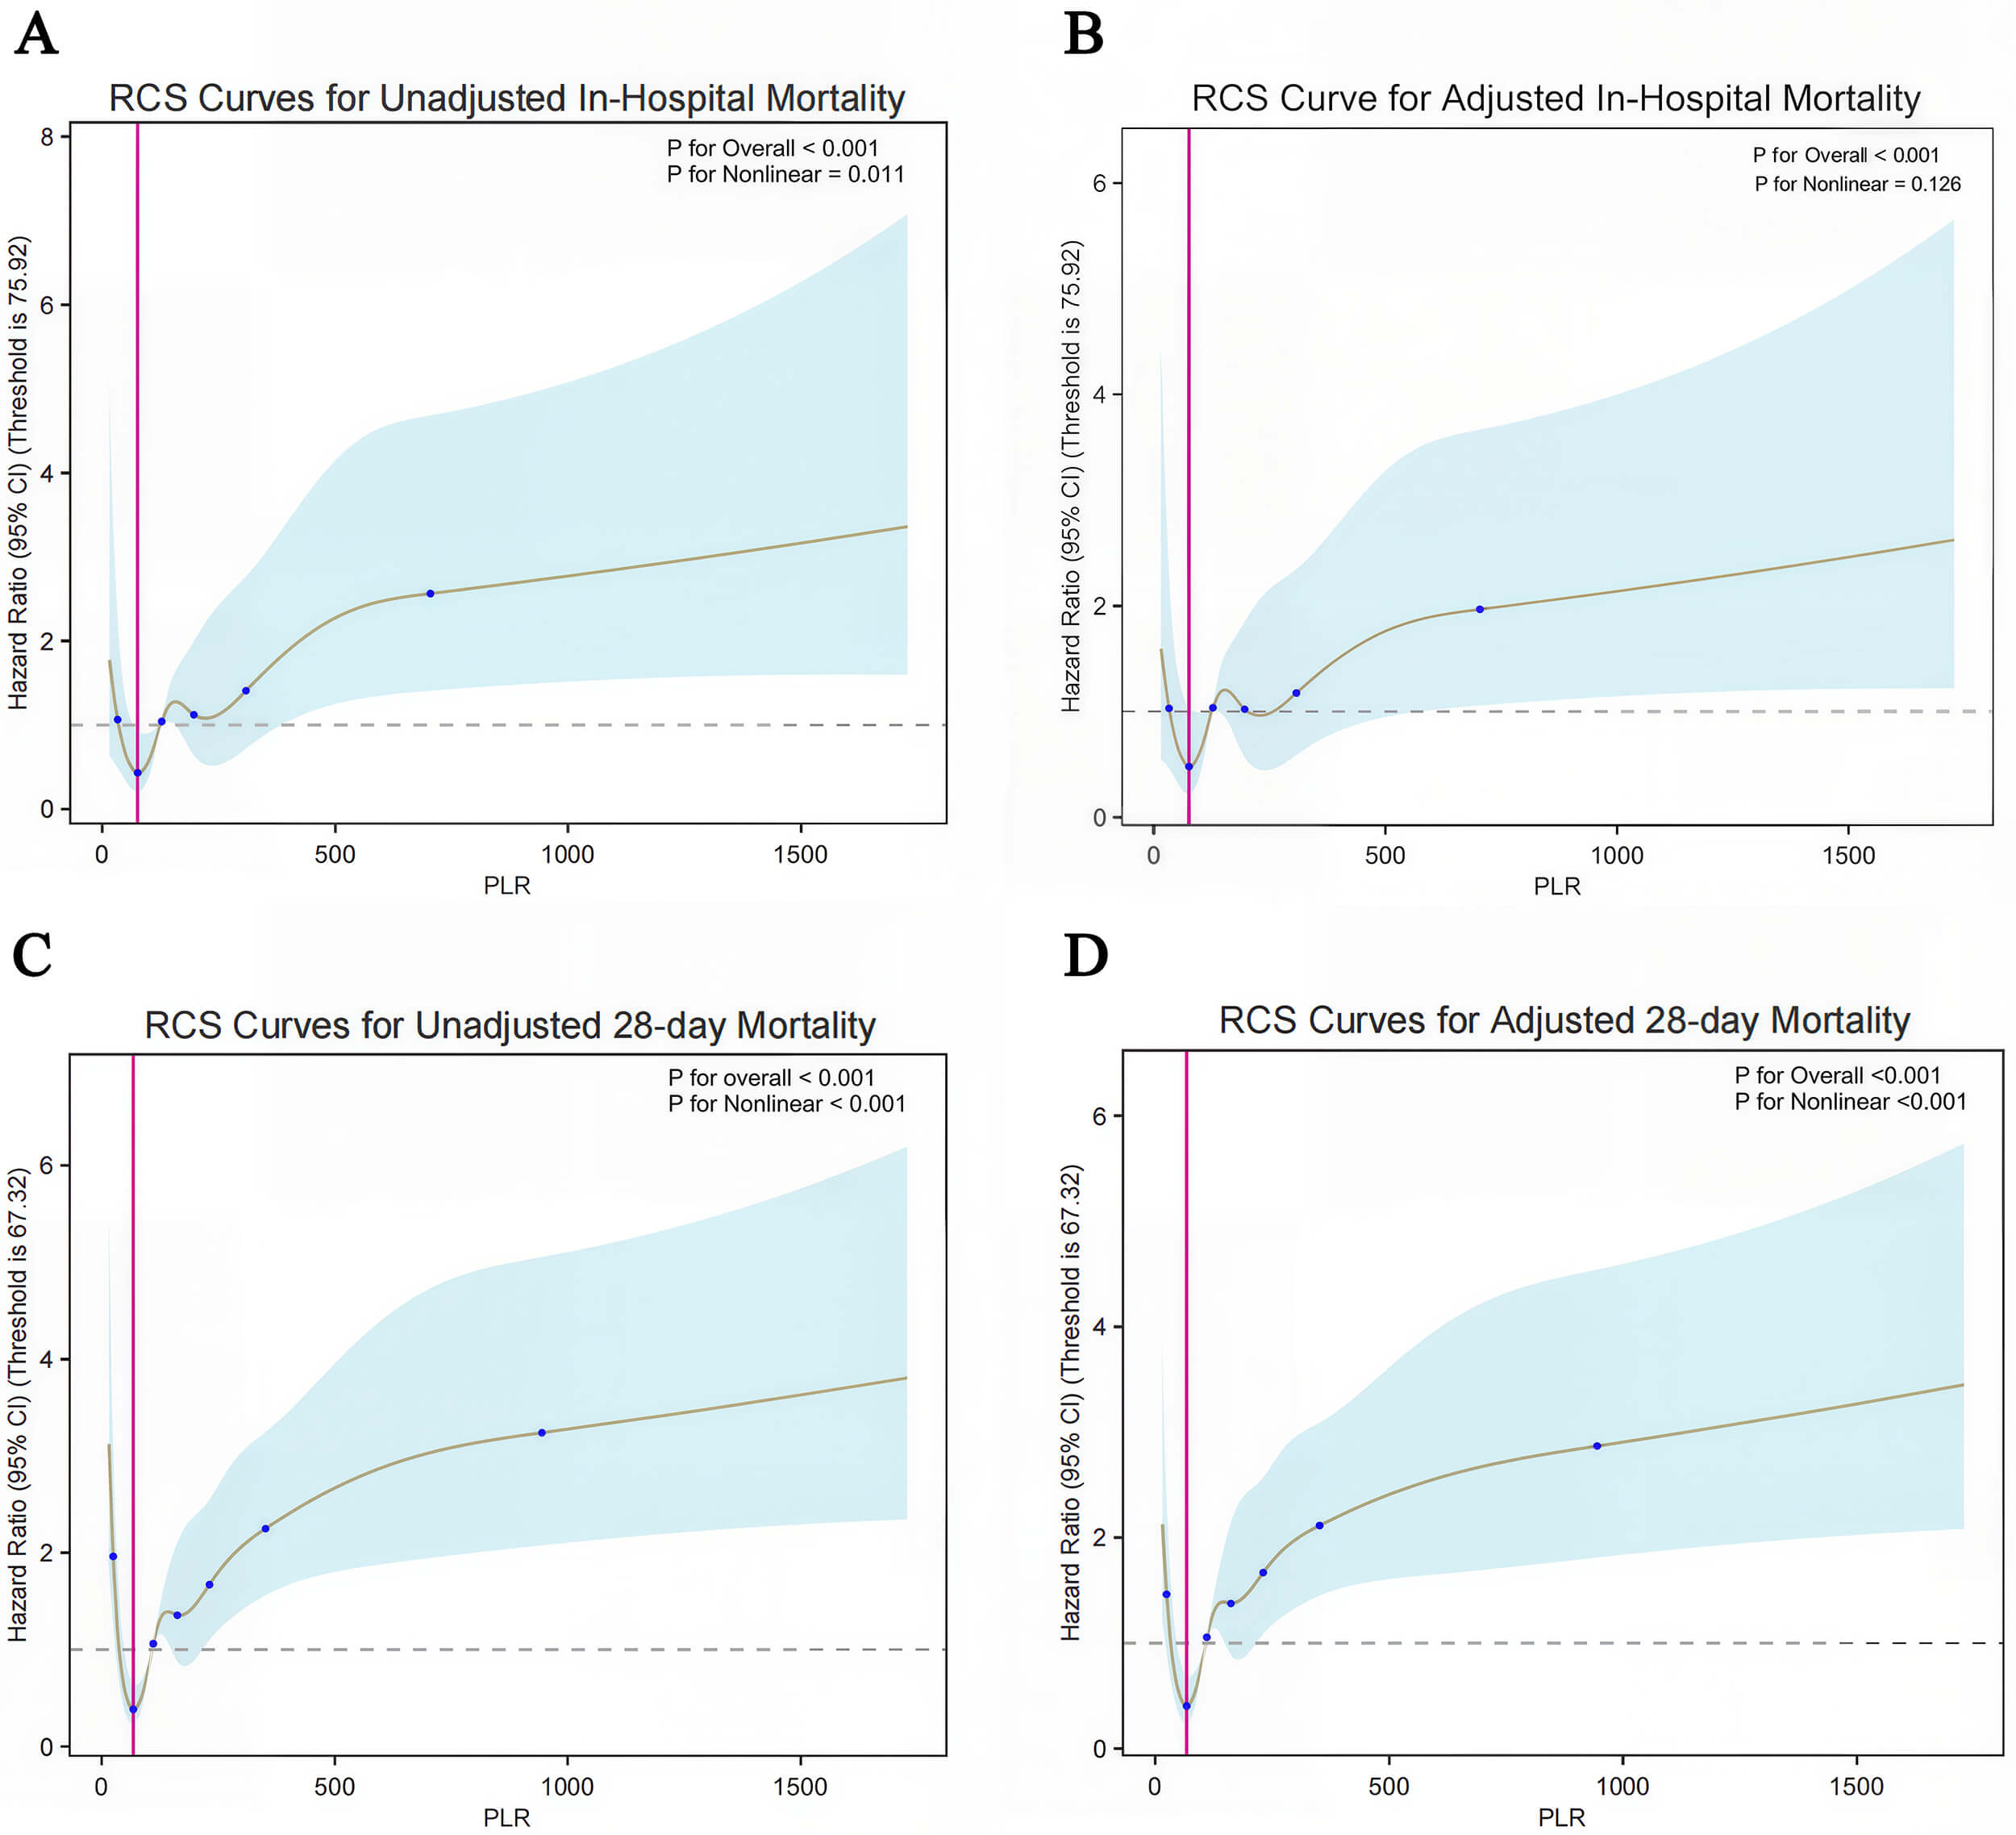 Fig. 3.
Nonlinear association between PLR and 28-day all-cause mortality in pulmonary arterial hypertension (PAH). (A) Restricted cubic spline (RCS) curve for in-hospital mortality without covariate adjustment. (B) RCS curve for in-hospital mortality adjusted for confounders. (C) RCS curve for 28-day all-cause mortality without multivariable adjustment. (D) RCS curve for 28-day all-cause mortality with covariate adjustment. Shaded areas indicate 95% confidence intervals. Vertical red lines denote threshold values corresponding to minimal hazard ratios (HRs), while horizontal dashed lines represent the reference HR of 1.0. Covariates adjusted in multivariable models included sex, age, weight, comorbidities, heart rate, respiratory rate, systolic blood pressure, oxygen saturation, and Sequential Organ Failure Assessment (SOFA) score. Details of covariate selection rationale are provided in Multivariable Modeling section (consistent with the previous multivariate regression analysis).
For 28-day all-cause mortality, PLR demonstrated a robust U-shaped association
(p
Covariate analyses identified SOFA score (HR = 2.004), age (HR = 1.365), and
admission heart rate (HR = 1.277) as significant predictors of increased
mortality (all p
Feature selection using the Boruta algorithm was performed on 27
clinical and laboratory parameters to evaluate PLR and other predictors of 28-day
mortality among critically ill PAH patients. After 100 importance iterations with
Bonferroni correction (
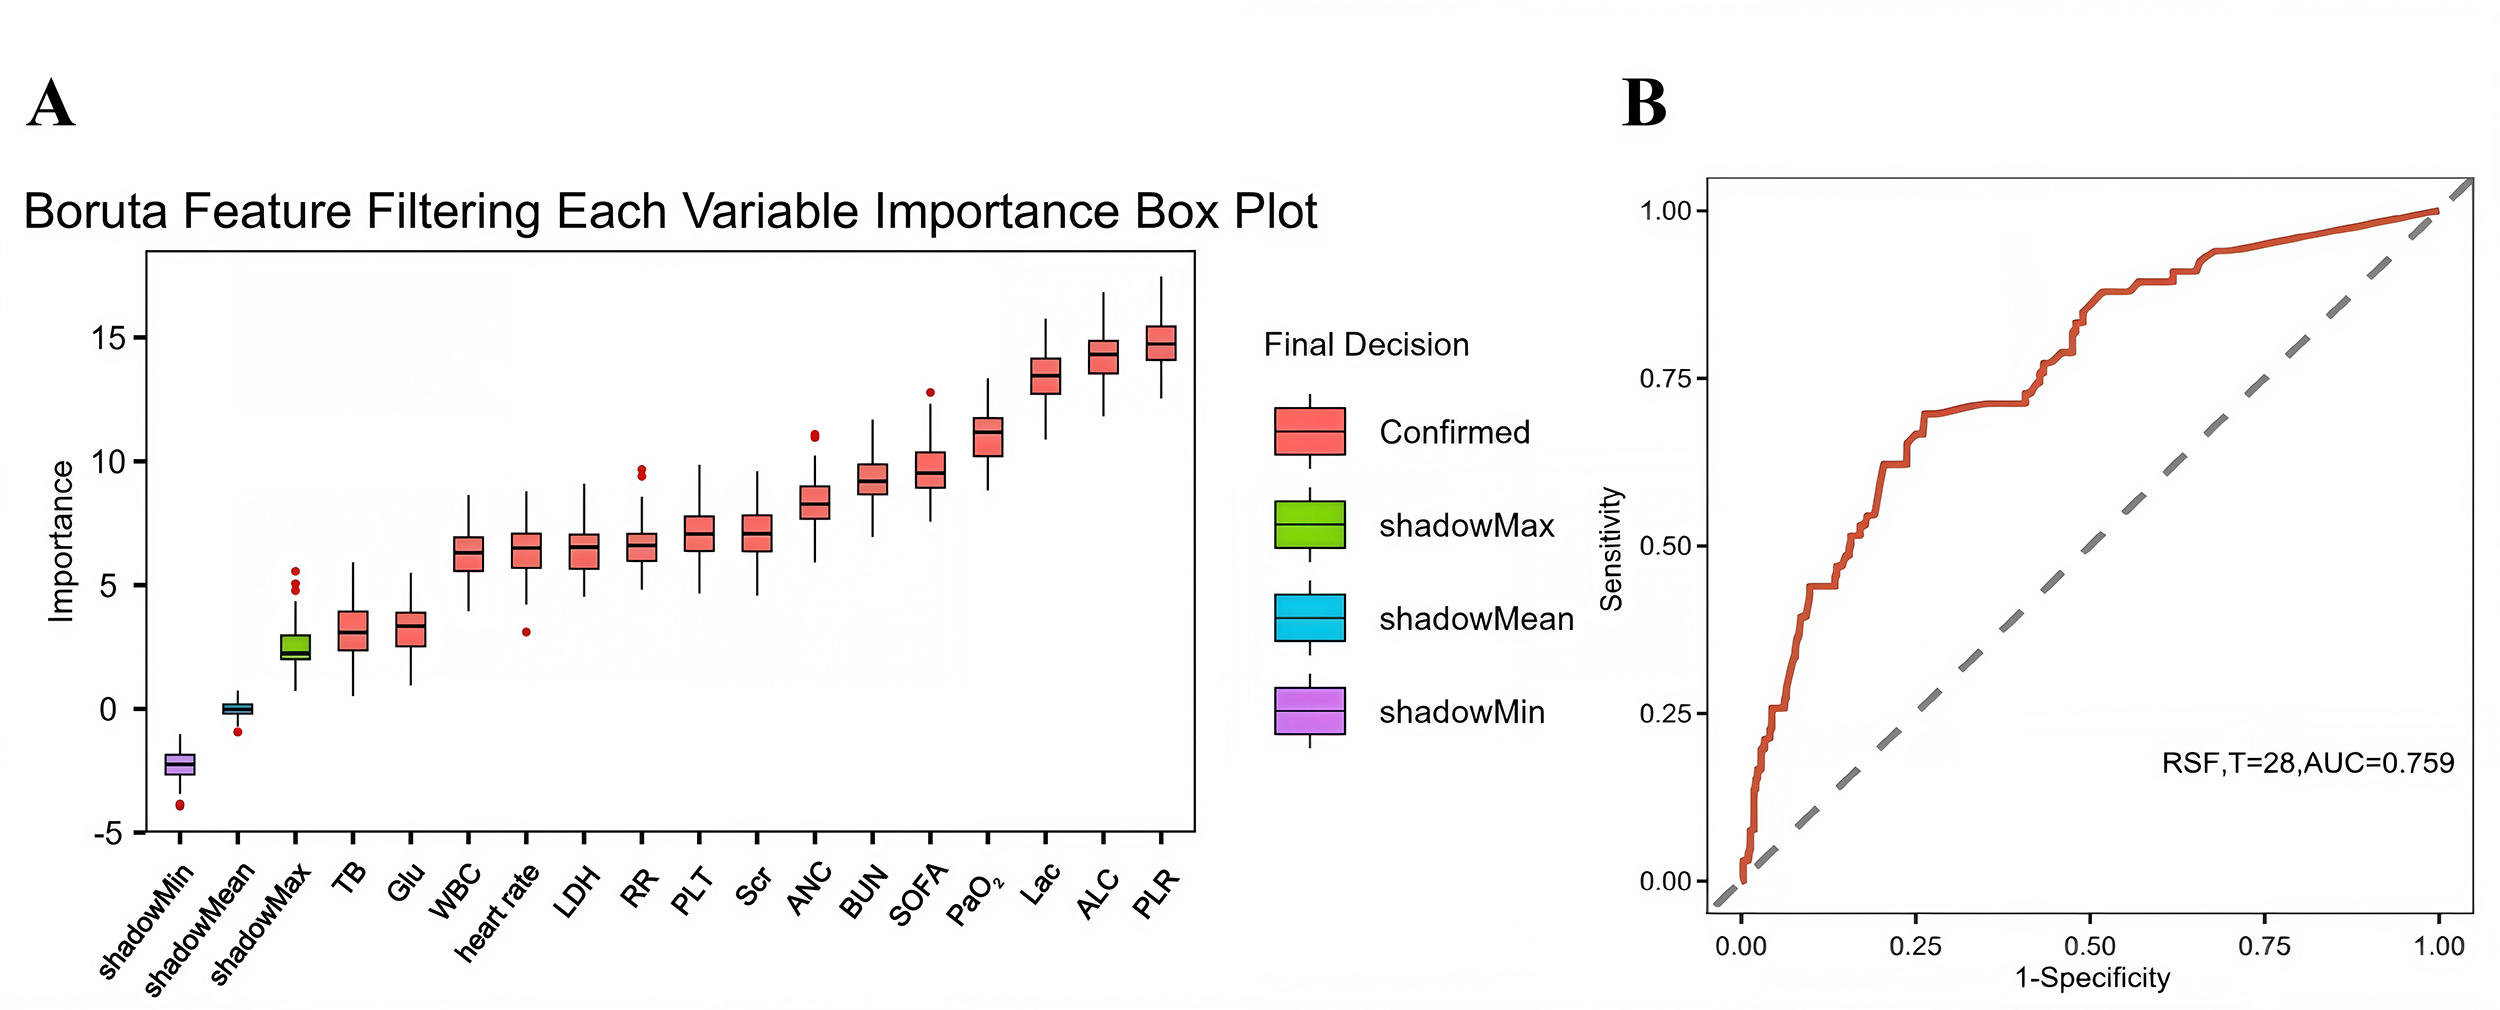 Fig. 4.
Receiver operating characteristic (ROC) curve analysis of the random survival forest (RSF) machine learning model. (A) Variable importance assessment by the Boruta algorithm. The X-axis shows variable names, while the Y-axis shows corresponding Z-scores. Boxplots depict the distribution of Z-scores across 1000 iterations. Predictors were categorized as significant (red boxes) or nonsignificant (green boxes) based on permutation importance thresholds. (B) ROC curve showing RSF performance for time-to-event prediction (days). TB, total bilirubin; Glu, blood glucose; WBC, white blood cell; LDH, lactate dehydrogenase; RR, respiratory rate; PLT, platelet; Scr, serum creatinine; ANC, absolute neutrophil count; BUN, blood urea nitrogen; SOFA, Sequential Organ Failure Assessment; PaO2, partial pressure of arterial oxygen; Lac, blood lactate; ALC, absolute lymphocyte count; PLR, platelet-to-lymphocyte ratio; AUC, area under the curve; RSF, random survival forest.
A random forest machine learning model incorporating these variables
demonstrated the predictive capacity of PLR for short-term mortality risk.
Discrimination was assessed via receiver operating characteristic (ROC) curve
analysis, with AUC and 95% CI used to quantify diagnostic accuracy in
distinguishing survivors from non-survivors at 28 days. The ROC analysis revealed
an AUC of 0.759 (95% CI: 0.708–0.810, p
Subgroup analyses (Fig. 5) using Cox regression models demonstrated consistent
associations between elevated PLR tertiles and increased 28-day mortality across
age, sex, CKD, and COPD subgroups in critically ill PAH patients, with no
statistically significant interaction effects (p-interaction
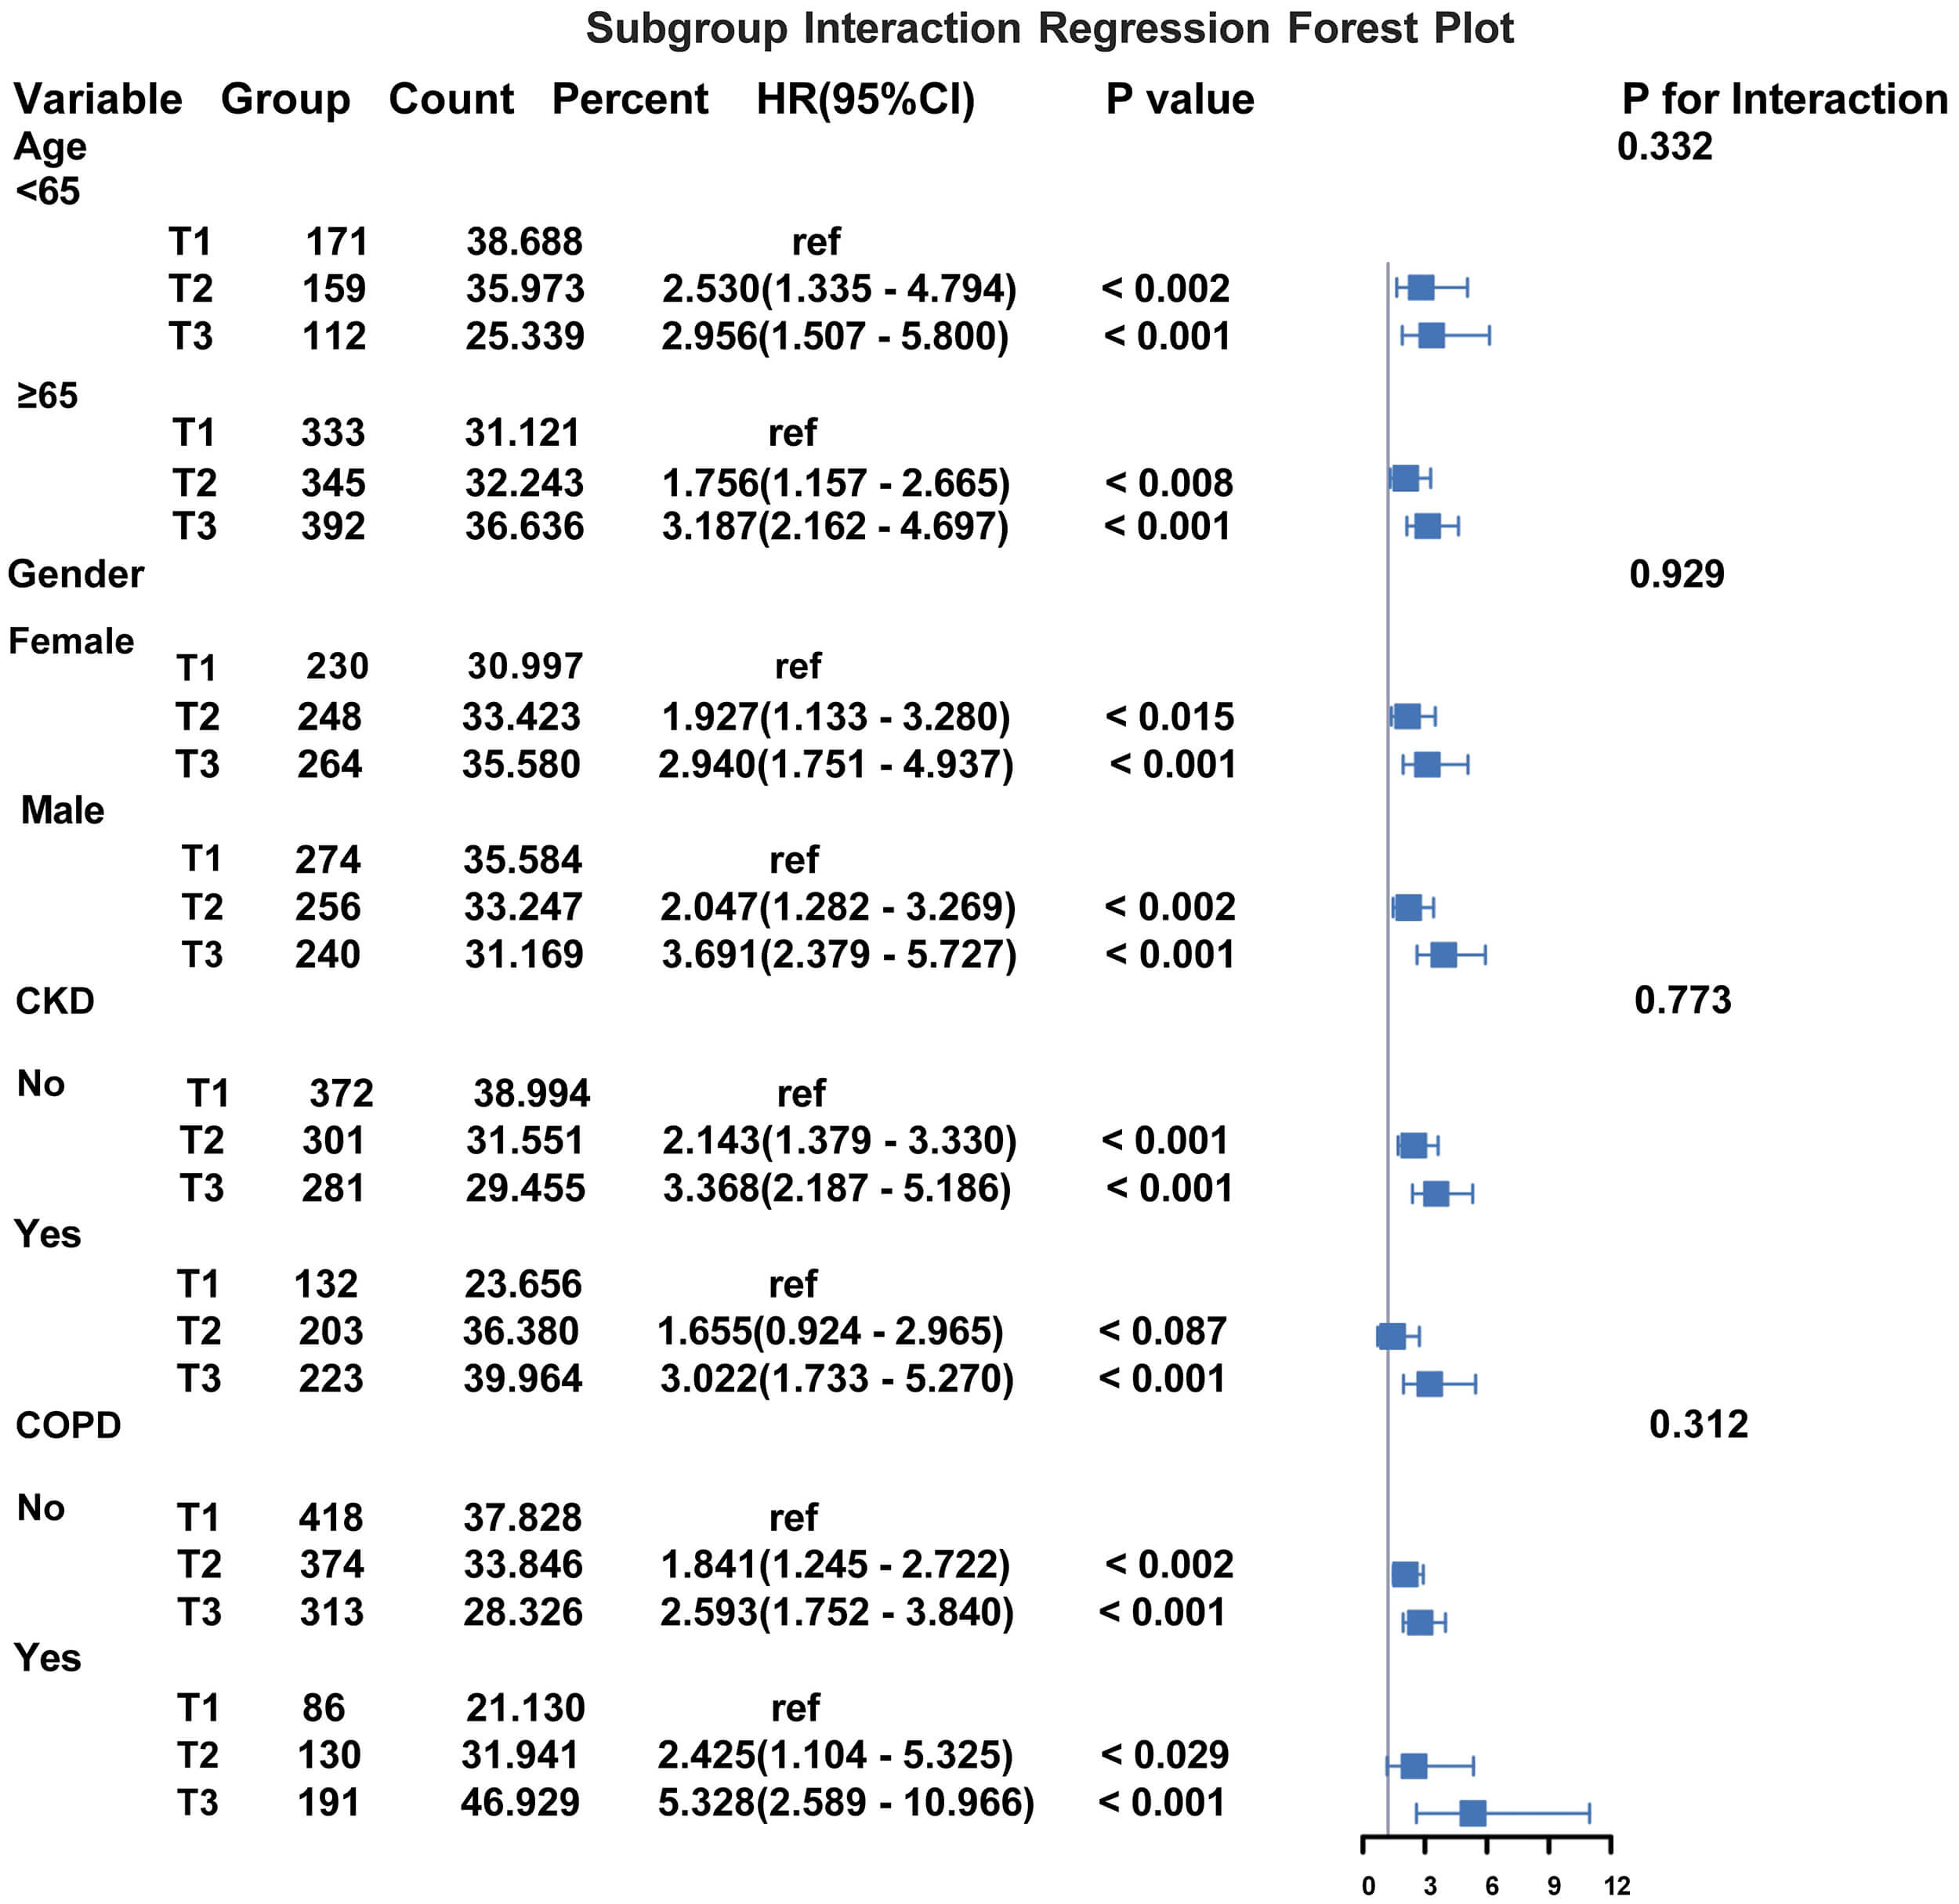 Fig. 5.
Forest plot of subgroup interaction analyses for 28-day all-cause mortality. The multivariable Cox model was adjusted for confounders, including body weight, heart rate, respiratory rate, systolic blood pressure, and SOFA score. Hazard ratios (HRs) with 95% confidence intervals (CIs) are shown. Group column denotes tertile stratification: Tertile 1 (T1), Tertile 2 (T2), and Tertile 3 (T3), representing ordered subgroups by distribution of the exposure variable. ref, reference.
Comorbidity-stratified analyses revealed elevated mortality risks for T3 PLR among CKD patients (HR = 3.022, 95% CI: 1.733–5.27) and COPD patients (HR = 5.328, 95% CI: 2.589–10.966), yet neither interaction term reached statistical significance (p = 0.773 and 0.312, respectively). Forest plots confirmed uniform risk gradients across subgroups, with overlapping confidence intervals underscoring the stable prognostic value of PLR. Collectively, elevated PLR independently predicted 28-day mortality in severe PAH without significant modification by age, sex, or cardiopulmonary comorbidities.
This retrospective cohort study elucidated the nonlinear threshold effects of PLR on 28-day mortality in critically ill adults with PAH, leveraging comprehensive clinical data from the MIMIC-IV 3.0 database. Our findings reveal that elevated PLR levels correlate with adverse hemodynamic and laboratory profiles, including increased heart rate, respiratory rate, and markers of end-organ dysfunction such as elevated total bilirubin and lactate dehydrogenase. These associations are consistent with the established interplay between systemic inflammation, coagulation abnormalities, and disease progression in PAH [17, 18].
Univariate analysis demonstrated a strong association between PLR tertiles and
28-day mortality (
The nonlinear relationship between PLR and in-hospital mortality highlights a critical threshold effect. The unadjusted model identified a PLR threshold of 75.92, beyond which mortality risk rose sharply. The loss of significance in the nonlinear association after covariate adjustment (p = 0.126) may reflect mediation by SOFA score, age, and oxygenation. Although covariate adjustment attenuated this association, the persistence of a U-shaped relationship for 28-day all-cause mortality, with a consistent threshold at 67.32, suggests that PLR remains an independent prognostic marker. This dual-phase association implies that both extremes of PLR, whether reflecting severe thrombocytosis with lymphopenia or profound thrombocytopenia, may signify distinct pathophysiological states contributing to mortality [6, 19]. The reduced significance of the nonlinear relationship after adjusting for covariates such as SOFA score, age, and SpO2 highlights the multifactorial determinants of mortality in PAH; PLR likely interacts with systemic inflammation and organ dysfunction.
This study is the first to establish mortality risk thresholds for PLR (67.32 and 75.92) in critically ill PAH patients. These cutoff values likely represent distinct pathophysiological states. Values below the threshold may reflect preserved lymphocyte function and relative immune homeostasis, potentially contributing to improved survival [20]. Conversely, values exceeding the threshold suggest a vicious cycle of platelet activation and lymphocyte depletion, overlapping with the PLR range observed in PAH-related thromboinflammatory processes and multiorgan failure in critical illness [7, 21].
Machine learning validation further corroborated the predictive value of PLR. The random forest model, incorporating PLR and 14 other clinically relevant features, demonstrated moderate discriminative performance (AUC: 0.759), with PLR-associated risk scores independently predicting a 19.8% increase in mortality per unit rise. This observation aligns with previous evidence implicating PLR as a surrogate marker of immune-thrombotic dysregulation [19], though our study is the first to quantify its threshold effects in PAH. Subgroup analyses reinforced the robustness of PLR’s prognostic value, showing consistent mortality gradients across age, sex, and comorbidity strata without significant interaction effects. The heightened mortality observed in CKD and COPD subgroups, although not significantly modified, may reflect amplified systemic inflammation in these populations [15, 19].
From a methodological perspective, exclusion of collinear variables (e.g., hematocrit) preserved model integrity, with retained predictors (PLR and SOFA score) demonstrating low multicollinearity. The adjusted Cox model achieved a C-index of 0.733, indicating clinically meaningful predictive accuracy, while machine learning-derived risk scores provide an additional framework for personalized mortality risk assessment.
This study has several limitations. First, its retrospective design introduces inherent biases and potential unmeasured confounders. Second, reliance on single-timepoint PLR measurements precluded longitudinal assessment of dynamic changes. The lack of granular PAH-specific parameters, such as right ventricular function metrics, further limits mechanistic insights into the role of PLR in pulmonary vascular remodeling [22, 23]. Additionally, the fixed-time hematologic sampling in MIMIC-IV precluded evaluation of PLR trajectory changes relative to evolving clinical outcomes. Future prospective studies should validate these thresholds in diverse populations with protocol-driven blood sampling and investigate whether targeted interventions that modulate PLR across disease phases can improve outcomes.
PLR emerges as a pragmatic, easily obtainable biomarker for mortality risk stratification in critically ill PAH patients. Identification of specific PLR thresholds (67.32–75.92) offers actionable targets for prognostic assessment, facilitating earlier recognition of high-risk patients. Integration of PLR into existing prognostic models could enhance predictive accuracy and optimize resource allocation in critical care settings, though clinical decisions regarding monitoring or therapeutic strategies should remain individualized and based on comprehensive evaluation.
• PLR demonstrates a U-shaped relationship with 28-day mortality in critical PAH, with risk increasing beyond 67.32 and relatively reduced below this threshold (adjusted HR = 3.787, 95% CI: 2.431–5.898).
• Defined PLR thresholds (67.32–75.92) enable rapid ICU risk stratification using routine admission blood tests.
• Machine learning confirmed the contribution of PLR to mortality prediction (AUC = 0.759), with each unit increase in PLR associated with a 19.8% rise in risk.
• Elevated PLR predicted mortality consistently across age, sex, CKD, and COPD subgroups without significant interaction effects.
The data analyzed in this study comes from the publicly available MIMIC-IV database, but the use of the data has certain restrictions and requires training and permission. The research data can be found at the following URL: https://mimic.mit.edu/.
Conceptualization, DDG and ZGZ; methodology, DDG; software, DDG; validation, DDG, ZGZ; formal analysis, DDG; investigation, DDG; resources, DDG, ZGZ; data curation, DDG; writing—original draft preparation, DDG; visualization, DDG; supervision, ZGZ; project administration, ZGZ. Both authors contributed to revising the manuscript critically for important intellectual content. Both authors have read and agreed to the final published version of the manuscript. Both authors have participated sufficiently in the work and agreed to be accountable for all aspects of the work.
This study is a retrospective analysis based on the de-identified Medical Information Mart for Intensive Care IV (MIMIC-IV) database. As the database has already undergone ethical review and obtained informed consent waiver from the Institutional Review Board (IRB) of Beth Israel Deaconess Medical Center, no additional ethical approval or informed consent is required for the present study.
The authors express gratitude to the participants involved in the MIMIC-IV database and all related researchers.
This research received no external funding.
The authors declare no conflict of interest.
Supplementary material associated with this article can be found, in the online version, at https://doi.org/10.31083/BJHM52966.
References
Publisher’s Note: IMR Press stays neutral with regard to jurisdictional claims in published maps and institutional affiliations.