


 , Jing Zhang 1, Cuiping Jiang 1, Yuxin Huang 1,*
 , Xiaoming Tao 1,*
1 Department of Endocrinology, Huadong Hospital, Fudan University, 200040 Shanghai, China
Abstract
The dawn phenomenon (DP), characterized by spontaneous morning hyperglycemia in type 2 diabetes mellitus (T2DM), may exacerbate post-breakfast glucose excursions. This study investigated the association between DP and postprandial hyperglycemia, referred to as the “extended dawn phenomenon”.
In this cross-sectional study, 500 T2DM patients (glycated hemoglobin A1c (HbA1c) <7.5%) were recruited from Huadong Hospital, Fudan University between 2021 and 2023. A total of 40 participants were excluded due to incomplete data, resulting in 460 patients for final analysis. All participants underwent continuous glucose monitoring (CGM) and were stratified by the magnitude of DP (δDawn, defined as the difference between fasting glucose and nocturnal nadir glucose, with a threshold of ≥1.11 mmol/L). They were then matched by fasting glucose. Glycemic profiles, including peak post-breakfast glucose and time-in-range (TIR; percentage of time within the target glucose range of 3.9–10.0 mmol/L), were compared between groups. Multivariable logistic regression was used to identify determinants of post-breakfast hyperglycemia.
Despite comparable fasting glucose levels, patients with DP exhibited higher peak post-breakfast glucose (median (interquartile ranges [IQR]): 9.7 [8.2–10.7] vs 8.9 [8.0–10.0] mmol/L, p = 0.02) and reduced TIR in the overall cohort (94.1% [85.8–100.0] vs 100.0% [92.3–100.0], p < 0.001), although this difference attenuated after matching (p = 0.133). δDawn independently predicted post-breakfast hyperglycemia (odds ratio (OR) = 1.591, 95% confidence interval (CI): 1.283–1.993, p < 0.001), along with HbA1c (OR = 2.322, 95% CI: 1.530–3.566, p < 0.001), homeostatic model assessment for insulin resistance (HOMA-IR) (OR = 1.308, 95% CI: 1.110–1.548, p = 0.001), and homeostasis model assessment of β-cell function (HOMA-β) (OR = 0.990, 95% CI: 0.983–0.997, p = 0.004).
DP contributes to prolonged postprandial hyperglycemia, underscoring its role as a potential therapeutic target for optimizing glycemic control in T2DM.
Keywords
- continuous glucose monitoring
- type 2 diabetes mellitus
- postprandial hyperglycemia
The dawn phenomenon (DP), initially described in 1981 by Schmidt et al. [1], refers to elevated fasting blood glucose levels or spontaneous
increases in early-morning insulin requirements. This condition is now recognized
as highly prevalent among diabetic populations [2]. Using
continuous glucose monitoring (CGM), DP can be assessed by measuring the
difference between the nocturnal nadir and fasting glucose levels [2]. The impact of DP is approximately a 0.4% increase in glycated hemoglobin A1c (HbA1c) and a 12.4 mg/dL rise in average 24-hour mean glucose
concentrations [3]. Although direct evidence is limited,
DP appears to contribute to elevated blood glucose levels that extend into both
preprandial and postprandial phases [4, 5]. Previous studies have shown that the highest peak glucose values in
people with diabetes occur during the post-breakfast period [3, 6, 7]. In addition,
post-breakfast hyperglycemia is a consistent finding in individuals with type 2
diabetes mellitus, regardless of HbA1c level, therapeutic interventions, or
Compared to DP, the “extended dawn phenomenon” may play a more critical role in postprandial glucose regulation due to its prolonged hyperglycemic effects. However, research on the “extended dawn phenomenon” remains scarce, and its underlying mechanisms are poorly characterized. Notably, there is currently limited evidence directly linking DP and post-breakfast hyperglycemia. Addressing this gap, our study hypothesizes that DP is independently associated with post-breakfast hyperglycemia and aims to investigate its potential as a target for glycemic control.
This cross-sectional study enrolled 500 individuals with type 2 diabetes mellitus (T2DM), aged 27–88 years (male-to-female ratio approximately 1.17), from both inpatient endocrinology wards and outpatient metabolic clinics at Huadong Hospital, Fudan University, during a 24-month recruitment window (2021–2023). The investigation protocol was approved by the Ethics Committee of Huadong Hospital, Fudan University (approval number: 2020K033), ensuring strict adherence to international bioethical principles outlined in the Declaration of Helsinki. All participants provided written informed consent following comprehensive disclosure of the study protocol.
Inclusion criteria were as follows: (a) ability to provide informed consent and
willingness to participate; (b) diagnosis of type 2 diabetes mellitus (WHO 1999 criteria)
[8]; (c) stable treatment with metformin and diet therapy
for at least 3 months; (d) age
Anthropometric parameters and venous blood specimens were systematically
collected from all participants. Centralized laboratory analyses quantified
fasting plasma glucose (FPG), HbA1c (measured by high-performance liquid
chromatography), and serum insulin (exclusively for computing homeostatic model
assessment (HOMA) indices: homeostatic model assessment for insulin resistance
(HOMA-IR) and homeostasis model assessment of
All subjects underwent 72-hour ambulatory glucose profiling using a blinded CGM system (iPro-2 CGM, Medtronic, MN, USA). To exclude potential artifacts associated with sensor attachment and detachment, CGM-derived data from the initial 48-hour period (days 1–2) were utilized for analysis. Mean glucose concentrations were calculated by averaging all valid measurements across both full monitoring days to ensure data robustness. Glycemic control metrics were computed as follows: time-in-range (TIR) was quantified as the percentage of 24-hour glucose readings maintained between 3.9 and 10.0 mmol/L, consistent with international consensus criteria [10].
The magnitude of DP (
Participants were categorized into two groups based on the presence or absence of DP. To isolate the impact of DP on postprandial glucose dynamics, pairwise 1:1 matching between the two groups was conducted using fasting glucose levels as the primary covariate (Fig. 1). Specifically, a propensity score matching algorithm (implemented in SPSS Statistics version 23.0 (IBM Corp., Armonk, NY, USA)) was applied to match DP patients with non-DP controls, ensuring balanced baseline characteristics for quantifying post-breakfast glucose elevation. Following this process, 102 DP patients and 102 matched non-DP counterparts were retained for further analysis. Adapting an established methodology [3], the influence of DP was assessed by statistically comparing the mean peak postprandial glucose amplitudes between matched pairs.
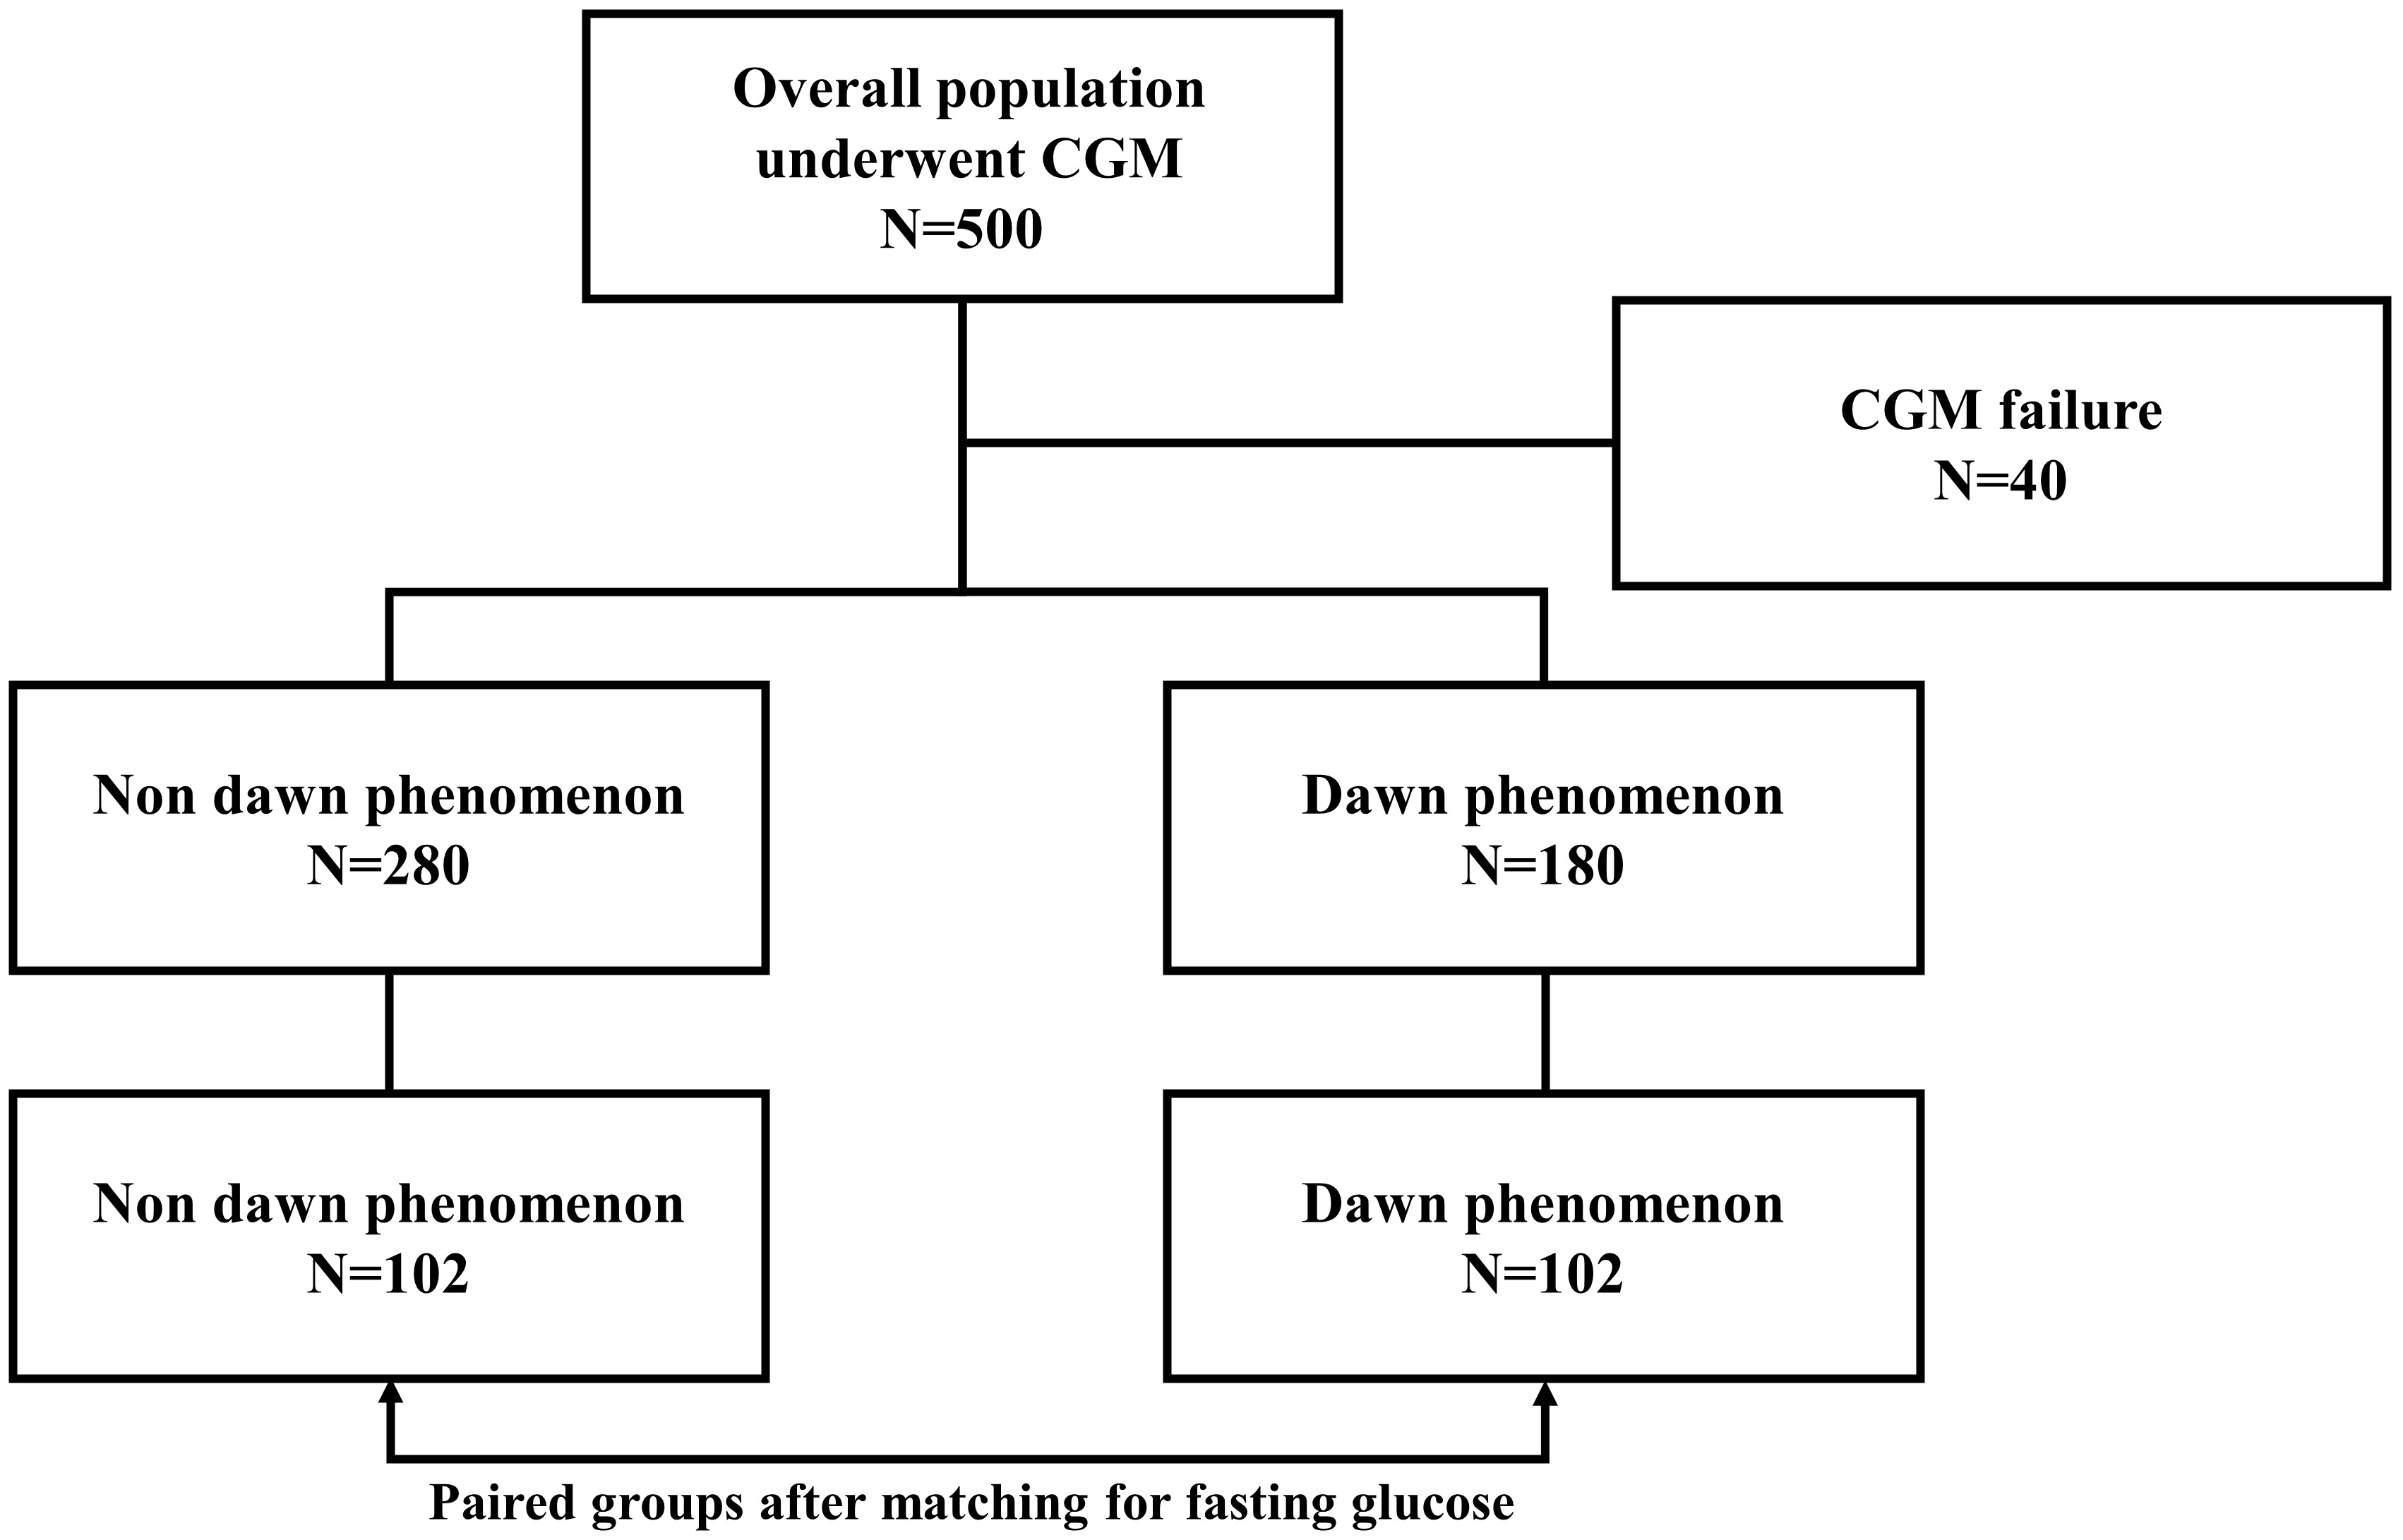 Fig. 1.
Experimental workflow demonstrating participant enrollment and group allocation with matched fasting glucose. The figure was created using Microsoft PowerPoint 2013 (Microsoft Corporation, Redmond, WA, USA). CGM, continuous glucose monitoring.
All statistical analyses were performed
using SPSS Statistics version 23.0 (IBM Corp., Armonk, NY, USA). The
Kolmogorov-Smirnov test was used to assess normality of continuous variables. As
most variables were not normally distributed, continuous data are presented as
median values with interquartile ranges (IQR), and between-group comparisons were
performed using the non-parametric Wilcoxon rank-sum test. Categorical variables
(sex) are reported as the number of male and female participants in each group,
and differences in sex distribution were evaluated using Pearson’s Chi-squared
test with Yates’ continuity correction. All statistical analyses employed
two-tailed hypothesis tests, with a significance level set at
For comparisons of mean glucose levels between the DP and non-DP groups, a false
discovery rate (FDR) correction was applied to account for multiple testing
across 11 hypotheses. Adjusted p-values were computed using the formula:
FDR-adjusted p = p-value
After excluding 40 individuals (8.0%) due to incomplete data (Fig. 1), the
final cohort comprised 460 participants. The median (interquartile ranges [IQR]) age
was 63.0 (58.0–70.0) years, with a BMI of 24.8 (22.7–26.7) kg/m2 and an
HbA1c level of 6.5% (6.1–7.0). Insulin resistance, as measured by HOMA-IR, has
a median value of 3.2 (2.4–4.2), while
| Overall | Non-DP | DP | Z/ |
p-value | ||
| Sample size | 460 | 280 | 180 | |||
| Male/female | 248/212 | 136/144 | 112/68 | 7.68 | 0.006 | |
| Age (years) | 63.0 (58.0–70.0) | 63.0 (59.0–70.0) | 62.5 (57.0–69.0) | 1.11 | 0.267 | |
| BMI (kg/m2) | 24.8 (22.7–26.7) | 24.7 (22.7–26.1) | 24.9 (22.7–27.7) | –1.75 | 0.080 | |
| HbA1c (%) | 6.5 (6.1–7.0) | 6.4 (6.1–6.9) | 6.6 (6.3–7.0) | –2.56 | 0.010 | |
| HOMA-IR | 3.2 (2.4–4.2) | 3.0 (2.3–4.0) | 3.5 (2.5–4.5) | –3.44 | ||
| HOMA- |
68.9 (48.0–91.5) | 77.7 (56.8–103.0) | 59.2 (41.8–75.0) | 6.13 | ||
| Mean glucose values (mmol/L) | ||||||
| Nocturnal nadir | 5.6 (4.8–6.3) | 5.8 (5.3–6.7) | 5.0 (4.5–5.9) | 8.14 | ||
| Fasting | 6.7 (5.9–7.4) | 6.3 (5.6–7.0) | 7.2 (6.5–8.0) | –8.33 | ||
| Peak post-breakfast | 9.4 (8.1–10.8) | 8.9 (7.8–10.3) | 10.0 (8.6–11.4) | –5.72 | ||
| Pre-lunch | 6.8 (5.9–7.9) | 6.7 (5.9–7.7) | 6.9 (5.9–8.1) | –1.96 | 0.049# | |
| Peak post-lunch | 8.7 (7.5–10.1) | 8.1 (7.3–9.5) | 9.3 (8.2–10.9) | –6.04 | ||
| Pre-dinner | 6.8 (6.0–8.2) | 6.7 (5.9–8.0) | 7.1 (6.1–8.4) | –2.29 | 0.022# | |
| Peak post-dinner | 8.9 (7.8–10.3) | 8.6 (7.5–9.9) | 9.3 (8.2–11.1) | –4.35 | ||
| 24 h mean glucose | 7.2 (6.5–8.0) | 7.0 (6.3–7.9) | 7.4 (6.8–8.0) | –3.61 | ||
| TIR (%) | 98.3 (89.6–100.0) | 100.0 (92.3–100.0) | 94.1 (85.8–100.0) | 4.68 | ||
| δDawn (mmol/L) | 0.9 (0.3–1.6) | 0.5 (0.1–0.8) | 1.8 (1.4–2.6) | –18.11 | ||
| δExdawn (mmol/L) | 2.6 (1.6–3.9) | 2.4 (1.4–3.8) | 2.7 (1.8–4.0) | –1.90 | 0.057 | |
Continuous variables are expressed as median (interquartile ranges), and categorical data (sex) are reported as counts (sample size).
p-value indicates the statistical significance of differences between non-DP and DP groups, calculated using the Wilcoxon rank-sum test for continuous variables and a Pearson’s Chi-squared test with Yates’ continuity correction for sex. # denotes statistical significance after multiple testing adjustment.
DP, dawn phenomenon; HOMA-IR, homeostatic model assessment for insulin
resistance; HbA1c, glycated hemoglobin A1c; HOMA-
A total of 460 participants with valid CGM data were initially stratified into
two cohorts based on the presence (N = 180) or absence (N = 280) of DP.
Participants with DP had higher HOMA-IR levels [median (interquartile ranges [IQR]): 3.5 (2.5–4.5) vs 3.0 (2.3–4.0), p
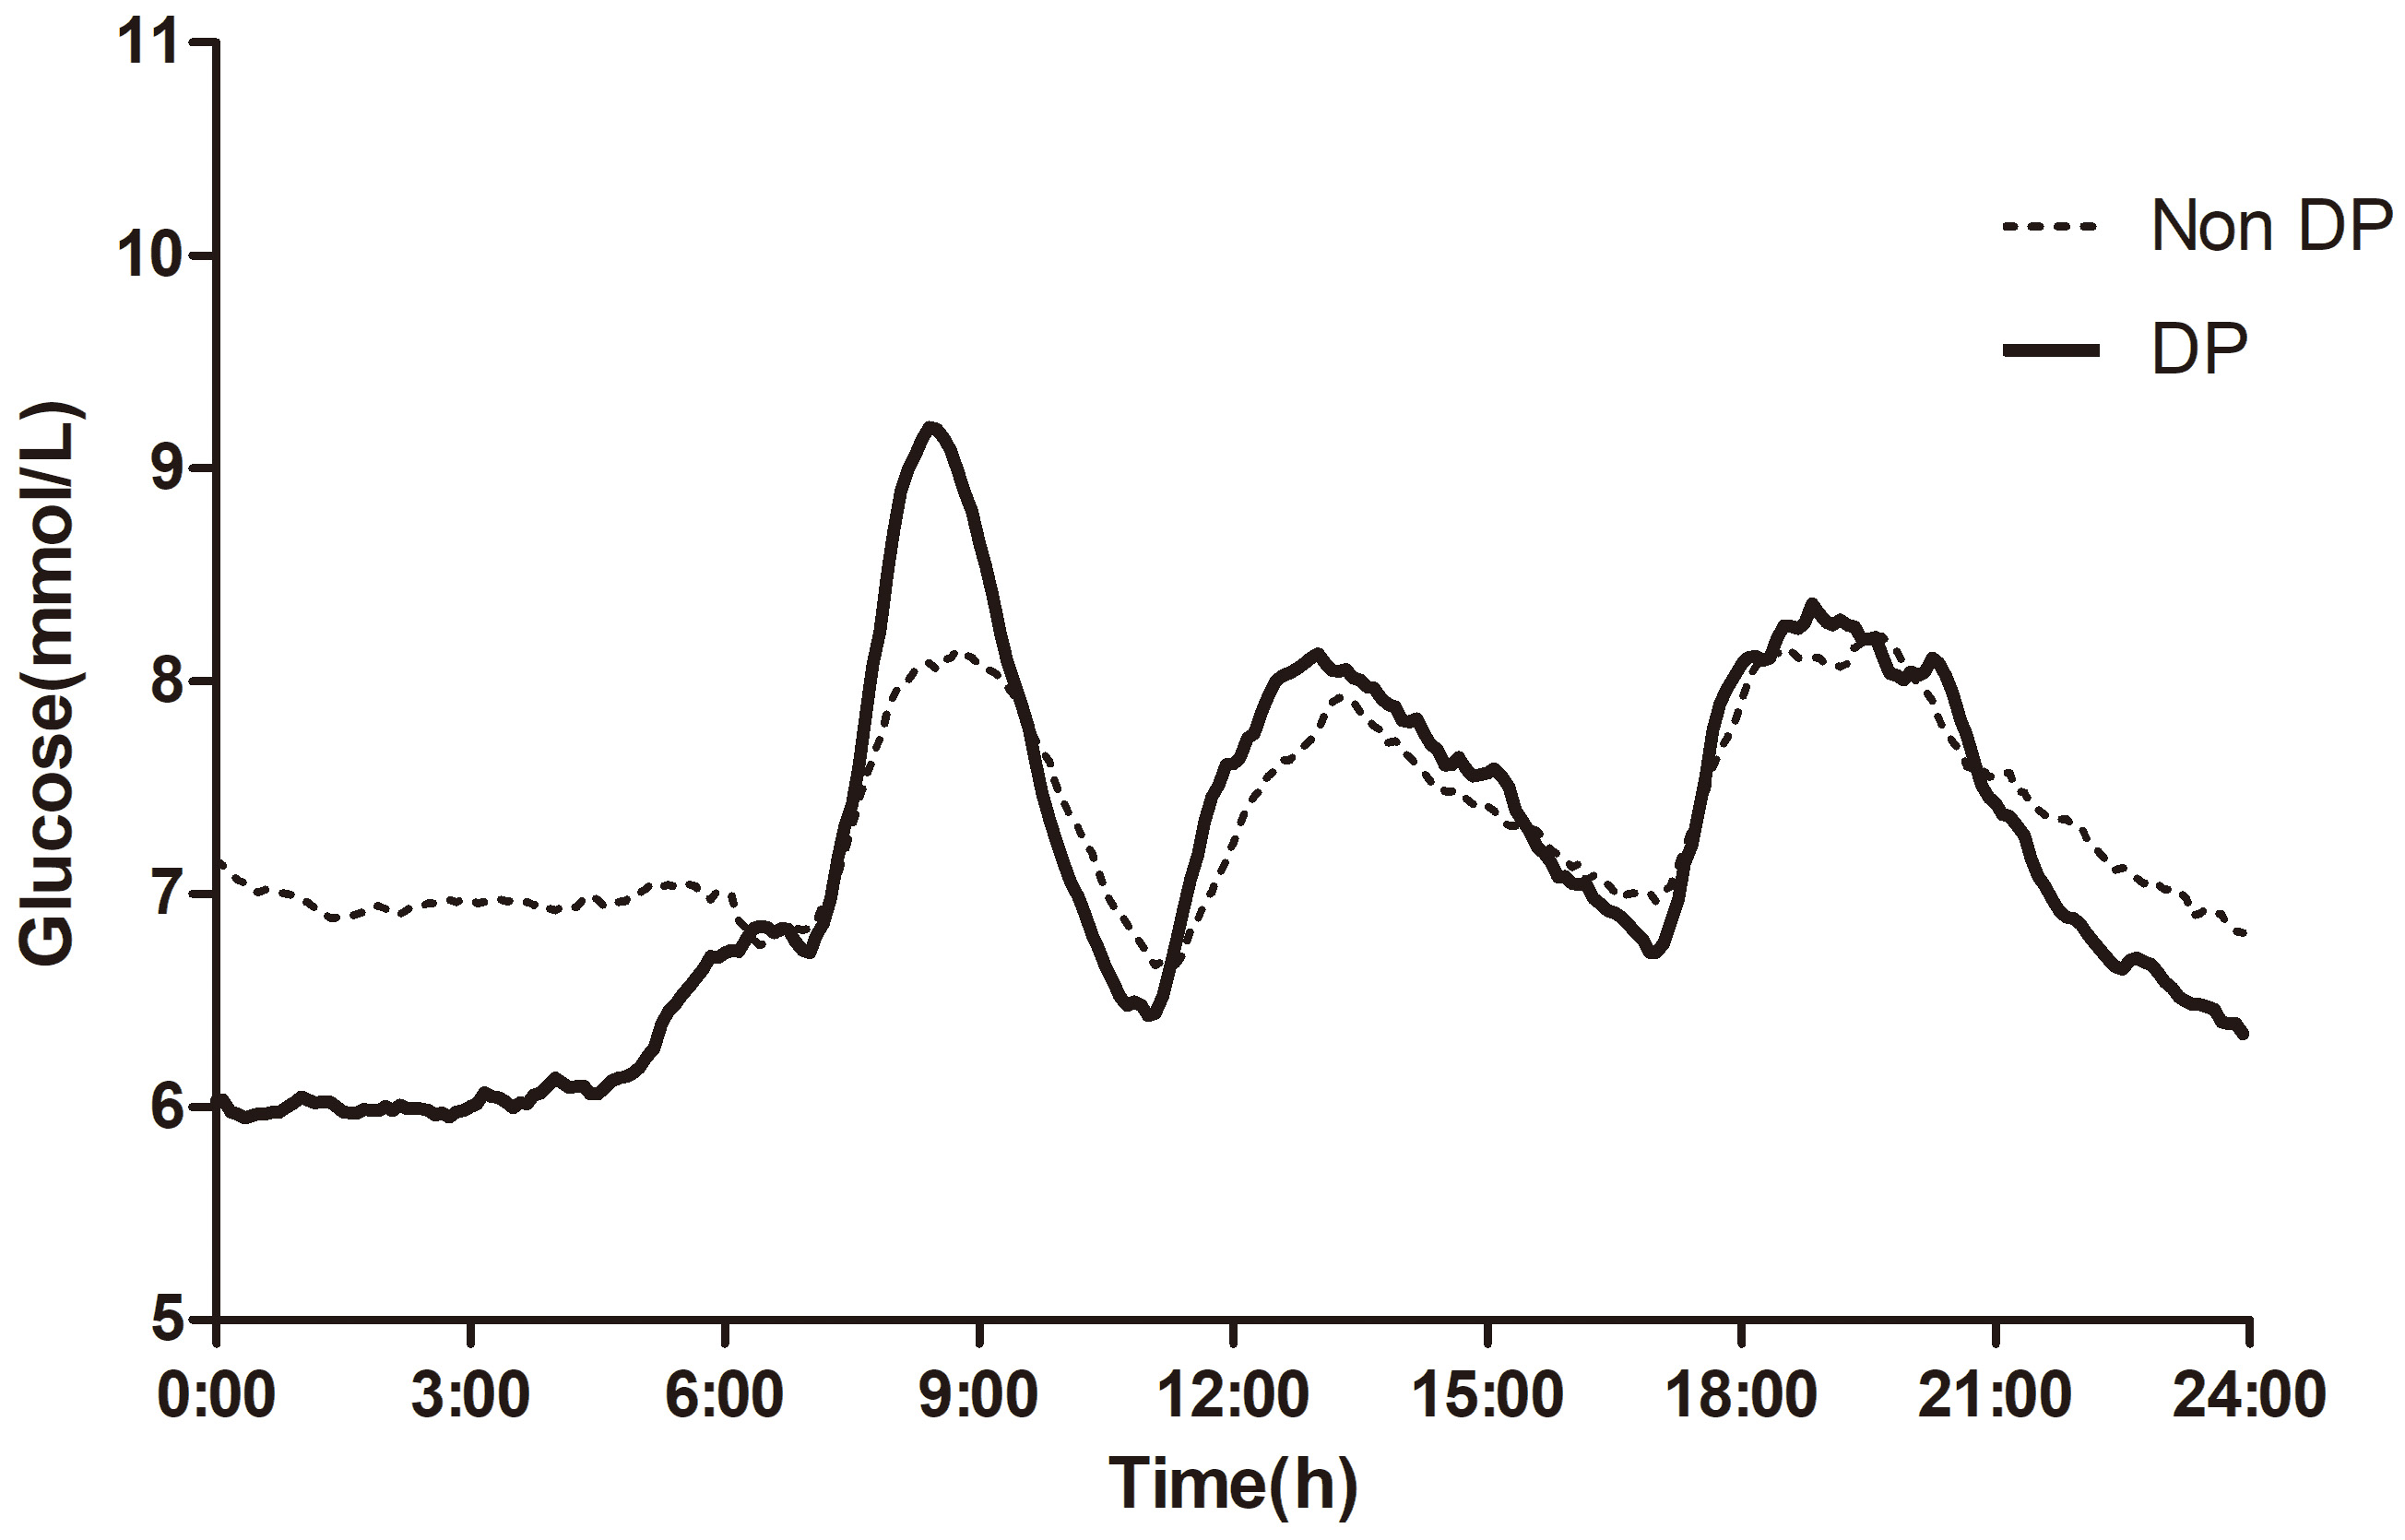 Fig. 2.
Mean glucose levels across the whole day. The non-DP and DP groups were shown separately. DP, dawn phenomenon.
| Overall | Non-DP | DP | Z/ |
p-value | ||
| Sample size | 204 | 102 | 102 | |||
| Male/female | 104/100 | 42/60 | 62/40 | 7.08 | 0.008 | |
| Age (years) | 63.0 (58.0–71.0) | 63.0 (59.2–70.8) | 61.0 (56.2–70.8) | 1.59 | 0.112 | |
| BMI (kg/m2) | 24.8 (22.8–27.1) | 24.5 (22.7–26.1) | 24.9 (22.9–28.8) | –1.56 | 0.119 | |
| HbA1c (%) | 6.4 (6.0–6.8) | 6.4 (6.0–6.8) | 6.4 (6.1–6.8) | –0.59 | 0.556 | |
| HOMA-IR | 3.2 (2.4–4.1) | 3.1 (2.6–4.0) | 3.3 (2.4–4.3) | –0.44 | 0.663 | |
| HOMA- |
68.0 (50.6–83.2) | 69.0 (53.6–81.5) | 64.6 (46.7–90.0) | 0.41 | 0.684 | |
| Mean glucose values (mmol/L) | ||||||
| Nocturnal nadir | 5.5 (5.0–6.3) | 6.3 (5.7–7.0) | 5.0 (4.5–5.4) | 10.30 | ||
| Fasting | 6.9 (6.1–7.3) | 6.9 (6.1–7.3) | 6.9 (6.1–7.3) | 0.00 | 1 | |
| Peak post-breakfast | 9.2 (8.1–10.3) | 8.9 (8.0–10.0) | 9.7 (8.2–10.7) | –2.60 | 0.020# | |
| Pre-lunch | 6.7 (5.8–7.5) | 6.8 (5.9–7.7) | 6.6 (5.6–7.4) | 2.08 | 0.070 | |
| Peak post-lunch | 8.7 (7.8–10.0) | 8.2 (7.4–9.8) | 8.9 (8.1–10.7) | –2.70 | 0.020# | |
| Pre-dinner | 6.7 (6.0–7.9) | 6.7 (6.0–8.1) | 6.6 (5.8–7.9) | 1.13 | 0.284 | |
| Peak post-dinner | 9.1 (8.0–10.7) | 8.8 (7.5–10.4) | 9.1 (8.2–10.7) | –1.82 | 0.108 | |
| 24-hour mean glucose | 7.1 (6.5–7.8) | 7.2 (6.6–8.0) | 7.0 (6.5–7.5) | 1.52 | 0.156 | |
| TIR (%) | 91.1 (79.9–100.0) | 89.6 (79.9–97.7) | 93.1 (80.2–100.0) | –1.64 | 0.133 | |
| δDawn (mmol/L) | 1.1 (0.5–1.7) | 0.5 (0.1–0.7) | 1.7 (1.4–2.0) | –12.34 | ||
| δExdawn (mmol/L) | 2.6 (1.4–3.4) | 2.1 (1.3–3.0) | 2.8 (2.0–3.7) | –3.30 | ||
Continuous variables are expressed as median (interquartile ranges), and categorical data (sex) are reported as counts (sample size).
p-value indicates the statistical significance of differences between non-DP and DP groups, calculated using the Wilcoxon rank-sum test for continuous variables and a Pearson’s Chi-squared test with Yates’ continuity correction for sex. # denotes statistical significance after multiple testing adjustment.
DP, dawn phenomenon; HOMA-IR, homeostatic model assessment for insulin
resistance; HbA1c, glycated hemoglobin A1c; HOMA-
The correlation analysis showed that
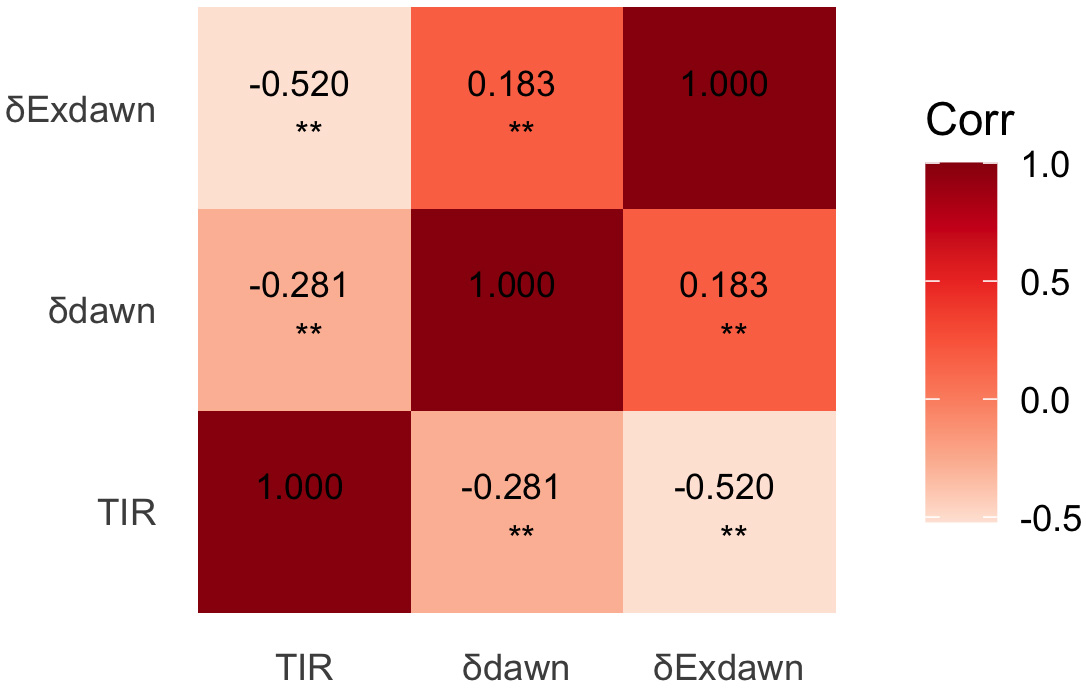 Fig. 3.
Heatmap visualizing Spearman correlations among TIR,
| Variable | OR (95% CI) | p-value | Male | Female | ||
| OR (95% CI) | p-value | OR (95% CI) | p-value | |||
| HbA1c | 2.322 (1.530–3.566) | 1.825 (1.053–3.226) | 0.035 | 3.235 (1.694–6.380) | ||
| HOMA-IR | 1.308 (1.110–1.548) | 0.001 | 1.392 (1.100–1.778) | 0.007 | 1.238 (0.980–1.573) | 0.075 |
| HOMA- |
0.990 (0.983–0.997) | 0.004 | 0.988 (0.978–0.997) | 0.011 | 0.992 (0.981–1.002) | 0.121 |
| δDawn | 1.591 (1.283–1.993) | 1.681 (1.253–2.296) | 0.001 | 1.452 (1.058–2.028) | 0.024 | |
| Age | 1.010 (0.990–1.030) | 0.338 | 1.011 (0.986–1.038) | 0.401 | 1.012 (0.981–1.045) | 0.461 |
| BMI | 0.944 (0.881–1.009) | 0.095 | 0.980 (0.884–1.085) | 0.694 | 0.912 (0.825–1.001) | 0.060 |
| Sex | 1.106 (0.717–1.706) | 0.647 | ||||
Our findings supported the existence of the “extended dawn phenomenon”. First,
even when fasting glucose was matched, participants with DP had higher peak
post-breakfast glucose and greater
Emerging evidence suggests that the mechanisms underlying DP in diabetes are
multifactorial, including: (1) progressive
Monnier et al. [3], quantified the contribution of DP to chronic
hyperglycemia, reporting a 0.4% increase in HbA1c and a 12.4 mg/dL increase in
24-hour mean glucose. Our data corroborate this metabolic burden, showing higher
HbA1c (6.6% vs 6.4%) and 24-hour mean glucose (7.4 vs 7.0
mmol/L) in the DP compared to the non-DP group (Table 1). CGM revealed a dual
circadian effect: DP participants exhibited 1.1 mmol/L higher post-breakfast
hyperglycemia (10.0 vs 8.9 mmol/L) and a 5.9% absolute reduction in
TIR (94.1% vs 100.0%), equivalent to 89 fewer daily minutes within the
target range (3.9–10.0 mmol/L). This aligns with Monnier’s hypothesis that
morning glucose surges may persist beyond fasting phases; our use of CGM provides
higher temporal resolution, directly linking nocturnal glucose increments to
postprandial peaks. Notably, while Monnier’s cohort focused on HbA1c-driven
glucose exposure, our data delineate a metabolic gradient: DP participants
demonstrated 16.7% higher insulin resistance (HOMA-IR 3.5 vs 3.0) and
23.8% worse
Notably, our stratified analysis revealed sex-specific differences in glycemic
regulation pathways. As demonstrated in Table 3, female participants exhibited a
stronger correlation between HbA1c elevation and post-breakfast hyperglycemia (OR
= 3.235 vs 1.825 in males), whereas male participants showed greater
susceptibility to dawn phenomenon-mediated glucose increments (
Postprandial hyperglycemia is a hallmark of diabetes in China, with nationwide
data indicating that 46.6% of newly diagnosed T2DM patients exhibit isolated
postprandial hyperglycemia (50.2% in females vs 44.1% in males)
[29]. In our cohort of well-controlled patients (HbA1c
This cross-sectional study demonstrates that DP significantly exacerbates
post-breakfast hyperglycemia in individuals with type 2 diabetes mellitus, independent of
fasting glucose levels. Key metabolic determinants (e.g., HbA1c, insulin
resistance,
All data included in this study are available from the corresponding authors upon reasonable request.
WT and YH designed the study. WT and JZ acquired the data. WT, CJ and XT interpreted the data. WT drafted the manuscript. All authors contributed to the critical revision of the manuscript for important intellectual content. All authors read and approved the final manuscript. All authors have participated sufficiently in the work and agreed to be accountable for all aspects of the work.
The investigation protocol received ethical approval from the Ethics Committee of Huadong Hospital, Fudan University (approval number: 2020K033). The study followed the ethical guidelines outlined in the Declaration of Helsinki and the principles of confidentiality. All participants provided written informed consent following comprehensive disclosure of the study protocol.
Not applicable.
This work was supported by Noncommunicable Chronic Diseases-National Science and Technology Major Project (2023ZD0507203) and Emerging Talent Program of Huadong Hospital, Fudan University (XXRC2217).
The authors declare no conflict of interest.
Supplementary material associated with this article can be found, in the online version, at https://doi.org/10.31083/BJHM51727.
References
Publisher’s Note: IMR Press stays neutral with regard to jurisdictional claims in published maps and institutional affiliations.