


 , Tianshu Liu 1,*
1 Department of Oncology, Zhongshan Hospital, Fudan University, 200032 Shanghai, China
2 Department of Oncology, Shanghai Clinical Research and Trial Center, ShanghaiTech University, 201210 Shanghai, China
Abstract
The optimal regimens of third-line treatments for advanced gastric cancer have yet to be identified. This study aimed to evaluate the therapeutic efficacy of different third-line treatment regimens and to identify prognostic factors affecting patient outcomes following third-line therapy. Additionally, it sought to evaluate treatment-related adverse events and economic costs associated with different regimens, thereby providing a theoretical basis to guide the selection of third-line treatment regimens.
In this real-world retrospective study, data were collected from patients diagnosed with advanced gastric cancer who fulfilled predetermined inclusion criteria. Survival outcomes between different groups were compared using Kaplan–Meier survival curves and the log-rank test. Cox proportional hazards regression analysis was employed to identify prognostic factors of patients with advanced gastric cancer after receiving third-line treatment.
A total of 145 patients were included and divided into three groups: 45 patients in the chemotherapy-alone group, 58 patients in the immunotherapy/targeted therapy group, and 42 patients in the chemotherapy + immunotherapy/targeted therapy group. Survival analysis revealed a median survival time (MST) of 7.7 months (95% confidence interval [CI]: 6.8–8.5) for the overall cohort, while the chemotherapy + immunotherapy/targeted therapy group demonstrated the longest MST (MST: 10.5 months; 95% CI: 8.9–12.1), followed by the immunotherapy/targeted therapy group (MST: 8.5 months; 95% CI: 7.1–9.9). Regression analysis showed that a history of gastric surgery was an independent prognostic factor (hazard ratio [HR] = 0.639; 95% CI: 0.431–0.948; p = 0.026) for gastric cancer patients following third-line treatment. Regarding adverse events, the chemotherapy + immunotherapy/targeted therapy group exhibited the highest incidence (90.5%), followed by the chemotherapy-alone group (75.6%). Cost analysis showed that the chemotherapy + immunotherapy/targeted therapy group incurred the highest overall cost, and both total treatment costs and anti-tumor drug-related costs were positively correlated with patient survival (r2 = 0.2656 and 0.3081, respectively).
Patients receiving third-line chemotherapy combined with immune or targeted therapy achieve the longest MST; however, this regimen is also associated with a higher incidence of adverse events and overall treatment costs.
Keywords
- gastric cancer
- treatment failure
- chemotherapy
- immunotherapy
Gastric cancer is a highly prevalent malignant tumor, characterized by inherently high aggressiveness. The tumor is accompanied by common presentations, such as stomach discomfort, indigestion, acid reflux, and retrosternal burning, during the initial stage. However, the lack of distinct clinical manifestations is the prime reason for delayed diagnosis of the cancer, causing most patients to miss the golden window of early-stage detection. By the time significant symptoms such as increased pain, gastrointestinal bleeding, and weight loss start to manifest, the disease has often progressed to the middle and advanced stages, during which the malignancy can hardly be cured. The five-year overall survival of patients with advanced gastric cancer is reportedly lower than 30%. In the event of metastasis, gastric cancer patients would have a worse prognosis, with a median overall survival of only one year [1].
Currently, multiple therapeutic approaches are employed for the treatment of advanced gastric cancer, including local palliative surgery, systemic chemotherapy, radiotherapy, immunotherapy, and targeted therapy. In addition, the prognosis of patients with gastric cancer has been shown to improve with the administration of successive lines of treatment. According to findings from a clinical trial published in Japan [2], patients with advanced gastric cancer who had undergone first-line therapy exhibited a median survival time of 234 days. This median survival was increased by an additional 166 days following second-line treatment and was further extended by 151 days after the implementation of third-line therapy [2]. There are many first-line and second-line treatment options, such as trastuzumab, 5-fluorouracil, irinotecan, capecitabine, tegafur, platinum compounds, and docetaxel. However, therapeutic options become markedly limited beyond the third-line setting following treatment failure, preventing some patients with advanced gastric cancer from receiving comprehensive care and ultimately adversely affecting their overall survival outcomes.
In this study, baseline and clinical information was collected from patients with advanced gastric cancer who received third-line treatment at Zhongshan Hospital, Fudan University, Shanghai, China. In addition, the third-line treatment regimens were evaluated as a whole based on factors such as efficacy, tolerability, and cost. This investigation aimed to enhance our understanding third-line treatment regimens for advanced gastric cancer in a of real-world setting, with the goal of improving therapeutic efficacy.
The data of patients with advanced gastric cancer who satisfied the inclusion criteria were retrospectively collected from the gastric cancer database of Zhongshan Hospital, Fudan University, covering the period from 1 January 2016 to 1 January 2022. Baseline information, medical records, and clinical information such as pathological results (e.g., Lauren type), history of surgery, and tumor burden (e.g., metastasis) were obtained through the hospital’s medical record system. Post-treatment survival and quality of life were subsequently monitored via telephone follow-up.
The enrollment criteria are as follows: (1) patients with advanced, incurable gastric cancer with metastatic disease confirmed by clinical assessment, medical imaging, histopathological biopsy, and additional diagnostic methods; (2) patients with radiologically confirmed disease progression after two standard lines of palliative therapy; (3) patients who showed adequate overall health status and vital organ function, as assessed by the investigator, and were able to tolerate systemic treatment, leading to the administration of third-line therapy at our hospital; (4) patients with complete clinical and follow-up data; and (5) patients who had given their informed consent for the usage of their retrospective clinical information and biological samples.
The exclusion criteria are as follows: (1) individuals under the age of 18
years; (2) cases for which clinical data were incomplete or survival information
was unavailable; (3) patients who discontinued treatment due to personal reasons
during therapy; (4) patients with severe or uncontrolled comorbidities that may
affect survival assessment (expected survival
The research methodology is illustrated as a flowchart in Fig. 1 and is outlined as follows: (1) patients were enrolled based on predefined inclusion and exclusion criteria; (2) the participants were classified according to their respective treatment regimens; (3) the demographic and clinical information of the patients was collected; and (4) the data were statistically analyzed.
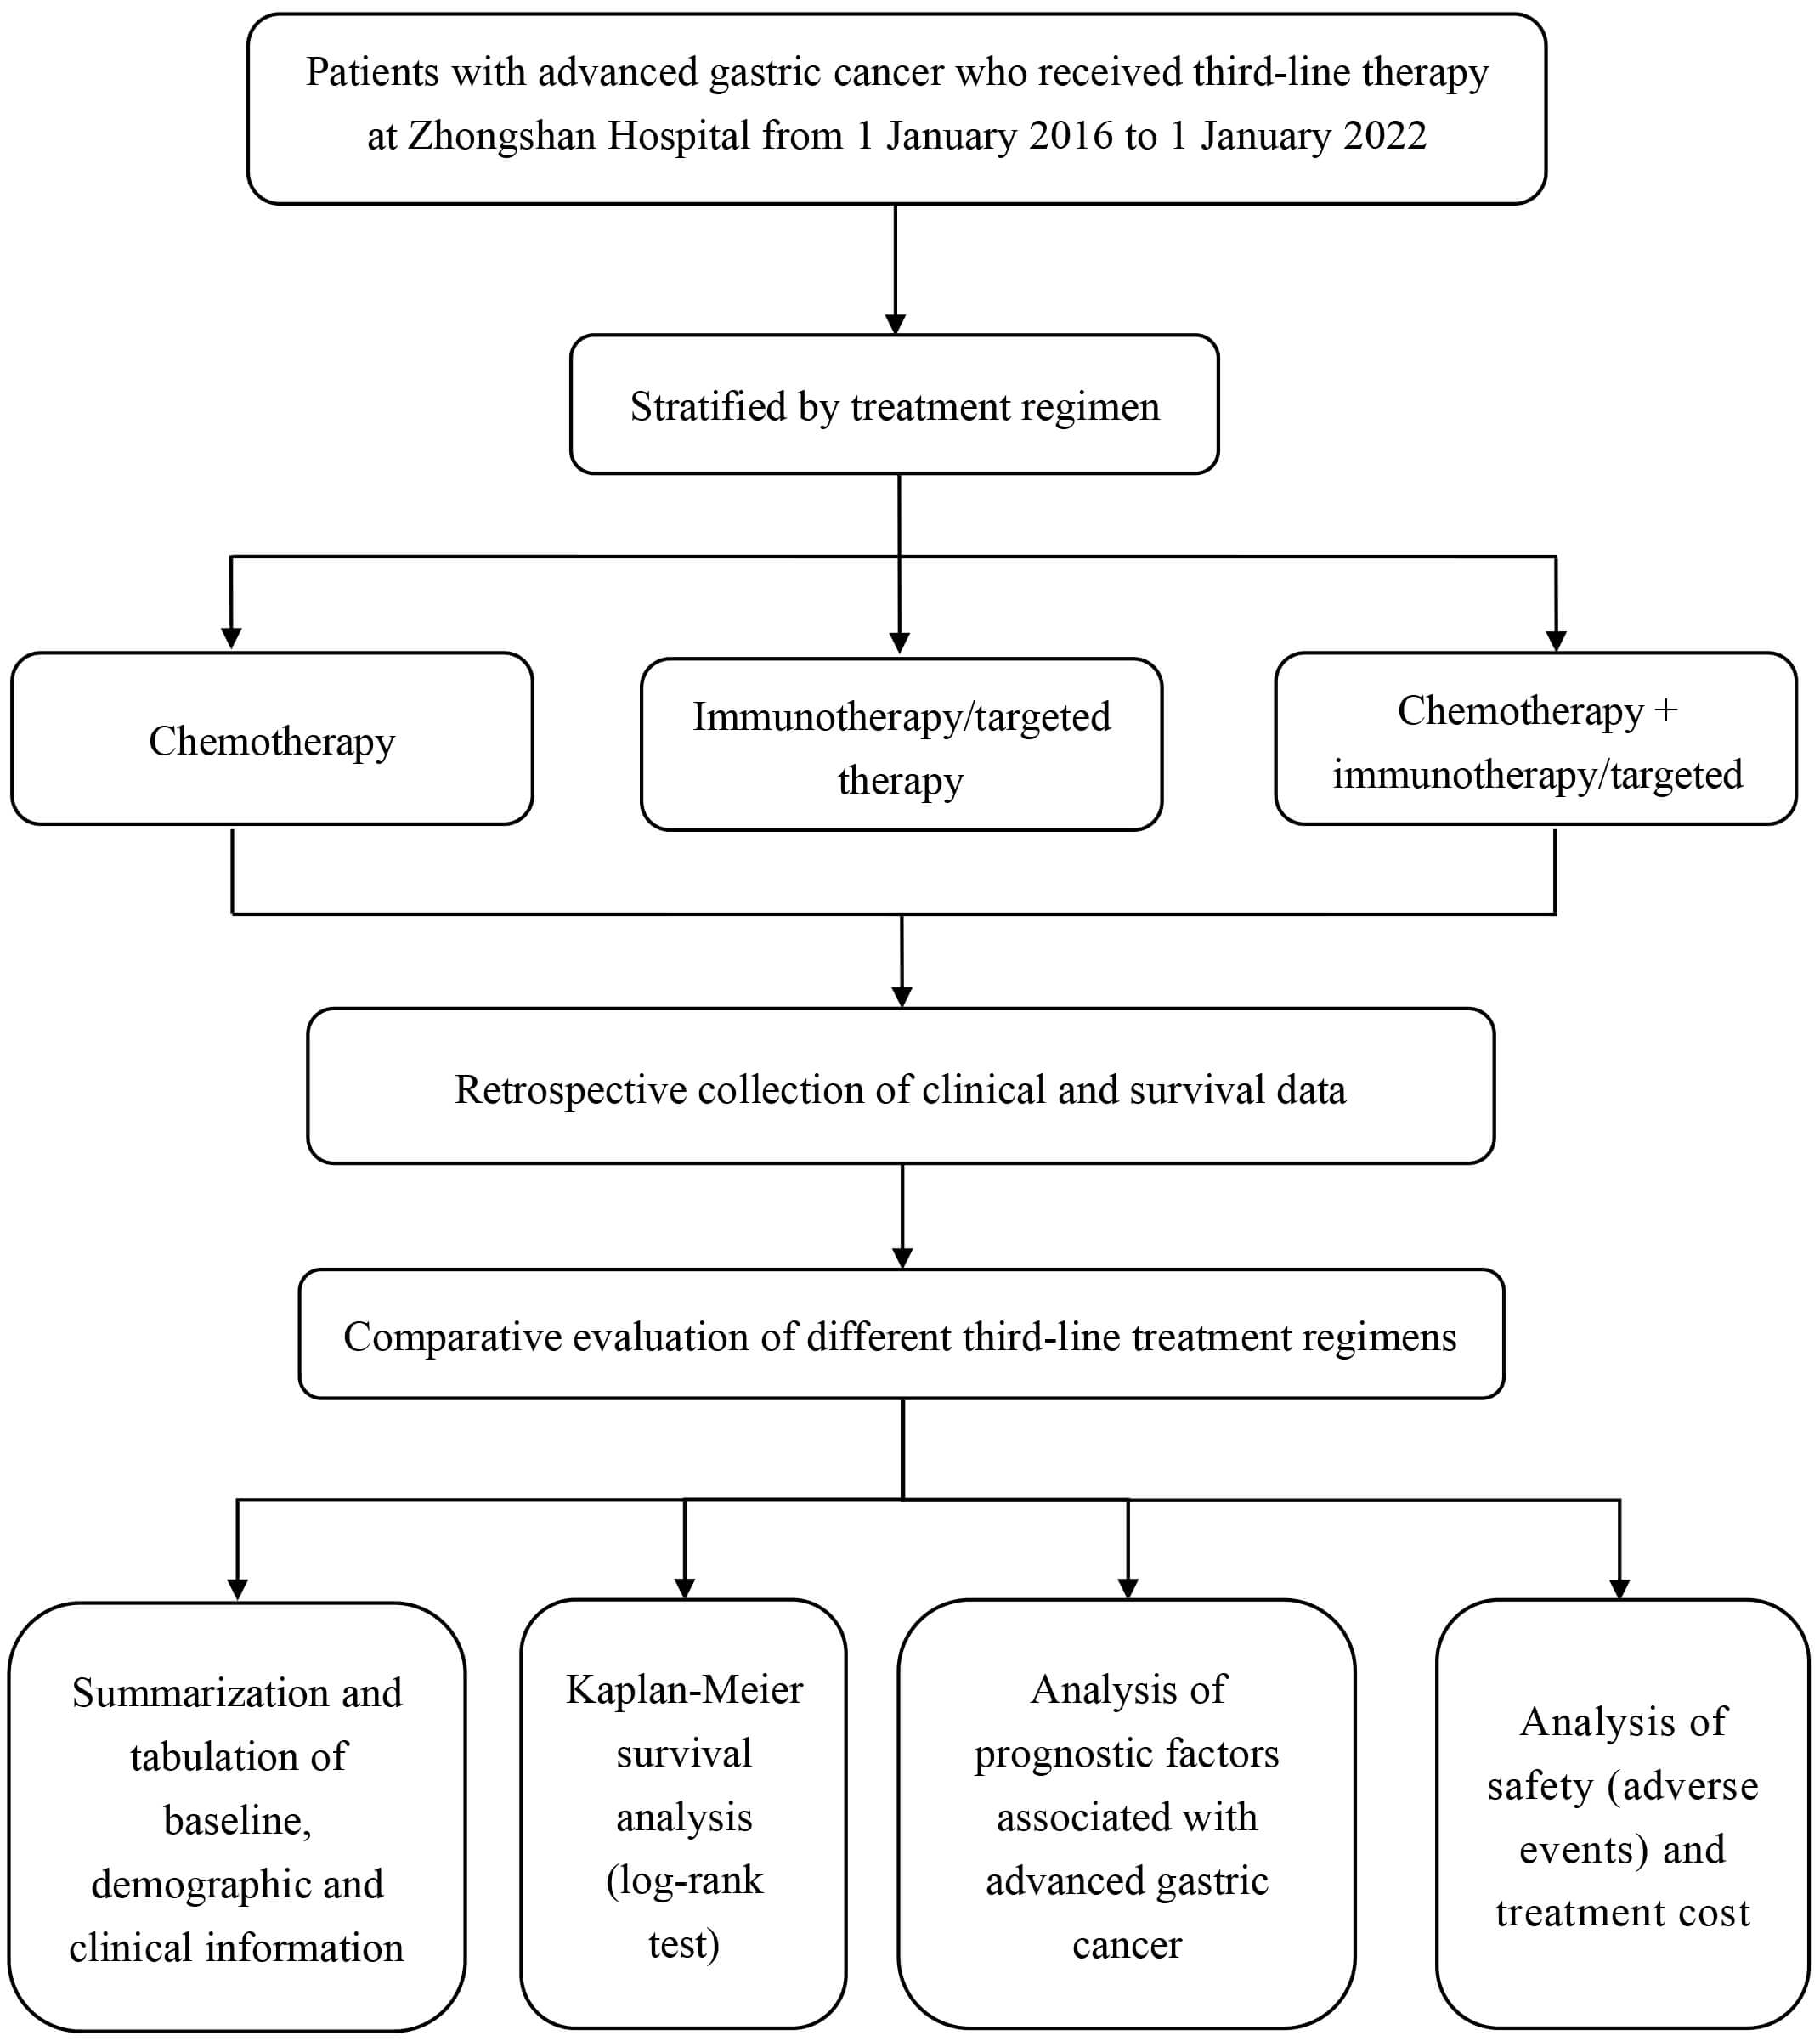 Fig. 1.
Flowchart depicting research methodology.
The quality of life of patients in this study was assessed using the Functional
Assessment of Cancer Therapy-General (FACT-G) scale. This scale consists of four
subscales, comprising a total of 27 items. The four subscales include: Physical
Well-Being (score range: 0–28), Social/Family Well-Being (score range: 0–28),
Emotional Well-Being (score range: 0–24), and Functional Well-Being (score
range: 0–28). All items in the FACT-G are rated using a 5-point Likert scale (0
= Not at all; 1 = A little bit; 2 = Somewhat; 3 = Quite a bit; 4 = Very much).
The scores for each subscale are obtained by summing the scores of the individual
items within that subscale. The total score is 108, with a higher score
indicating a better quality of life. The test–retest reliability for all four
domains of the scale is
Statistical analyses were conducted using SPSS (version 26.0; IBM
Corp., Armonk, NY, USA), and Microsoft Excel (version 16.78.3; Microsoft
Corporation, Redmond, WA, USA) was used to create graphs. Categorical variables
are presented as frequencies (percentages). Group comparisons were performed
using the chi-square test or Fisher’s exact test, depending on expected cell
frequencies. Continuous variables were first subjected to normality
assessment. Given that the sample size (n = 145) falls within the
large-sample category, the Kolmogorov–Smirnov test was employed to assess
whether the data followed a normal distribution. One-way analysis of variance
(ANOVA) was performed to compare normally distributed continuous variables, which
are expressed as mean
Survival curve analyses for the three treatment groups were conducted using the
Kaplan–Meier method. Survival outcomes were compared using the log-rank test for
both overall and pairwise group comparisons. Median survival time refers to the
time from the initiation of third-line treatment to death or the last follow-up.
The 1-year, 2-year, and 3-year survival rates were calculated from the date of
initial gastric cancer diagnosis. Univariate Cox regression analysis was
performed to evaluate prognostic factors, and variables with p
Due to the complex types of adverse events that occur during clinical treatment, this study did not employ a standardized assessment scale. Instead, the findings were presented using frequency tables that detail both the occurrence frequency and composition ratios. The incidence of adverse events across different groups was illustrated through bar charts to offer a clear and intuitive visualization of the data. This study adopted the Common Terminology Criteria for Adverse Events (version 5.0) [4], developed by the U.S. National Cancer Institute, to uniformly evaluate and grade all treatment-related adverse events.
Additionally, treatment cost information was collected for simple cost-survival analysis, with the results illustrated using scatter plots.
Relevant information of a total of 220 patients receiving third-line treatment from 1 January 2016 to 1 January 2022, was retrospectively collected from the gastric cancer database of Zhongshan Hospital in Shanghai, China. Among them, 145 patients were included in the final analysis set. The flowchart depicting procedures for participant selection is illustrated in Fig. 2.
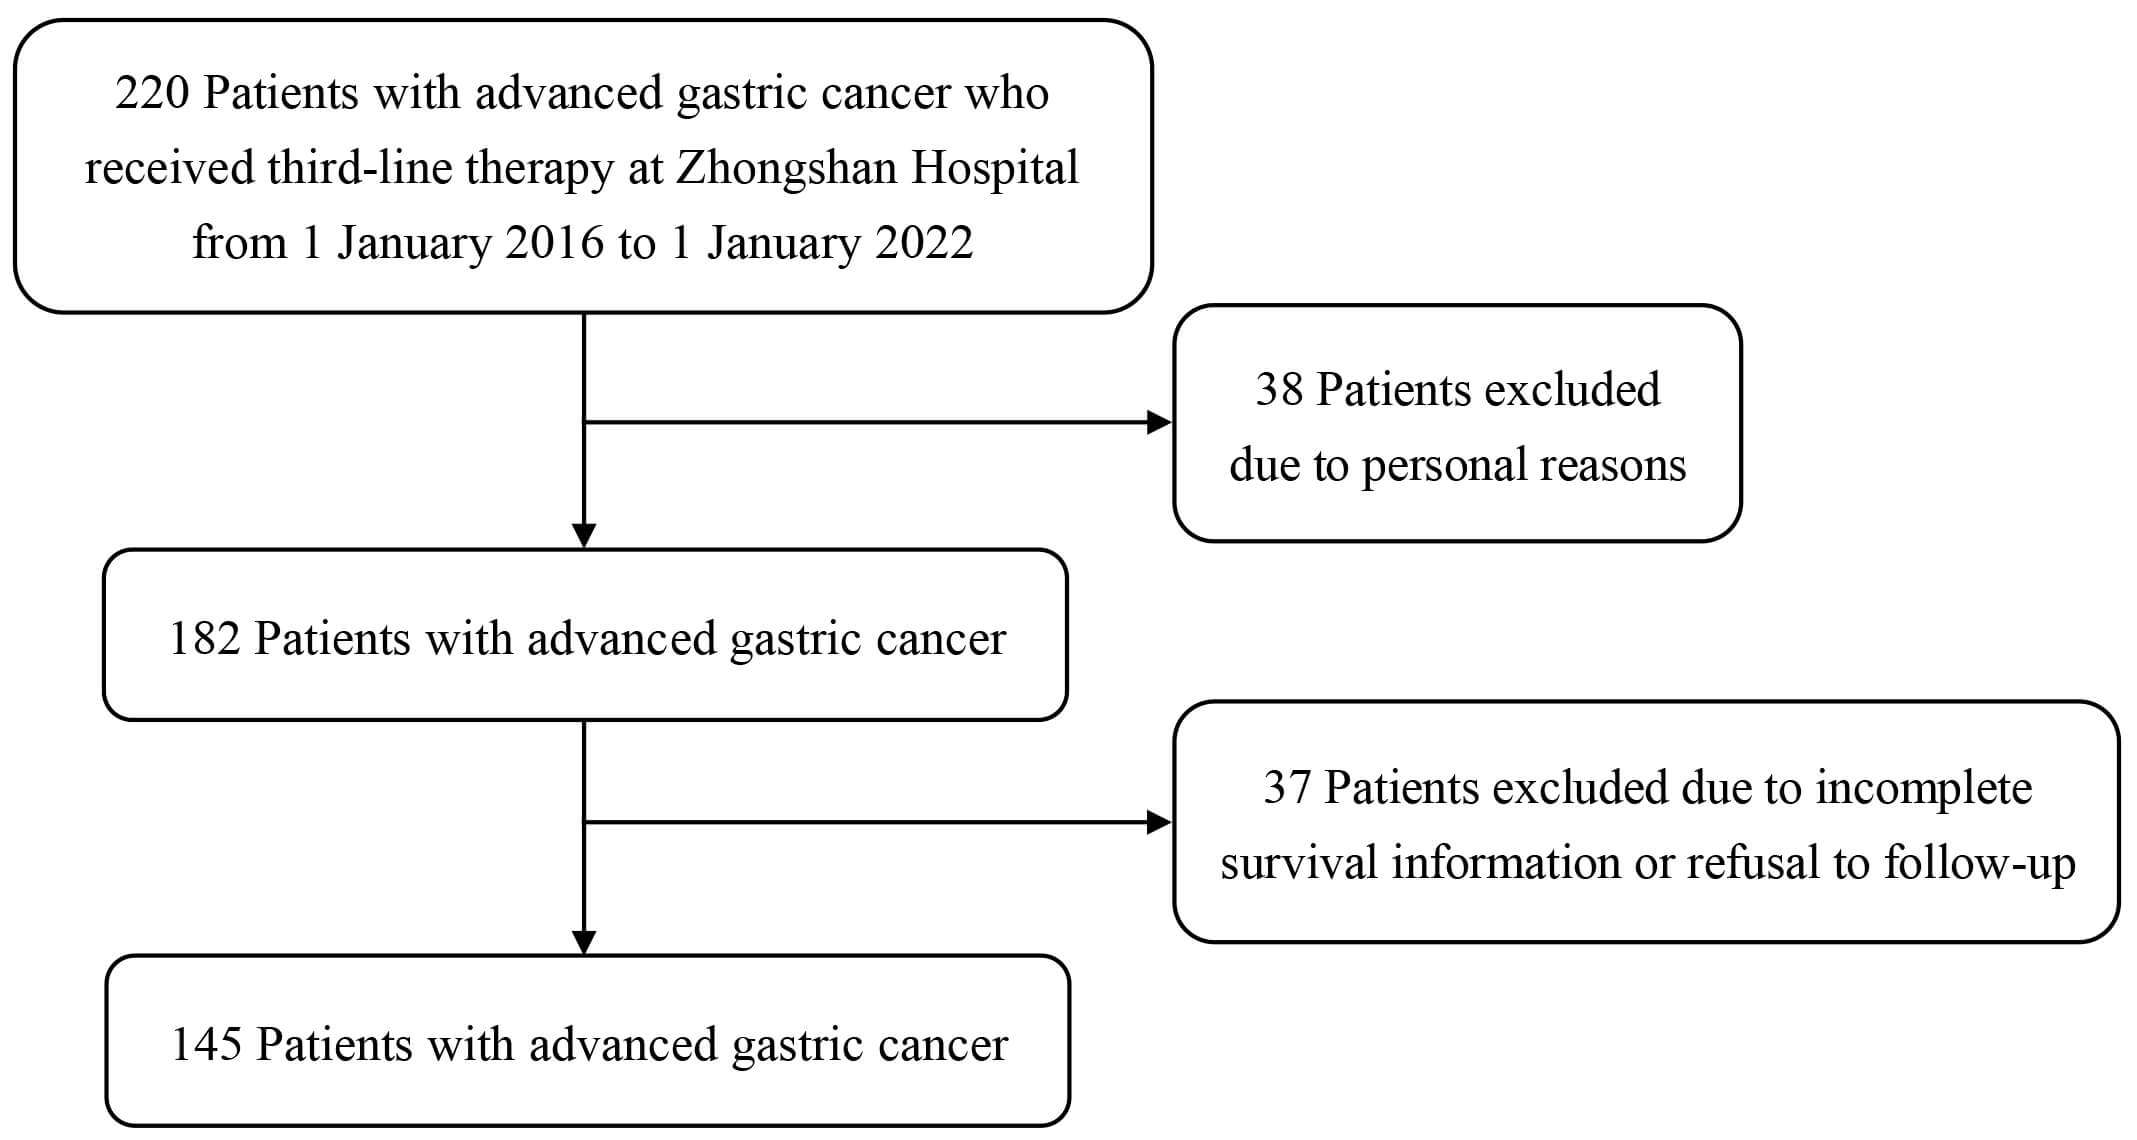 Fig. 2.
Detailed flowchart depicting participant inclusion and exclusion.
Based on the treatment modalities, the enrolled patients were categorized into three distinct groups. Group 1 comprised patients receiving chemotherapy alone, with a total of 45 patients, accounting for 31.0% of the total number; Group 2 included 58 patients undergoing immunotherapy/targeted therapy, accounting for 40.0% of the total sample; and Group 3 consisted of 42 patients treated with a combination of chemotherapy and immunotherapy/targeted therapy, constituting 29.0% of the participants. The baseline information and demographic characteristics of the 145 enrolled patients are shown in Table 1, with an overall mean age of 58.45 years, a mean body weight of 59.78 kg, a mean height of 166.6 cm, and a mean body surface area of 1.67 m2. According to the results of the Chi-squared test and ANOVA, the baseline and clinical characteristics of all three treatment groups presented in Table 1 are comparable, showing no statistically significantly difference. The characteristics of the treatment regimens of the different treatment groups are shown in Fig. 3. Additionally, the details of the first- and second-line treatments for the study cohort are presented in Supplementary Table 1. The first- and second-line treatment regimens of the patients for the three groups were not statistically different.
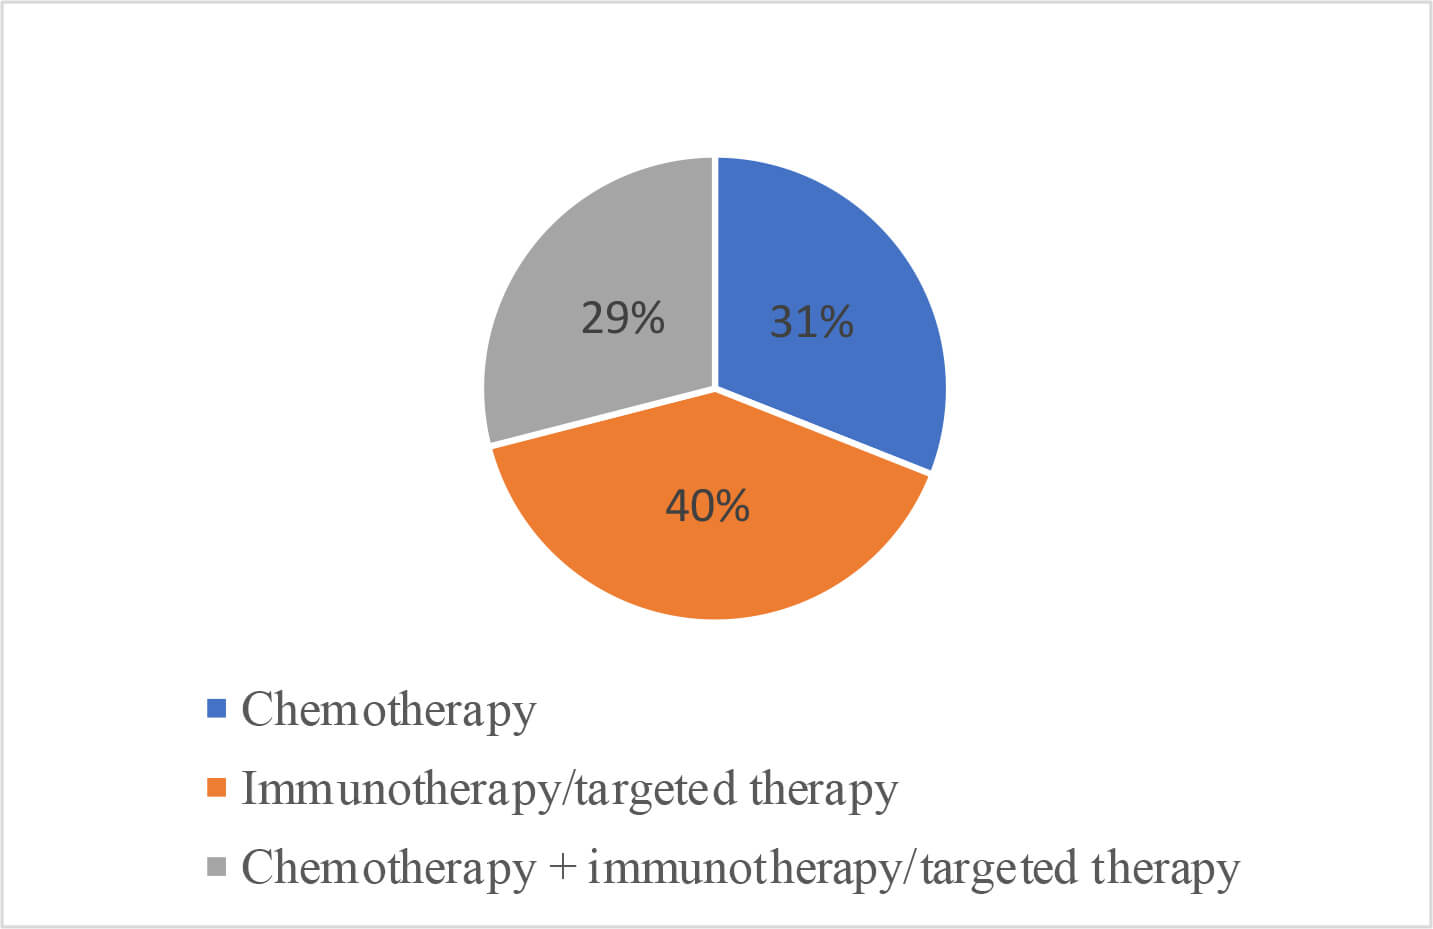 Fig. 3.
Percentages of patients classified based on treatment regimens received.
| Total (n = 145) | Chemotherapy group (n = 45) | Immunotherapy/targeted therapy group (n = 58) | Chemotherapy + immunotherapy/targeted therapy group (n = 42) | F/ |
p-value | ||
| Age (years), mean |
58.45 |
57.13 |
58.07 |
60.38 |
0.739 | 0.480 | |
| Gender, n (%) | 5.495 | 0.064 | |||||
| male | 105 (72.4) | 29 (64.4) | 40 (69) | 36 (85.7) | |||
| female | 40 (27.6) | 16 (35.6) | 18 (31) | 6 (14.3) | |||
| Weight (kg), mean |
59.78 |
60.27 |
57.53 |
62.37 |
2.790 | 0.065 | |
| Height (cm), mean |
166.6 |
166.13 |
165.52 |
168.6 |
2.037 | 0.134 | |
| Body surface area (m2), mean |
1.67 |
1.67 |
1.64 |
1.71 |
2.298 | 0.104 | |
| Comorbidity, n (%) | 0.340 | 0.844 | |||||
| No | 102 (70.3) | 31 (68.9) | 40 (69) | 31 (73.8) | |||
| Yes | 43 (29.7) | 14 (31.1) | 18 (31) | 11 (26.2) | |||
| Metastasis, n (%) | 0.572 | 0.751 | |||||
| No | 7 (4.8) | 3 (6.7) | 2 (3.4) | 2 (4.8) | |||
| Yes | 138 (95.2) | 42 (93.3) | 56 (96.6) | 40 (95.2) | |||
| History of gastric surgery, n (%) | 0.663 | 0.718 | |||||
| No | 83 (57.2) | 28 (62.2) | 32 (55.2) | 23 (54.8) | |||
| Yes | 62 (42.8) | 17 (37.8) | 26 (44.8) | 19 (45.2) | |||
| Lauren classification, n (%) | 2.343 | 0.673 | |||||
| Intestinal type | 56 (38.6) | 18 (40) | 20 (34.5) | 18 (42.9) | |||
| Diffuse type | 48 (33.1) | 17 (37.8) | 18 (31) | 13 (31) | |||
| Mixed type | 41 (28.3) | 10 (22.2) | 20 (34.5) | 11 (26.2) | |||
SD, standard deviation.
Survival analysis was performed on patients included in the final analysis set (n = 145). Clinical information and follow-up data on survival status of the 145 patients were collected. After the final follow-up deadline of August 2025, 139 deaths and 6 cases of loss to follow-up were noted. The Kaplan–Meier survival analysis was conducted for the final dataset. The median survival time (MST) for all patients was 7.7 months (95% confidence interval [CI]: 6.8–8.5). As shown in Table 2, the overall 1-year, 2-year, and 3-year survival rates were 57.6%, 35.3%, and 15.1%, respectively.
| Total (n = 145) | Chemotherapy group (n = 45) | Immunotherapy/targeted therapy group (n = 58) | Chemotherapy + immunotherapy/targeted therapy group (n = 42) | ||
| Number of deaths, n (%) | 139 (95.9) | 44 (97.8) | 55 (94.8) | 40 (95.2) | |
| MST (months), median (Q1–Q3) | 7.7 (6.8–8.5) | 4.1 (3.3–5.0) | 8.5 (7.1–9.9) | 10.5 (8.9–12.1) | |
| 1 year | 57.6 (49.3–65.8) | 56.8 (42.2–71.4) | 54.5 (41.4–67.7) | 62.5 (47.5–77.5) | |
| 2 years | 35.3 (27.3–43.2) | 34.1 (20.1–48.1) | 34.5 (21.9–47.1) | 37.5 (22.5–52.5) | |
| 3 years | 15.1 (9.2–21.1) | 11.4 (2.0–20.7) | 16.4 (6.6–26.1) | 17.5 (5.7–29.3) | |
MST, median survival time.
At the final follow-up, 97.8% of patients (44 cases) in the chemotherapy-alone
group had died, with an MST of 4.1 months (95% CI: 3.3–5.0). In the
immunotherapy/targeted therapy group, 94.8% of patients (55 cases) had died,
with an MST of 8.5 months (95% CI: 7.1–9.9). In the chemotherapy +
immunotherapy/targeted therapy group, 95.2% of patients (40 cases) had died,
with an MST of 10.5 months (95% CI: 8.9–12.1). According to the log-rank test,
the immunotherapy/targeted therapy group and the chemotherapy +
immunotherapy/targeted therapy group showed a survival benefit compared to the
chemotherapy alone group (both p
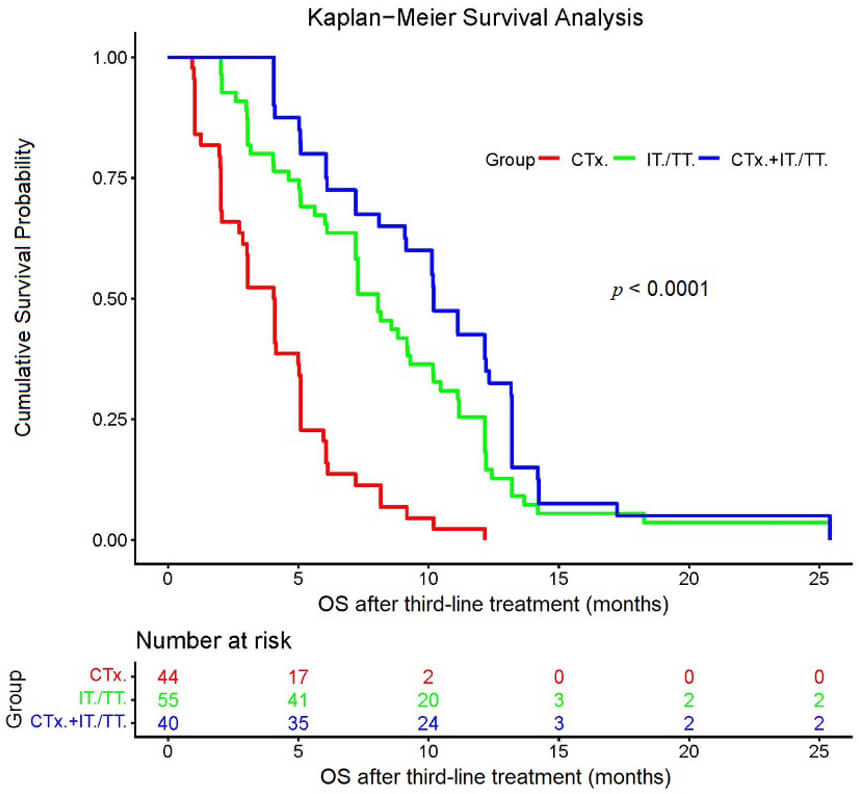 Fig. 4.
Kaplan–Meier survival analysis of the three groups. The starting point for determining the overall survival was when the patients began to receive the third-line treatment. CTx., chemotherapy; CTx. + IT./TT., chemotherapy + immunotherapy/targeted therapy; IT./TT., immunotherapy/targeted therapy; OS, overall survival.
| Median survival time (months) | 95% CI | Overall log-rank test | Comparison with chemotherapy group (p-value) | Comparison with immunotherapy/targeted therapy group (p-value) | |
| Chemotherapy group (n = 44) | 4.1 | 3.3–5.0 | |||
| Immunotherapy/targeted therapy group (n = 55) | 8.5 | 7.1–9.9 | |||
| Chemotherapy + immunotherapy/targeted therapy group (n = 40) | 10.5 | 8.9–12.1 | 0.056 | ||
| Overall | 7.7 | 6.8–8.5 |
CI, confidence interval.
This study conducted an in-depth investigation into the prognostic factors affecting outcomes in patients with advanced gastric cancer.
The univariate analysis revealed that gender, age, body weight, body surface area, and history of gastric cancer surgery were significantly associated with the prognosis following third-line treatment. Prior to performing multivariate Cox regression analysis, a multicollinearity test was conducted on the included covariates using the VIF. The specific results are presented in Supplementary Table 2. As shown in the table, all variables had VIF values less than 2, indicating no severe multicollinearity issues, thus allowing the analysis to proceed with the subsequent regression analysis. The results of subsequent multivariate analysis showed that a history of prior gastric cancer surgery (hazard ratio [HR] = 0.639; 95% CI: 0.431–0.948; p = 0.026) was an independent favorable prognosis factor after third-line treatment for advanced gastric cancer. Detailed results of both univariate and multivariate Cox regression analyses are presented in Table 4.
| Relevant factor | Category | Univariate analysis | Multivariate analysis | ||
| HR (95% CI) | p | HR (95% CI) | p | ||
| Gender | Female vs. male | 1.616 (1.09–2.385) | 0.016 | 1.352 (0.757–2.414) | 0.308 |
| Age (years) | 0.982 (0.969–0.995) | 0.007 | 0.988 (0.973–1.004) | 0.135 | |
| Weight (kg) | 0.985 (0.968–1.002) | 0.092 | 0.962 (0.898–1.030) | 0.265 | |
| Height (cm) | 0.985 (0.962–1.009) | 0.210 | |||
| Body surface area (m2) | 0.408 (0.137–1.215) | 0.107 | 6.265 (0.062–631.815) | 0.436 | |
| Comorbidity | Yes vs. No | 1.07 (0.727–1.573) | 0.732 | ||
| Metastasis | Yes vs. No | 0.909 (0.422–1.960) | 0.808 | ||
| History of gastric cancer surgery | Yes vs. No | 0.661 (0.458–0.955) | 0.027 | 0.639 (0.431–0.948) | 0.026 |
| Lauren classification | Intestinal type | Reference | - | ||
| Diffuse type | 1.05 (0.669–1.647) | 0.833 | |||
| Mixed type | 1.295 (0.848–1.979) | 0.231 | |||
CI, confidence interval; HR, hazard ratio. Bold statistics indicate statistically significant results.
The incidence of adverse drug events between the treatment groups was 90.5% in the chemotherapy + immunotherapy/targeted therapy group, 75.6% in the chemotherapy alone group, and 60.3% in the immunotherapy/targeted therapy group (Table 5). There was a significant difference in adverse drug events among the three groups (p = 0.003), and the number of adverse reactions in the chemotherapy + immunotherapy/targeted therapy group was significantly greater than that in the immunotherapy/targeted therapy group (p = 0.001).
| Chemotherapy group | Immunotherapy/targeted therapy group | Chemotherapy + immunotherapy/targeted therapy group | Total, n (%) | p-value | ||
| Total number | 45 | 58 | 42 | 145 (100.0) | ||
| Cytopenia | 12 | 11 | 13 | 36 (24.8) | ||
| Gastrointestinal reactions | 8 | 11 | 9 | 28 (19.3) | ||
| Abnormal liver function | 2 | 3 | 4 | 9 (6.2) | ||
| Abnormal cardiac function | 1 | 1 | 1 | 3 (2.1) | ||
| Abnormal nerve function | 3 | 1 | 3 | 7 (4.8) | ||
| Abnormal renal function | 2 | 2 | 0 | 4 (2.8) | ||
| Skin and mucosal reactions | 2 | 4 | 4 | 10 (6.9) | ||
| Others | 4 | 2 | 4 | 10 (6.9) | ||
| Total, n (%) | 34 (75.6) | 35 (60.3) | 38 (90.5) | 107 (73.8) | 11.541 | 0.0031/0.1032/0.0663/0.0014 |
1p-value for comparing all three groups; 2p-value for comparing chemotherapy vs. immunotherapy/targeted therapy; 3p-value for comparing chemotherapy vs. chemotherapy + immunotherapy/targeted therapy; 4p-value for comparing immunotherapy/targeted therapy vs. chemotherapy + immunotherapy/targeted therapy.
There were 107 patients experiencing at least one adverse drug event (ADE) during the study, accounting for 73.8% of the total number, and no patients who withdrew from third-line treatment due to serious ADEs were identified. As shown in Table 5 and Fig. 5, cytopenia was the most common ADE, followed by gastrointestinal reactions such as nausea and vomiting.
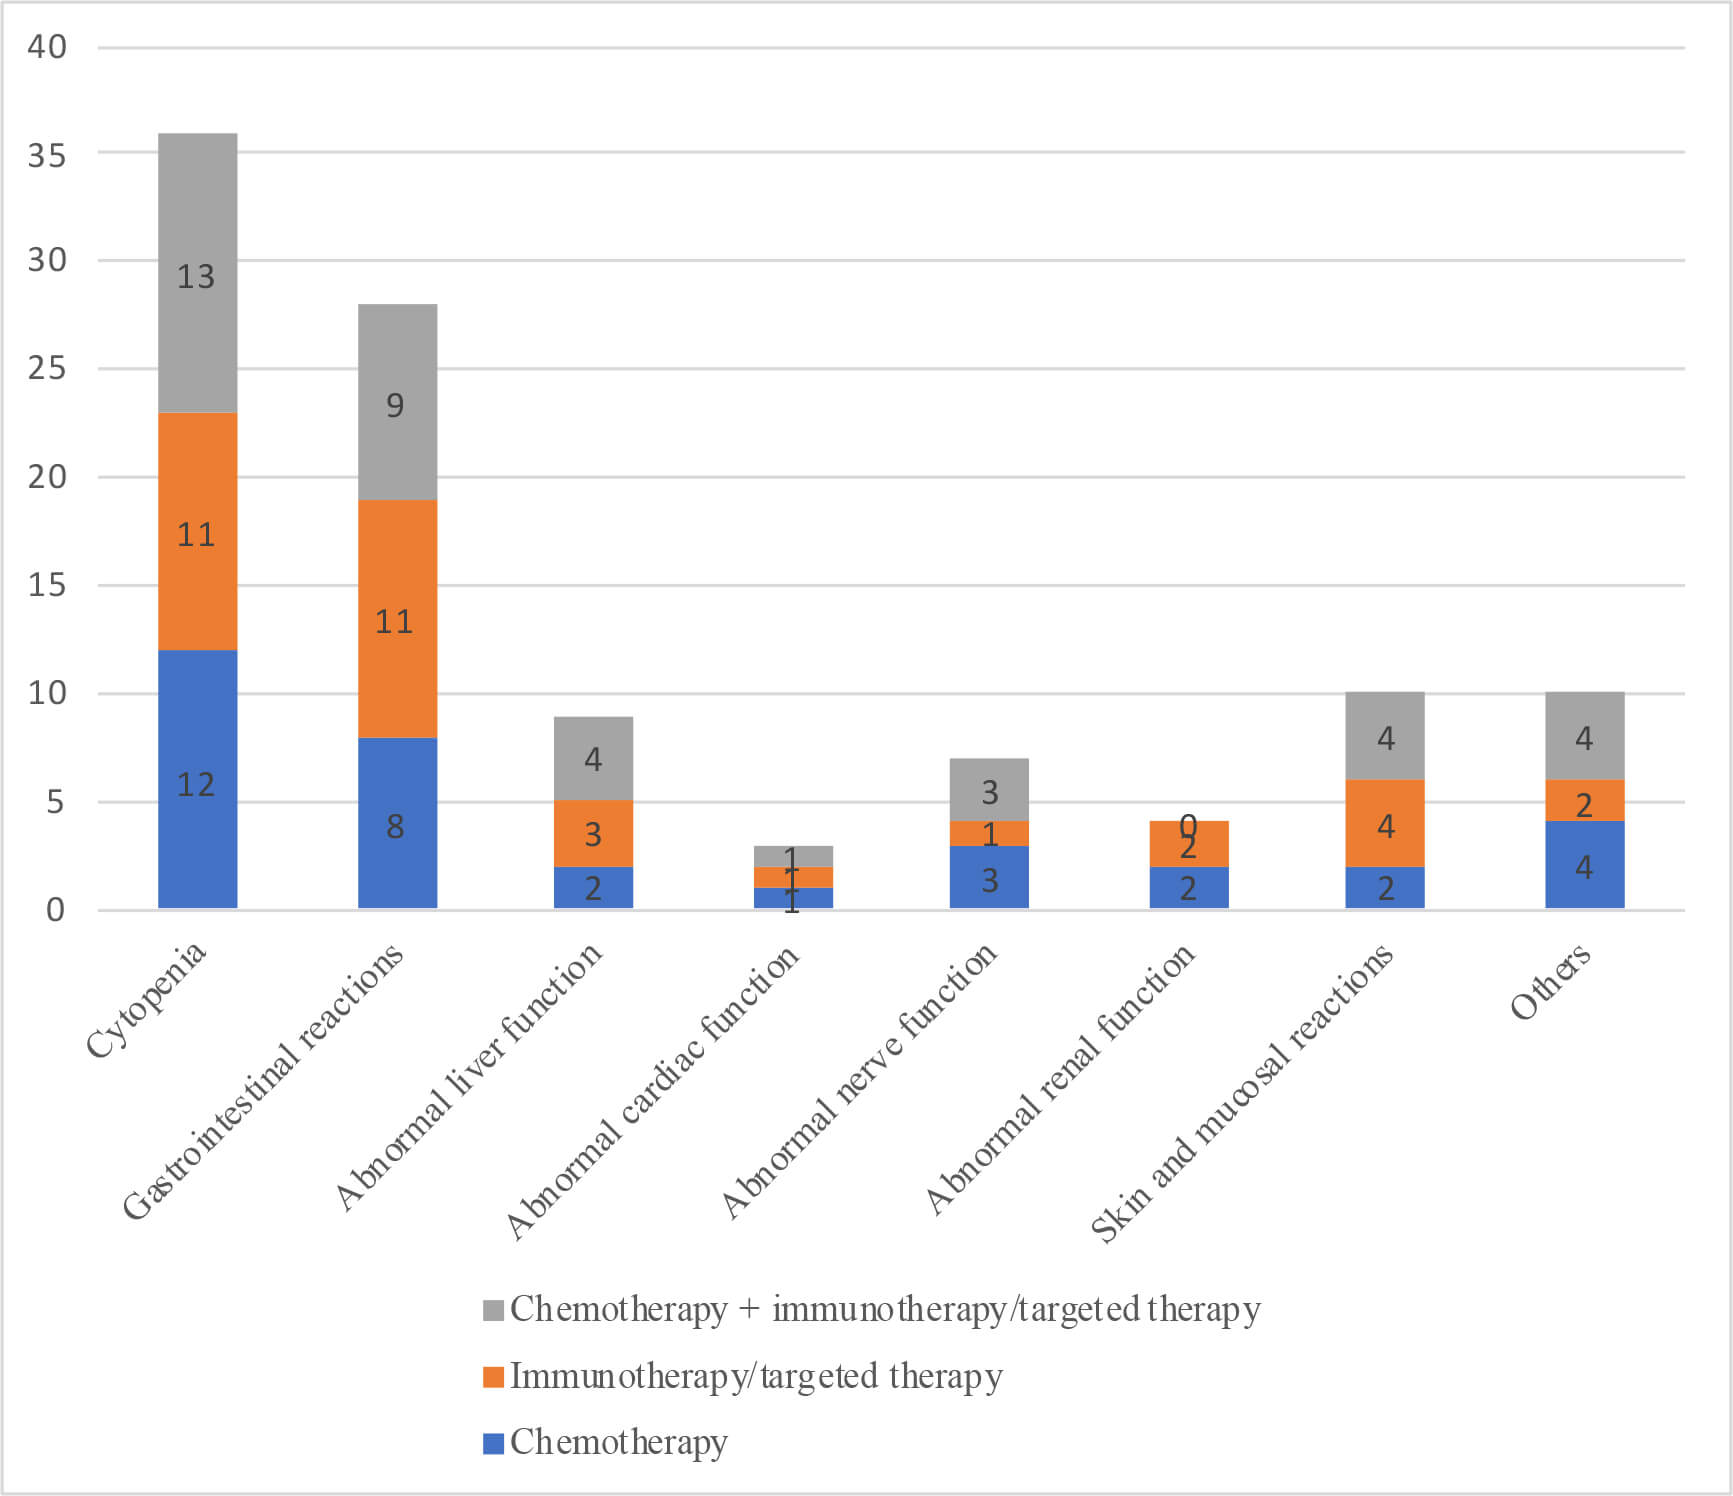 Fig. 5.
Different adverse events by group.
Since this study retrospectively collected cost information from unevenly distributed patient treatment processes between 2016 and 2022, the same monetary amount represents different values due to variations in the year and annual interest rates. To facilitate comparisons of total costs across different years, this study required uniform conversion of all cost information. To eliminate the impact of inflation on cost analysis, this study applied the consumer price index (CPI) published by the National Bureau of Statistics to deflate all cost data. All nominal costs were adjusted to the constant price level of 2016 (the base period of this study) to reflect the true trend of cost changes. Using this as a benchmark ensures consistency and continuity in data analysis throughout the time series. The deflation formula is: Real Cost = Nominal Cost / (Annual Fixed-Base CPI / 100). Using 2016 as the base period (2016 CPI = 100), the fixed-base indices for each year and their corresponding deflation coefficients are shown in Supplementary Table 3.
As illustrated in Table 6, statistical analysis of the 103 patients included in
the full analysis set showed that the median overall total cost was 22,319.2
Chinese yuan (range: 1936.2–173,671.2 Chinese yuan [1 Chinese yuan = 0.12 EUR]),
the median total cost of anti-tumor drug treatment was 9491.1 Chinese yuan
(391.2–85,707.3 Chinese yuan), and the median total cost of other treatments was
11,307.0 Chinese yuan (range: 314.8–138,936.9 Chinese yuan). The Kruskal–Wallis
method was employed to compare the costs, and the final results showed that the
p-values were 0.005,
| Total | Chemotherapy group | Immunotherapy/targeted therapy group | Chemotherapy + immunotherapy/targeted therapy group | H | p-value | |
| Number of patients (missing cases) | 103 (42) | 35 (10) | 38 (20) | 30 (12) | ||
| Median total cost (Chinese yuan) | 22,319.2 | 19,557.8 | 19,110.7 | 29,635.8 | 7.930 | 0.005 |
| (Min, Max) | (1936.2, 173,671.2) | (1936.2, 87,337.5) | (2225.9, 173,671.2) | (11,098.1, 125,869.3) | ||
| Median total cost of anti-tumor drug treatment (Chinese yuan) | 9491.1 | 7047.2 | 8052.9 | 15,165.4 | 12.811 | |
| (Min, Max) | (391.2, 85,707.3) | (391.2, 43,027.2) | (1911.0, 68,189.9) | (3395.4, 85,707.3) | ||
| Median total cost of others (Chinese yuan) | 11,307.0 | 11,501.9 | 8270.0 | 14,312.6 | 3.896 | 0.048 |
| (Min, Max) | (314.8, 138,936.9) | (1134.8, 44,310.2) | (314.8, 138,936.9) | (3551.7, 83,426.6) |
p-values were calculated by the Kruskal–Wallis method. 1 Chinese yuan = 0.12 EUR.
Regarding the cost and survival analysis, scatter plots were drawn to depict the
relationship between the total cost of third-line therapy for advanced gastric
cancer and MST. Furthermore, the total costs associated with the use of systemic
anti-tumor drugs were calculated, and scatter plots were drawn to depict the
relationship between the total drug costs of third-line therapy and survival time
(Figs. 6,7). Based on the distribution characteristics observed in the scatter
plots, both the total cost of third-line therapy and the total drug cost were
positively correlated with survival time, with correlation coefficients (r2)
of 0.2656 (p
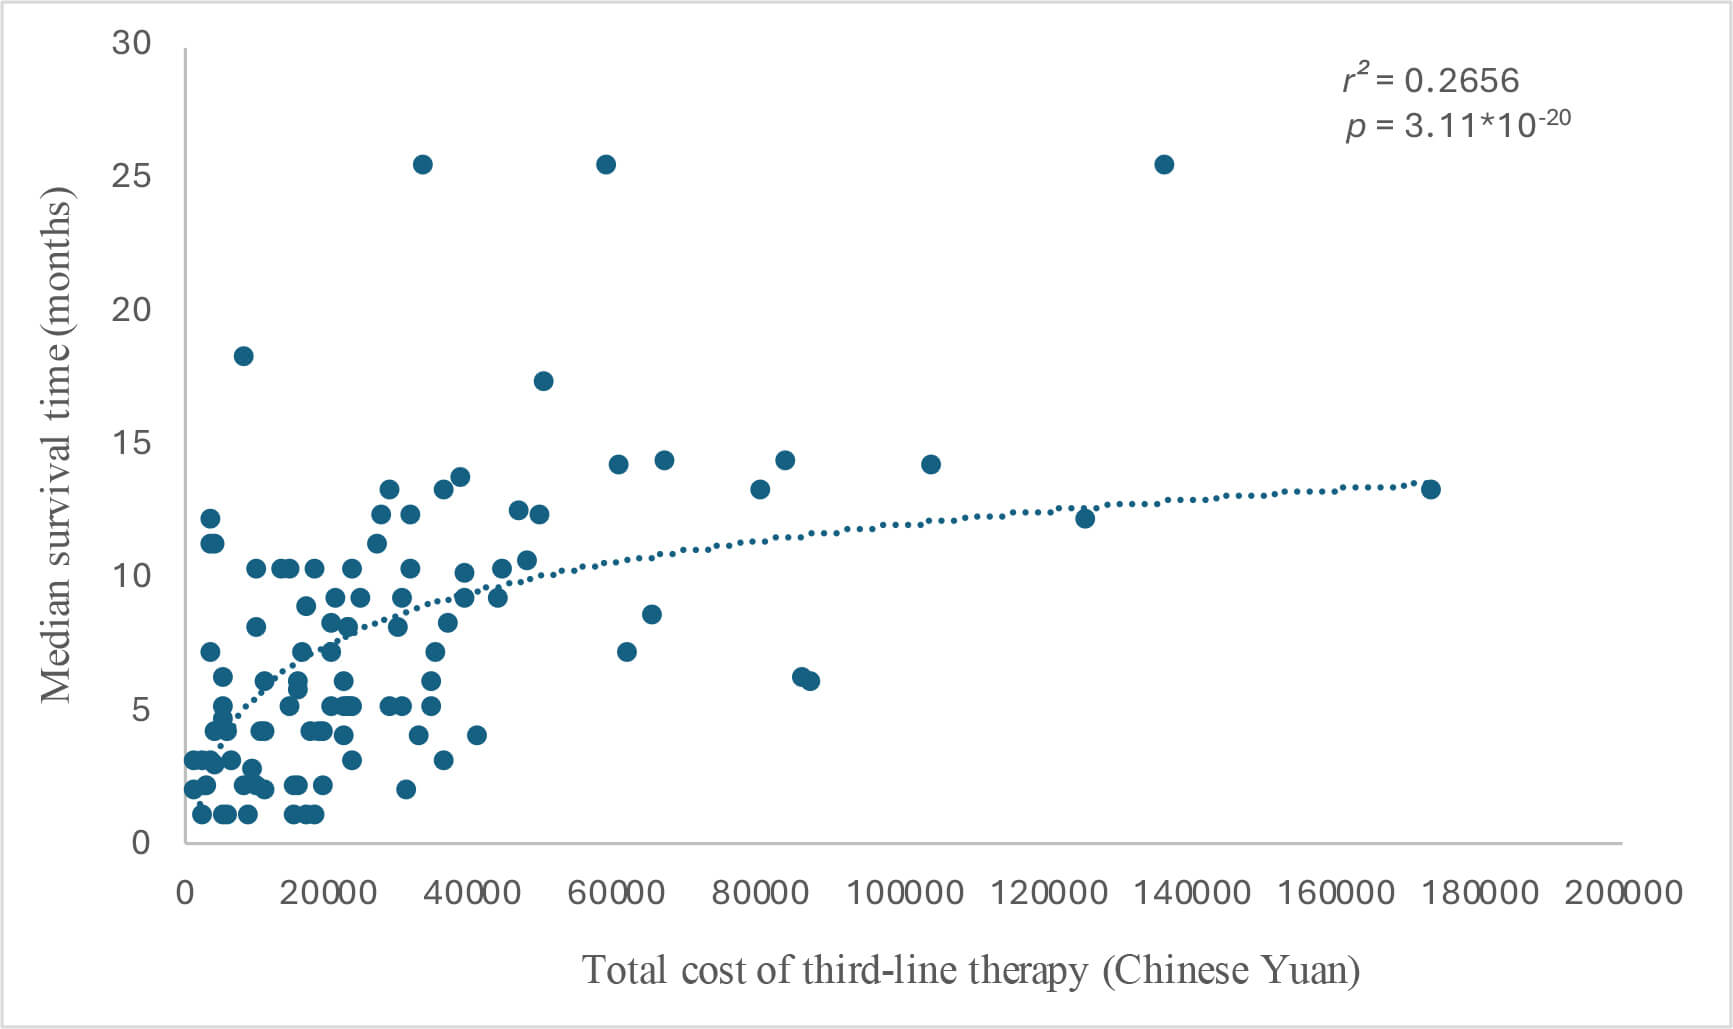 Fig. 6.
Cost–survival scatter plot for total cost (Chinese Yuan) and median survival time (months). 1 Chinese yuan = 0.12 EUR.
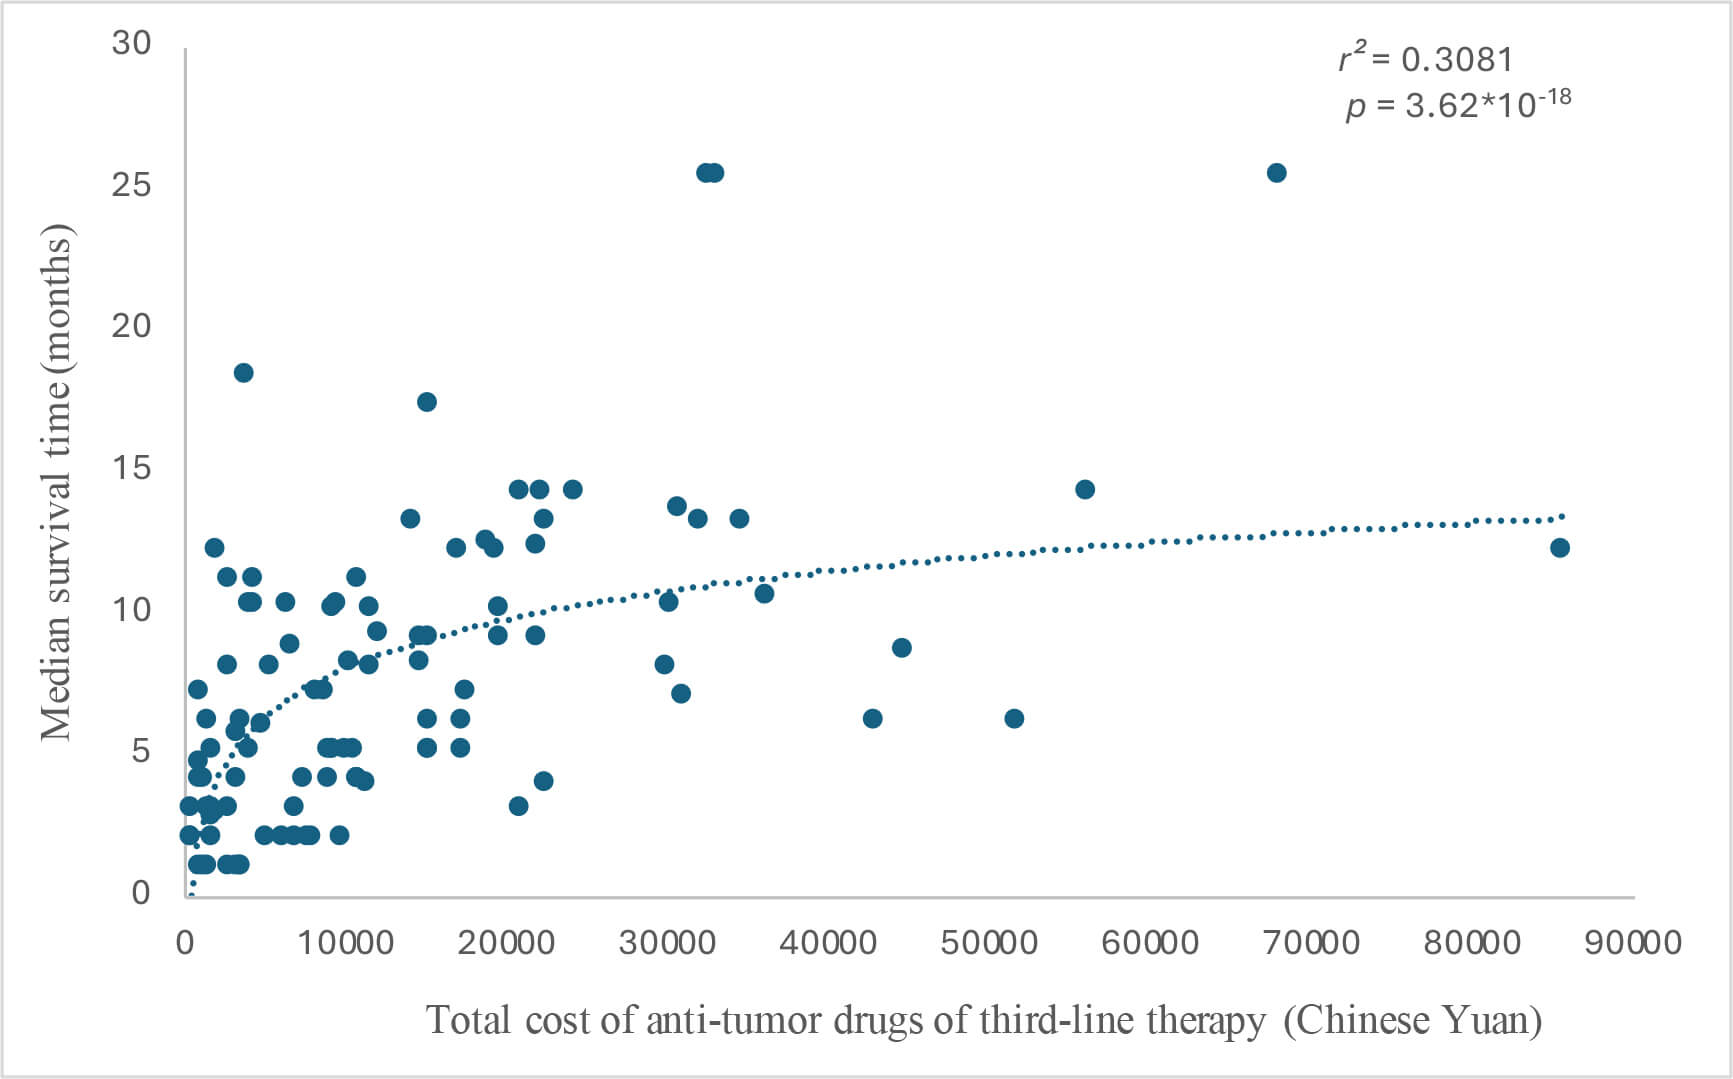 Fig. 7.
Cost–survival scatter plot for total cost of anti-tumor drugs (Chinese Yuan) and median survival time (months). 1 Chinese yuan = 0.12 EUR.
Finally, quality of life assessments were conducted in 119 patients at the three timepoints. After pairwise comparisons, no significant differences in the FACT-G scores were identified among the three groups at any timepoint (Table 7).
| Number of patients | T1 | T2 | T3 | |
| Total | 119 (145) | 87.09 |
73.14 |
86.02 |
| Chemotherapy | 37 (45) | 87.05 |
73.49 |
86.68 |
| Immunotherapy/targeted therapy | 52 (58) | 86.63 |
73.37 |
85.79 |
| Chemotherapy + immunotherapy/targeted therapy | 30 (42) | 87.93 |
72.33 |
85.60 |
| F | 0.670 | 0.592 | 0.591 | |
| p-value | 0.514 | 0.555 | 0.555 |
p-values are for comparing all three groups. T1, during screening; T2, mid-treatment; T3, two months after the end of treatment.
According to the findings of several randomized clinical trials, third-line therapies improve the survival rate of patients with advanced gastric cancer. In Western countries, the overall acceptance rate for third-line treatment remains relatively low. However, in Japan, the vast majority of patients with advanced gastric cancer receive second-line therapy, and over half proceed to third-line treatment. This approach has significantly improved the survival rate for these patients, and the national treatment guidelines explicitly recommend specific third-line treatment strategies. Despite the high incidence of gastric cancer in China, at present, comprehensive and systematic assessments regarding the efficacy of third-line therapeutic interventions for advanced gastric cancer remain limited. This study was designed and conducted to explore the various critical aspects of third-line treatment regimens—including efficacy, safety, and cost—in Chinese patients with advanced gastric cancer.
This study retrospectively analyzed the third-line treatment regimens received by patients with advanced gastric cancer. A sample of 145 patients with advanced gastric cancer was included in this study, including 45 in the chemotherapy-alone group, 58 in the immunotherapy/targeted therapy group, and 42 in the chemotherapy + immunotherapy/targeted therapy group. No significant differences were observed among the three groups before receiving third-line treatment. Variables such as prior treatment regimens, height, weight, medical history, surgical status, and Lauren classification were comparable across the groups. The results of this study showed that both the chemotherapy + immunotherapy/targeted therapy and immunotherapy/targeted therapy regimens significantly improved the prognosis and prolonged overall survival compared with chemotherapy-alone regimen. The aforementioned article has pointed out that in the overall study population, irinotecan or docetaxel monotherapy had no significant overall survival benefits in patients who had received second-line treatment (HR: 0.812, 95% CI: 0.450–1.464) [5], consistent with the conclusions of this study. Immunotherapy has also been regarded as one of the most important treatment strategies for cancer patients in the future and has achieved great clinical success [6]. Despite the survival benefit of immunotherapy/targeted therapy regimen, resistance to these treatments should not be overlooked, as it may result in treatment failure. The underlying resistance mechanisms are highly heterogeneous and include loss of neoantigens, defects in antigen presentation and interferon signaling, upregulation of immune inhibitory molecules, and exclusion of T cells. Further efforts are warranted to determine strategies to overcome resistance to immunotherapy/targeted therapy.
Furthermore, there are many reports on the influencing factors of treatment
prognosis in patients with advanced gastric cancer. For example, Zhou et
al. [7] conducted a prognostic model analysis involving 112 patients with
advanced gastric cancer treated with first-line therapy between July 2013 and
September 2019. Their univariate analysis identified several factors
significantly associated with survival prognosis, including the Eastern
Cooperative Oncology Group (ECOG) performance status, presence of peritoneal
metastasis, hemoglobin levels, serum lactate dehydrogenase (LDH),
carcinoembryonic antigen (CEA), and carbohydrate antigen 19-9 (CA19-9). Cox
regression analysis showed that peritoneal metastasis, hemoglobin
Finally, the chemotherapy + immunotherapy/targeted therapy group exhibited the highest incidence rate of adverse events, reaching 90.5%. Likewise, a study evaluating nivolumab as a third-line treatment for advanced gastric cancer demonstrated a favorable safety profile for immunotherapy/targeted therapy; among patients in the treatment group who achieved a complete or partial response, 87% survived for at least 1 year and 61.3% survived for 2 years. The overall median survival was 26.6 months, and the incidence of adverse events was 43%, with the occurrence of grade 3 to 4 adverse events being less than 10%. These findings lend credence to the safety of immunotherapy under the premise of drug effectiveness [20]. Furthermore, our analysis of adverse event data identified cytopenia as the most prevalent drug-related toxicity, encompassing myelosuppression affecting platelets, neutrophils, and trilineage cells. The second most common adverse reactions involved the gastrointestinal system, primarily manifesting as nausea and vomiting. These findings are corroborated by a study conducted by Kang et al. [5] on third-line treatment using irinotecan or similar agents, which indicates that bone marrow suppression is the principal adverse drug reaction, with neutropenia occurring in over 15% of patients, negatively impacting disease progression.
Several limitations of our study should be acknowledged. First, the retrospective nature of the data collection may have introduced selection and information biases. Second, the overall sample size was relatively small (n = 145). Following patient categorization based on treatment type, the sample size in each group (especially the combination therapy group, n = 42) became much more limited, which may have reduced the statistical power and robustness of the findings. Third, all data were sourced from a single institution (Zhongshan Hospital, Fudan University), limiting the generalizability of the results to the broader Chinese population or to patients treated in other healthcare settings with different practices and from other demographic groups. Fourth, there were limitations associated with the cost analysis. While costs were adjusted using a benchmark interest rate, the analysis did not account for other economic factors such as inflation, changes in drug pricing, or variations in insurance reimbursement policies over the study period (2016–2022), potentially affecting the accuracy and comparability of the cost data. Fifth, the presence of missing data, particularly for survival status (6 patients) and cost information (41 patients), may have introduced bias and compromised the completeness of the survival and economic analyses. Sixth, there was substantial heterogeneity in the treatment regimens. The immunotherapy/targeted therapy group likely comprised a variety of specific agents and the aggregation of different drugs into broad categories may have obscured clinically meaningful differences in efficacy and toxicity among individual agents. Finally, there was a lack of patient-reported outcomes. This study did not assess quality of life or other patient-reported outcomes. Therefore, the impact of these treatments on patients’ overall well-being and daily functioning remains unknown. Further prospective studies are warranted to verify the results of our study.
The survival analysis of this study demonstrates that gastric cancer patients receiving chemotherapy combined with immunotherapy or targeted therapy as the third-line treatment achieved the longest MST; however, this regimen is also associated with a higher incidence of adverse events and overall treatment costs. In addition, multivariate analysis identifies the absence of prior gastric cancer surgery as an independent prognostic factor for outcomes in patients with advanced gastric cancer receiving third-line treatment.
• This study aimed to retrospectively evaluate the therapeutic efficacy, safety, and costs of different third-line treatment regimens for treating advanced gastric cancer, thereby providing a theoretical basis to guide the selection of third-line treatment regimens.
• A total of 145 patients were included and divided into three groups: 45 patients in the chemotherapy-alone group, 58 patients in the immunotherapy/targeted therapy group, and 42 patients in the chemotherapy + immunotherapy/targeted therapy group.
• Survival analysis revealed a median survival time (MST) of 7.7 months (95% CI: 6.8–8.5) for the overall cohort, with the chemotherapy + immunotherapy/targeted therapy group exhibiting the longest MST (MST: 10.5 months; 95% CI: 8.9–12.1), followed by the immunotherapy/targeted therapy group (MST: 8.5 months; 95% CI: 7.1–9.9).
• Regression analysis showed that a history of gastric surgery was an independent prognostic factor (hazard ratio [HR] = 0.639; 95% CI: 0.431–0.948; p = 0.026) for outcomes in gastric cancer patients receiving third-line treatment.
• The chemotherapy + immunotherapy/targeted therapy group exhibited the highest incidence of adverse events (90.5%), followed by the chemotherapy-alone group (75.6%).
• The cost analysis showed that the chemotherapy + immunotherapy/targeted therapy group incurred the highest treatment costs, and both the total treatment costs and anti-tumor drug-related costs were significantly and positively correlated with patient survival (r2 = 0.2656 and 0.3081).
The data that support the findings of this study are available from the corresponding authors upon reasonable request.
SY, CWZ, and TSL made substantial contributions to study conception and design. XLZ performed the acquisition and analysis of data. SY drafted the manuscript. All authors contributed to the important editorial changes in the manuscript. All authors gave final approval of the version to be published. All authors have participated sufficiently in the work to take public responsibility for appropriate portions of the content and agreed to be accountable for all aspects of the work.
This study was approved by the Ethics Committee of Zhongshan Hospital, Fudan University (Approval No.: B2020-253R2). All procedures were performed in compliance with the Good Clinical Practice guidelines and the Declaration of Helsinki. Written informed consent was acquired from all patients before any research procedures were undertaken.
The authors would like to sincerely thank Dr. Qing Liu and Dr. Xueyi Weng from Zhongshan Hospital, Fudan University, for their critical review and valuable methodological insights during the preparation of this article. Gratitude is also extended to all of the patients and their families for their cooperation and support.
This research received no external funding.
The authors declare no conflict of interest.
Supplementary material associated with this article can be found, in the online version, at https://doi.org/10.31083/BJHM50918.
References
Publisher’s Note: IMR Press stays neutral with regard to jurisdictional claims in published maps and institutional affiliations.