


1 Department of Respiratory and Critical Care Medicine, The Fourth Affiliated Hospital of Soochow University (Suzhou Dushu Lake Hospital), 215000 Suzhou, Jiangsu, China
2 School of Nursing, Fudan University, 200032 Shanghai, China
3 Department of General Surgery, The Fourth Affiliated Hospital of Soochow University (Suzhou Dushu Lake Hospital), 215000 Suzhou, Jiangsu, China
Abstract
Obliterative bronchiolitis (OB) is a chronic, progressively obstructive lung disease characterized by fixed airflow limitation and a high burden of malnutrition. At present, whether a personalized regimen combining nutritional support with respiratory training could improve obliterative bronchiolitis patient outcomes remains unclear. Thus, this study aimed to explore the clinical efficacy of a comprehensive intervention combining nutritional support with respiratory training in OB patients, with a particular focus on assessing their pulmonary function.
A retrospective analysis was conducted on 101 patients with OB who received treatment in The Fourth Affiliated Hospital of Soochow University (Suzhou Dushu Lake Hospital) from January 2022 to March 2025. According to the type of intervention, the subjects were divided into the experimental group (56 cases, receiving comprehensive intervention) and the control group (45 cases, receiving nutritional support only). Propensity score matching was used to balance the baseline data at a 1:1 ratio, and 44 pairs of patients were successfully matched. Pre- and post-intervention data on pulmonary function indicators, nutritional indicators, oxidative stress and inflammatory indicators, as well as quality of life and symptom indicators of the included patients, were compared. Multiple linear regression analysis was performed to determine the independent factors affecting the changes in pulmonary function indicators before and after the intervention.
Regarding the nutritional status, the experimental group exhibited significant post-intervention improvement only in the Nutritional Risk Screening 2002 (NRS-2002) score when compared with the pre-intervention score (p < 0.05). After the intervention, the forced expiratory volume in the first second (FEV1; p = 0.002) and forced vital capacity (FVC; p < 0.001) in the experimental group were significantly higher than those in the control group, while the malondialdehyde (p < 0.001), C-reactive protein (p = 0.005) and procalcitonin (p < 0.001) in the experimental group were significantly lower than those in the control group. The number of patients with modified British Medical Research Council (mMRC) dyspnea scale score <2 in the experimental group was significantly higher than that in the control group (p = 0.006), and the improvements in 6-minute walk distance (6MWD) and World Health Organization Quality of Life-Brief (WHOQOL-BREF) version scores were greater in the experimental group than in the control group. In addition, multiple linear regression analysis showed that compared with nutritional support alone, the comprehensive intervention was independently associated with greater improvements in FEV1 (p = 0.002) and FVC (p = 0.001) but had no independent effect on improvements of FEV1/FVC (p = 0.556).
Comprehensive intervention combining nutritional support with respiratory training effectively improves the pulmonary function, oxidative stress, inflammatory status, quality of life, and respiratory symptoms in OB patients, with outcomes superior to those achieved with nutritional support alone.
Keywords
- obliterative bronchiolitis
- pulmonary function
- nutritional support
- respiratory training
- propensity score matching
Chronic small airway diseases are characterized by progressive airflow limitation and irreversible pulmonary function decline, posing a significant burden on global respiratory health. Among these diseases, chronic obstructive pulmonary disease (COPD) is the most common, with a global prevalence of approximately 10% in adults over 40 years old [1]. Previous studies have confirmed that a comprehensive intervention combining nutritional support and respiratory training can effectively improve pulmonary function and exercise capacity in COPD patients [2, 3]. However, the efficacy of comprehensive intervention in obliterative bronchiolitis, another destructive but understudied small airway disease, remains largely unknown, although it shares similar clinical outcomes, such as refractory airflow limitation and poor prognosis, with COPD.
Obliterative bronchiolitis (OB) is a rare progressive inflammatory disease of small airways, characterized by subepithelial fibrosis, luminal stenosis, and bronchial obliteration. It mainly occurs as a secondary complication, with an estimated incidence of 1%–5% in patients after receiving lung transplants and up to 10% in hematopoietic stem cell transplant recipients [4, 5]. In addition, inhalation injury and connective tissue diseases (such as rheumatoid arthritis) are also common causes of OB [4, 6]. Diagnosis typically relies on examining a constellation of clinical presentations, assessing fixed airflow obstruction on the pulmonary function tests, and analyzing high-resolution computed tomography (CT) findings. Unlike COPD driven by chronic smoking-related inflammation, OB is often associated with immune-mediated injury or chronic tissue repair dysfunction, which further exacerbates nutritional imbalance and respiratory muscle weakness in affected patients [7]. Current therapeutic strategies are largely limited to immunosuppressive agents and supportive care, with limited efficacy in reversing disease progression. This gap underscores the clinical relevance of our study.
Clinically, OB patients face unique challenges that highlight the necessity of non-pharmacological interventions. Firstly, malnutrition is very common in OB patients: Up to 45% of post-transplant OB patients present with hypoalbuminemia or weight loss, attributed to immunosuppressive drug-induced gastrointestinal side effects, chronic inflammation, and increased energy expenditure from labored breathing [8, 9]. Malnutrition, in turn, impairs respiratory muscle strength and immune function, forming a vicious cycle that accelerates pulmonary function decline [10]. Secondly, OB-related bronchiolar obliteration leads to fixed airflow limitation, and pharmacologic treatments such as inhaled corticosteroids and long-acting bronchodilators can only alleviate symptoms in 30%–40% of patients and fail to reverse the underlying structural airway damage [11]. Respiratory training, capable of improving respiratory muscle endurance and alveolar ventilation, has shown promise in other obstructive lung diseases, but its efficacy in OB remains to be deciphered [12].
Notably, existing research on OB interventions is severely limited: Most studies focus on pharmacological strategies [13] or surgical options [14], while no studies have evaluated the combined effect of nutritional support and respiratory training. Moreover, observational studies on OB often suffer from selection bias (such as differences in age or comorbidities between intervention and control groups), which weakens the reliability of conclusions [15]. To address this gap and to explore non-pharmacological options in the clinical management of OB patients, this retrospective study investigated the clinical efficacy of a comprehensive intervention combining nutritional support with respiratory training in OB patients, with a particular focus on assessing their pulmonary function. The data analysis entailed the elimination of potential confounding factors using propensity score matching.
This is a single-center, retrospective cohort study. A total of 101 consecutive
patients with OB admitted to The Fourth Affiliated Hospital of Soochow University
(Suzhou Dushu Lake Hospital) between January 2022 and March 2025, who had complete follow-up records, were
enrolled. The patients were divided into the experimental group (receiving
comprehensive intervention integrating nutritional support and respiratory
training; n = 56) and the control group (receiving nutritional support
alone; n = 45) based on the intervention received. The diagnosis of OB
was established based on consistent clinical features (such as progressive
dyspnea, chronic cough), fixed airflow obstruction on pulmonary function tests
(post-bronchodilator forced expiratory volume in the first second
[FEV1]/forced vital capacity [FVC]
Inclusion criteria of this study are as follows: (1) Patients aged
Exclusion criteria of this study are as follows: (1) Individuals with other serious chronic respiratory diseases (such as active asthma, COPD caused by emphysema, bronchiectasis); (2) Patients with severe heart, liver, or kidney dysfunction; (3) Patients with active malignant tumors; (4) Pregnant or lactating women; (5) Individuals who had recently undergone major surgery (within 3 months); (6) Individuals showing recent acute exacerbation or respiratory infections (within 4 weeks); (7) Individuals who had recently been subject to immunosuppressive therapy, systemic nutritional support, or pulmonary rehabilitation (within 3 months); (8) Individuals with contraindications to exercise (e.g., severe osteoporosis, arthritis, neuromuscular disorders); (9) Individuals with incomplete clinical data or who were lost to follow-up. The selection process of the study participants is illustrated in Fig. 1.
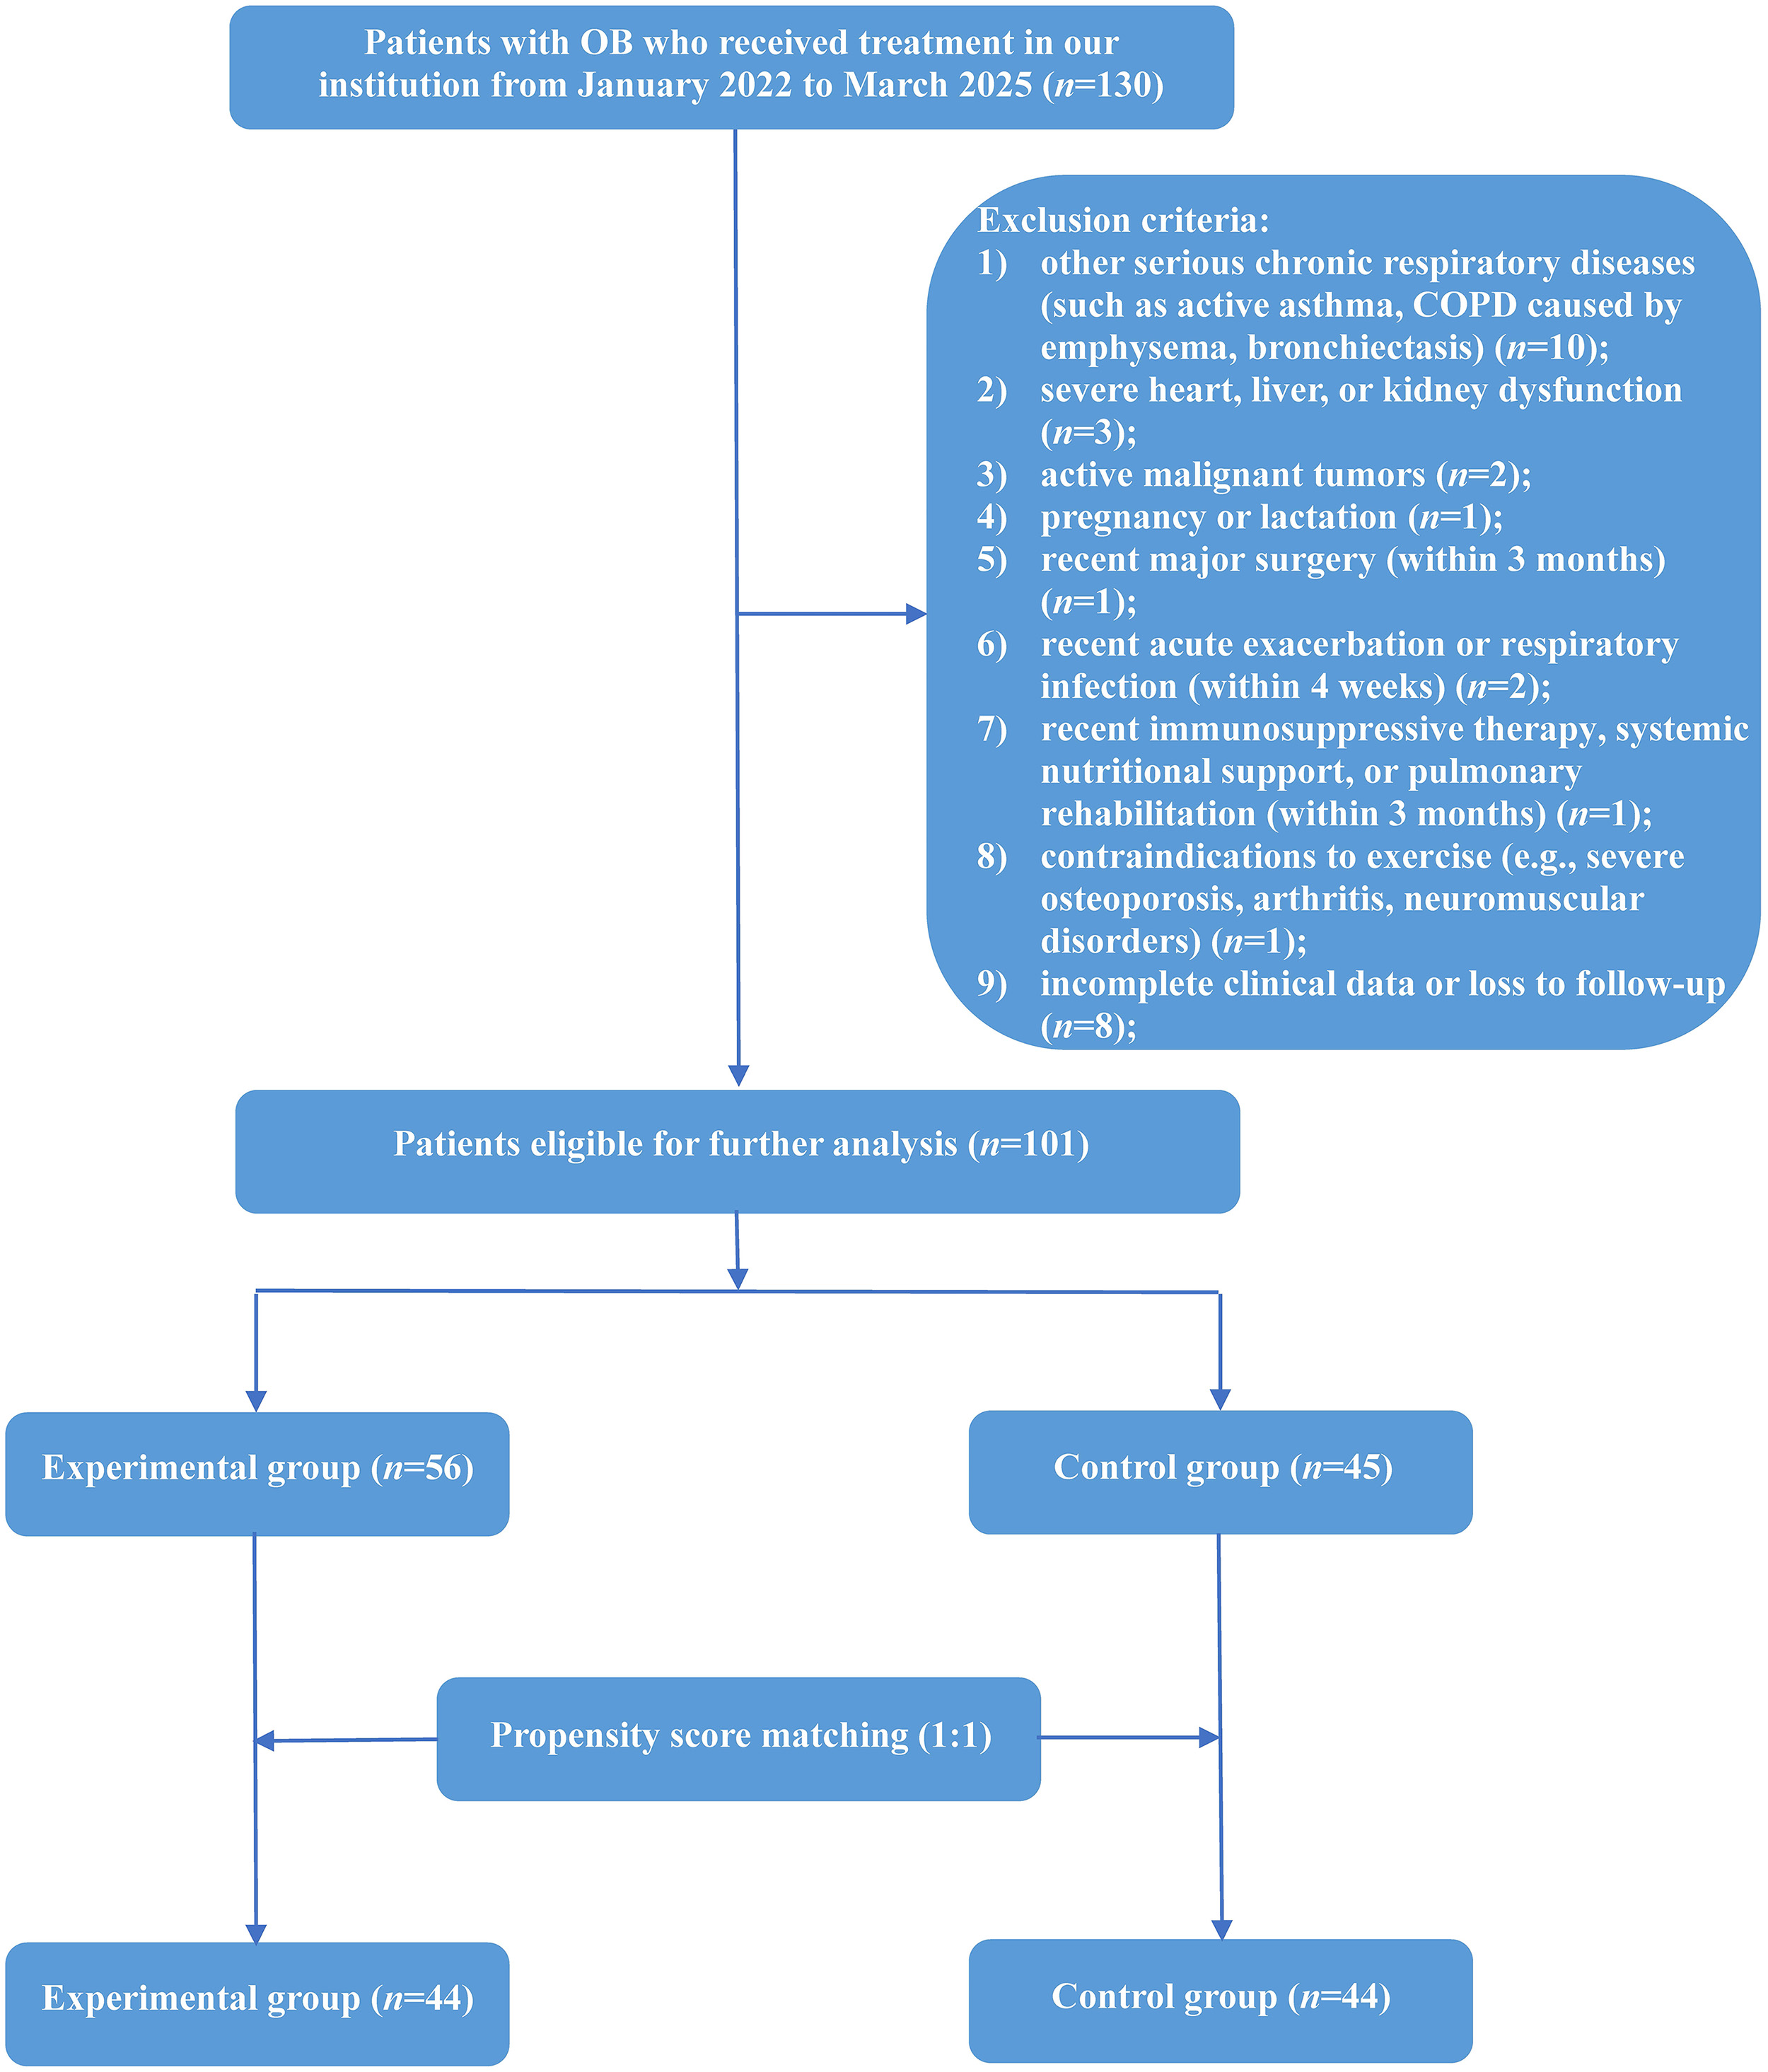 Fig. 1.
Flowchart depicting patient selection process. Abbreviations: COPD, chronic obstructive pulmonary disease; OB, obliterative bronchiolitis.
Before enrollment, all patients received inhaled corticosteroids (ICS) combined with long-acting bronchodilators (Symbicort Turbuhaler: H20140458, AstraZeneca AB, SE-151 85, Södertälje, Sweden) as the standard routine pharmacologic treatment prescribed in accordance with international guidelines. On the basis of the standard routine treatment administered, the patients were also given additional interventions based on the groups they were assigned to.
In the control group, the patients received standardized nutritional support only. This intervention involved a comprehensive nutritional assessment followed by an individualized dietary plan developed by clinical nutritionists. The objective was to ensure an energy intake of approximately 25–35 kcal/kg/day and a protein intake of 1.2–1.5 g/kg/day, adjusted according to nutritional risk, comorbidities and tolerance, with emphasis on maintaining an oral diet supplemented by oral nutritional supplements (ONS). The ONS used was a standard, commercially available polymeric formula (Ensure®: H20181147, Abbott Laboratories, Chicago, IL, US), providing approximately 1.0–1.5 kcal/mL with balanced macronutrients. Short-term enteral nutrition transition was initiated if oral intake remained inadequate. Nutritional status was reassessed every 2–4 weeks by monitoring body weight, body mass index (BMI), and albumin (ALB), as well as measuring the Nutritional Risk Screening 2002 (NRS-2002) scores, with adjustments to the dietary plan and energy/protein targets accordingly [17].
In the experimental group, the patients received the same individualized nutritional support as the control group (including the ONS protocol), plus a structured respiratory training program. The respiratory training was supervised by respiratory therapists and consisted of three components:
(1) Aerobic exercise training: The training consisted of 30–45 minutes of
treadmill walking or stationary cycling at moderate intensity (initial target:
60%–80% of the maximum heart rate achieved in the baseline 6-minute walk
test), 3–5 times per week. The exercise intensity was dynamically adjusted based
on patient tolerance, assessed using the Borg Rating of Perceived Exertion (RPE)
scale. The target RPE range was 3–5 (moderate to strong). If a patient
consistently reported RPE
(2) Inspiratory muscle training (IMT): This training consisted of two sets of 15 breaths at an initial intensity of 30%–50% of maximal inspiratory pressure (MIP) using a threshold loading device (PowerBreathe®, 20162091286, Hälsa Enterprises Limited, Birmingham, UK), performed twice daily. The IMT load was increased by approximately 5%–10% of the initial MIP every 2 weeks if the patient could comfortably complete the sets, with the goal of progressively reaching 50%–60% of MIP.
(3) Breathing techniques: Participants received supervised instruction and practice in pursed-lip breathing and diaphragmatic breathing [18].
The intervention period for both groups was 12 weeks.
Complete clinical data of patients were collected from the electronic medical record system, including baseline information and outcome indicators before and after intervention. Outcome indicators were available in two classifications: primary outcome indicators (such as pulmonary function indicators) and secondary outcome indicators (such as nutritional indicators, oxidative stress and inflammatory indicators, quality of life and symptom indicators). Specific details are as follows:
(1) Baseline information: Data on baseline information such as age, gender, disease duration, history of smoking, history of malnutrition, and history of pulmonary infection were collected.
(2) Pulmonary function indicators: The Jaeger MasterScreen pulmonary function tester (CareFusion, Germany) was used to assess the pulmonary function according to the American Thoracic Society (ATS)/European Respiratory Society (ERS) standard [19]. Parameters such as FEV1, FVC, FEV1/FVC, peak expiratory flow (PEF), and maximal voluntary ventilation (MVV) were recorded. Each indicator was measured at least 3 times, and the average value was computed.
(3) Nutritional indicators: Data on nutritional indicators, including BMI, ALB
and NRS-2002 scores, were collected. Launched by the European Society for
Parenteral and Enteral Nutrition (ESPEN) in 2002, the NRS-2002 is a widely used
international tool for screening nutritional risk in hospitalized patients [20].
The NRS-2002 consists of three components, namely impaired nutritional status
(0–3 points), disease severity (0–3 points), and age adjustment (0–1 point).
The total score was computed by determining the sum of all components’ scores. A
total score of
(4) Oxidative stress and inflammatory indicators: Data on superoxide dismutase (SOD) and malondialdehyde (MDA) levels were collected to assess the oxidative stress status of patients, while white blood cell (WBC), C-reactive protein (CRP) and procalcitonin (PCT) were used to reflect the inflammatory status of patients.
(5) Quality of life and symptom indicators: The quality of life and respiratory
symptoms of patients were evaluated by using the 6-minute walk distance (6MWD)
test, modified British Medical Research Council (mMRC) dyspnea scale, and World
Health Organization Quality of Life-Brief (WHOQOL-BREF) version . The 6MWD refers
to the maximum distance a patient can complete by walking at the fastest possible
speed on flat ground for six minutes, reflecting the cardiopulmonary function and
the overall functional status of patients [21]. The mMRC dyspnea scale is mainly
utilized to assess the degree of dyspnea in patients with chronic respiratory
diseases, especially COPD. The mMRC scale has five grades, ranging from 0 to 4,
with grades
To mitigate potential selection bias and balance baseline characteristics between the experimental group and the control group, propensity score matching (PSM) was employed to generate matched datasets. The specific procedure was as follows:
(1) Estimation of propensity scores: A propensity score for each patient, defined as the conditional probability of receiving the comprehensive intervention (nutritional support + respiratory training) given the observed baseline covariates, was estimated using a non-parsimonious logistic regression model. The covariates included in the model were age, gender, BMI, disease duration, history of smoking, history of malnutrition and history of pulmonary infection. These variables were selected a priori based on their potential clinical relevance to both treatment assignment and key outcomes.
(2) Matching algorithm: Patients in the experimental group were matched 1:1 to those in the control group without replacement by using the nearest-neighbor matching algorithm. To ensure high-quality matching and minimize the risk of poor matches, we adopted a caliper width of 0.2 times the standard deviation of the logarithm of the propensity score.
(3) Assessment of matching quality: To assess the quality of matching, we
calculated the standardized mean differences (SMDs) of all covariates before and
after matching. After matching, the SMDs for all covariates were substantially
reduced, with the SMD for most covariates decreased to below 10%. While an SMD
| Characteristic | Before PSM | After PSM | |||||||||
| Experimental group (n = 56) | Control group (n = 45) | t/z/ |
p-value | SMD | Experimental group (n = 44) | Control group (n = 44) | t/z/ |
p-value | SMD | ||
| Age (years), median (IQR) | 52.00 (49.25–55.00) | 53.00 (50.00–54.00) | 0.264 | 0.792 | 0.121 | 52.00 (49.25–55.00) | 53.00 (50.25–54.00) | 0.674 | 0.500 | 0.033 | |
| Gender, n (%) | 0.484 | 0.487 | 0.138 | 0.752 | 0.386 | 0.186 | |||||
| Male | 25 (44.64%) | 17 (37.78%) | 20 (45.45%) | 16 (36.36%) | |||||||
| Female | 31 (55.36%) | 28 (62.22%) | 24 (54.55%) | 28 (63.64%) | |||||||
| BMI (kg/m2), mean |
25.16 |
24.18 |
1.524 | 0.131 | 0.305 | 24.92 |
24.22 |
1.023 | 0.309 | 0.218 | |
| Disease duration (months), mean |
17.98 |
17.73 |
0.292 | 0.771 | 0.058 | 18.00 |
17.77 |
0.242 | 0.809 | 0.052 | |
| History of smoking, n (%) | 4.389 | 0.036 | 0.426 | 2.285 | 0.131 | 0.326 | |||||
| No | 40 (71.43%) | 23 (51.11%) | 29 (65.91%) | 22 (50.00%) | |||||||
| Yes | 16 (28.57%) | 22 (48.89%) | 15 (34.09%) | 22 (50.00%) | |||||||
| History of pulmonary infection, n (%) | 4.137 | 0.042 | 0.418 | 1.186 | 0.276 | 0.234 | |||||
| No | 26 (46.43%) | 30 (66.67%) | 24 (54.55%) | 29 (65.91%) | |||||||
| Yes | 30 (53.57%) | 15 (33.33%) | 20 (45.45%) | 15 (34.09%) | |||||||
| History of malnutrition, n (%) | 0.228 | 0.633 | 0.095 | 0.080 | 0.777 | 0.061 | |||||
| No | 48 (85.71%) | 37 (82.22%) | 37 (84.09%) | 36 (81.82%) | |||||||
| Yes | 8 (14.29%) | 8 (17.78%) | 7 (15.91%) | 8 (18.18%) | |||||||
Abbreviations: BMI, body mass index; IQR, interquartile range; OB, obliterative bronchiolitis; PSM, propensity score matching; SD, standard deviation; SMD, standardized mean difference.
(4) Outcome analysis: All subsequent comparative analyses of primary and secondary outcomes, as well as multiple linear regression analyses, were conducted exclusively on this propensity score-matched cohort.
Since this is a retrospective study that consecutively enrolled eligible
patients during the study period, a prospective sample size calculation was not
performed. The final sample size was determined by the available patient
population that met the inclusion and exclusion criteria between January 2022 and
March 2025. Furthermore, we conducted a post-hoc power analysis for the primary
outcomes of FEV1 and FVC using G*Power software 3.1.9.7
(HeinrichHeineUniversität Düsseldorf, North RhineWestphalia, Germany).
Based on the observed effect sizes (Cohen’s d) from our matched cohort for the
intergroup comparison of post-intervention values (d = 0.67 for FEV1, and d
= 0.81 for FVC), a sample size of 44 per group provides a statistical power
(1-
According to the data distribution, categorical variables are expressed as
frequencies and percentages. Continuous variables were tested for normality using
the Shapiro-Wilk test. Normally distributed data are expressed as means and
standard deviation (SD), while those that did not conform to the normal
distribution are expressed as medians and interquartile range (IQR). Intergroup
comparisons were performed using Student’s t-test or Mann-Whitney
U test for continuous variables, whereas categorical variables were
compared using the Pearson’s chi-square test or the continuity-corrected
chi-square test. Intragroup comparisons of continuous variables were conducted
using paired t-test or Wilcoxon signed-rank test. Intragroup comparisons
of binary categorical variables were conducted using McNemar test. Multiple
linear regression analysis was performed to determine the independent influencing
factors of the changes in several key pulmonary function indicators, such as
FEV1, FVC and FEV1/FVC, before and after intervention. Assumptions of
linearity, independence of residuals, and homoscedasticity were examined.
Multicollinearity was assessed using tolerance and the variance inflation factor (VIF),
with a tolerance
A total of 101 patients with OB who underwent intervention were included and
were allocated into the experimental group (n = 56) and
the control group (n = 45) according to
the intervention type. As shown in Table 1, there were significant differences in
smoking history (p = 0.036) and the medical history of pulmonary
infection (p = 0.042) between the two groups of patients, but no
statistical differences in age, gender, BMI, disease duration, or history of
malnutrition were detected (all p
In the matched cohort, no statistically significant differences were found in
any pulmonary function indicators between the two groups of patients before the
intervention (all p
| Variables | Experimental group (n = 44) | Control group (n = 44) | t/z | p-value | |
| Before intervention | |||||
| FEV1 (L) | 1.04 |
1.04 |
0.119 | 0.906 | |
| FVC (L) | 1.76 |
1.87 |
1.869 | 0.065 | |
| FEV1/FVC | 58.76 (45.80–75.57) | 53.12 (43.62–72.06) | 0.901 | 0.367 | |
| PEF (L/min) | 154.16 |
157.02 |
0.731 | 0.467 | |
| MVV (L/min) | 39.43 |
38.57 |
0.438 | 0.663 | |
| After intervention | |||||
| FEV1 (L) | 1.55 |
1.37 |
3.125 | 0.002 | |
| FVC (L) | 2.34 |
2.12 |
3.811 | ||
| FEV1/FVC | 67.86 (56.29–77.30)* | 65.29 (55.74–77.60)* | 0.626 | 0.531 | |
| PEF (L/min) | 191.57 |
185.47 |
1.186 | 0.239 | |
| MVV (L/min) | 54.33 |
49.79 |
1.961 | 0.053 | |
*p
Abbreviations: FEV1, forced expiratory volume in the first second; FVC, forced vital capacity; MVV, maximal voluntary ventilation; PEF, peak expiratory flow.
Both before and after the intervention, there were no statistically significant
differences between the two patient groups in nutritional indicators such as BMI,
ALB and NRS-2002 scores (all p
| Variables | Experimental group (n = 44) | Control group (n = 44) | t/z/ |
p-value | ||
| Before intervention | ||||||
| BMI (kg/m2) | 24.92 |
24.22 |
1.023 | 0.309 | ||
| ALB (g/L) | 39.80 (35.93–43.85) | 39.55 (36.58–42.83) | 0.138 | 0.890 | ||
| NRS-2002 scores | 0.448 | 0.503 | ||||
| 27 (61.36%) | 30 (68.18%) | |||||
| 17 (38.64%) | 14 (31.82%) | |||||
| After intervention | ||||||
| BMI (kg/m2) | 24.93 |
24.24 |
1.015 | 0.313 | ||
| ALB (g/L) | 40.10 (36.93–42.85) | 39.65 (37.58–41.83) | 0.250 | 0.802 | ||
| NRS-2002 scores | 1.544 | 0.214 | ||||
| 40 (90.91%) | 36 (81.82%) | |||||
| 4 (9.09%)* | 8 (18.18%) | |||||
*p
Abbreviations: ALB, albumin; BMI, body mass index; NRS, nutritional risk screening.
Regarding the oxidative stress and inflammatory indicators, the between-group
comparisons revealed statistically significant differences in SOD (p =
0.017) before the intervention, as well as MDA (p
| Variables | Experimental group (n = 44) | Control group (n = 44) | t/z | p-value | |
| Before intervention | |||||
| SOD (U/mL) | 1274.74 |
1130.55 |
2.432 | 0.017 | |
| MDA (µmol/L) | 10.15 (8.97–10.60) | 10.05 (9.05–10.41) | 0.492 | 0.622 | |
| WBC (109/L) | 6.65 (5.70–8.59) | 6.81 (5.40–10.09) | 0.284 | 0.777 | |
| CRP (mg/L) | 26.71 (16.26–37.72) | 26.70 (14.70–33.33) | 0.275 | 0.783 | |
| PCT (ng/mL) | 3.23 (1.92–3.76) | 3.42 (2.15–4.10) | 0.764 | 0.445 | |
| After intervention | |||||
| SOD (U/mL) | 1568.25 |
1441.96 |
1.608 | 0.111 | |
| MDA (µmol/L) | 6.20 (5.52–7.60)* | 8.15 (6.80–9.94)* | 4.482 | ||
| WBC (109/L) | 6.55 (5.60–8.49)* | 6.71 (5.30–9.45)* | 0.284 | 0.777 | |
| CRP (mg/L) | 12.96 (10.58–17.16)* | 19.26 (11.75–26.71)* | 2.779 | 0.005 | |
| PCT (ng/mL) | 1.11 (0.57–1.50)* | 1.60 (1.33–1.91)* | 4.686 | ||
*p
Abbreviations: CRP, C-reactive protein; MDA, malondialdehyde; PCT, procalcitonin; SOD, superoxide dismutase; WBC, white blood cell.
As for the quality of life and symptom indicators, there were significant
differences between the two groups of patients in terms of 6MWD (p
| Variables | Experimental group (n = 44) | Control group (n = 44) | t/z/ |
p-value | ||
| Before intervention | ||||||
| 6MWD (m) | 429.00 (405.75–454.75) | 471.50 (443.00–497.25) | 4.165 | |||
| WHOQOL-BREF | 66.61 |
78.75 |
9.832 | |||
| mMRC | 0.000 | 1.000 | ||||
| 0–1 | 3 (6.82%) | 3 (6.82%) | ||||
| 41 (93.18%) | 41 (93.18%) | |||||
| After intervention | ||||||
| 6MWD (m) | 485.00 (460.75–509.75)* | 481.50 (453.00–507.25)* | 0.776 | 0.438 | ||
| WHOQOL-BREF | 80.95 |
79.75 |
1.028 | 0.307 | ||
| mMRC | 7.639 | 0.006 | ||||
| 0–1 | 41 (93.18%) | 31 (70.45%) | ||||
| 3 (6.82%)* | 13 (29.55%)* | |||||
*p
Abbreviations: mMRC, modified British Medical Research Council; 6MWD, 6-minute walk distance; WHOQOL-BREF, World Health Organization Quality of Life-Brief.
Multiple linear regression analyses were conducted on the changes in FEV1,
FVC, and FEV1/FVC (
| Variables | B value (SE) | 95% CI | t | p-value | Tolerance | VIF | |
| Age (years) | 0.013 (0.007) | [−0.001, 0.026] | 0.155 | 1.823 | 0.072 | 0.820 | 1.220 |
| Gender (Male vs. Female) | –0.079 (0.061) | [–0.201, 0.043] | −0.115 | −1.285 | 0.203 | 0.736 | 1.359 |
| Disease duration (months) | –0.020 (0.006) | [−0.032, −0.007] | −0.252 | −3.115 | 0.003 | 0.930 | 1.107 |
| History of smoking (Yes vs. No) | 0.107 (0.077) | [−0.047, −0.260] | 0.156 | 1.379 | 0.172 | 0.462 | 2.165 |
| History of pulmonary infection (Yes vs. No) | 0.044 (0.060) | [−0.076, 0.164] | 0.063 | 0.727 | 0.470 | 0.775 | 1.291 |
| History of malnutrition (Yes vs. No) | 0.213 (0.097) | [0.021, 0.406] | 0.238 | 2.210 | 0.030 | 0.510 | 1.963 |
| BMI (kg/m2) | 0.012 (0.011) | [−0.010, 0.033] | 0.112 | 1.094 | 0.277 | 0.562 | 1.778 |
| ALB (g/L) | 0.001 (0.007) | [−0.012, 0.015] | 0.021 | 0.226 | 0.822 | 0.650 | 1.537 |
| Intervention methods (Comprehensive intervention vs. Nutritional support) | 0.179 (0.055) | [0.071, 0.288] | 0.265 | 3.285 | 0.002 | 0.904 | 1.106 |
| Baseline FEV1 | −0.683 (0.167) | [−1.016, −0.350] | −0.467 | −4.082 | 0.451 | 2.219 |
Model summary information: R2 = 0.546, Adjusted R2 = 0.487, F = 9.273,
p
Abbreviations: ALB, albumin; BMI, body mass index; CI, confidence interval; FEV1, forced expiratory volume in the first second; SE, standard error; VIF, variance inflation factor.
| Variables | B value (SE) | 95% CI | t | p-value | Tolerance | VIF | |
| Age (years) | 0.004 (0.008) | [−0.012, 0.021] | 0.041 | 0.532 | 0.596 | 0.806 | 1.240 |
| Gender (Male vs. Female) | −0.022 (0.070) | [−0.161, 0.117] | −0.024 | −0.312 | 0.756 | 0.774 | 1.291 |
| Disease duration (months) | 0.003 (0.007) | [−0.012, 0.018] | 0.032 | 0.436 | 0.664 | 0.879 | 1.138 |
| History of smoking (Yes vs. No) | 0.002 (0.079) | [−0.156, 0.160] | 0.002 | 0.024 | 0.981 | 0.592 | 1.688 |
| History of pulmonary infection (Yes vs. No) | 0.014 (0.070) | [−0.127, 0.154] | 0.015 | 0.194 | 0.847 | 0.767 | 1.304 |
| History of malnutrition (Yes vs. No) | [−0.228, 0.227] | −0.003 | 0.998 | 0.494 | 2.024 | ||
| BMI (kg/m2) | −0.006 (0.013) | [−0.031, 0.019] | −0.042 | −0.452 | 0.652 | 0.556 | 1.799 |
| ALB (g/L) | −0.001 (0.007) | [−0.016, 0.013] | −0.015 | −0.180 | 0.858 | 0.702 | 1.424 |
| Intervention methods (Comprehensive intervention vs. Nutritional support) | 0.215 (0.063) | [0.090, 0.341] | 0.246 | 3.424 | 0.001 | 0.921 | 1.086 |
| Baseline FVC | −1.038 (0.139) | [−1.315, −0.762] | −0.692 | −7.480 | 0.556 | 1.800 |
Model summary information: R2 = 0.634, Adjusted R2 = 0.586, F =
13.316, p
Abbreviations: ALB, albumin; BMI, body mass index; CI, confidence interval; FVC, forced vital capacity; SE, standard error; VIF, variance inflation factor.
| Variables | B value (SE) | 95% CI | t | p-value | Tolerance | VIF | |
| Age (years) | 0.292 (0.408) | [−0.521, 1.104] | 0.053 | 0.715 | 0.477 | 0.825 | 1.212 |
| Gender (Male vs. Female) | −3.928 (3.796) | [−11.486, 3.631] | −0.084 | −1.035 | 0.304 | 0.674 | 1.484 |
| Disease duration (months) | −0.961 (0.373) | [−1.705, −0.218] | −0.182 | −2.574 | 0.012 | 0.889 | 1.125 |
| History of smoking (Yes vs. No) | 3.214 (5.447) | [−7.632, 14.061] | 0.069 | 0.590 | 0.557 | 0.325 | 3.080 |
| History of pulmonary infection (Yes vs. No) | 0.731 (3.538) | [−6.315, 7.776] | 0.016 | 0.206 | 0.837 | 0.783 | 1.277 |
| History of malnutrition (Yes vs. No) | 8.346 (5.648) | [−2.901, 19.592] | 0.137 | 1.478 | 0.144 | 0.520 | 1.921 |
| BMI (kg/m2) | 0.600 (0.633) | [−0.661, 1.862] | 0.084 | 0.947 | 0.346 | 0.564 | 1.775 |
| ALB (g/L) | −0.053 (0.375) | [−0.799, 0.693] | −0.011 | −0.143 | 0.887 | 0.699 | 1.431 |
| Intervention methods (Comprehensive intervention vs. Nutritional support) | 1.895 (3.203) | [−4.483, 8.272] | 0.041 | 0.592 | 0.556 | 0.915 | 1.092 |
| Baseline FEV1/FVC | −0.915 (0.149) | [−1.212, −0.618] | −0.726 | −6.132 | 0.318 | 3.140 |
Model summary information: R2 = 0.656, Adjusted R2 = 0.611, F =
14.690, p
Abbreviations: ALB, albumin; BMI, body mass index; CI, confidence interval; FEV1, forced expiratory volume in the first second; FVC, forced vital capacity; SE, standard error; VIF, variance inflation factor.
In this propensity score-matched retrospective study, we found that comprehensive intervention program integrating individualized nutritional support with structured respiratory training demonstrated significant clinical benefits in patients with OB compared with nutritional support alone. Specifically, the experimental group showed statistically significant improvements in FEV1 and FVC compared with the control group, with multiple linear regression analysis confirming that comprehensive intervention was an independent factor contributing to the improvements in these two pulmonary function indicators. Furthermore, the experimental group also exhibited lower post-intervention MDA, CRP, and PCT levels, indicating a greater ability of comprehensive intervention to mitigate systemic inflammation and oxidative damage compared with nutritional support alone. Notably, while the comprehensive intervention resulted in a significant reduction in nutritional risk (NRS-2002), nutritional parameters such as BMI and ALB did not demonstrate significant within-group improvements in either patient’s group, suggesting that the observed clinical benefits may be mediated by mechanisms beyond mere weight gain. In addition, the significant improvements in indicators like 6WMD, mMRC and WHOQOL-BREF in the experimental group further demonstrate the important role of comprehensive intervention in improving exercise tolerance, dyspnea symptoms, and quality of life. To the best of our knowledge, this is the first study to investigate the clinical efficacy of a comprehensive intervention combining nutritional support with respiratory training in patients with OB, providing important insights into intervention strategies and research directions in the clinical management of OB patients.
Our findings are consistent with—and extend—the results of previous studies
on nutritional support and pulmonary rehabilitation in chronic lung diseases. A
systematic review of nutritional interventions in COPD patients showed that
nutritional support can improve anthropometric measures and muscle strength,
though its effects on pulmonary function are limited when used alone [25],
consistent with our observation that patients receiving nutritional support alone
did not show significant improvements in nutritional indicators and pulmonary
function. In contrast, our research demonstrates that combining nutritional
support with respiratory training yields superior outcomes, especially in terms
of pulmonary function parameters such as FEV1 and FVC. Notably, previous
studies on pulmonary rehabilitation in COPD patients have reported inconsistent
effects on systemic inflammation, with some studies showing no significant
changes in inflammatory markers after high-intensity pulmonary rehabilitation
[26]. However, our study found significant reductions in CRP and PCT in the
experimental group, which might be attributed to the synergistic effect of
nutritional support and respiratory training in addressing the specific
pathological features of OB. In this study, baseline PCT levels of the patients
were generally above the normal range (
The superior efficacy of comprehensive intervention observed in this research can be explained by several complementary mechanisms. Nutritional support may provide the necessary foundation for respiratory muscle function and immune regulation. Adequate protein intake is essential for maintaining the quality and strength of respiratory muscles, while micronutrients such as zinc, vitamin D, and selenium can enhance immune function and reduce the risk of respiratory infections [30]. This is also supported by the improvement of NRS-2002 in our experimental group, indicating a reduction in nutritional risk for the patients. It is noteworthy that within the patient group receiving comprehensive intervention, significant improvement was only observed in the NRS-2002 score, but not in objective measures such as BMI and ALB. This can be explained by the composite nature of the NRS-2002, which incorporates not only nutritional status but also disease severity. The significant improvements in respiratory function, exercise capacity (6MWD), and dyspnea (mMRC) achieved through respiratory training would directly lower the ‘disease severity’ component of the NRS-2002, thereby reducing the total score. In contrast, BMI and ALB—being less sensitive to short-term functional changes—tend to respond more slowly. Furthermore, in patients without severe baseline malnutrition, the primary role of nutritional support may shift from driving significant anabolic gains to preventing catabolism and supporting the increased metabolic demands of exercise, an effect that may not be fully captured by static measures like BMI and ALB over 12 weeks. On the other hand, respiratory training can enhance the endurance and efficiency of respiratory muscles. Diaphragmatic breathing and inspiratory muscle training can enhance ventilation capacity and oxygen utilization [31], which may explain the significant improvements in FEV1 and FVC observed in our study. Meanwhile, the improvement of respiratory muscle strength and endurance can better overcome the increased airway resistance in OB patients, thereby reducing dynamic hyperinflation and subjective dyspnea (as shown in the improvement of mMRC score results) [3]. In addition, respiratory training can regulate the inflammatory response by increasing lymphatic drainage and improving systemic circulation, which helps to suppress inflammation [32]. The synergistic effect of nutritional support and respiratory training is particularly noteworthy. Nutritional support provides the essential substrates for muscle repair and function, while respiratory training enhances nutrient utilization and promotes physiological adaptation, thereby improving pulmonary function. This might explain why comprehensive intervention yields superior outcomes compared with nutritional support alone. Furthermore, the observed pattern of pulmonary function response is consistent with the pathophysiology of OB. Significant improvements in FVC and FEV1 occurred without a corresponding change in the FEV1/FVC ratio, reflecting the characteristic fixed airflow limitation of OB. This suggests that while comprehensive intervention can enhance respiratory muscle function and lung volumes, it cannot reverse the underlying structural narrowing of the small airways. Similarly, the PEF and MVV remained largely unaltered following the intervention, indicating their dependence on both respiratory muscle strength and the fixed airway obstruction characteristic of OB.
This study provides important clinical insights into the management of OB
patients. Based on the research results, we recommend incorporating nutritional
support combined with respiratory training into the standardized treatment plan
for OB patients. Specifically, for patients with high nutritional risk reflected
by NRS-2002 score
This study has several limitations that should be considered when interpreting the results. First, the retrospective design and single-center data of this study may introduce selection bias. To address this, we employed PSM to balance key baseline characteristics. While PSM significantly improved the comparability of the groups, as evidenced by the substantial reduction in SMDs for all covariates and the absence of statistically significant differences in the matched cohort, a degree of residual imbalance persisted for some variables (such as BMI, history of smoking, and history of pulmonary infection). Although an SMD below 0.2 is generally considered acceptable and the observed residual imbalances are unlikely to fully account for the magnitude of the intervention effects we observed, they nonetheless represent a potential source of confounding that should be acknowledged. Second, this study has a limited sample size. Although post-hoc analysis indicated that the matched cohort (44 pairs) provided adequate power (89.5% and 98.5%) to detect the significant differences observed in FEV1 and FVC, the sample size may still be insufficient to detect smaller effect sizes for other outcomes. This is a plausible explanation for the lack of statistically significant differences in certain parameters, such as the FEV1/FVC ratio and MVV. These non-significant findings should therefore be interpreted with caution. Third, due to the retrospective design, we were unable to obtain and account for the precise dosage and duration of glucocorticoid use prior to the intervention, which could represent a potential unmeasured confounder. However, we employed PSM on key clinical variables to minimize baseline differences, and all patients received guideline-based standard care, which can, to some extent, mitigate major disparities in background treatment. Furthermore, without monitoring the intervention compliance among the patients, the study was unable to analyze the impact of compliance differences on outcomes, which is crucial in nutrition and exercise intervention research. Finally, due to the lack of long-term follow-up data, we were also unable to assess the sustained effect of comprehensive intervention, especially for OB as a chronic progressive disease, whose advantages in long-term prognosis still need to be verified. Therefore, future research should include multicenter prospective randomized controlled trials to assess the efficacy of this comprehensive intervention framework across diverse clinical settings and populations, incorporating wearable devices to monitor exercise adherence. Additionally, extended follow-up periods are needed to clarify the impact of comprehensive intervention on the long-term prognosis of OB patients.
Compared with nutritional support alone, comprehensive intervention combining nutritional support with respiratory training provides greater improvements in pulmonary function, oxidative stress, inflammatory status, quality of life, and respiratory symptoms in patients with OB. Our findings provide new evidence for non-pharmacological interventions in the clinical management of OB patients, but larger-scale prospective randomized controlled trials are warranted for validation.
• Both comprehensive intervention and nutritional support alone can significantly improve the pulmonary function, oxidative stress, inflammatory status, quality of life, and respiratory symptoms of obliterative bronchiolitis (OB) patients.
• Compared with nutritional support alone, comprehensive intervention has greater advantages in improving FEV1, FVC, MDA, CRP, PCT, 6MWD, mMRC and WHOQOL-BREF in OB patients.
• Among the nutritional indicators analyzed, significant improvement was only observed in the NRS-2002 scores of OB patients receiving comprehensive intervention.
• Compared with nutritional support alone, comprehensive intervention was an independent factor associated with greater improvements in FEV1 and FVC.
All data included in this study are available from the corresponding author upon reasonable request.
YXC and XYY designed this research program. XTH, YC, and DQ collected and analyzed the data. YXC drafted the initial manuscript. All authors contributed to the critical revision of the manuscript for important intellectual content. All authors read and approved the final manuscript. All authors have participated sufficiently in the work and agreed to be accountable for all aspects of the work.
The study protocol was reviewed and approved by the Ethics Committee of The Fourth Affiliated Hospital of Soochow University (Suzhou Dushu Lake Hospital) (Approval No.2025-251266). Written informed consent was obtained from all participants and their legal guardians. All procedures were conducted in accordance with the ethical principles outlined in the Declaration of Helsinki.
Not applicable.
This research received no external funding.
The authors declare no conflict of interest.
References
Publisher’s Note: IMR Press stays neutral with regard to jurisdictional claims in published maps and institutional affiliations.