


 , Qingqing He 2,*
1 School of Clinical Medicine, Shandong First Medical University & Shandong Academy of Medical Sciences, 250117 Jinan, Shandong, China
2 Department of Thyroid and Breast Surgery, The 960th Hospital of the PLA Joint Logistics Support Force, 250031 Jinan, Shandong, China
3 School of Clinical Medicine, Shandong University of Traditional Chinese Medicine, 250355 Jinan, Shandong, China
Abstract
Severe hypocalcemia (SH) is a common and serious complication after parathyroidectomy (PTX) in patients with secondary hyperparathyroidism (SHPT). However, accurately predicting high-risk patients remains challenging. This study aimed to develop and validate a linear predictive model to identify these patients preoperatively.
From January 2013 to May 2025, 755 total parathyroidectomy (TPTX) or TPTX with autotransplantation (TPTX-AT) were performed by a single surgical team at the 960th Hospital of the PLA Joint Logistics Support Force. After applying inclusion and exclusion criteria, 685 patients were enrolled and randomly divided (7:3) into training and validation cohorts. Variables associated with serum calcium levels on the first postoperative day (POD1 Ca) were identified through linear regression analysis in the training cohort. Model validity was assessed using ten-fold and leave-one-out cross-validation. Bland-Altman plots and paired t-tests evaluated agreement within groups. Model performance in the validation cohort was measured using bias, precision, and accuracy metrics.
Significant predictors of POD1 Ca included TPTX-AT (β [95% confidence interval (CI)]: –0.055 [–0.119, –0.001]), parathyroid hormone (PTH) (–0.078 [–0.115, –0.041], ng/mL), C-terminal cross-linked telopeptide of type I collagen (CTX) (–0.147 [–0.198, –0.096], μg/L), preoperative serum calcium (0.626 [0.516, 0.736], mmol/L), and alkaline phosphatase (ALP) (–0.018 [–0.024, –0.012], μkat/L). Bland-Altman analysis showed good agreement in the validation cohort (bias <0.001, 95% limits of agreement [LoA]: –0.507, 0.566).
The nomogram provides an accurate, individualized prediction of postoperative hypocalcemia risk after parathyroidectomy, supporting tailored clinical management of SHPT patients.
Keywords
- parathyroidectomy
- secondary hyperparathyroidism
- hypocalcemia
- nomogram
Secondary hyperparathyroidism (SHPT), a common complication of end-stage renal
disease, promotes high-turnover bone disease and extensive vascular
calcification, thereby substantially increasing mortality risk [1, 2, 3].
Parathyroidectomy (PTX) is the definitive treatment for medically refractory
cases, as it effectively normalizes biochemical parameters and alleviates
symptoms [4]. Although PTX corrects hyperparathyroidism, the abrupt withdrawal of
parathyroid hormone (PTH) often induces severe hypocalcemia (SH), defined by a
serum calcium level
Despite the high incidence of postoperative hypocalcemia, its severity cannot be reliably predicted preoperatively at the individual level. Although previous studies have associated preoperative PTH, alkaline phosphatase (ALP), and serum calcium levels with hypocalcemia risk, their predictive performance remains inconsistent across the literature [7, 8]. Additionally, the contribution of specific bone turnover markers, which directly reflect underlying bone pathology, has not been fully incorporated into comprehensive predictive models. For example, a model integrating a sensitive bone formation marker such as procollagen type I N-terminal propeptide (PINP), with a specific bone resorption marker, such as C-terminal cross-linked telopeptide of type I collagen (CTX), may improve prediction of postoperative calcium decline severity. These preoperative markers may capture the extent of uncoupling between bone formation and resorption, a key mechanism in the development of hungry bone syndrome.
This study aimed to develop and validate a linear predictive model for SH on the first postoperative day in SHPT patients undergoing PTX. A clinically applicable nomogram was developed for risk stratification, personalized perioperative care, and prevention of SH-related complications.
This retrospective study reviewed hospital records of SHPT patients who
underwent PTX between January 2013 and May 2025. Dialysis patients meeting
surgical indications and with complete clinical data were included. Inclusion
criteria were: (1) regular dialysis at least twice weekly for more than 3 months;
(2) fulfillment of at least one PTX indication, including: (a) PTH
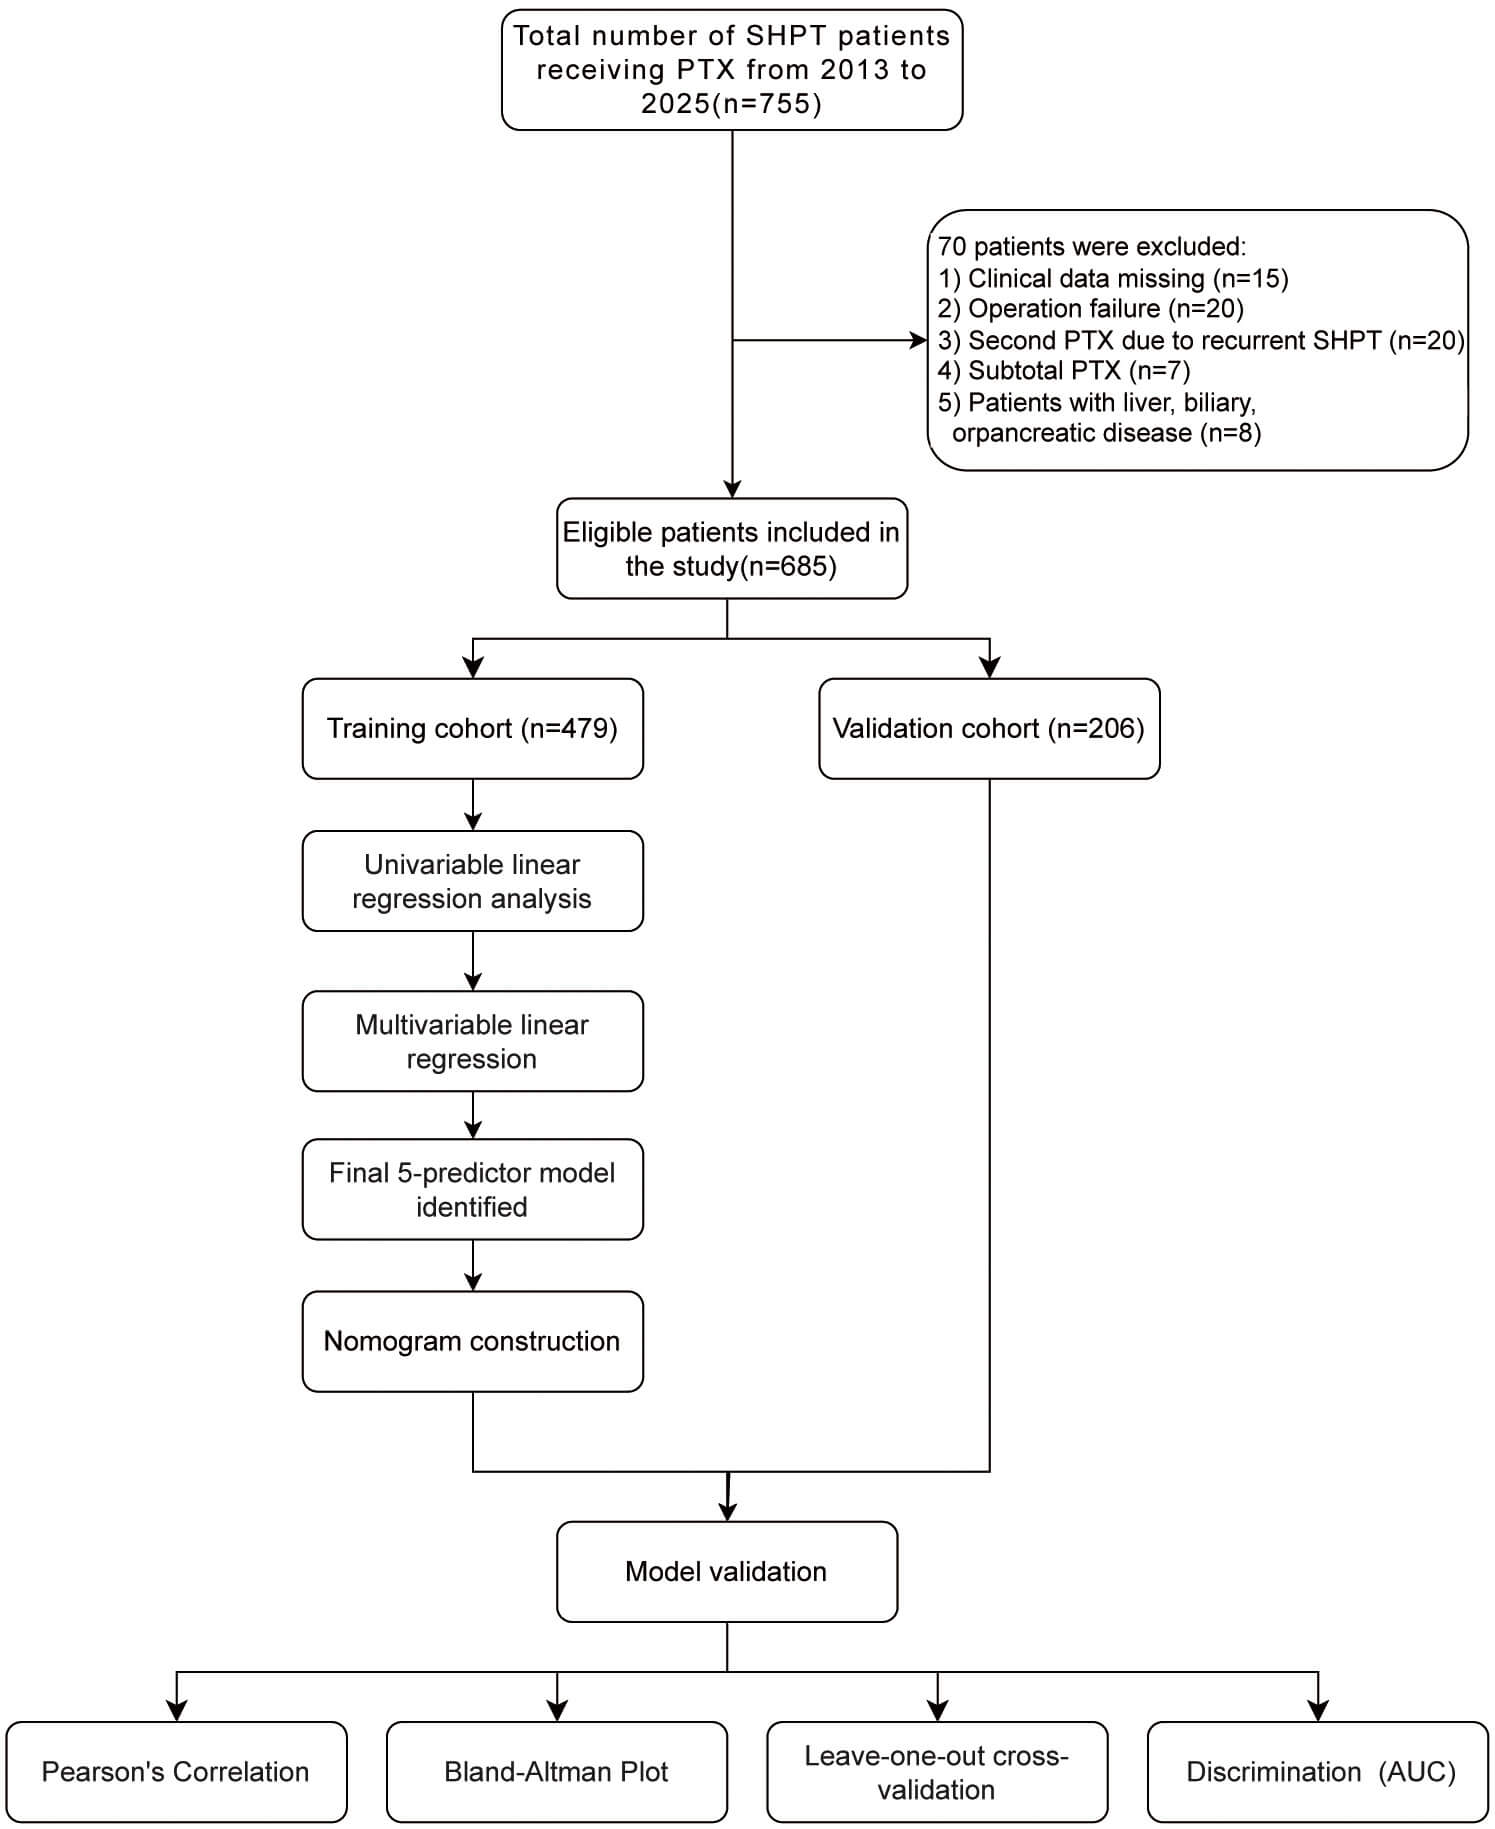 Fig. 1.
The flow chart of patients’ selection and the flow chart for the development, evaluation and explanation of models. SHPT, secondary hyperparathyroidism; PTX, parathyroidectomy; AUC, area under the curve.
Patients data were retrospectively collected and analyzed, including the following variables:
(1) Preoperative data: age, gender, body mass index (BMI), dialysis modality and duration, clinical symptoms (pruritus, skeletal deformity, bone pain, height loss), medications used within six months before surgery, smoking and alcohol history, underlying diseases, comorbidities, and laboratory results (serum PTH, calcium, phosphate, potassium, ALP, complete blood count, albumin, globulin, total protein, creatinine, blood urea nitrogen, fibrinogen, procollagen type I N-terminal propeptide (PINP), osteocalcin (OST), C-terminal cross-linked telopeptide of type I collagen (CTX), and 25-hydroxyvitamin D [25(OH)D]), along with the number of parathyroid glands identified using US and 99mTc-MIBI imaging.
(2) Intraoperative data: excised tissue volume, operative procedures, intraoperative PTH (ioPTH) levels at 10 and 20 min, and number of resected parathyroid glands.
(3) Postoperative data: histopathology, short-term complications, and serum PTH and calcium levels on the first postoperative day.
Since PINP and CTX frequently exceeded measurement limits in SHPT patients,
these markers were classified as measurable (below the upper measurement limit) or supernormal
(PINP
Sample size was calculated based on two subjects per variable per regression coefficient, an established statistical approach [11]. Additionally, the four-step procedure outlined by Riley et al. [12] was employed to determine the required sample size. Detailed calculations and results are provided in Supplementary Table 1.
Patients underwent dialysis the day before surgery. Both preoperative and first
postoperative dialysis sessions were performed without heparin. Preoperative
localization relied on US and 99mTc-MIBI. Surgical treatment included either
total parathyroidectomy (TPTX) or TPTX with autotransplantation (TPTX-AT). The
surgical team determined the procedure intraoperatively. TPTX-AT was performed if
a gland appeared morphologically less hyperplastic or significantly smaller than
the others. The most normal-appearing or smallest gland was selected, cut into
5–30 particles (approximately 1 mm diameter), and implanted into the
sternocleidomastoid muscle [4]. Pathological examination confirmed diagnosis
after complete gland removal. Intraoperative PTX levels were measured at 10- and
20-min. Surgical success was defined as resection of two or more glands
accompanied by either an 80% reduction in ioPTH or serum PTH
The dataset was divided into training and validation cohorts using a standard
7:3 ratio, consistent with previous studies demonstrating optimal performance
with 70–80% training data. A linear regression model was developed to predict
continuous values of serum calcium levels on the first postoperative day (POD1
Ca), preserving statistical power compared to a binary outcome model. Univariable
and multivariable linear regression analyses were performed to identify variables
associated with POD1 Ca levels. Independent predictors for POD1 Ca were
identified using the training cohort. Initially, all variables with p
The multivariable model from the training cohort was applied to predict POD1 Ca in the validation cohort. Multiple methods assessed discrimination, calibration, and accuracy in the validation set, we used multiple methods to assess its discrimination, calibration and accuracy. First, Pearson correlation, paired t-tests, and Bland-Altman plots evaluated agreement between predicted and observed values. Internal validation was conducted using ten-fold and leave-one-out cross-validation. Second, predictive accuracy was measured using precision (interquartile range of prediction errors) and the percentages of predictions within 15% (P15), 30% (P30), and 50% (P50) of measured values [14]. Additionally, the predicted POD1 Ca level was used to calculate the area under the curve (AUC) for discriminating between hypocalcemia and normal calcium levels, with 95% confidence intervals (CIs). The model was developed and reported according to the Transparent Reporting of a Multivariable Prediction Model for Individual Prognosis or Diagnosis (TRIPOD) checklist (Supplementary Table 2) [15].
Statistical analyses were performed using SPSS version 27 (IBM, Chicago, IL,
USA) and R software 4.4.2 (R Foundation for Statistical Computing, Vienna,
Austria). Missing data can significantly affect data validity and reduce sample
size analyses are performed [16]. For covariates with missing values less than 20%
(Supplementary Table 3, Supplementary Fig. 1), multiple
imputation was conducted via regression models using the R package mice (version
3.17.0; Stef van Buuren, TNO, The Netherlands). Normality continuous variables
were assessed using the Shapiro-Wilk test. Normally distributed continuous
variables are expressed as mean
A total of 755 patients were enrolled initially, with 685 patients meeting
inclusion criteria. Patients were randomly divided (7:3 ratio) into training (n =
479) and validation (n = 206) cohorts. No statistically significant differences
in baseline characteristics existed between the cohorts (p
| Predictive factors | Training cohort (n = 479) | Validation cohort (n = 206) | Statistic ( |
p | |
| Age, yr (IQR) | 48 (39; 55) | 47.5 (38; 55) | –0.622 | 0.534 | |
| Gender (n%) | 0.066 | 0.798 | |||
| Male | 291 (60.752%) | 123 (59.709%) | |||
| Female | 188 (39.248%) | 83 (40.291%) | |||
| BMI (kg/m2) | 22.490 (20.455; 25.000) | 23.065 (20.295; 25.055) | 0.344 | 0.731 | |
| Dialysis, yr | Fisher | 1.000 | |||
| HD | 465 (97.077%) | 201 (97.573%) | |||
| PD | 9 (1.879%) | 3 (1.456%) | |||
| Both | 5 (1.044%) | 2 (0.971%) | |||
| Dialysis time, yr | 7 (5; 9) | 7 (5; 9) | 0.559 | 0.574 | |
| Pruritus | 0.627 | 0.428 | |||
| No | 233 (48.643%) | 107 (51.942%) | |||
| Yes | 246 (51.357%) | 99 (48.058%) | |||
| Skeletal deformity | 0.061 | 0.806 | |||
| No | 456 (95.198%) | 197 (95.631%) | |||
| Yes | 23 (4.802%) | 9 (4.369%) | |||
| Height loss | 1.490 | 0.222 | |||
| No | 341 (71.190%) | 156 (75.728%) | |||
| Yes | 138 (28.810%) | 50 (24.272%) | |||
| Bone pain | 0.388 | 0.544 | |||
| No | 46 (9.603%) | 23 (11.165%) | |||
| Yes | 433 (90.397%) | 183 (88.835%) | |||
| Cinacalcet | 2.280 | 0.131 | |||
| No | 275 (57.411%) | 131 (63.592%) | |||
| Yes | 204 (42.589%) | 75 (36.408%) | |||
| Calcitriol | 1.633 | 0.201 | |||
| No | 221 (46.138%) | 106 (51.456%) | |||
| Yes | 258 (53.862%) | 100 (48.544%) | |||
| Lanthanum carbonate | 5.076 | 0.024 | |||
| No | 347 (72.443%) | 166 (80.583%) | |||
| Yes | 132 (27.557%) | 40 (19.417%) | |||
| Sevelamer carbonate | 1.672 | 0.196 | |||
| No | 440 (91.858%) | 195 (94.660%) | |||
| Yes | 39 (8.142%) | 11 (5.340%) | |||
| Smoking history | 0.964 | 0.326 | |||
| No | 437 (91.232%) | 183 (88.835%) | |||
| Yes | 42 (8.768%) | 23 (11.165%) | |||
| Drinking history | 0.464 | 0.500 | |||
| No | 457 (95.407%) | 194 (94.175%) | |||
| Yes | 22 (4.593%) | 12 (5.825%) | |||
| Underlying diseases | Fisher | 0.757 | |||
| Glomerulonephritis | 246 (51.357%) | 107 (51.942%) | |||
| Hypertensive nephropathy | 183 (38.205%) | 82 (39.806%) | |||
| Diabetic nephropathy | 11 (2.296%) | 6 (2.913%) | |||
| Polycystic kidney | 10 (2.088%) | 2 (0.971%) | |||
| Others or unknown | 29 (6.054%) | 9 (4.369%) | |||
| Hypertension | 0.052 | 0.819 | |||
| No | 78 (16.284%) | 35 (16.990%) | |||
| Yes | 401 (83.716%) | 171 (83.010%) | |||
| Diabetes | 3.500 | 0.061 | |||
| No | 451 (94.154%) | 197 (95.631%) | |||
| Yes | 28 (5.846%) | 9 (4.369%) | |||
| CHD | 3.146 | 0.076 | |||
| No | 437 (91.232%) | 196 (95.146%) | |||
| Yes | 42 (8.768%) | 10 (4.854%) | |||
| Hb (g/L) | 112.000 (100.000; 124.000) | 113.000 (101.250; 125.750) | 0.667 | 0.505 | |
| RBC (1012/L) | 3.770 (3.410; 4.190) | 3.815 (3.458; 4.218) | 0.973 | 0.331 | |
| WBC (109/L) | 5.480 (4.540; 6.575) | 5.375 (4.650; 6.530) | 0.392 | 0.695 | |
| Neutrophil (109/L) | 3.690 (2.960; 4.670) | 3.67 (3.102; 4.568) | 0.487 | 0.626 | |
| Monocyte (109/L) | 0.360 (0.270; 0.460) | 0.360 (0.280; 0.460) | 0.537 | 0.591 | |
| Lymphocyte (109/L) | 1.110 (0.910; 1.390) | 1.130 (0.870; 1.438) | 0.099 | 0.921 | |
| PLT (109/L) | 177.000 (142.000; 215.500) | 178.500 (137.250; 227.500) | 0.194 | 0.846 | |
| Total protein (g/L) | 68.600 (63.950; 74.150) | 69.150 (64.325; 74.000) | 0.589 | 0.556 | |
| Albumin (g/L) | 39.500 (36.600; 42.900) | 40.200 (37.000; 43.200) | 1.075 | 0.283 | |
| Globulin (g/L) | 29.000 (25.950; 32.850) | 29.050 (26.700; 32.600) | 0.367 | 0.713 | |
| ALP (µkat/L) | 4.633 (2.400; 10.983) | 5.367 (2.538; 9.754) | 0.209 | 0.835 | |
| CRE (µmol/L) | 886.000 (730.000; 1045.500) | 865.50 (723.000; 1037.500) | –0.656 | 0.512 | |
| BUN (mmol/L) | 23.400 (19.100; 29.200) | 23.300 (17.925; 28.450) | –1.152 | 0.249 | |
| Serum K (mmol/L) | 5.010 (4.515; 5.585) | 5.000 (4.480; 5.498) | –0.450 | 0.653 | |
| FIB (g/L) | 3.787 (3.228; 4.362) | 3.720 (3.293; 4.261) | –0.728 | 0.466 | |
| 25(OH)D (ng/mL) | 16.340 (11.200; 25.730) | 15.695 (10.100; 21.773) | –1.845 | 0.065 | |
| Row PINP (ng/mL) | 2.316 | 0.128 | |||
| 173 (36.117%) | 62 (30.097%) | ||||
| 306 (63.883%) | 144 (69.903%) | ||||
| Row CTX (µg/L) | 1.049 | 0.306 | |||
| 232 (48.434%) | 91 (44.175%) | ||||
| 247 (51.567%) | 115 (55.825%) | ||||
| OST (µg/L) | 233.200 (185.150; 293.050) | 232.450 (182.525; 291.725) | –0.113 | 0.909 | |
| Serum calcium (mmol/L) | 2.470 (2.320; 2.590) | 2.44 (2.292; 2.590) | –0.920 | 0.358 | |
| Serum phosphorus (mmol/L) | 2.210 (1.940; 2.595) | 2.28 (1.890; 2.615) | 0.346 | 0.730 | |
| Serum PTH (ng/mL) | 1.741 (1.119; 2.494) | 1.708 (1.127; 2.328) | –0.468 | 0.640 | |
| ioPTH10 (ng/mL) | 0.286 (0.195; 0.424) | 0.286 (0.184; 0.430) | –0.125 | 0.901 | |
| ioPTH20 (ng/mL) | 0.208 (0.143; 0.292) | 0.210 (0.145; 0.288) | 0.388 | 0.698 | |
| Oral calcium | 3.570 | 0.059 | |||
| No | 12 (2.505%) | 11 (5.340%) | |||
| Yes | 467 (97.495%) | 195 (94.660%) | |||
| Operative principles | 1.408 | 0.235 | |||
| TPTX | 132 (27.557%) | 66 (32.039%) | |||
| TPTX-AT | 347 (72.443%) | 140 (67.961%) | |||
| Frequency of US | 2 (2; 3) | 2 (1; 3) | –0.507 | 0.600 | |
| Frequency of ECT | 4 (4; 4) | 4 (3; 4) | –1.796 | 0.015 | |
| Parathyroid gland volume (cm3) | 15.100 (9.700; 23.750) | 14.350 (8.900; 26.475) | –0.330 | 0.742 | |
| Calcification | 0.693 | 0.405 | |||
| No | 422 (88.100%) | 186 (90.291%) | |||
| Yes | 57 (11.900%) | 20 (9.709%) | |||
| Hemorrhagic cystic changes | Fisher | 1.000 | |||
| No | 469 (97.912%) | 202 (98.058%) | |||
| Yes | 10 (2.088%) | 4 (1.942%) | |||
| Necrosis | Fisher | 0.571 | |||
| No | 467 (97.495%) | 203 (98.544%) | |||
| Yes | 12 (2.505%) | 3 (1.456%) | |||
IQR, interquartile range; BMI, body mass index; HD, hemodialysis; PD, peritoneal dialysis; CHD, coronary heart disease; Hb, hemoglobin; RBC, red blood cell; WBC, white blood cell; PLT, platelet; ALP, alkaline phosphatase; CRE, creatinine; BUN, blood urea nitrogen; FIB, fibrinogen; 25(OH)D, 25-hydroxyvitamin D; PINP, procollagen type I N-terminal propeptide; CTX, C-terminal cross-linked telopeptide of type I collagen; OST, osteocalcin; PTH, parathyroid hormone; ioPTH, intraoperative PTH; TPTX, total parathyroidectomy; TPTX-AT, TPTX with autotransplantation; US, ultrasound; ECT, emission computed tomography; K, potassium; yr, years.
Univariable and multivariable predictors of POD1 Ca are listed in Table 2.
Initial univariable analysis identified 23 out of 51 potential factors
significantly associated with POD1 Ca. Multivariable linear regression analysis
revealed that TPTX-AT (
| Predictive factors | Univariate logistic analysis | Multivariate logistic analysis | |||
| p | p | ||||
| Age | 0.007 (0.003, 0.011) | ||||
| Gender | |||||
| Male | Ref | ||||
| Female | 0.135 (0.064, 0.206) | ||||
| BMI (kg/m2) | 0.009 (–0.001, 0.019) | 0.058 | |||
| Dialysis, yr | |||||
| HD | Ref | ||||
| PD | 0.154 (–0.103, 0.411) | 0.241 | |||
| Both | –0.132 (–0.475, 0.211) | 0.450 | |||
| Dialysis time, yr | 0.009 (–0.001, 0.019) | 0.076 | |||
| Pruritus | |||||
| No | Ref | Ref | |||
| Yes | 0.070 (0.001, 0.139) | 0.049 | –0.042 (–0.095, 0.011) | 0.119 | |
| Skeletal deformity | |||||
| No | Ref | ||||
| Yes | –0.047 (–0.210, 0.116) | 0.576 | |||
| Height loss | |||||
| No | Ref | ||||
| Yes | –0.052 (–0.128, 0.024) | 0.185 | |||
| Bone pain | |||||
| No | Ref | ||||
| Yes | 0.024 (–0.094, 0.142) | 0.691 | |||
| Cinacalcet | |||||
| No | Ref | ||||
| Yes | –0.031 (–0.102, 0.040) | 0.393 | |||
| Calcitriol | |||||
| No | Ref | ||||
| Yes | 0.098 (0.029, 0.167) | 0.006 | |||
| Lanthanum carbonate | |||||
| No | Ref | ||||
| Yes | 0.010 (–0.068, 0.088) | 0.805 | |||
| Sevelamer carbonate | |||||
| No | Ref | ||||
| Yes | 0.006 (–0.121, 0.133) | 0.926 | |||
| Smoking history | |||||
| No | Ref | ||||
| Yes | –0.127 (–0.25, –0.004) | 0.043 | |||
| Drinking history | |||||
| No | Ref | ||||
| Yes | 0.018 (–0.149, 0.185) | 0.832 | |||
| Underlying diseases | |||||
| Glomerulonephritis | Ref | ||||
| Hypertensive nephropathy | 0.042 (–0.032, 0.116) | 0.263 | |||
| Diabetic nephropathy | –0.091 (–0.324, 0.142) | 0.444 | |||
| Polycystic kidney | 0.124 (–0.121, 0.369) | 0.323 | |||
| Others or unknown | –0.169 (–0.318, –0.02) | 0.026 | |||
| Hypertension | |||||
| No | Ref | ||||
| Yes | 0.028 (–0.066, 0.122) | 0.555 | |||
| Diabetes | |||||
| No | Ref | ||||
| Yes | 0.082 (–0.067, 0.231) | 0.278 | |||
| CHD | |||||
| No | Ref | ||||
| Yes | 0.102 (–0.021, 0.225) | 0.104 | |||
| Hb (g/L) | 0.002 (0, 0.004) | 0.022 | |||
| RBC (1012/L) | 0.038 (–0.021, 0.097) | 0.204 | |||
| WBC (109/L) | 0.023 (0.005, 0.041) | 0.015 | |||
| Neutrophil (109/L) | 0.028 (0.006, 0.05) | 0.013 | |||
| Monocyte (109/L) | 0.063 (0.01, 0.116) | 0.020 | |||
| Lymphocyte (109/L) | –0.03 (–0.073, 0.013) | 0.169 | |||
| PLT (109/L) | 0 (0, 0) | 0.108 | |||
| Total protein (g/L) | 0.009 (0.005, 0.013) | ||||
| Albumin (g/L) | 0.015 (0.007, 0.023) | ||||
| Globulin (g/L) | 0.011 (0.003, 0.019) | 0.002 | 0.005 (–0.001, 0.011) | 0.057 | |
| ALP (µkat/L) | –0.028 (–0.032, –0.024) | –0.018 (–0.024, –0.012) | |||
| CRE (µmol/L) | 0 (0, 0) | 0.919 | |||
| BUN (mmol/L) | –0.002 (–0.006, 0.002) | 0.442 | |||
| Serum K (mmol/L) | 0.014 (–0.027, 0.055) | 0.519 | |||
| FIB (g/L) | –0.089 (–0.128, –0.050) | –0.031 (–0.062, 0) | 0.051 | ||
| 25(OH)D (ng/mL) | –0.001 (–0.005, 0.003) | 0.383 | |||
| Row PINP (ng/mL) | |||||
| Ref | |||||
| –0.113 (–0.186, –0.04) | 0.002 | ||||
| Row CTX (µg/L) | |||||
| Ref | Ref | ||||
| –0.164 (–0.233, –0.095) | –0.147 (–0.198, –0.096) | ||||
| OST (µg/L) | 0.002 (0.002, 0.002) | ||||
| Serum calcium (mmol/L) | 0.616 (0.479, 0.753) | 0.626 (0.516, 0.736) | |||
| Serum phosphorus (mmol/L) | 0.06 (–0.007, 0.127) | 0.075 | |||
| Serum PTH (ng/mL) | –0.182 (–0.213, –0.151) | –0.078 (–0.115, –0.041) | |||
| ioPTH10 (ng/mL) | –0.3 (–0.394, –0.206) | ||||
| ioPTH20 (ng/mL) | –0.594 (–0.78, –0.408) | –0.135 (–0.296, 0.026) | 0.098 | ||
| Oral calcium | |||||
| No | Ref | ||||
| Yes | 0.017 (–0.206, 0.24) | 0.879 | |||
| Operative principles | |||||
| TPTX | Ref | Ref | |||
| TPTX-AT | –0.134 (–0.21, –0.058) | –0.055 (–0.119, –0.001) | 0.046 | ||
| Frequency of US | –0.005 (–0.034, 0.024) | 0.753 | |||
| Frequency of ECT | –0.014 (–0.055, 0.027) | 0.505 | |||
| Parathyroid gland volume (cm3) | –0.025 (–0.111, 0.061) | 0.572 | |||
| Calcification | |||||
| No | Ref | ||||
| Yes | –0.014 (–0.122, 0.094) | 0.804 | |||
| Hemorrhagic cystic changes | |||||
| No | Ref | ||||
| Yes | –0.144 (–0.387, 0.099) | 0.248 | |||
| Necrosis | |||||
| No | Ref | ||||
| Yes | –0.105 (–0.328, 0.118) | 0.359 | |||
BMI, body mass index; HD, hemodialysis; PD, peritoneal dialysis; CHD, coronary heart disease; Hb, hemoglobin; RBC, red blood cell; WBC, white blood cell; PLT, platelet; ALP, alkaline phosphatase; CRE, creatinine; BUN, blood urea nitrogen; FIB, fibrinogen; 25(OH)D, 25-hydroxyvitamin D; PINP, procollagen type I N-terminal propeptide; CTX, C-terminal cross-linked telopeptide of type I collagen; OST, osteocalcin; ioPTH, intraoperative PTH; US, ultrasound; ECT, emission computed tomography; CI, confidence interval; Ref, reference; POD1 Ca, serum calcium levels on the first postoperative day.
The predictive model included five independent variables and was expressed by
the equation: POD1 Ca = 1.075 + 0.626
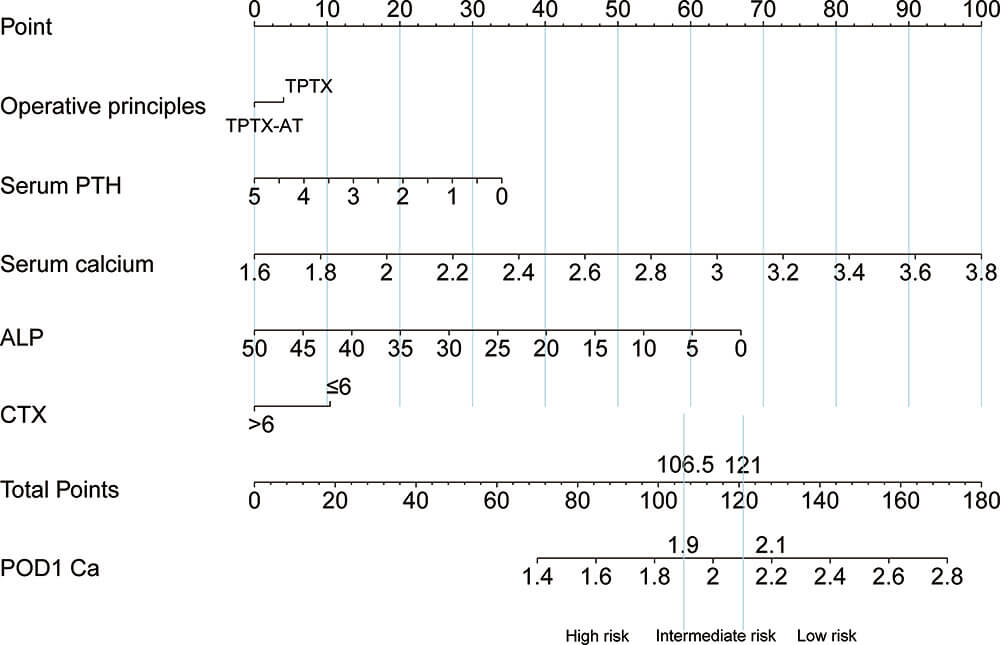 Fig. 2.
Nomogram for predicting POD1 Ca after PTX.
Model validation was conducted by comparing predicted and actual POD1 Ca levels
in the validation cohort. Predicted values averaged 2.123
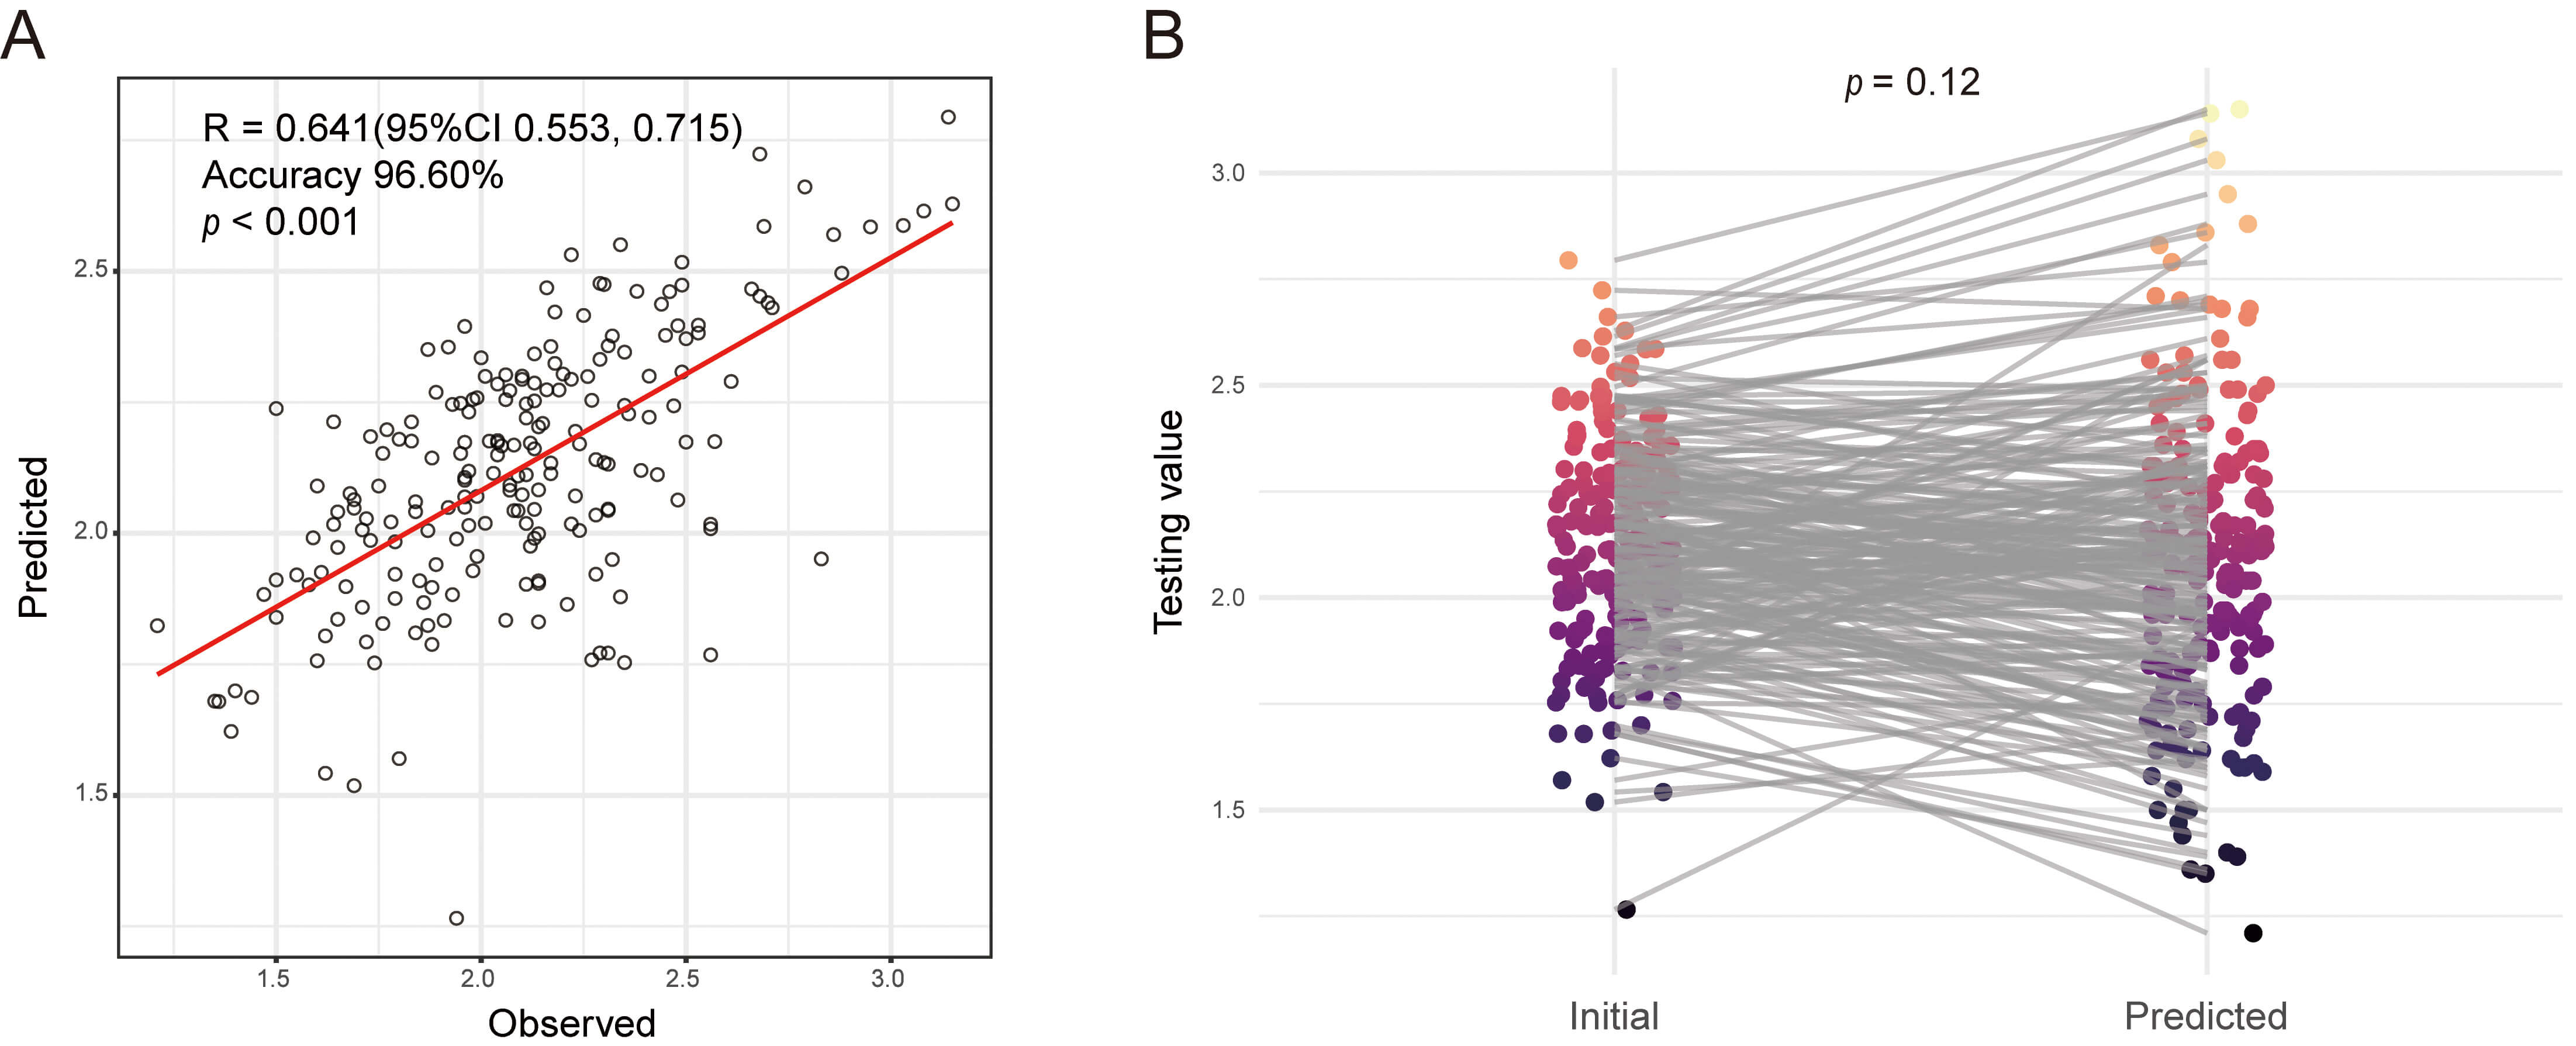 Fig. 3.
Assessment of predicted and actual POD1 Ca in the validation cohort. (A) Actual vs. Predicted plot of POD1 Ca in the validation cohort. (B) Paired t-test for predicted and actual POD1 Ca in the validation cohort.
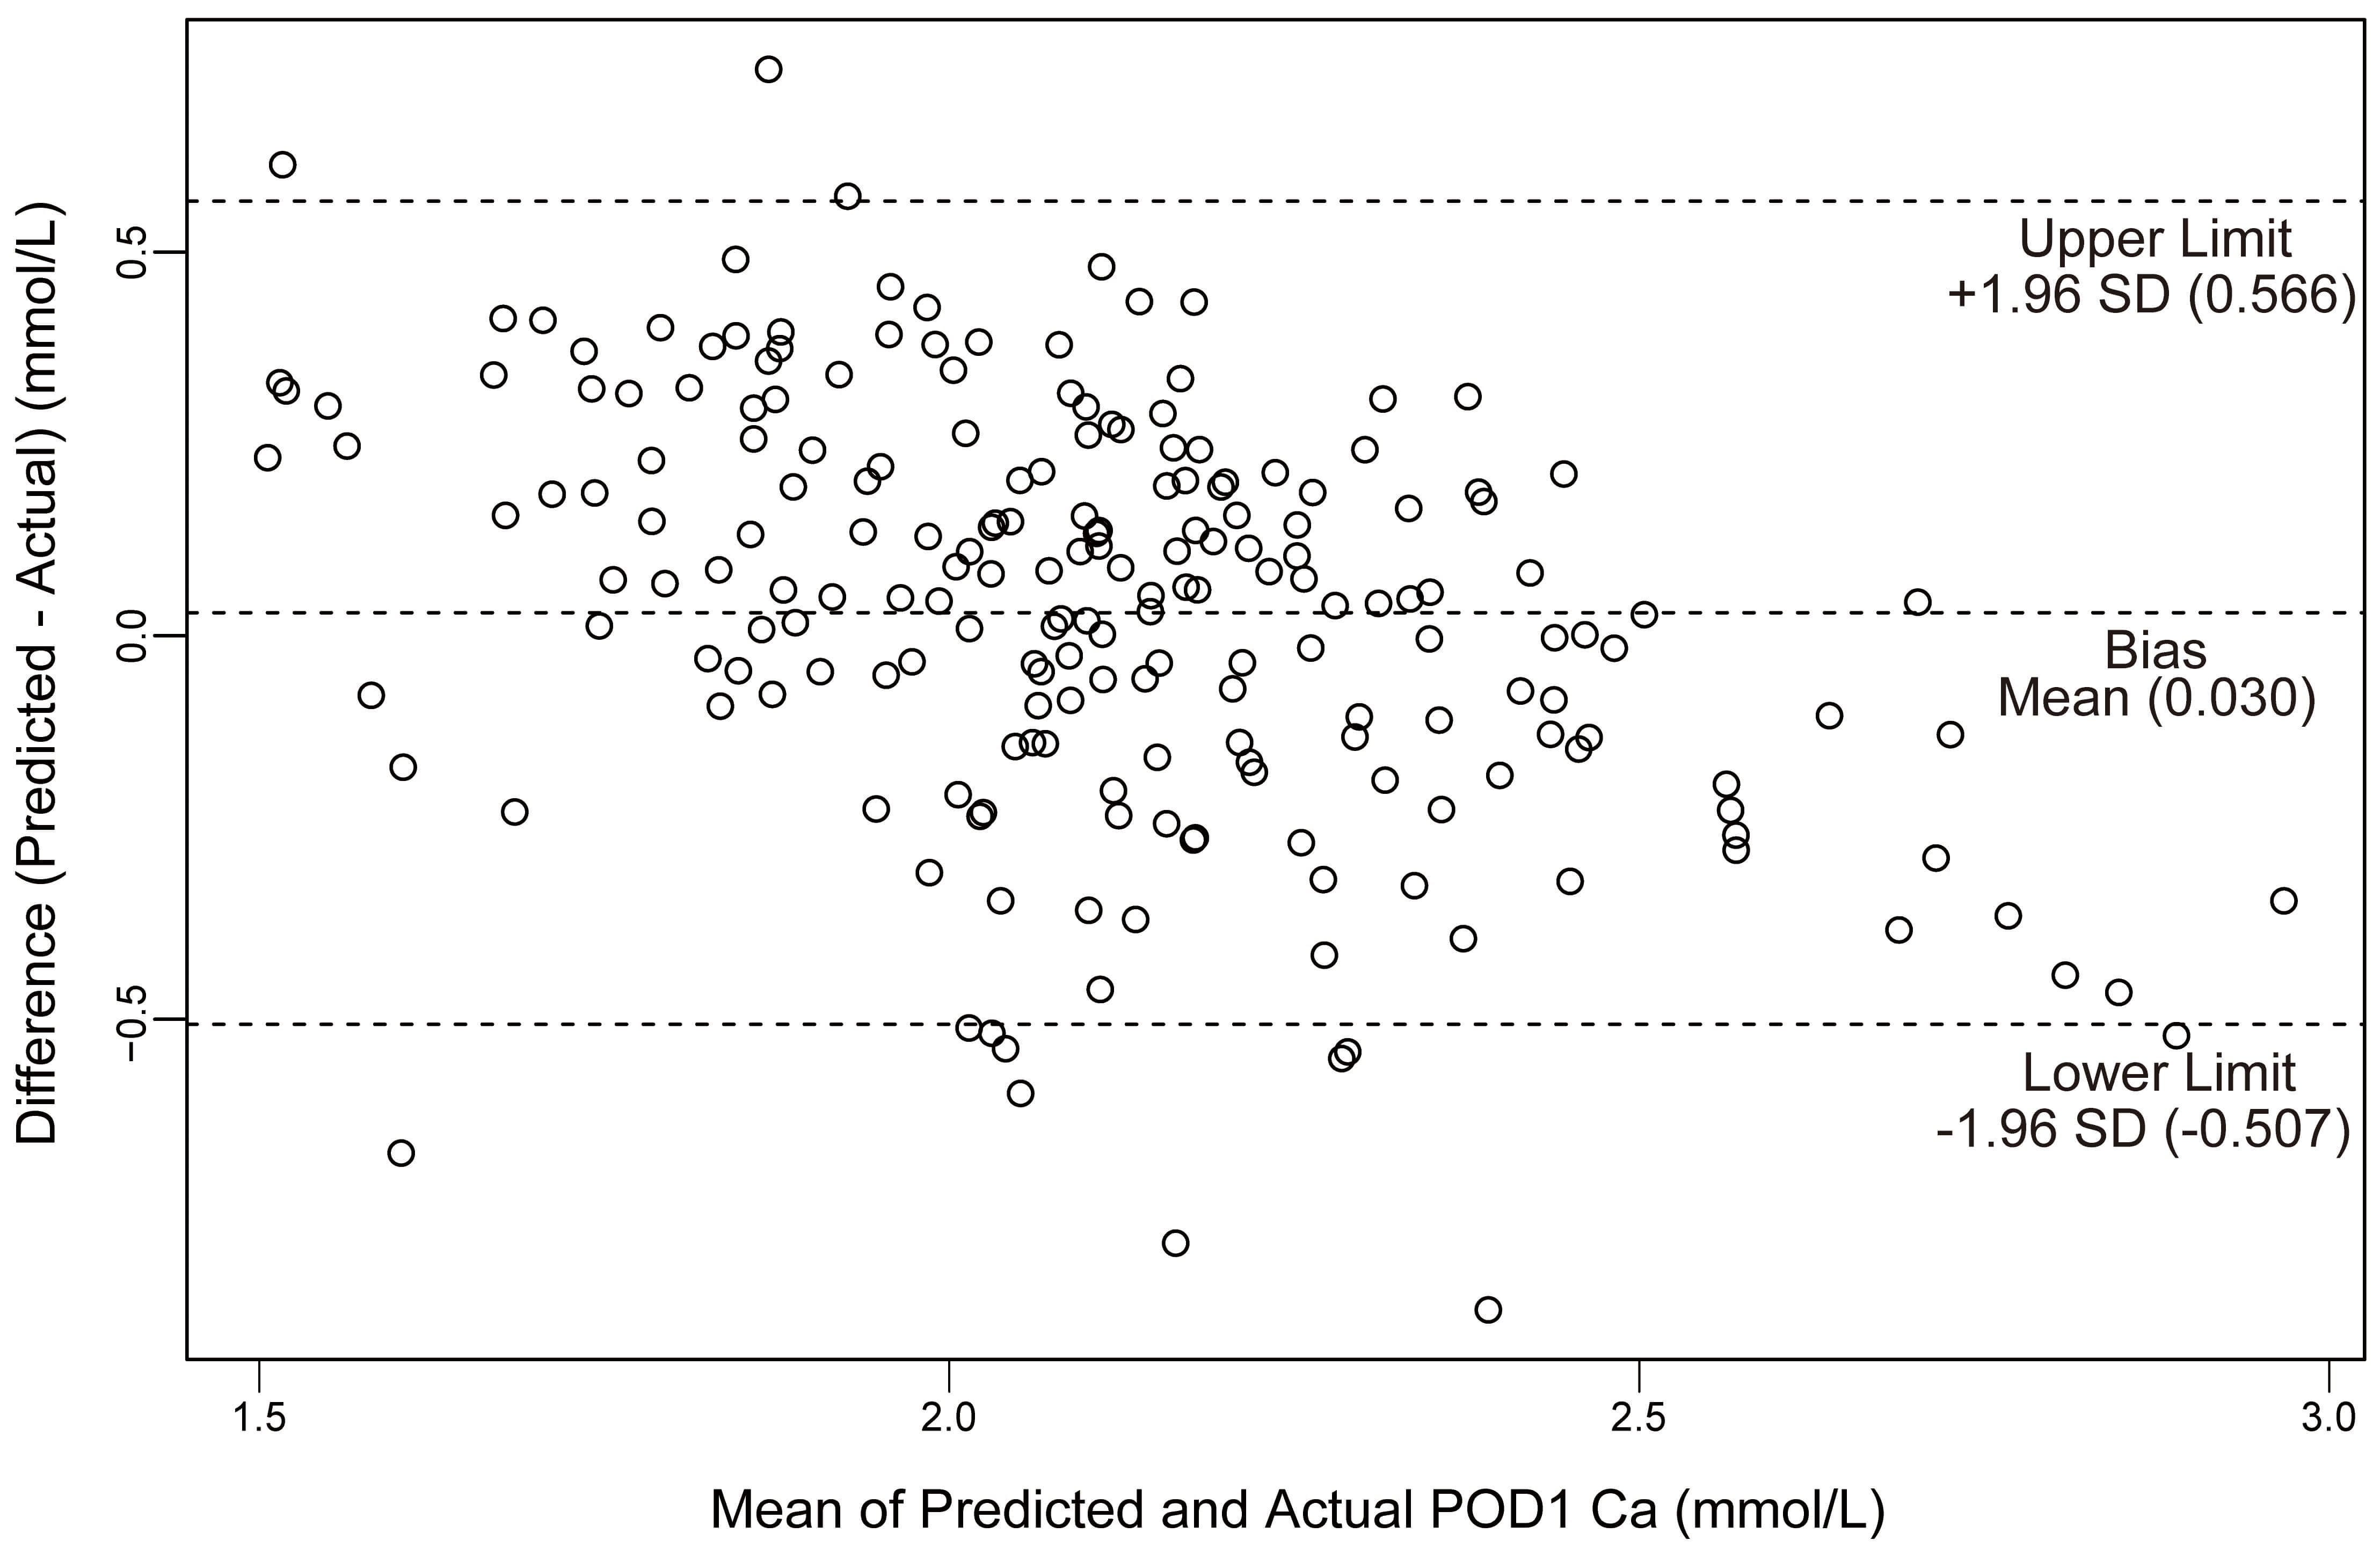 Fig. 4.
Plot of differences between predicted and actual POD1 Ca versus the mean of the predicted and actual Ca in the validation cohort. SD, standard deviation; Ca, calcium.
| Parameter | Model | |
| Bias (mmol/L) | ||
| Precision (IQR) | 0.054 | |
| Median of difference | 0.36 (–0.14, 0.22) | |
| Accuracy (%) | ||
| P15 | 73.3% | |
| P30 | 96.6% | |
| P50 | 99.5% | |
IQR, interquartile range; P15, P30, and P50 stand for the percentage of the estimated values within 15%, 30%, and 50% of the measured values, respectively.
| Parameter | Modelization group | Hold-out validation group | Leave-one-out cross-validation group | 10-fold cross-validation group | |
| R2 | 0.471 | 0.411 | 0.456 | 0.453 | |
| MAE | 0.222 | 0.220 | 0.225 | 0.226 | |
| RMSE | 0.282 | 0.275 | 0.287 | 0.288 | |
| MAPE | 10.803 | 11.014 | 10.946 | 11.012 | |
| Bland–Altman plot | |||||
| bias | |||||
| 95% LoA | 0.555, 0.555 | –0.507, 0.566 | |||
R2, R-squared; MAE, Mean Absolute Error; RMSE, Root Mean Squared Error; MAPE, Mean Absolute Percentage Error; Bland-Altman plot, a tool used to evaluate the consistency between two independent measurement methods; 95% LoA, 95% limits of agreement.
Overall, hypocalcemia occurred in 49.8% (341/685) of patients. Within this group, SH occurred in 28.5% (195/685) of the total cohort. Clinical characteristics of patients with and without postoperative SH are presented in Supplementary Table 6. Patients in the hypocalcemia group showed significantly higher preoperative PTH and ALP levels and lower preoperative serum calcium levels, highlighting the need for a reliable predictive tool. The model’s ability to discriminate between patients developing these outcomes was assessed using receiver operating characteristic (ROC) curve analysis. The model achieved AUC values of 0.75 (95% CI: 0.68, 0.80) for hypocalcemia and 0.81 (95% CI: 0.76, 0.87) for SH (Fig. 5). These results indicate the model’s reliability and clinical utility in postoperative calcium monitoring.
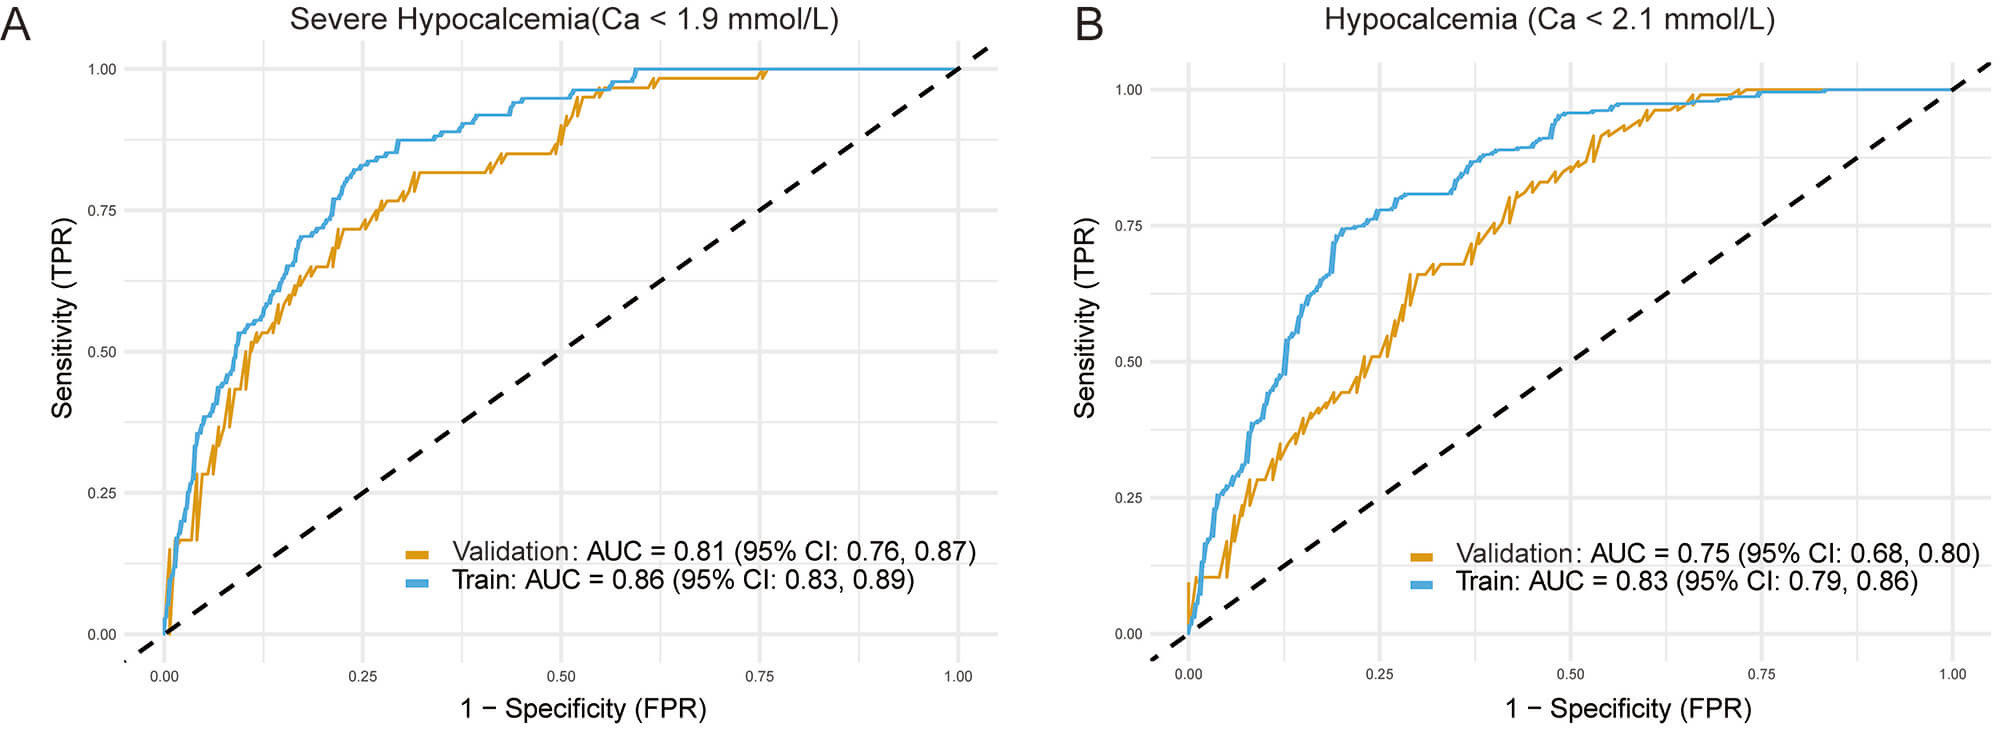 Fig. 5.
ROC curves demonstrating the model’s predictive performance.
The figure displays the model’s ability to discriminate between patients who did
and did not develop (A) severe hypocalcemia (defined as serum calcium
SHPT is a common complication in patients with end-stage renal disease. Patients with SHPT typically exhibit parathyroid hyperplasia and excessive PTH secretion, leading to disruption of bone and mineral metabolism [1]. High PTH levels mobilize bone calcium and promote ectopic calcium and phosphate deposition in vascular, cutaneous, and cardiac tissues, ultimately causing osteoporosis, fractures, pruritus, and poor clinical outcomes [2, 3]. Although PTX effectively lowers serum calcium and phosphorus levels and improves prognosis [17, 18], this procedure may cause various complications, among which hypocalcemia is one of the most severe. Hypocalcemia manifests as numbness, pain, seizures, low blood pressure, and potentially life-threatening conditions [19]. The reported incidence of postoperative hypocalcemia in SHPT patients ranges from 27.4% to 100% [20, 21, 22], typically occurring on the first postoperative day. Similar results were observed in our study: 341 (49.78%) of 685 patients developed hypocalcemia, and 195 (28.47%) experienced SH after the first postoperative day. Thus, close collaborative monitoring and postoperative management by thyroid surgeons, nephrologists, intensivists, and otolaryngologists are essential. However, the lack of established methods for identifying patients at high risk of hypocalcemia before surgery complicates management, highlighting the need for early SH risk stratification to improve therapeutic outcomes and reduce complications.
Currently, PTH is the most common index used to evaluate SHPT severity. PTH promotes bone resorption exceeding bone formation [23], thereby increasing circulating calcium concentrations [24]. Consequently, this effect reverses immediately after PTX, causing calcium to shift abruptly from circulation into bone tissue [25, 26]. Our results corroborate earlier studies linking elevated PTH levels to increased risk of hypocalcemia [27, 28]. However, several other retrospective studies did not identify PTH as a significant factor for hypocalcemia development [29, 30, 31]. This discrepancy may reflect the advanced disease stage and markedly elevated PTH levels characteristic of Chinese SHPT patients undergoing delayed PTX.
The role of serum calcium as a risk factor for PTX remains controversial. In SHPT patients, lower serum calcium levels may reflect a higher baseline bone-remodeling status [32]. After PTX, patients with lower-normal calcium levels experience a more precipitous and severe drop in serum calcium. Our findings align with prior reports demonstrating a positive correlation between serum calcium and POD1 Ca [33]. Nevertheless, a separate study by Mittendorf et al. [34] found no correlation between preoperative and postoperative serum calcium levels. This inconsistency may be attributed to the use of corrected calcium values rather than original total serum calcium values.
Although numerous studies have reported an association between preoperative ALP levels and postoperative hypocalcemia, a consensus has not been reached regarding the predictive utility of ALP for this outcome [35]. For example, Sun et al. [36] reported that preoperative ALP was a risk factor for hypocalcemia and recommended its use in postoperative management. In Torer et al.’s study [37], high serum ALP even exerted a positive effect in preventing postoperative hypocalcemia. These discrepancies may result from variations in bone disease severity and study sample sizes. Our analysis confirms preoperative ALP as an independent predictor of hypocalcemia following PTX.
Previous research has selected CTX as a preferred marker for bone resorption due to its well-characterized assay [38]. Theoretically, higher preoperative ALP levels reflect a more active bone remodeling state, leading to a higher incidence of hypocalcemia after PTX. However, few studies indicate that CTX independently predicts hypocalcemia after PTX. Parshina et al. [39] demonstrated CTX as an independent risk factor for SH development following SHPT surgery, while Liu et al. [40] confirmed its predictive value through univariate logistic regression. In our study, CTX was included in the regression equations. If possible, preoperative CTX levels should be assessed to reflect the effect of PTX on bone turnover.
The optimal surgical approach for PTX remains controversial. According to a large meta-analysis, postoperative hypocalcemia rates are similar regardless of the type of operation; however, patients undergoing TPTX-AT might need longer periods of calcium and vitamin D supplementation [41]. Ho et al. [42] reported a higher incidence of hypocalcemia following TPTX, attributing this result to a more rapid postoperative decline in serum calcium levels. Surprisingly, our data indicated a lower rate of hypocalcemia after TPTX compared with TPTX-AT. These discrepancies likely reflect variations in baseline patient characteristics and differences in sample sizes. Additionally, our analysis did not include established preoperative risk factors such as gender, age, and BMI, previously associated with hypocalcemia [43]. Interestingly, despite vitamin D’s well-known role in calcium and bone metabolism, our analysis did not identify preoperative 25(OH)D levels as significant predictors of postoperative hypocalcemia. This finding could be due to consistently low vitamin D levels observed in most patients with severe SHPT, thus limiting its predictive usefulness. Further studies are necessary to clarify the influence of these factors on hypocalcemia development.
The primary aim of this study is to provide clinicians with a practical tool for enhancing patient care. A key strength supporting its feasibility is that the model includes five predictive factors routinely available or easily obtainable during preoperative evaluations for PTX. Serum calcium, PTH, and ALP are standard laboratory tests. Although the CTX assay is more specialized, it is a widely recognized marker for bone turnover, increasingly used in managing severe renal bone disease. We propose embedding this assessment tool into hospital electronic health record (EHR) systems. Clinicians could utilize the nomogram in real-time during perioperative care. The EHR could automatically extract the required laboratory data, compute the risk score, and issue alerts for patients at high risk, prompting clinical teams to adjust postoperative management plans accordingly. It should be emphasized that the nomogram serves as a risk stratification tool to assist, but not replace, clinical judgment.
This study introduces a novel nomogram to predict postoperative hypocalcemia,
developed using linear regression analysis. Additional strengths of the study
include the following: the linear regression model provides richer, more
actionable information; the sample size (n = 685) is adequate; ten-fold
cross-validation and leave-one-out cross-validation were performed, confirming
the reliability of the nomogram; and patients with a total score of
However, this study has several limitations. Firstly, the data were collected from a single institution, limiting the generalizability of the results. Secondly, this research was retrospective. Although surgical procedures were selected based on intraoperative anatomical findings, the possibility of subtle selection biases inherent in retrospective designs cannot be completely ruled out. Thirdly, despite excluding patients with over 30% missing data and employing multiple imputation for features with less than 20% missing values, residual confounding effects may persist. Finally, other unmeasured factors potentially associated with postoperative hypocalcemia, such as parathyroid gland weight and bone mineral density, were not evaluated. Incorporating these variables should be a primary goal for future prospective studies.
In conclusion, this model demonstrates strong predictive capability by integrating preoperative hypocalcemia status, ALP, CTX, PTH, and surgical procedures. Clinicians can use this tool preoperatively to evaluate hypocalcemia risk in patients with SHPT, enabling timely interventions and improved outcome predictions.
• This study developed and validated a nomogram to predict severe hypocalcemia on the first postoperative day in patients with secondary hyperparathyroidism undergoing parathyroidectomy.
• Multivariable linear regression identified preoperative serum calcium, parathyroid hormone, alkaline phosphatase, CTX, and surgical procedures (TPTX vs. TPTX-AT) as independent predictors.
• The model showed good calibration and internal validation, with AUCs of 0.75 for hypocalcemia and 0.81 for severe hypocalcemia.
• This nomogram enables individualized risk stratification and supports tailored perioperative calcium management to improve outcomes in SHPT patients.
The data that support the findings of this study are available from the corresponding authors upon reasonable request.
WTL: Conceptualization, Methodology, Data curation, Formal analysis, Visualization, Writing—original draft. YW: Data curation, Investigation, Writing—original draft. JX: Investigation, Data curation. ZHL: Formal analysis. PZ: Conceptualization, Supervision, Funding acquisition. QQH: Conceptualization, Methodology, Supervision, Funding acquisition. All authors contributed to revising the manuscript critically for important intellectual content. All authors read and approved the final manuscript. All authors have participated sufficiently in the work and agreed to be accountable for all aspects of the work.
This study adhered to the ethical principles for medical research involving human subjects set forth in the Declaration of Helsinki. The research protocol was reviewed and approved by the Research Ethics Committee of the 960th Hospital of the PLA Joint Logistics Support Force (Approval No. 2025-090). As a retrospective study using de-identified data, informed consent was waived. The privacy rights of all human subjects were strictly observed, with all data handled in an anonymized manner to prevent disclosure of personal information.
This study was generously supported by Jingding Medical Tech, to whom we extend our sincere gratitude. We especially thank them for providing authorization and technical support for the JD-LCPM software (V2.10, Jingding Medical Technology Co., Ltd., Hefei, China). The team at Jingding Medical Tech offered invaluable assistance in data processing. They provided valuable assistance in data processing and technical support, and did not influence or interfere with the objectivity of the results.
This work was supported by the Key Medical Discipline Project of Joint Logistics Support Force of the People’s Liberation Army of China.
The authors declare no conflict of interest.
Supplementary material associated with this article can be found, in the online version, at https://doi.org/10.31083/BJHM50726.
References
Publisher’s Note: IMR Press stays neutral with regard to jurisdictional claims in published maps and institutional affiliations.