


1 Clinical College, Affiliated Hospital of North Sichuan Medical College, 637000 Nanchong, Sichuan, China
Abstract
Hypoxemia and respiratory failure are common among critically ill patients, and high-flow nasal cannula (HFNC) therapy has been increasingly utilized as a non-invasive respiratory support modality. However, a subset of patients eventually requires mechanical ventilation (MV), and predicting this transition remains challenging. This study aimed to develop and validate nomograms that predict the risk of MV among patients undergoing HFNC therapy.
A retrospective cohort study was conducted using the publicly available Multiparameter Intelligent Monitoring in Intensive Care IV version 2.0 (MIMIC-IV v2.0) database to identify adult intensive care unit (ICU) patients who received HFNC oxygen therapy for 24 hours or longer. Patients who had undergone MV before HFNC initiation were excluded. Key clinical variables, including demographic data and illness severity scores, were extracted. A multivariable logistic regression model was employed to identify independent predictors of subsequent MV, and a nomogram was constructed based on these predictors. The cohort was randomly divided into training (70%) and validation (30%) sets. Model performance was evaluated using the area under the curve (AUC), calibration plots, the Hosmer–Lemeshow goodness-of-fit test, and decision curve analysis (DCA).
Among 4069 patients included in the final analysis, 1332 (32.7%) transitioned from HFNC to MV. Multivariable analysis identified body weight, Sepsis-3 status, urine output score, the ratio of the partial pressure of oxygen in arterial blood (PaO2) to the fraction of inspired oxygen (PaO2/FiO2 ratio), Pulmonary Score, Glasgow Coma Scale (GCS), and creatinine as independent predictors of MV. The constructed nomogram demonstrated AUC values of 0.659 in the training cohort and 0.656 in the validation cohort. Calibration curves and Hosmer–Lemeshow tests indicated good model calibration, while DCA confirmed its clinical utility within low-to-moderate risk thresholds (≤0.4).
We developed and validated a nomogram to predict the likelihood of MV requirement in patients receiving HFNC therapy. The nomogram may serve as a practical clinical tool to assist physicians in determining whether to continue HFNC therapy or initiate MV in clinically ill patients.
Keywords
- high-flow nasal cannula
- oxygen therapy
- mechanical ventilation
- nomogram
- predictive model
The intensive care unit (ICU) is the primary facility for admitting critically ill patients, most of whom present with varying degrees of hypoxemia [1]. Some patients may also experience acute respiratory failure, acute respiratory distress syndrome, trauma, or respiratory dysfunction caused by other illnesses, which can be life-threatening [1]. Therefore, early implementation of supportive respiratory therapy and maintenance of oxygen saturation in critically ill patients is crucial. Currently, the main treatment approaches for respiratory support in the ICU include conventional oxygen therapy (COT), high-flow nasal cannula (HFNC) therapy, and mechanical ventilation (MV) [2].
Nasal cannula oxygen therapy is a simple and commonly used method of oxygen supplementation. However, its main limitation is the inability to deliver high oxygen concentration [2]. The maximum achievable oxygen concentration through a nasal cannula is approximately 44% at the highest flow rates, which may not be sufficient for patients with severe hypoxemia [3]. Furthermore, it remains challenging to accurately adjust the oxygen concentration delivered through a nasal cannula [3].
Mask oxygen therapy can deliver a slightly higher oxygen concentration than nasal cannula therapy [2]. However, it also presents drawbacks, such as limited precision in oxygen concentration control and interference with sputum clearance and oral intake [2]. The mask may obstruct eating and drinking, and can also impede coughing and clearance of secretions, thereby increasing the risk of respiratory infection [2].
Both nasal cannula and mask oxygen therapies have distinct advantages and disadvantages, and the choice of oxygen therapy depends largely on the condition of the patient and the severity of hypoxemia [4]. In some cases, HFNC or MV may be necessary to ensure adequate oxygenation and respiratory support [4].
HFNC delivers high oxygen concentrations and at large flow rates, allowing for rapid improvement in oxygenation among hypoxemic patients. It is generally well-tolerated by patients and may reduce the need for invasive MV [4]. Additionally, HFNC alleviates respiratory distress and decreases the work of breathing by generating a low level of positive end-expiratory pressure (PEEP) in the airways, promoting lung recruitment and improving oxygenation [5].
MV, in contrast, is a more invasive respiratory support modality that provides positive pressure ventilation to correct respiratory failure in patients with hypoxemia and hypercapnia [6]. It can also mitigate respiratory muscle fatigue and facilitate blood flow redistribution in patients with shock [6]. However, MV is associated with several potential complications, including the risk of lung injury or barotrauma from high airway pressures, which impede venous return and lead to decreased cardiac output and hypotension, as well as patient discomfort [7]. Moreover, prolonged MV increases the risk of ventilator-associated pneumonia [7].
Although HFNC therapy offers an alternative treatment option for hypoxemic patients with significant clinical benefits, it is not universally suitable for all patients. MV remains a frequently utilized life-saving intervention among hospitalized patients [8]. Therefore, clinicians often face a dilemma when choosing between these two treatment modalities. On one hand, the profound instability of many critically ill patients, combined with continuously evolving treatment regimens, means that overreliance on HFNC may delay initiation of essential interventions, including MV, thereby worsening patient outcomes [9]. On the other hand, premature initiation of MV may heighten patient resistance and reduce adherence [10].
Currently, there are no universally accepted criteria for determining the optimal timing for transitioning from HFNC to MV intervention in ICU patients, and most clinical decisions in this regard rely heavily on empirical judgment. Therefore, developing a predictive model for the transition from HFNC to MV could support clinicians in making more evidence-based treatment decisions. This study focused on ICU patients receiving HFNC therapy and aimed to predict the probability of transition to MV, providing clinicians with a simple and effective predictive model to guide optimal treatment timing. Such a prognostic model may facilitate early identification of patient deterioration, thereby enabling timely initiation of MV when necessary. On the other hand, it can help prevent unnecessary or premature intubation, thus avoiding associated discomfort and potential complications. In this manner, the prognostic model supports the delivery of more personalized and effective care for patients undergoing HFNC therapy.
This study utilized the Multiparameter Intelligent Monitoring in Intensive Care IV version 2.0 (MIMIC-IV v2.0; https://physionet.org/content/mimiciv/2.0/), a publicly accessible ICU database that contains clinical data from over 40,000 critically ill patients admitted to Beth Israel Deaconess Medical Center between 2008 and 2019 [11]. Access to the database was granted after the investigators completed the required web-based training and successfully passed the Protecting Human Research Participants examination (certification No. 54890267).
Inclusion criteria: Patients were included if they met the following criteria:
aged
Exclusion criteria: Patients were excluded if they had: severe congenital respiratory diseases (e.g., cystic fibrosis) or end-stage cardiopulmonary failure (e.g., advanced chronic obstructive pulmonary disease [COPD] under palliative care or stage D heart failure); missing data exceeding 20% for essential critical parameters (e.g., physiological parameters or severity scores); transfers to other facilities or voluntary withdrawal of treatment during HFNC therapy; unplanned surgical interventions (e.g., trauma laparotomy) or emergency intubation unrelated to respiratory failure.
Screening process: From the MIMIC-IV v2.0 database, 632,920 oxygen delivery records were initially identified. After applying the inclusion and exclusion criteria, 4069 patients who received HFNC and 9770 patients who received MV were selected. Using the stay_id identifier, these cohorts were cross-referenced to include only cases in which MV initiation occurred after HFNC therapy, resulting in 1332 eligible patients. The final study population was divided into two groups: the HFNC group (patients who did not require subsequent MV, n = 2737) and the MV group (patients who transitioned to MV after HFNC therapy, n = 1332).
Clinical data, encompassing patient demographics and multiple severity assessment scores, were extracted from the MIMIC-IV v2.0 database. These included the OASIS, LODS, Sepsis-3 score, SIRS score, and SOFA score. These scoring systems provide a quantitative evaluation of illness severity, organ dysfunction, and systemic inflammation among the patients. Additionally, detailed scoring components were obtained to provide a comprehensive picture of each patient’s clinical status. The collected data were subsequently utilized to develop a predictive model for the transition from HFNC to MV.
The study population was divided into two groups: the HFNC group (n = 2737) and the MV group (n = 1332), and statistical comparisons were conducted between them. The Kolmogorov–Smirnov test was applied to assess data normality (Supplementary Table 1), and corresponding histogram plots are presented in Supplementary Fig 1. Categorical variables were reported as counts and percentages, whereas continuous variables were summarized using means with standard deviations or medians with interquartile ranges, as appropriate. The Chi-square or Chi-square corrected test was used for categorical variables, while the Mann-Whitney U test was employed for continuous variables.
To identify potential predictors for MV transition, univariate logistic
regression analyses were initially performed. Variables with a p-value
Model development and internal validation were performed using bootstrap resampling to assess discrimination and calibration performance. The entire cohort was randomly divided into a training set (70%) and a validation set (30%) for model derivation and validation, respectively. A detailed comparison between the training and validation cohorts is presented in Supplementary Table 2.
Model performance was evaluated using multiple statistical indices: the area
under the curve (AUC) to evaluate the
discriminative ability; the Hosmer–Lemeshow goodness-of-fit test and calibration
plots to assess model calibration; and decision curve analysis (DCA) to assess
clinical utility. All statistical tests were two-tailed, and a p-value
The discriminative ability of the model was further interpreted based on AUC
values as follows: 0.5–0.6, no discrimination; 0.6–0.7, poor discrimination;
0.7–0.8, acceptable discrimination; 0.8–0.9, excellent discrimination; and
A total of 4069 patients were enrolled in the study, comprising 2737 patients
treated with HFNC and 1332 patients who subsequently required MV. Comparison
between the two groups revealed statistically significant differences in several
clinical variables. Notable differences were observed in
gender (p = 0.017), body weight (p
| Variable | HFNC (n = 2737) | MV (n = 1332) | Test statistic | p-value | ||||
| Demographics | ||||||||
| Gender, n (%) | 0.017* | |||||||
| Male | 1526 (55.75) | 796 (59.76) | ||||||
| Female | 1211 (44.25) | 536 (40.24) | ||||||
| Race, n (%) | 0.114 | |||||||
| White | 2006 (73.29) | 946 (71.02) | ||||||
| Black | 180 (6.58) | 110 (8.26) | ||||||
| Other | 551 (20.13) | 276 (20.72) | ||||||
| Age (years) | 68 (58.00, 79.00) | 69 (58.00, 78.00) | Z = –0.18 | 0.858 | ||||
| Body weight (kg) | 77 (65.00, 91.40) | 83 (68.50, 100.32) | Z = –7.68 | |||||
| Clinical assessment scores | Score | |||||||
| SOFA score | 6.00 (4.00, 9.00) | 6.00 (4.00, 9.00) | Z = –2.11 | 0.034* | ||||
| PaO2/FiO2 (mmHg) | 0.205 | |||||||
| 0 | 964 (35.22) | 431 (32.36) | ||||||
| 1 | 59 (2.16) | 24 (1.80) | ||||||
| 2 | 1069 (39.06) | 525 (39.41) | ||||||
| 3 | 356 (13.01) | 189 (14.19) | ||||||
| 4 | 289 (10.56) | 163 (12.24) | ||||||
| Platelets (103/µL) | 0.28 | |||||||
| 0 | 1741 (63.61) | 856 (64.26) | ||||||
| 1 | 528 (19.29) | 281 (21.10) | ||||||
| 2 | 288 (10.52) | 123 (9.23) | ||||||
| 3 | 129 (4.71) | 53 (3.98) | ||||||
| 4 | 51 (1.86) | 19 (1.43) | ||||||
| Bilibrubin (µmol/L) | 0.223 | |||||||
| 0 | 2274 (83.08) | 1117 (83.86) | ||||||
| 20~32 | 1 | 193 (7.05) | 88 (6.61) | |||||
| 33~101 | 2 | 186 (6.80) | 87 (6.53) | |||||
| 102~204 | 3 | 36 (1.32) | 26 (1.95) | |||||
| 4 | 48 (1.75) | 14 (1.05) | ||||||
| Hypotension | 0.616 | |||||||
| MAP |
0 | 410 (14.98) | 191 (14.34) | |||||
| MAP |
1 | 1672 (61.09) | 808 (60.66) | |||||
| Dopamine |
2 | 11 (0.40) | 10 (0.75) | |||||
| Dopamine |
3 | 213 (7.78) | 104 (7.81) | |||||
| Dopamine |
4 | 431 (15.75) | 219 (16.44) | |||||
| GCS | ||||||||
| 15 | 0 | 635 (23.20) | 227 (17.04) | |||||
| 13~14 | 1 | 1005 (36.72) | 452 (33.93) | |||||
| 10~12 | 2 | 353 (12.90) | 231 (17.34) | |||||
| 6~9 | 3 | 408 (14.91) | 221 (16.59) | |||||
| 4 | 336 (12.28) | 201 (15.09) | ||||||
| Creatinine (µmol/L) | 0.003* | |||||||
| 0 | 1351 (49.36) | 639 (47.97) | ||||||
| 110~170 | 1 | 719 (26.37 | 378 (28.38) | |||||
| 171~299 | 2 | 237 (8.66) | 151 (11.34) | |||||
| 300~440 | 3 | 257 (9.39) | 95 (7.13) | |||||
| 4 | 173 (6.32) | 69 (5.18) | ||||||
| LODS | 6.00 (3.00, 8.00) | 6.00 (4.00, 9.00) | Z = –6.17 | |||||
| Pulmonary | ||||||||
| PaO2/FiO2 (mmHg) on MV or CPAP | ||||||||
| No MV and No CPAP | 0 | 1461 (53.38) | 465 (34.91) | |||||
| 1 | 350 (12.79) | 218 (16.37) | ||||||
| 3 | 926 (33.83) | 649 (48.72) | ||||||
| Hematologic | ||||||||
| Leukocytes (109/L), or Platelets (109/L) | 0.179 | |||||||
| 2.5~49.9 (or |
0 | 2482 (90.68) | 1229 (92.27) | |||||
| 1.0~2.4 (or |
1 | 214 (7.82) | 90 (6.76) | |||||
| 3 | 41 (1.50) | 13 (0.98) | ||||||
| Cardiovascular | ||||||||
| Heart rate, beats/minute (or SBP, mmHg) | 0.375 | |||||||
| 30~139 beats/minute (and 90~239 mmHg) | 0 | 1206 (44.06) | 618 (46.40) | |||||
| 1 | 1280 (46.77) | 587 (44.07) | ||||||
| 40~69 mmHg or |
3 | 228 (8.33) | 118 (8.86) | |||||
| 5 | 23 (0.84) | 9 (0.68) | ||||||
| Neurologic | ||||||||
| GCS | ||||||||
| 14~15 | 0 | 1354 (49.47) | 546 (40.99) | |||||
| 9~13 | 1 | 757 (27.66) | 409 (30.71) | |||||
| 6~8 | 3 | 290 (10.60) | 176 (13.21) | |||||
| 3~5 | 5 | 336 (12.28) | 201 (15.09) | |||||
| Renal | ||||||||
| Urea nitrogen (mmol/L) or Creatinine (µmol/L) or Urine output (L/d) | 0.133 | |||||||
| 0 | 153 (5.59) | 58 (4.35) | ||||||
| 6~9.9 mmol/L or 106~140 µmol/L | 1 | 1250 (45.67) | 586 (43.99) | |||||
| 10~19.9 mmol/L or |
3 | 825 (30.14) | 440 (33.03) | |||||
| 5 | 509 (18.60) | 248 (18.62) | ||||||
| Hepatic | ||||||||
| Bilirubin (µmol/L) or Prothombin time secs above Standard (%) | 0.430 | |||||||
| 0 | 1514 (55.32) | 755 (56.68) | ||||||
| 1 | 1223 (44.68) | 577 (43.32) | ||||||
| OASIS | 34.00 (28.00, 41.00) | 35.00 (29.00, 41.00) | Z = –1.90 | 0.057 | ||||
| Pre-ICU LOS score | 0.974 | |||||||
| 4.95~24 hours | 0 | 298 (10.89) | 148 (11.11) | |||||
| 1 | 864 (31.57) | 425 (31.91) | ||||||
| 24.01~311.8 hours | 2 | 199 (7.27) | 90 (6.76) | |||||
| 0.17~4.94 hours | 3 | 953 (34.82) | 459 (34.46) | |||||
| 5 | 423 (15.45) | 210 (15.77) | ||||||
| Age score | 0.218 | |||||||
| 0 | 28 (1.02) | 9 (0.68) | ||||||
| 24~53 years | 3 | 472 (17.25) | 217 (16.29) | |||||
| 54~77 years | 6 | 1486 (54.29) | 760 (57.06) | |||||
| 78~89 years | 7 | 152 (5.55) | 57 (4.28) | |||||
| 9 | 599 (21.89) | 289 (21.70) | ||||||
| Heart rate score | 0.294 | |||||||
| 33~88 beats/minute | 0 | 425 (15.53) | 241 (18.09) | |||||
| 89~106 beats/minute | 1 | 865 (31.60) | 407 (30.56) | |||||
| 107~125 beats/minute | 3 | 846 (30.91) | 392 (29.43) | |||||
| 4 | 9 (0.33) | 6 (0.45) | ||||||
| 6 | 592 (21.63) | 286 (21.47) | ||||||
| GCS score | ||||||||
| 15 | 0 | 635 (23.20) | 227 (17.04) | |||||
| 14 | 3 | 719 (26.27) | 319 (23.95) | |||||
| 8~13 | 4 | 859 (31.38) | 487 (36.56) | |||||
| 3~7 | 10 | 524 (19.15) | 299 (22.45) | |||||
| Mbp score | 0.182 | |||||||
| 61.33~143.44 mmHg | 0 | 925 (33.80) | 483 (36.26) | |||||
| 51~61.32 mmHg | 2 | 1090 (39.82) | 497 (37.31) | |||||
| 20.65~50.99 or |
3 | 666 (24.33) | 316 (23.72) | |||||
| 4 | 56 (2.05) | 36 (2.70) | ||||||
| Respiratory rate score | 0.921 | |||||||
| 13~22 beats/minute | 0 | 78 (2.85) | 37 (2.78) | |||||
| 23~30 or 6~12 beats/minute | 1 | 1261 (46.07) | 622 (46.70) | |||||
| 31~44 beats/minute | 6 | 1211 (44.25) | 591 (44.37) | |||||
| 9 | 133 (4.86) | 56 (4.20) | ||||||
| 10 | 54 (1.97) | 26 (1.95) | ||||||
| Temperature score | 0.516 | |||||||
| 36.40~36.88 °C | 0 | 199 (7.27) | 106 (7.96) | |||||
| 36.89~39.88 or 35.94~36.39 °C | 2 | 1984 (72.49) | 982 (73.72) | |||||
| 3 | 14 (0.51) | 9 (0.68) | ||||||
| 33.22~35.93 °C | 4 | 525 (19.18) | 229 (17.19) | |||||
| 6 | 15 (0.55) | 6 (0.45) | ||||||
| Urine Output score | 0.520 | |||||||
| 2544~6896 cc/day | 0 | 674 (24.63) | 311 (23.35) | |||||
| 1427~2543.99 cc/day | 1 | 817 (29.85) | 428 (32.13) | |||||
| 671~1426.99 cc/day | 5 | 828 (30.25) | 401 (30.11) | |||||
| 8 | 11 (0.40) | 3 (0.23) | ||||||
| 10 | 407 (14.87) | 189 (14.19) | ||||||
| Elective surgery score | 0.119 | |||||||
| Yes | 0 | 2673 (97.66) | 1289 (96.77) | |||||
| No | 6 | 64 (2.34) | 43 (3.23) | |||||
| Sepsis-3 | ||||||||
| No | 0 | 786 (28.72) | 279 (20.95) | |||||
| True | 1 | 1951 (71.28) | 1053 (79.05) | |||||
| SIRS | 3 (2, 3) | 3 (2, 3) | Z = 2.97 | |||||
| Temperature level ( |
0.014* | |||||||
| No | 0 | 1686 (61.60) | 874 (65.62) | |||||
| Yes | 1 | 1051 (38.40) | 458 (34.38) | |||||
| WBC Count level ( |
0.331 | |||||||
| No | 0 | 918 (33.54) | 468 (35.14) | |||||
| Yes | 1 | 1819 (66.46) | 864 (64.86) | |||||
| HR level ( |
0.005* | |||||||
| No | 0 | 496 18.12) | 291 (21.85) | |||||
| Yes | 1 | 2241 (81.88) | 1041 (78.15) | |||||
| RR level ( |
1 | |||||||
| No | 0 | 79 (2.89) | 38 (2.85) | |||||
| Yes | 1 | 2658 (97.11) | 1294 (97.15) | |||||
Note: Data are presented as median (interquartile range, IQR) or n (%).
*p-values
Abbreviations: HFNC, high-flow nasal cannula; MV, mechanical ventilation; SOFA, Sequential Organ Failure Assessment; GCS, Glasgow Coma Scale; OASIS, Oxford Acute Severity of Illness Score; LODS, Logistic Organ Dysfunction Score; SIRS, Systemic Inflammatory Response Syndrome; MAP, mean arterial pressure; PaO2/FiO2, ratio of arterial oxygen partial pressure to fractional inspired oxygen; ICU, intensive care unit; CPAP, Continuous Positive Airway Pressure; SBP, Systolic Blood Pressure; LOS, Length of Stay; WBC, White Blood Cell; HR, heart rate; RR, respiratory rate; Mbp, Mean blood pressure.
The study population of 4069 patients was randomly divided into a training cohort of 2848 patients and a validation cohort of 1221 patients, using a 7:3 split ratio. Univariate analysis was first performed in the training cohort, and variables showing significant associations were selected as independent variables for binary logistic regression analysis. The dependent variable was whether the patient underwent MV (Y = 1 for MV, Y = 0 for no MV).
Multivariable logistic regression was subsequently performed using variables
that demonstrated statistical significance in univariate analysis (p
Although Sepsis-3 did not reach statistical significance in the multivariable
model, it was retained because of its recognised importance in prior literature
and clinical relevance to respiratory failure. The regression results
demonstrated that body weight (odd ratio (OR) = 1.014, p
Independent predictors identified from the multivariate analysis were incorporated into a predictive model using R software to establish prognostic nomograms, as illustrated in Fig. 1. The indicators, from top to bottom in the figure, represent the individual score, body weight, Sepsis-3 score, pulmonary score in the LODS, urine output score, PaO2/FiO2, GCS, and creatinine classification, as well as the total score and risk probability.
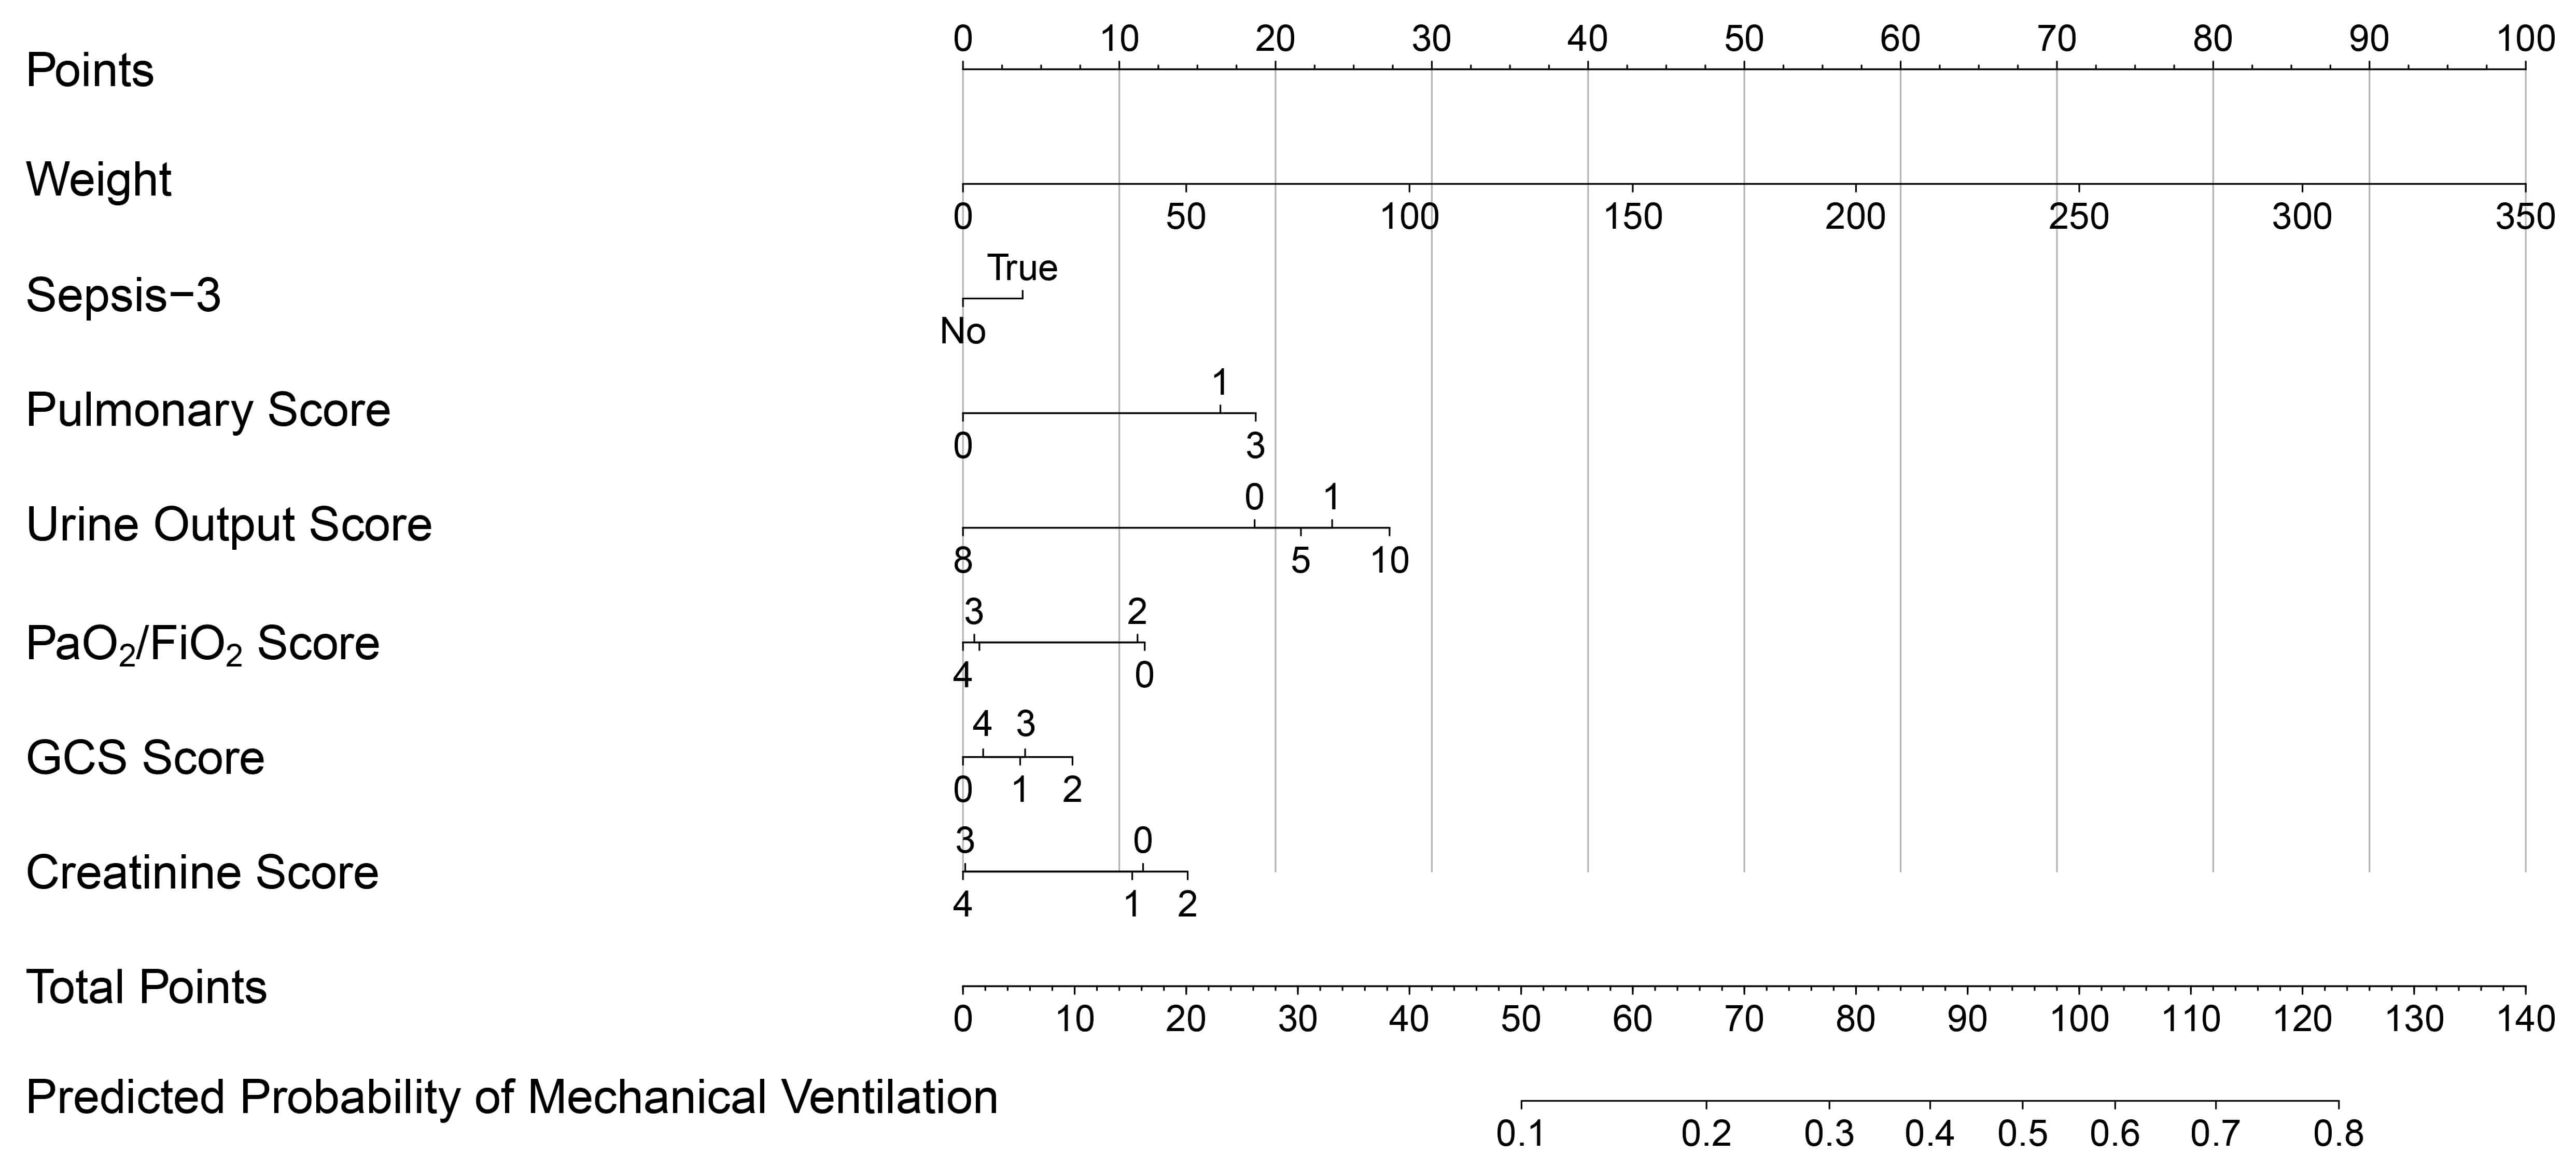 Fig. 1.
Nomogram for predicting the risk of MV in patients undergoing HFNC therapy.
Each predictive variable corresponds to a set of values, and the respective score can be determined using the numerical scale on the left and the point scale at the top. The total score is obtained by summing the scores of all variables, and its position on the “Total Points” scale at the bottom corresponds to the probability of a patient requiring MV. The nomogram provides a visual tool to estimate the likelihood of HFNC-treated patients transitioning to MV based on their clinical characteristics.
Internal validation of the predictive model was conducted to assess its
performance. The Hosmer-Lemeshow test indicated good calibration for both the
training cohort (
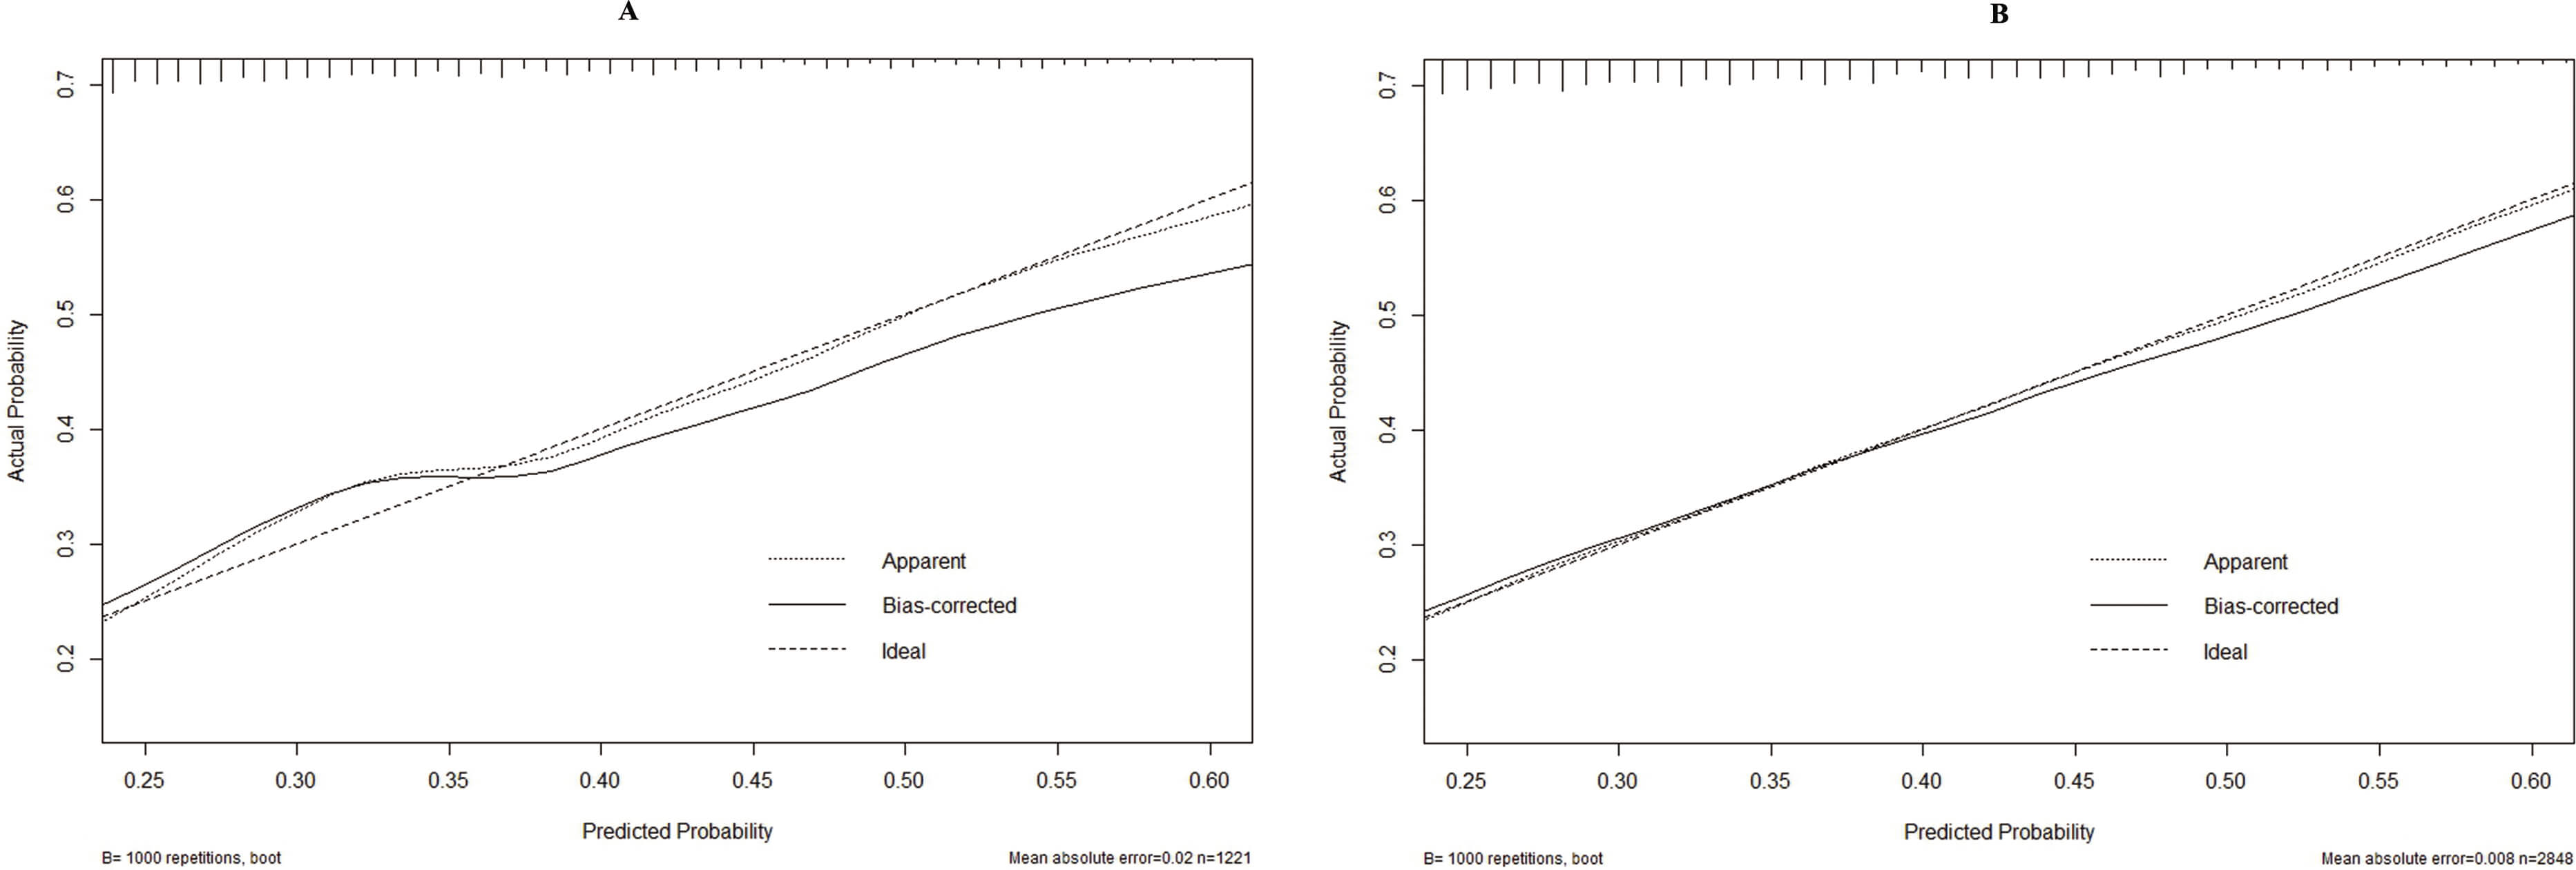 Fig. 2.
Calibration curves of the predictive model. (A) Training cohort. (B) Validation cohort.
The receiver operating characteristic (ROC) curve was also plotted, and AUC was calculated. The AUCs for the training and validation cohorts were 0.659 (95% confidence interval (CI): 0.638–0.680) and 0.656 (95% CI: 0.623–0.688), respectively, demonstrating good discriminative ability of the predictive model. For the training cohort, the optimal cut-off value was 0.305, corresponding to a sensitivity of 56.0% and a specificity of 67.9%. In the validation cohort, the optimal cut-off value was 0.276, with a sensitivity of 53.4% and a specificity of 71.3% (Fig. 3).
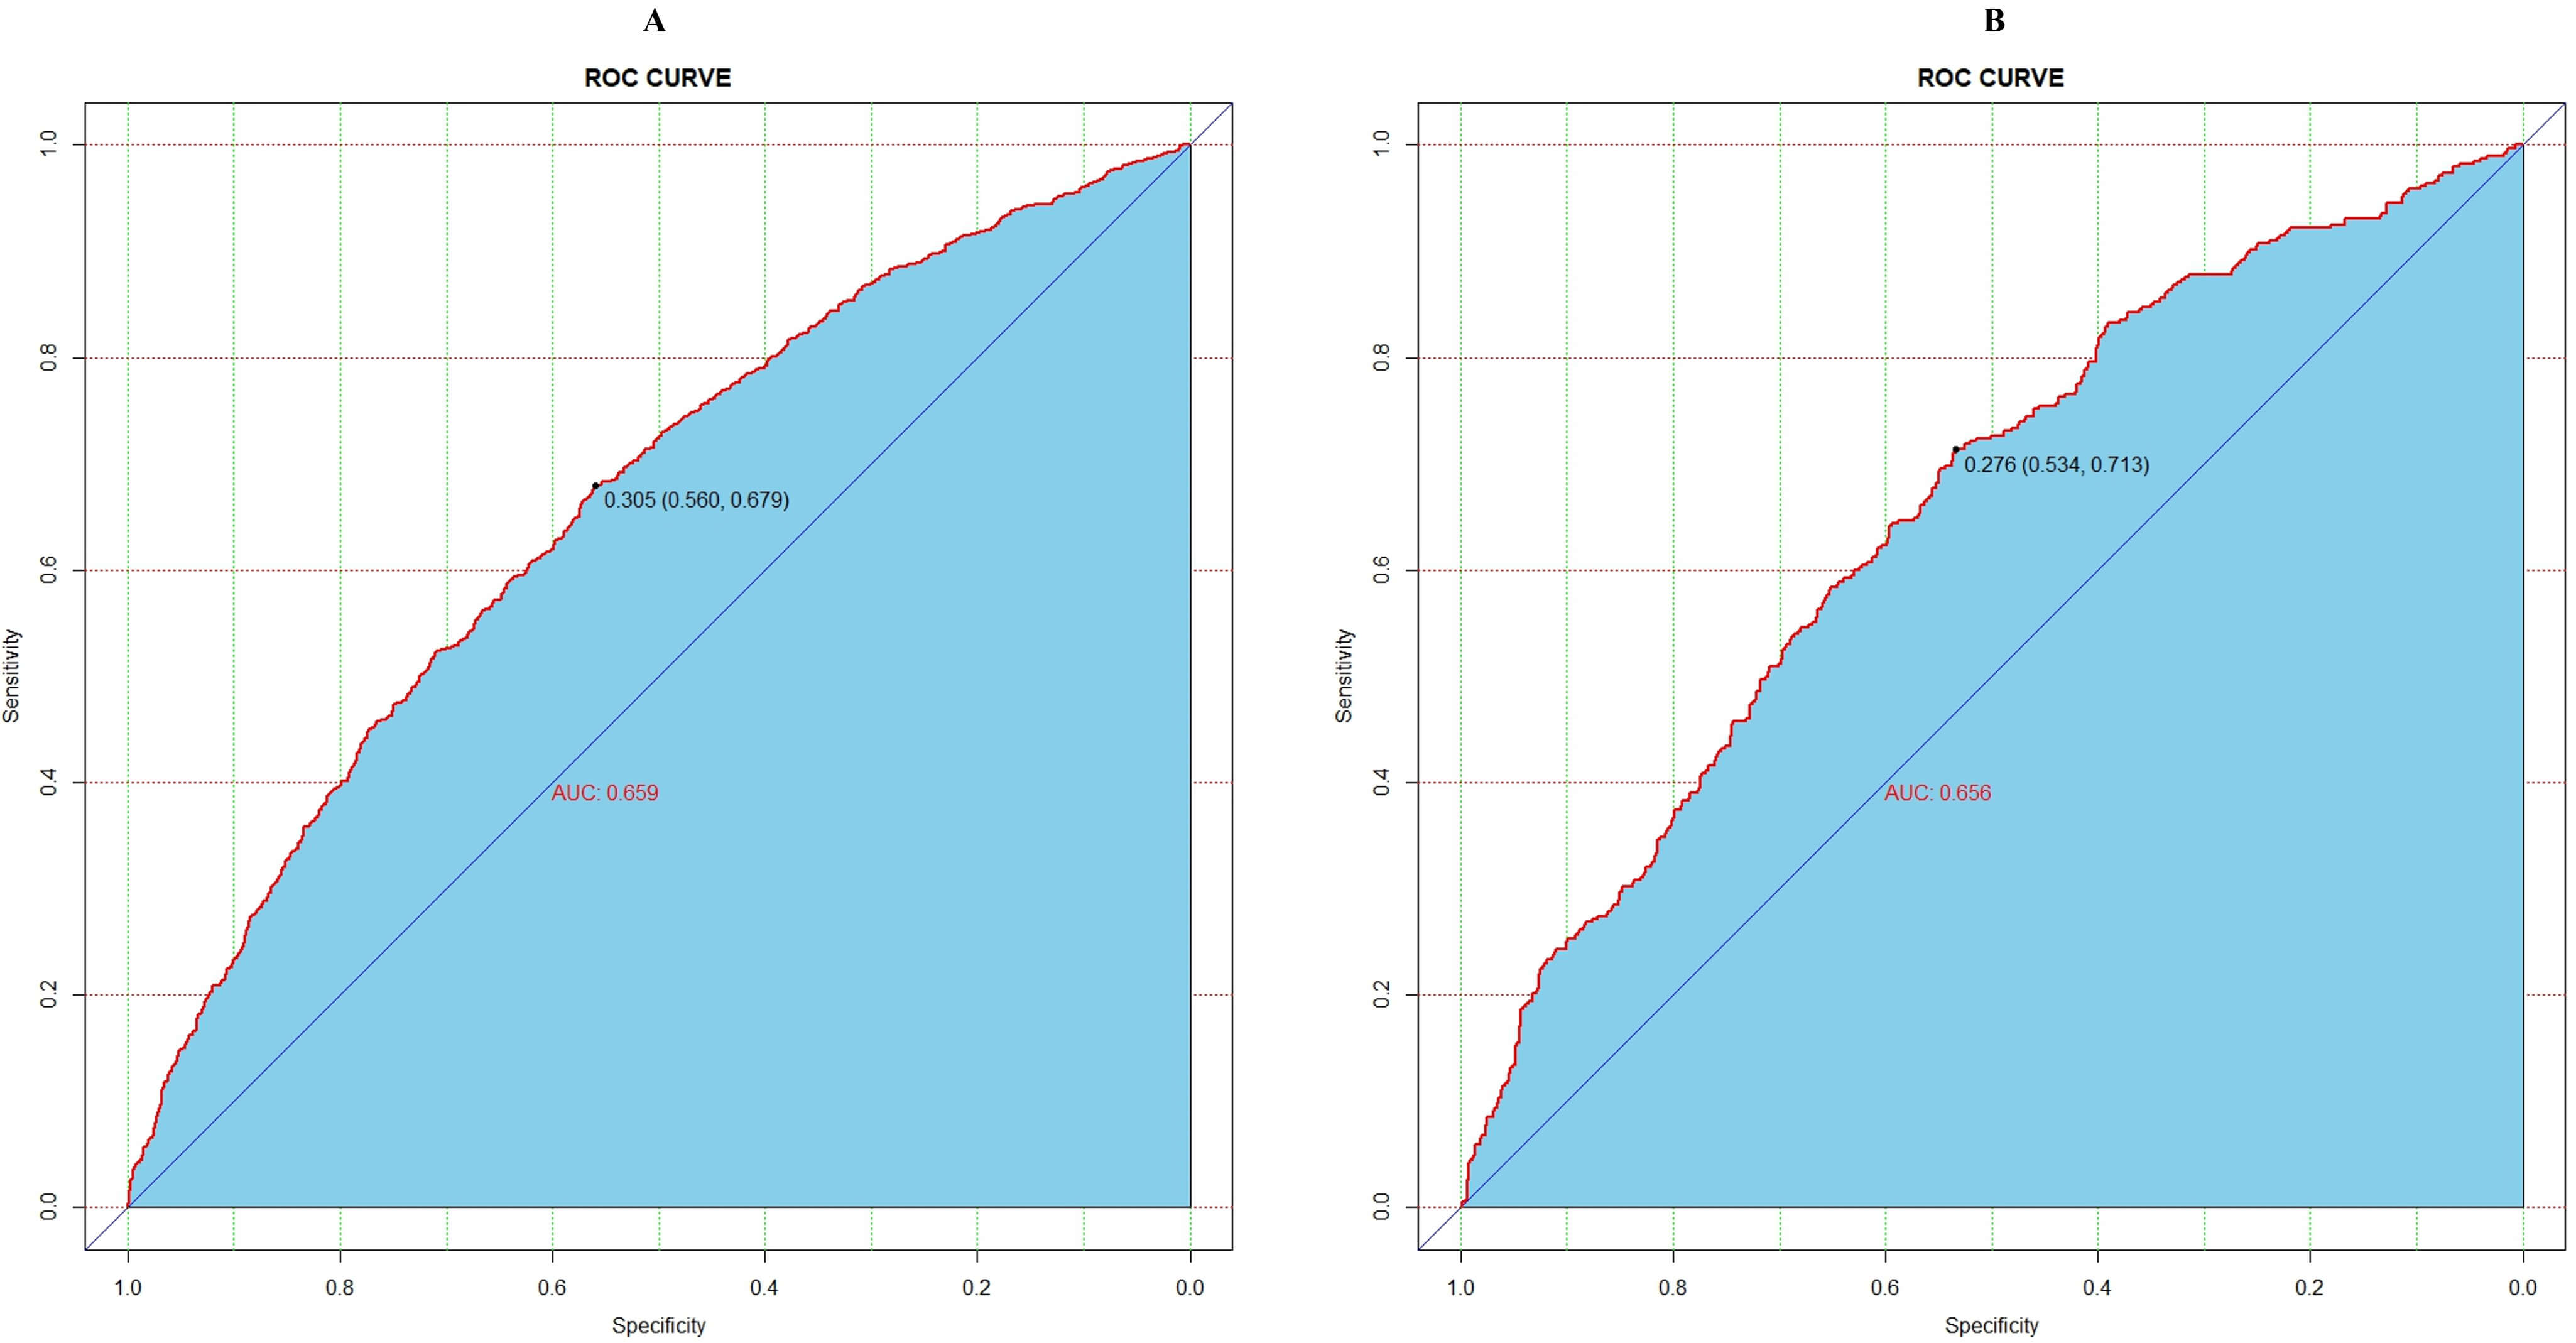 Fig. 3.
Receiver operating characteristic (ROC) curve for assessing the performance of the predictive model. (A) Training cohort. (B) Validation cohort. AUC, area under the curve.
To evaluate the clinical value of the model and its relevance to
decision-making, DCA was performed [19]. The y-axis represents the calculated net
benefit, whereas the x-axis denotes the threshold probability (Pt) for different
outcomes [19]. The blue wavy line represents the net benefit of the predictive model, while the gray curves correspond to the strategies of treating none (predicted probability [Pi]
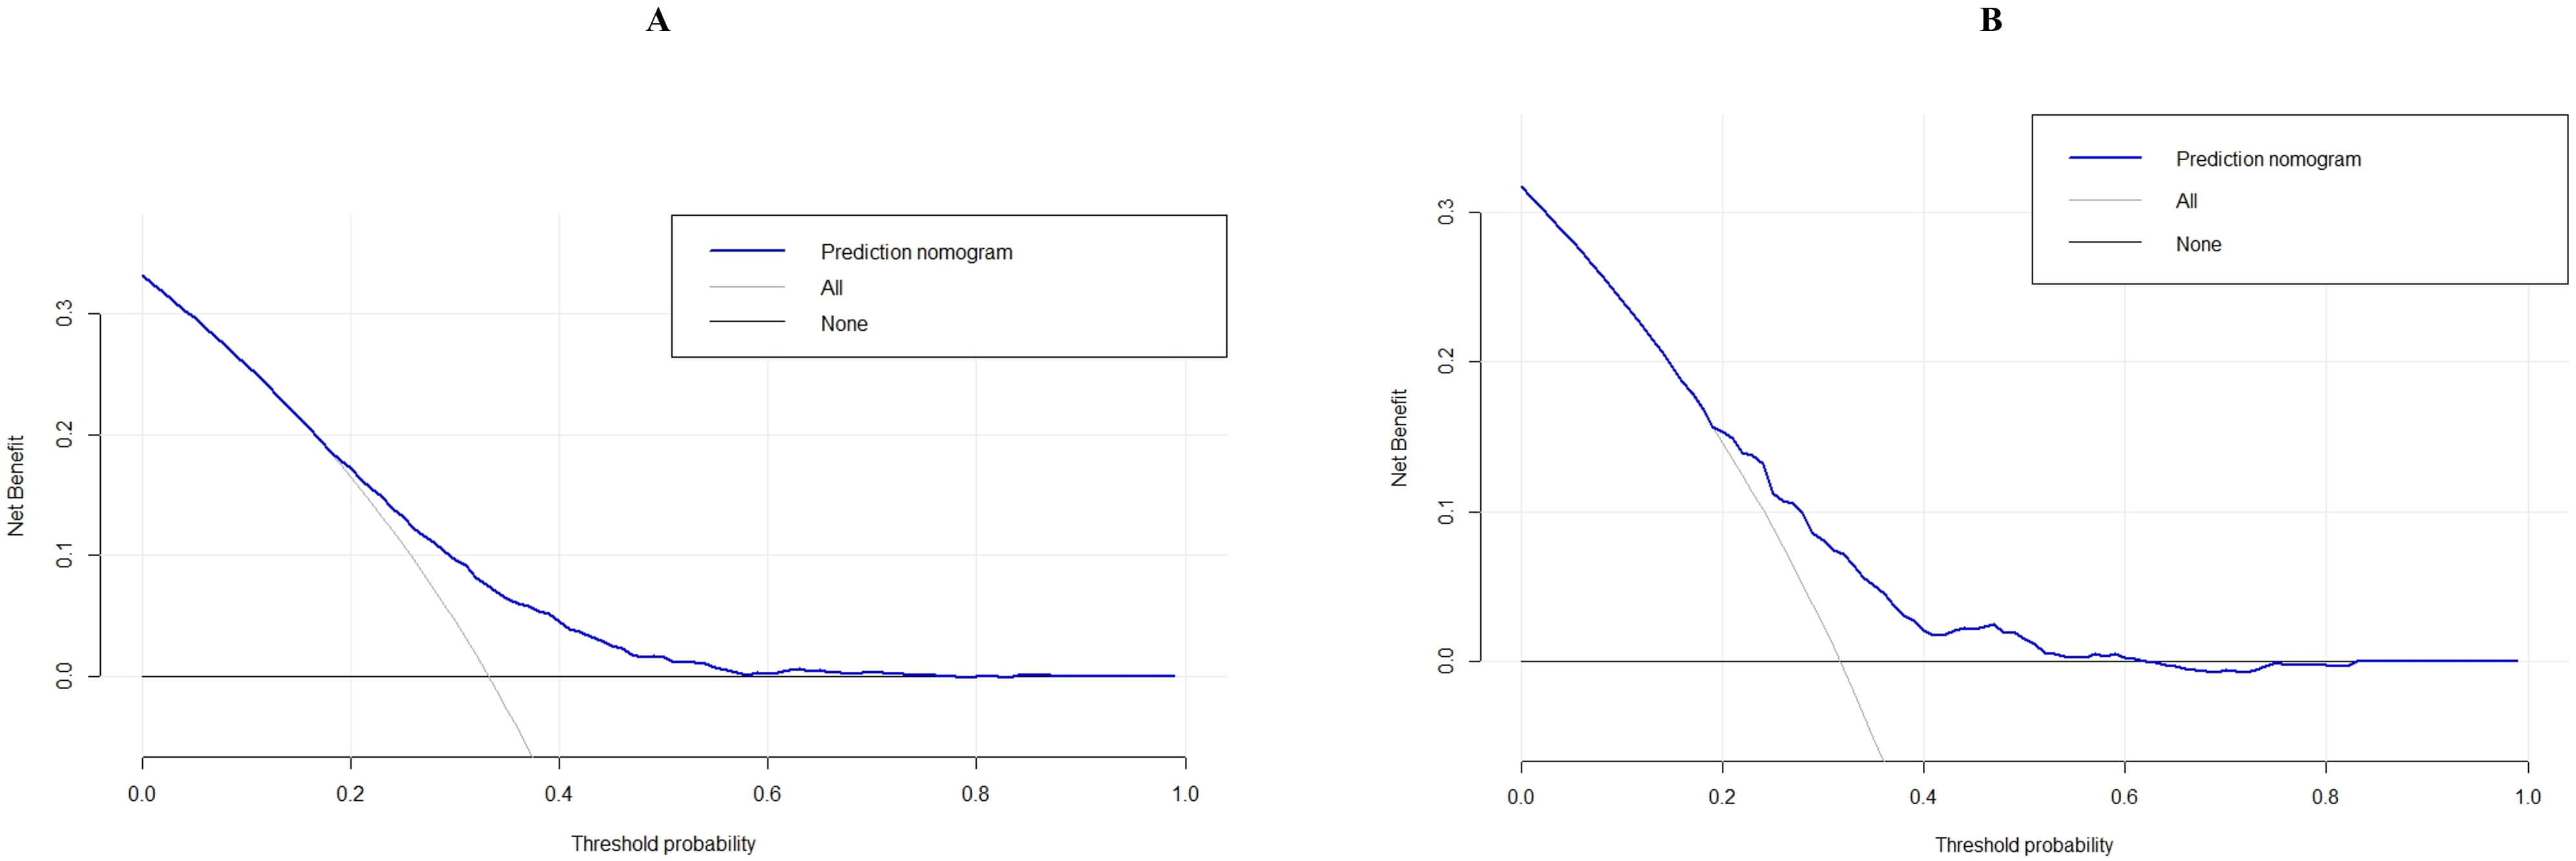 Fig. 4.
Decision curve analysis (DCA) of the predictive model. (A) Training cohort. (B) Validation cohort.
In critically ill patients, hypoxemia and respiratory dysfunction remain major clinical challenges. Conventional oxygen therapy methods, such as nasal cannulas or face masks, are often limited in their effectiveness among critically ill patients. HFNC therapy is a relatively recent modality that delivers warmed and humidified oxygen to the nasal cavity through a nasal cannula, with a high gas flow rate generating a mild positive pressure in the upper respiratory tract [20]. This mechanism reduces physiological dead space and alleviates respiratory effort. The proportion of inspired oxygen (FiO2%) can be adjusted by modifying the proportion of oxygen in the driving gas [20].
In recent years, HFNC has been increasingly applied as an effective clinical intervention to improve oxygenation in critically ill patients, with significant effects. Evidence indicates that HFNC is more comfortable and effective than face mask or nasal cannula oxygen therapy for individuals with respiratory failure of various etiologies [20]. A meta-analysis further demonstrated that, compared with conventional oxygen therapy or non-invasive mechanical ventilation (NIMV), HFNC significantly reduces intubation rates, MV requirements, and the need for respiratory support device replacement [21]. In particular, HFNC therapy, which incorporates humidification, offers significant benefits for critically ill patients.
However, as the disease progresses, MV may become necessary to optimize oxygenation during resuscitation, and HFNC has inherent limitations as a first-line resuscitative measure [9]. Therefore, early identification of patient deterioration and timely preparation for MV are crucial. A well-constructed predictive model can assist clinicians in recognizing patients at increased risk of requiring MV at an early stage.
The present study analyzed data from 4069 patients who met the inclusion criteria and received HFNC therapy, as recorded in the MIMIC-IV database. The primary endpoint of the study was the initiation of MV among HFNC-treated patients. The analysis incorporated the demographic characteristics, clinical parameters, and laboratory indicators of the patients. Eventually, body weight, Sepsis-3 score, pulmonary score in the LODS, urine output score in the OASIS score, PaO2/FiO2 ratio, GCS, and creatinine score in the SOFA score were identified as significant independent factors influencing the likelihood of patients receiving HFNC requiring MV. These factors were subsequently integrated into the decision curve analysis to construct the predictive model.
In this study, body weight was identified as a significant independent risk factor for patients receiving HFNC therapy who eventually required MV. These findings are consistent with previous studies demonstrating that obesity is associated with an increased likelihood of requiring MV among critically ill patients. For example, a prospective study by Tafelski et al. (2016) [22] reported that obesity was significantly associated with an increased need for MV. Similarly, a retrospective cohort study conducted by Shao et al. (2020) [23] found that obese patients were more likely to require prolonged MV.
The mechanism underlying this association may be that, following weight gain, the diaphragm is subjected to increased mechanical load from the abdominal and thoracic walls, leading to reduced lung compliance, alveolar collapse, and hypoxemia [24]. To maintain sufficient oxygen saturation (SpO2), higher pleural pressure (Ppl) and airway pressure are required, which may subsequently reduce cardiac output, offsetting the benefit of improved SpO2 and leading to no change or even a decrease in oxygen delivery (DO2), a critical determinant of tissue oxygenation [25]. This study also observed that higher body weight corresponded to higher individual scores and increased risk ratios for MV, indicating that body weight is an important factor to consider when predicting the need for MV in critically ill patients receiving HFNC therapy.
The SOFA score, LODS, and OASIS are widely used tools for estimating ICU mortality, with the SOFA score being the most common measure for assessing the severity of organ dysfunction [26]. With the SOFA scoring system, creatinine is a key indicator of renal function [26]. Additionally, Bhattacharya et al. (2011) [26] demonstrated that calculating the SOFA score aids in predicting the prognosis of patients requiring MV.
In this study, variations in creatinine levels within the SOFA score indicated a direct correlation with increased risk of MV. The PaO2/FiO2 ratio is a critical indicator of respiratory function, reflecting the efficiency of pulmonary gas exchange under oxygen therapy [27]. Lee et al. (2021) [27] further validated that the PaO2/FiO2 ratio can predict the success of HFNC therapy in patients with pneumonia-induced acute respiratory failure.
The GCS is an established indicator for evaluating neurological function [28], and its value was not directly proportional to the risk of MV in this study. Overall, the findings of our study suggest that critically ill patients with severe physiological compromise may not be suitable for HFNC oxygen therapy and may instead require MV as a first-line treatment.
The nomogram established in this study revealed that patient weight, pulmonary function score, and urine output scores carry the highest predictive weights and rank among the top three indicators for evaluating the risk of MV in critically ill patients receiving HFNC therapy. This finding suggests that optimizing these three indicators may potentially reduce the likelihood of requiring MV. Consequently, focusing on these indicators during patient management may offer a promising approach to preventing the need for MV in critically ill patients receiving HFNC oxygen therapy.
Targeting interventions aimed at weight loss, improvement of pulmonary function, and optimization of urine output through interventions such as diuresis, fluid balance management, and pulmonary rehabilitation may lower the risk of MV in critically ill patients. Therefore, early identification of patients at high risk for MV using the developed nomogram can help clinicians prioritize these key indicators, potentially preventing the need for MV and improving overall patient outcomes.
Overall, this model is designed to assist frontline ICU clinicians in the early identification of deterioration among patients receiving HFNC therapy, thereby supporting timely escalation of care when appropriate, while avoiding unnecessary mechanical ventilation in patients who may still respond to non-invasive oxygen support.
This study has several limitations. First, the dataset used consisted solely of cases derived from the MIMIC-IV database, without incorporating external datasets from other reputable databases to evaluate the applicability and reliability of the model. This limitation may restrict the generalizability of the findings. Second, the study only examined the occurrence of MV during hospitalization as the primary outcome and did not conduct long-term follow-up to assess patient survival or post-discharge outcomes. Third, the analysis did not include variables related to medication usage or adjunctive therapies, which could influence respiratory status and thereby affect the accuracy of the model. Although the constructed nomogram demonstrated moderate discriminative capacity, its sensitivity and specificity were modest, underscoring the limited ability of the model to accurately classify patients at risk of HFNC failure. This limitation likely reflects the heterogeneity of critically ill patients and the constrained range of clinical variables extracted from the MIMIC-IV database. Moreover, the model demonstrated clinical usefulness primarily within low-to-moderate risk thresholds, as demonstrated by the DCA. The absence of net benefit beyond a probability threshold of 0.4 suggests limited clinical value at higher predicted risks, a common challenge in models developed from single-center ICU datasets, where high-risk populations may be underrepresented. Therefore, further extensive, well-designed prospective studies and robust external validations are necessary to enhance model performance and develop a more reliable, precise, dependable, and user-friendly predictive tool for clinical applications. Future research could integrate additional dynamic physiological measurements, laboratory biomarkers, and multi-center datasets to improve the discriminative power and clinical relevance of the model.
Furthermore, this study did not examine the potential effects of combining HFNC oxygen therapy with mask oxygen therapy, despite the clinical dilemma often encountered in choosing between these two approaches. This limitation was primarily due to the lack of relevant combination-therapy cases within the MIMIC-IV database. Future prospective investigations are warranted to evaluate whether sequential or combined use of these two modalities could improve clinical outcomes in patients with hypoxemia. By addressing these limitations, future studies can enhance the clinical value of the proposed nomogram and contribute to improved prognostic accuracy and patient outcomes among critically ill individuals receiving HFNC oxygen therapy.
We developed and validated a predictive nomogram for patients receiving HFNC therapy who ultimately required MV. The nomogram demonstrates good predictive performance and may serve as a valuable adjunct tool for clinicians considering whether to continue HFNC therapy or transition to MV in critically ill patients.
• Although high-flow nasal cannula (HFNC) therapy is widely applied in the management of respiratory failure, clinical outcomes remain heterogeneous.
• This study developed a predictive nomogram to estimate treatment outcomes in patients undergoing HFNC therapy.
• The predictive model incorporated clinically relevant variables, including body weight, Sepsis-3 status, pulmonary score, urine output score, PaO2/FiO2 ratio, GCS score, and creatinine score, and demonstrated strong discrimination and calibration performance.
• Internal validation using bootstrap resampling confirmed the robustness and stability of the model’s predictive performance.
• The proposed nomogram may support clinicians in making individualized, evidence-based decisions regarding the initiation and continuation of HFNC therapy.
The clinical data used to support the findings of this study were supplied by the Medical Information Mart for Intensive Care IV version 2.0 (MIMIC-IV v.2.0; https://www.physionet.org/content/mimiciv/2.0/). Although the database is publicly and freely available, researchers must complete the National Institutes of Health’s web-based course known as Protecting Human Research Participants to apply for permission to access the database.
Conceptualization: JJL. Data curation: JJL, YY. Methodology: YL. Software: YY. Writing—original draft: JJL. Writing—review and editing: YL. All authors contributed to the interpretation of data and to the final version of the manuscript. All authors contributed to revising the manuscript critically for important intellectual content. All authors read and approved the final manuscript. All authors have participated sufficiently in the work and agreed to be accountable for all aspects of the work.
The MIMIC-IV v.2.0 (https://www.physionet.org/content/mimiciv/2.0/) database has received ethical approval from the institutional review boards (IRBs) at Beth Israel Deaconess Medical Center and Massachusetts Institute of Technology. Because the database does not contain protected health information, a waiver of the requirements for informed consent was included in the IRB approval.
Not applicable.
This research received no external funding.
The authors declare no conflict of interest.
Supplementary material associated with this article can be found, in the online version, at https://doi.org/10.31083/BJHM50719.
References
Publisher’s Note: IMR Press stays neutral with regard to jurisdictional claims in published maps and institutional affiliations.