


1 Department of Critical Care Medicine, The People’s Hospital of Cangnan, Wenzhou Medical University, 325800 Wenzhou, Zhejiang, China
Abstract
Sepsis remains a challenging condition with high short-term mortality despite advances in intensive care, emphasizing the significance of early prognostic assessment in guiding treatment decisions. Inflammatory and nutritional-immune indices are well-established predictors of clinical outcomes in critically ill patients. This study aims to evaluate the prognostic significance of the systemic immune-inflammation index (SII) and the Naples Prognostic Score (NPS) in predicting 28-day survival outcomes among individuals diagnosed with sepsis. The study also aims to construct and assess a visual predictive tool—specifically, a nomogram—that incorporates both of these biomarkers.
This retrospective study analyzed clinical data recorded from patients with sepsis who were treated in the intensive care unit (ICU) of The People’s Hospital of Cangnan between January 2021 and December 2023. Applying pre-determined inclusion-exclusion criteria, 324 cases were ultimately included in the final analysis. Comprehensive baseline data, including clinical features and laboratory findings, were systematically retrieved from the electronic health record system. Mortality-associated markers were identified within 28 days using univariate analyses followed by multivariable logistic regression, with SII included as a continuous variable and NPS as a categorical variable. The predictive performance of SII and NPS, both individual and in combination, was assessed using receiver operating characteristic (ROC) curve. A predictive nomogram was developed, and the accuracy and clinical utility of the model were then evaluated using calibration plots and decision curve analysis (DCA).
The analysis revealed that higher SII values (p < 0.001) and NPS scores (≥2, p < 0.001) were closely associated with increased 28-day mortality. Multivariate logistic regression analysis identified SII (p < 0.001) and NPS (≥2, p < 0.001) as independent risk predictors. A predictive model was developed by combining both SII and NPS, demonstrating a superior area under the ROC curve [area under the curve (AUC): 0.846] compared to models utilizing either indicator alone. Furthermore, the nomogram that incorporated these two parameters exhibited high consistency between predicted probabilities and actual outcomes, while also demonstrating strong net clinical benefit in DCA.
SII and NPS are robust and independent predictors of short-term mortality in sepsis. The nomogram developed from these indicators offers a practical, data-driven approach to individualized risk prediction. This study highlights the clinical utility of integrating inflammatory and nutritional-immune indices in prognostic evaluation.
Keywords
- sepsis
- immune
- inflammation
- nutrition
- mortality
- nomogram
Sepsis remains a significant cause of adverse outcomes among critically ill individuals, predominantly driven by a dysregulated immune response to infection that results in life-threatening organ dysfunction [1, 2]. Annually, sepsis is estimated to affect approximately 49 million people worldwide, with about 11 million deaths, highlighting its substantial global health burden [3]. Diagnosis of sepsis relies on the Sepsis-3 criteria, which define the condition as life-threatening organ dysfunction caused by a dysregulated host response to infection [4]. Current treatment strategies emphasize the early administration of antibiotics, fluid resuscitation, hemodynamic support, and organ support therapies [5, 6]. Despite these clinical interventions, heterogeneity in disease progression and treatment response complicates clinical management, and mortality rates in septic shock remain unacceptably high.
Numerous clinical scoring systems, including the sequential organ failure assessment (SOFA) and the acute physiology and chronic health evaluation II (APACHE II), are widely used for risk stratification in septic patients [7, 8]. Nonetheless, these models often fail to reflect real-time alterations in immune status and nutritional reserves, both of which play critical roles in the onset and progression of the condition [9, 10, 11]. Recent studies have emphasized the prognostic significance of composite biomarkers that integrate inflammatory and nutritional parameters, demonstrating their potential in enhancing outcomes prediction across various critical illnesses [12, 13, 14].
The systemic immune-inflammation index (SII), derived from platelet (PLT), neutrophil (NEUT), and lymphocyte (LYMPH) counts, serves as a composite measure of both pro-inflammatory activity and immune surveillance [15, 16]. Likewise, the Naples Prognostic Score (NPS) incorporates parameters such as serum albumin, total cholesterol (TC), neutrophil-to-lymphocyte ratio (NLR), and lymphocyte-to-monocyte ratio (LMR), thereby providing a multidimensional assessment of inflammation and nutritional status [17, 18]. While these indices have shown prognostic relevance in oncology and cardiovascular diseases, their role in sepsis remains to be elucidated [19, 20, 21, 22].
Therefore, this study focused on assessing the prognostic implications of SII and NPS in individuals with sepsis, and constructing a nomogram model incorporating these indicators. By integrating routinely available hematological and biochemical parameters, we aimed to establish a practical, cost-effective, and easily applicable prognostic tool for individualized risk stratification in clinical settings. Such an approach may enhance the early recognition of high-risk patients, thereby supporting prompt and targeted therapeutic decision-making. Additionally, the study provides insights into the complex interaction between systemic inflammatory responses, immune dysregulation, and nutritional decline during sepsis progression, providing a novel perspective for prognostic evaluation in critical care.
This retrospective study analyzed the clinical data from 324 sepsis patients admitted to the intensive care unit (ICU) of The People’s Hospital of Cangnan, China, between January 1, 2021 and December 31, 2023. Sepsis was defined based on the Sepsis-3 criteria [4], particularly as sepsis accompanied by persistent hypotension requiring vasopressor therapy to maintain a mean arterial pressure (MAP) of at least 65 mmHg, along with a serum lactate level higher than 2 mmol/L despite adequate fluid resuscitation.
The criteria for patient inclusion were as follows: (1) a confirmed diagnosis of
sepsis; (2) age
As shown in Fig. 1, a total of 953 patients were initially screened, of whom 324 patients met the eligibility criteria and were included in the study cohort (135 survivors and 189 non-survivors).
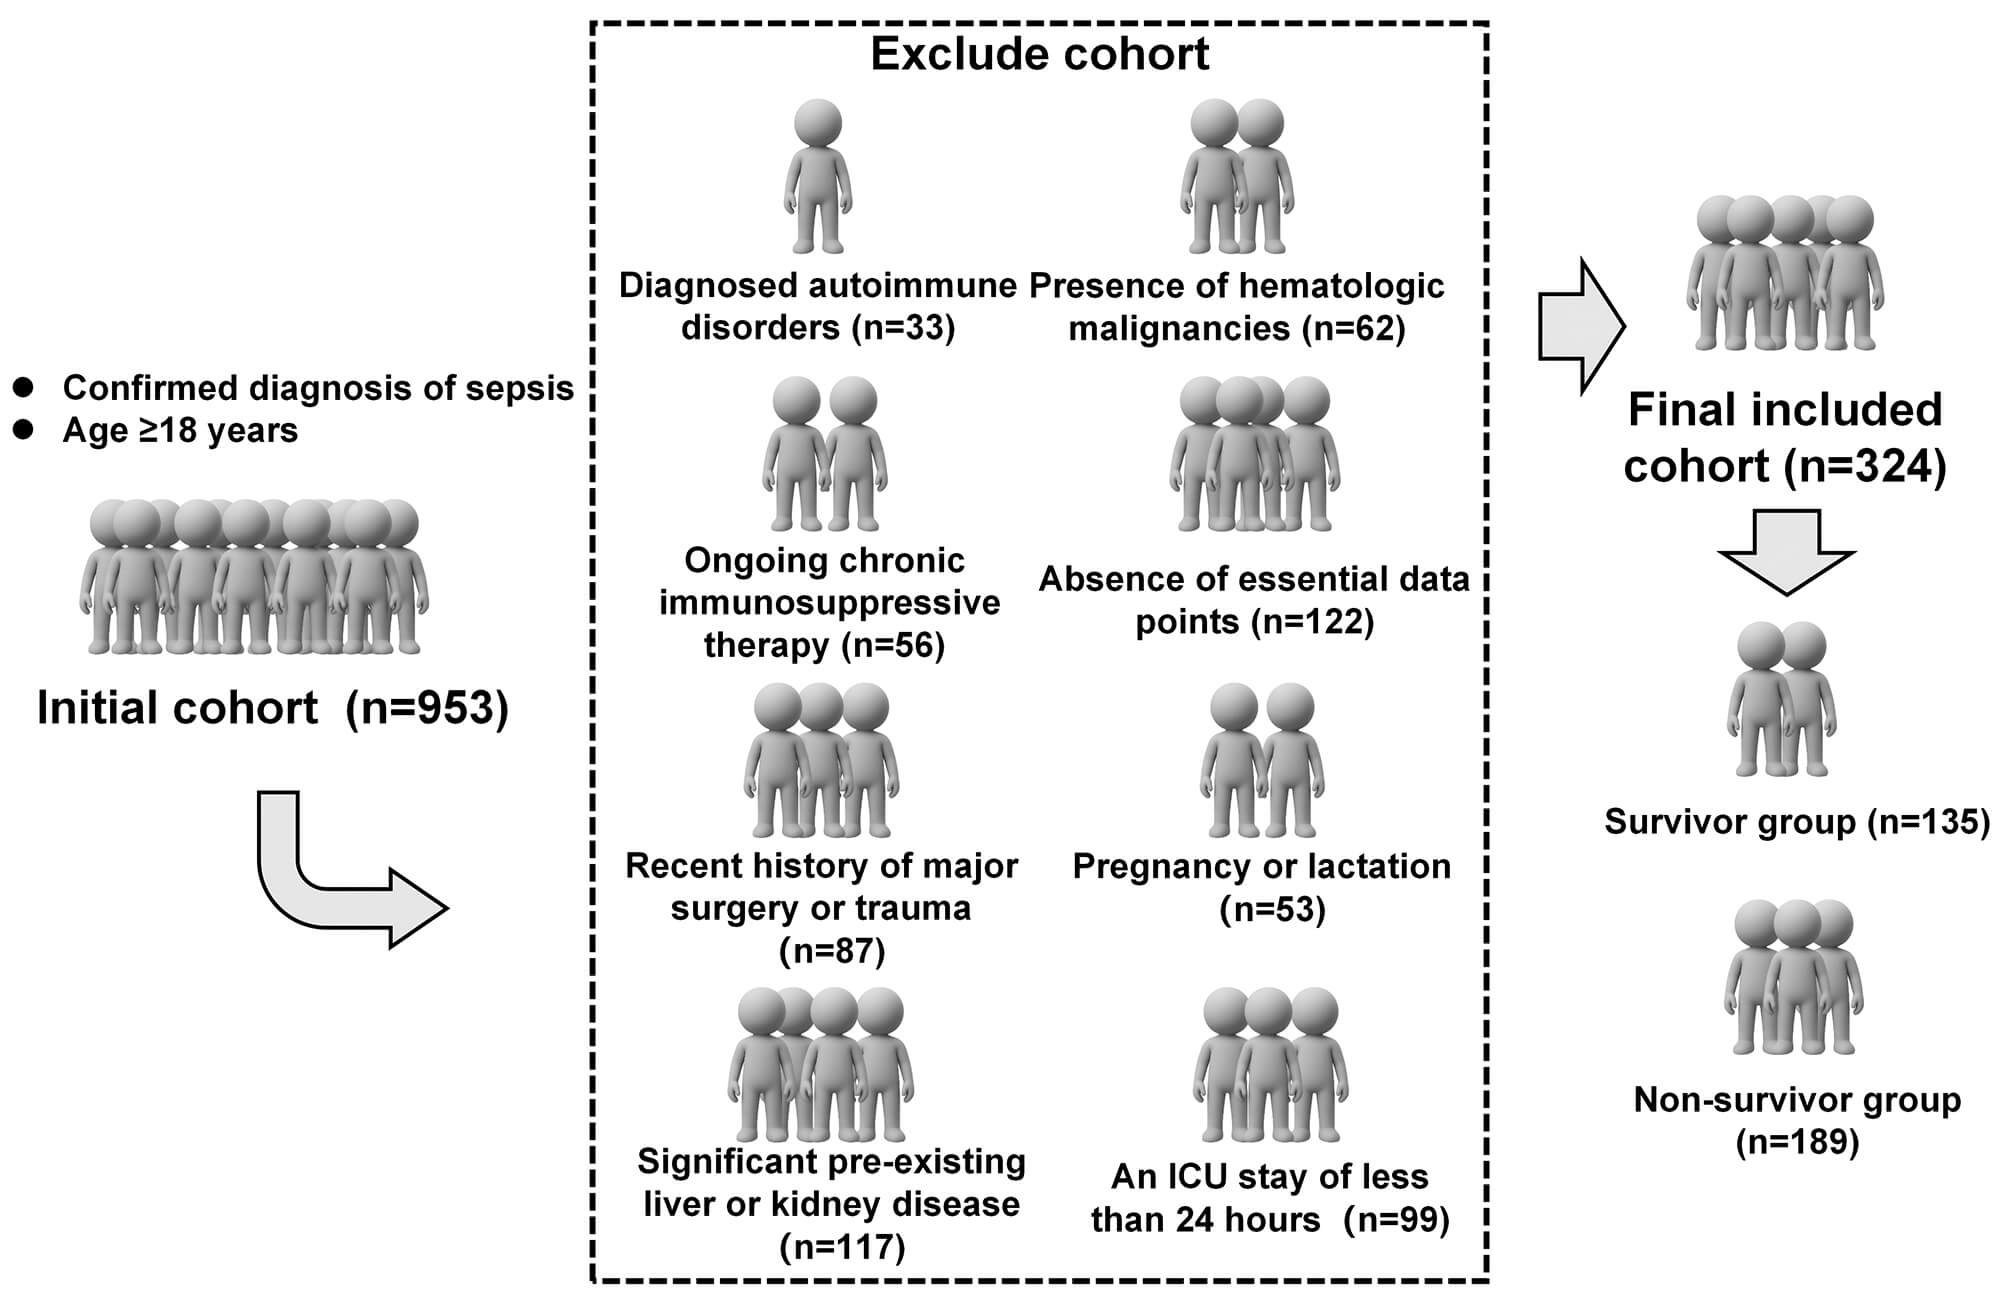 Fig. 1.
A flowchart of patient selection. The schematic plan was created using Microsoft PowerPoint (Office 2021; Microsoft Corporation, Redmond, WA, USA). The authors have no financial or personal relationship with Microsoft Corporation, and the use of this tool does not imply any endorsement. Abbreviation: ICU, intensive care unit.
Patient characteristics and clinical parameters were retrieved from the electronic medical record system. Key variables included age, sex, body mass index (BMI), MAP, underlying comorbidities, number of organ dysfunctions, use of renal replacement therapy, duration of mechanical ventilation, ICU length of stay, and 28-day survival status. Laboratory data obtained within the first 24 hours of admission were also recorded, including white blood cell (WBC) count, NEUT, LYMPH, monocyte (MON), and PLT counts; alanine aminotransferase (ALT); aspartate aminotransferase (AST); C-reactive protein (CRP); procalcitonin (PCT); serum albumin; TC; low-density lipoprotein cholesterol (LDL-C); and high-density lipoprotein cholesterol (HDL-C). Additionally, disease severity was assessed using SOFA and APACHE II scores, as described by Vincent et al. [23] and Knaus et al. [24], respectively. All evaluations were performed by experienced ICU physicians to ensure consistency and accuracy.
Inflammatory markers were calculated as follows: NLR = NEUT / LYMPH;
platelet-to-lymphocyte ratio (PLR) = PLT / LYMPH; LMR = LYMPH / MON; and SII =
PLT
The NPS, originally proposed by Galizia et al. [26], integrates four
biomarkers: serum albumin (
Statistical analyses were performed using R software (version 4.3.2; R
Foundation for Statistical Computing, Vienna, Austria), with a p-value
To identify potential predictors of 28-day mortality, preliminary hypothesis
testing was conducted to determine variables with statistically significant
differences between survivor and non-survivor groups. Variables demonstrating a
p-value
Four predictive models were developed: Model A, the baseline model including conventional predictors; Model B, the baseline + SII; Model C, the baseline + NPS; and Model D, the baseline + SII + NPS. Model performance was examined using receiver operating characteristic (ROC) curves, with the area under the curve (AUC) calculated for each model. Optimal cut-off values were determined using the Youden index, and corresponding sensitivity, specificity, and p values (compared to AUC = 0.5) were calculated to assess the model’s discriminative ability. Calibration was evaluated using calibration plots, and clinical significance was determined with decision curve analysis (DCA). Finally, a nomogram was generated from the final multivariate logistic regression model to facilitate individualized risk estimation.
A total of 324 individuals with sepsis were retrospectively analyzed, of whom 135 individuals were classified into the 28-day survivor group and 189 into the non-survivor group. Baseline demographic and clinical characteristics of the two study cohorts are detailed in Table 1.
| Variable | Survivor group (n = 135) | Non-survivor group (n = 189) | Z/t/ |
p-value |
| Age (years) | 70 (60, 80) | 70 (61.5, 79) | –0.022 | 0.982 |
| Sex (Male) | 104 (77.04%) | 137 (72.49%) | 0.856 | 0.355 |
| BMI (kg/m2) | 23.03 (20.69, 24.97) | 22.75 (19.96, 25.62) | –0.249 | 0.803 |
| MAP (mmHg) | 86.62 (74.67, 98.92) | 86.06 (75.48, 96.25) | –0.121 | 0.903 |
| Hypertension | 77 (57.04%) | 100 (52.91%) | 0.541 | 0.462 |
| Diabetes | 45 (33.33%) | 59 (31.22%) | 0.162 | 0.687 |
| Coronary heart disease | 28 (20.74%) | 61 (32.28%) | 5.259 | 0.022 |
| Stroke | 12 (8.89%) | 22 (11.64%) | 0.635 | 0.426 |
| Number of organ dysfunction | 1 (1, 2) | 1 (1, 2) | 2.011 | 0.044 |
| Renal replacement therapy | 15 (11.11%) | 35 (18.52%) | 3.311 | 0.069 |
| Duration of mechanical ventilation (days) | 7 (4, 10) | 6 (2, 9) | –1.641 | 0.101 |
| ICU length of stay | 11 (8, 14) | 9 (5, 12) | –3.204 | 0.001 |
| SOFA | 8.84 |
10.15 |
–3.487 | 0.001 |
| APACHE II | 17.5 |
19.36 |
–2.593 | 0.010 |
| WBC count (109/L) | 12.97 (9.15, 16.74) | 13.70 (9.90, 17.02) | 0.447 | 0.655 |
| NEUT (109/L) | 5.31 |
5.87 |
–3.099 | 0.002 |
| LYMPH (109/L) | 2.14 |
1.60 |
7.948 | |
| MON (109/L) | 0.61 (0.32, 0.85) | 0.55 (0.32, 0.77) | –0.982 | 0.326 |
| PLT (109/L) | 165.13 (129.74, 194.30) | 196.42 (149.12, 240.23) | 4.755 | |
| ALT (U/L) | 37.27 |
39.95 |
–1.618 | 0.107 |
| AST (U/L) | 50.15 |
48.05 |
0.983 | 0.326 |
| CRP (mg/L) | 114.83 (83.55, 187.52) | 122.42 (69.55, 190.88) | –0.115 | 0.909 |
| PCT (ng/mL) | 8.49 (4.19, 21.49) | 7.27 (2.21, 19.77) | –1.898 | 0.058 |
| Alb (g/L) | 31.19 |
30.12 |
2.101 | 0.036 |
| TC (mmol/L) | 1.43 |
1.28 |
2.499 | 0.013 |
| LDL-C (mmol/L) | 1.82 |
1.69 |
2.288 | 0.023 |
| HDL-C (mmol/L) | 0.86 |
0.81 |
1.264 | 0.207 |
| NLR | 2.56 (1.85, 3.46) | 3.26 (2.47, 4.19) | 4.322 | |
| PLR | 81.99 (53.25, 107.48) | 101.57 (77.74, 135.05) | 4.804 | |
| LMR | 3.47 (2.57, 5.63) | 3.14 (2.16, 5.50) | –1.173 | 0.241 |
| NPS ( |
17 (12.59%) | 111 (58.73%) | 70.14 | |
| SII | 418.92 (247.13, 600.59) | 675.01 (466.75, 974.85) | 7.305 |
Abbreviations: t, Student’s t-test; Z, Mann–Whitney
U test;
Compared with the survivor group, individuals in the non-survivor group
exhibited a significantly greater prevalence of coronary heart disease
(p = 0.022), more organ dysfunctions (p = 0.044), shorter ICU
length of stay (p = 0.001), and higher SOFA (p = 0.001) and
APACHE II scores (p = 0.010). Laboratory findings revealed substantially
elevated NEUT (p = 0.002), PLT (p
Collinearity diagnostics were performed on variables that demonstrated
statistical significance (p
| Factor | Unstandardized coefficients | Standardized coefficients beta | t | p-value | Collinearity statistics | ||
| B | SE | Tolerance Value | VIF | ||||
| Coronary heart disease | 0.038 | 0.053 | 0.035 | 0.727 | 0.468 | 0.945 | 1.058 |
| Number of organ dysfunction | 0.065 | 0.030 | 0.102 | 2.177 | 0.030 | 0.979 | 1.021 |
| ICU length of stay | –0.021 | 0.005 | –0.180 | –3.843 | 0.978 | 1.022 | |
| SOFA | 0.019 | 0.007 | 0.133 | 2.846 | 0.005 | 0.976 | 1.025 |
| APACHE II | 0.008 | 0.004 | 0.106 | 2.253 | 0.025 | 0.974 | 1.027 |
| NEUT | –0.022 | 0.018 | –0.071 | –1.242 | 0.215 | 0.652 | 1.533 |
| TC | –0.050 | 0.045 | –0.053 | –1.125 | 0.261 | 0.951 | 1.051 |
| NPS | 0.355 | 0.055 | 0.352 | 6.496 | 0.727 | 1.375 | |
| SII | 0.234 | 3.866 | 0.584 | 1.713 | |||
Abbreviations: B, unstandardized regression coefficient; SE, standard error; VIF, variance inflation factor.
A logistic regression model was constructed using variables retained after screening, included coronary heart disease, number of organ dysfunctions, ICU length of stay, SOFA score, APACHE II score, NPS, and SII. As shown in Table 3, coronary heart disease (p = 0.393) was not statistically associated with 28-day mortality.
| Factor | SE | Wald | p-value | OR | 95% CI | |
| Coronary heart disease | 0.279 | 0.327 | 0.730 | 0.393 | 1.322 | 0.697–2.507 |
| Number of organ dysfunction | 0.360 | 0.182 | 3.891 | 0.049 | 1.433 | 1.002–2.049 |
| ICU length of stay | –0.128 | 0.035 | 13.557 | 0.880 | 0.821–0.942 | |
| SOFA | 0.133 | 0.044 | 8.913 | 0.003 | 1.142 | 1.047–1.246 |
| APACHE II | 0.053 | 0.023 | 5.192 | 0.023 | 1.054 | 1.007–1.103 |
| NPS | 1.895 | 0.346 | 30.068 | 6.655 | 3.380–13.104 | |
| SII | 0.002 | 15.161 | 1.002 | 1.001–1.003 |
Abbreviations:
In contrast, elevated SII [odds ratio (OR) = 1.002, 95% confidence interval
(CI): 1.001–1.003, p
To assess the incremental prognostic significance of SII and NPS in predicting 28-day mortality among sepsis patients, hierarchical regression models were constructed. Model 1 (the baseline model) incorporated conventional predictors, including the number of organ dysfunctions, ICU length of stay, SOFA score, and APACHE II score. Model 2 added SII to the baseline predictors, Model 3 added NPS, and Model 4 integrated both SII and NPS with the baseline model.
The ROC curves for the four models are shown in Fig. 2, and the corresponding
AUC, sensitivity, and specificity values are summarized in Table 4. Model 1
showed a cut-off value of 0.603 and achieved an AUC of 0.698 (95% CI:
0.640–0.756, p
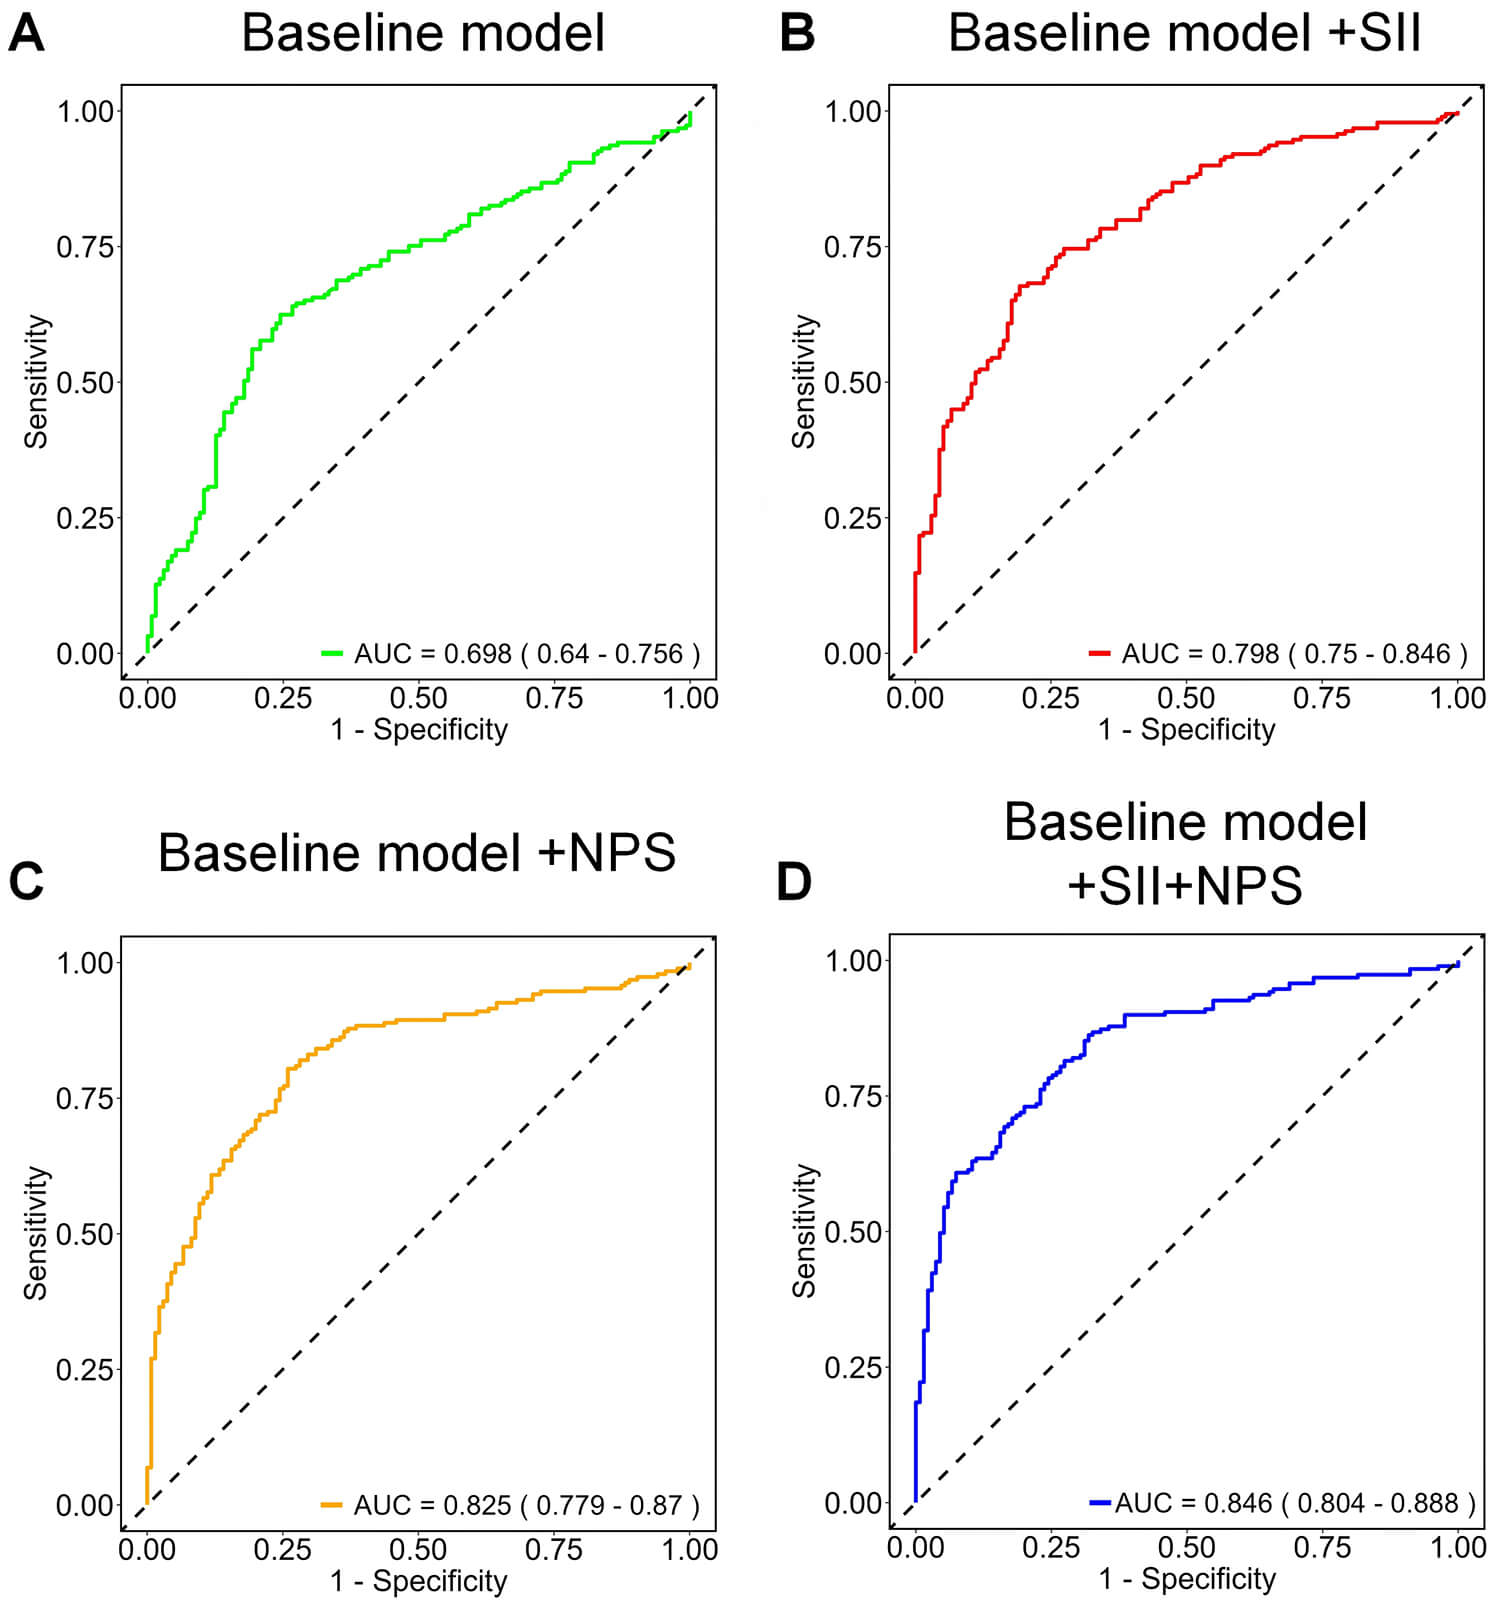 Fig. 2.
ROC analysis of four predictive models for 28-day mortality in sepsis. The baseline model (A) included the number of organ dysfunctions, ICU length of stay, SOFA score, and APACHE II score. The addition of the SII in Model 2 (B), NPS in Model 3 (C), while Model 4 (D), integrating both SII and NPS, achieved the best overall predictive performance. Abbreviations: AUC, area under the curve; ROC, receiver operating characteristic.
| Indicator | AUC (95% CI) | Sensitivity (%) | Specificity (%) | Cut-off | p-value |
| Baseline model | 0.698 (0.640–0.756) | 62.4 | 75.6 | 0.603 | |
| Basic model + SII | 0.798 (0.750–0.846) | 66.7 | 80.7 | 0.597 | |
| Basic model + NPS | 0.825 (0.779–0.870) | 80.4 | 74.1 | 0.488 | |
| Basic model + SII + NPS | 0.846 (0.804–0.888) | 86.2 | 68.1 | 0.420 |
Finally, the combined model integrating both SII and NPS (Model 4) yielded the
highest discriminative performance, with an AUC of 0.846 (95% CI: 0.804–0.888,
p
Utilizing the predictors retained in the final multivariate logistic regression model (Model 4), a nomogram was constructed as a visual prediction tool (Fig. 3), which integrated all independent predictors, including SII and NPS. The calibration curve demonstrated a close concordance between estimated and observed probabilities of mortality (Fig. 4A), indicating high calibration accuracy. Furthermore, DCA revealed the significant clinical significance of the nomogram across a broad range of risk thresholds (Fig. 4B), reinforcing its role in guiding patient-specific clinical decision-making in sepsis management.
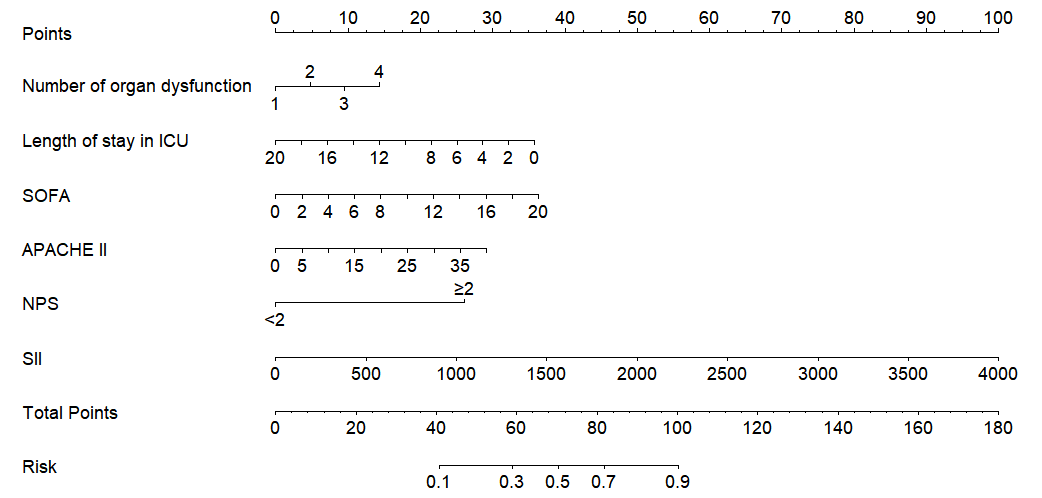 Fig. 3.
Prognostic nomogram for short-term mortality in septic patients.
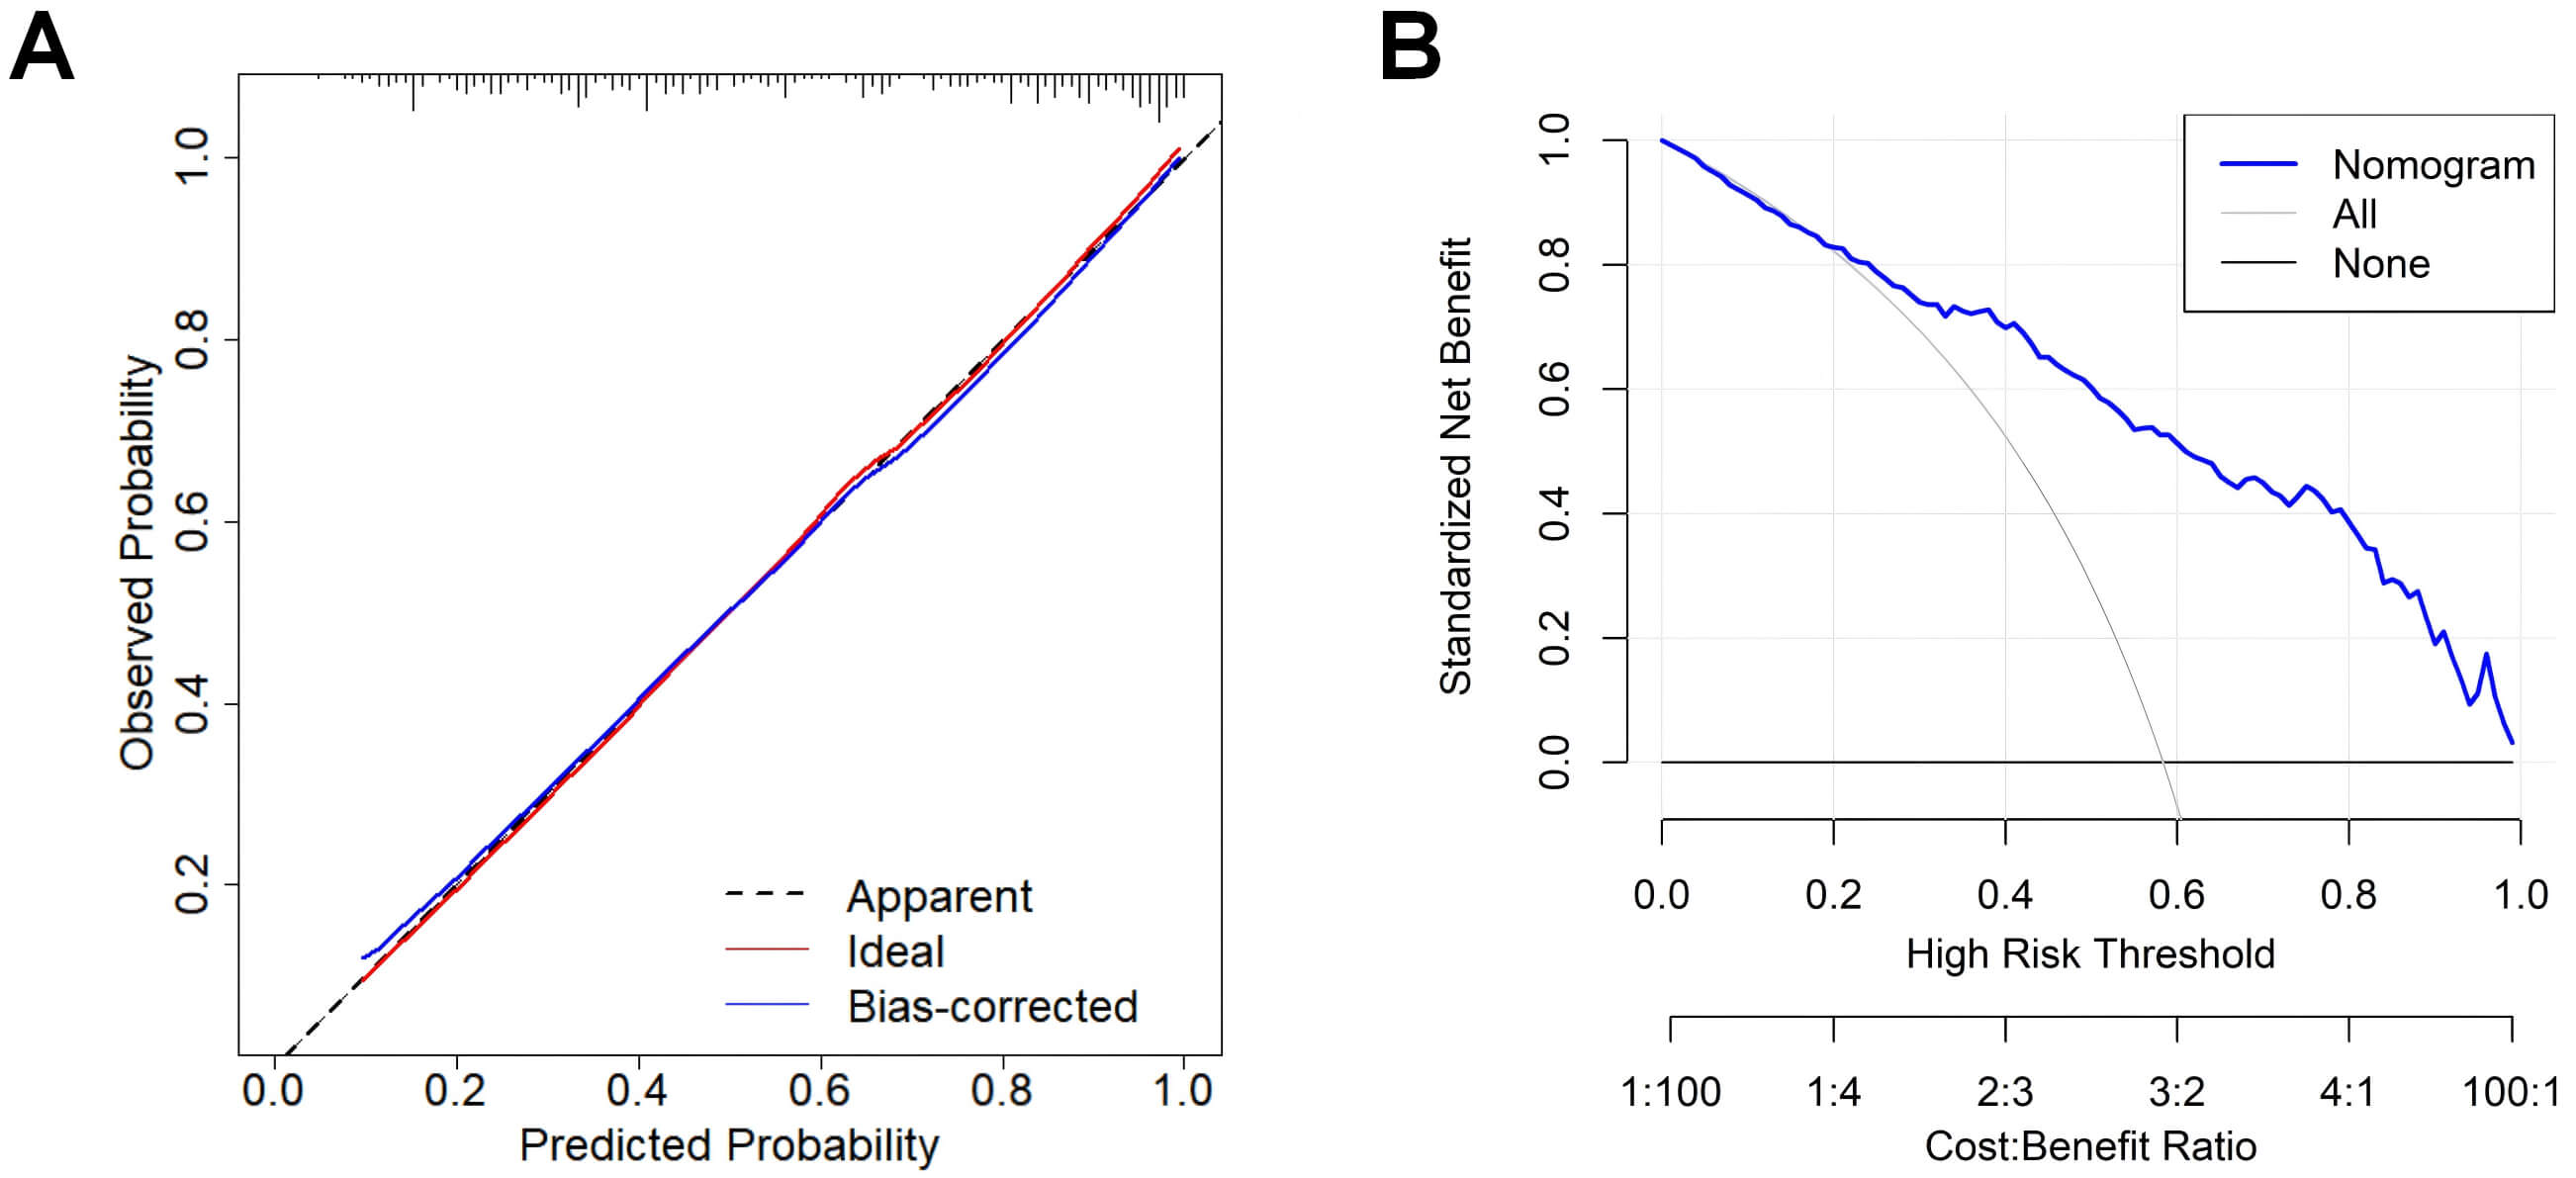 Fig. 4.
Calibration and DCA of the nomogram for predicting 28-day mortality in sepsis. (A) Calibration curve based on the final logistic regression model (Model 4). (B) DCA for the nomogram based on Model 4. Abbreviation: DCA, decision curve analysis.
This study comprehensively evaluated the prognostic application of SII and NPS
in predicting 28-day mortality among sepsis patients. Our analysis demonstrated
that both elevated SII and NPS
The SII, a composite marker derived from NEUT, LYMPH, and PLT counts, reflects both inflammatory activity and immune competence. Initially proposed as a prognostic indicator in oncology, it has since demonstrated significance across a variety of conditions, including cardiac diseases, autoimmune pathologies, and acute critical illnesses. In sepsis, evidence has revealed a correlation between higher SII levels and adverse outcomes [27]. Our study reinforces this association, demonstrating that elevated SII is independently linked to increased risk of early mortality, even after adjusting for established severity scores such as SOFA and APACHE II. Although direct comparisons were beyond the scope of this study, the findings imply that SII offers unique prognostic information complementary to traditional scoring systems. Increased SII may reflect a state of higher systemic inflammation combined with impaired adaptive immunity, potentially contributing to organ dysfunction, reduced pathogen clearance, and worse outcomes. These mechanisms may underlie the observed association between higher SII values and increased mortality, although further studies are needed to confirm this hypothesis.
The NPS, which incorporates inflammatory markers (NLR and LMR) along with nutritional indicators (serum albumin and TC), was originally formulated for oncology patients to evaluate both systemic inflammation and nutritional deficits. Unlike with other commonly used nutritional risk scores in critical care, such as NRS-2002 or modified Nutrition Risk in the Critically Ill (mNUTRIC) score, NPS integrates inflammatory and nutritional parameters into a single, easily obtainable score, potentially enhancing early risk stratification in the ICU setting [28, 29]. In our cohort, an NPS score of 2 or higher was independently associated with higher 28-day mortality. This association may be due to the combined effects of malnutrition and immune dysregulation on sepsis outcomes: hypoalbuminemia and hypocholesterolemia often reflect catabolic stress, impaired hepatic synthesis, and compromised cellular immunity, while elevated NLR and reduced LMR indicate systemic inflammation and LYMPH depletion, both of which can exacerbate organ dysfunction and increase mortality risk [30, 31]. Hence, integrating inflammatory ratios, such as NLR and LMR, and nutritional markers into the NPS provides a more comprehensive evaluation of patient vulnerability and improves prognostic accuracy in critically ill septic patients.
Importantly, combining both SII and NPS into a predictive model yielded a synergistic effect, significantly enhancing the model’s discriminative capability. This result suggests that incorporating an SII with an NPS more effectively captures the multifactorial pathophysiology of sepsis, where immune dysregulation and metabolic impairment coexist. The construction of a nomogram offers a convenient, bedside-friendly tool for individualized risk prediction. Its accuracy was supported by calibration analysis, which revealed strong concordance between predicted and observed mortality rates, and by DCA, which indicated consistent clinical benefit across various thresholds.
Compared with previously reported predictive models for sepsis patients, our combined SII + NPS model demonstrated comparable or superior performance. For instance, a nomogram integrating N-terminal pro–B-type natriuretic peptide (NT-proBNP), lactate, partial pressure of arterial oxygen/fraction of inspired oxygen (PaO2/FiO2), MAP, and hematocrit achieved an AUC of 0.820 (95% CI: 0.780–0.860) in the training cohort, which was lower than the AUC of 0.846 observed in our study [32]. Another model, which combined age, SOFA score, CRP, mechanical ventilation, and vasopressor use, reported AUCs of 0.849 in the training set and 0.837 in the external validation set, values comparable to our results [33]. These findings suggest that incorporating SII and NPS enhances prognostic value and may improve early risk stratification in sepsis.
The principal novelty of this study lie in integrating two readily available, non-invasive, and cost-effective biomarkers—SII and NPS—into a unified prognostic model for sepsis. Unlike previous studies that often focus on single parameters or rely heavily on advanced and expensive biomarkers, our approach depends on routine laboratory tests, enhancing their feasibility and generalizability in real-world clinical settings. However, we acknowledge certain limitations in our study. First, the retrospective design and single-center dataset may have introduced selection bias and limited the broader applicability. Second, although internal validation confirmed the model’s reliability, external and prospective validation are warranted to confirm its predictive robustness. Finally, potentially informative biomarkers, including PCT, interleukin-6, and lactate, were excluded due to data unavailability, which may have reduced the overall comprehensiveness of the model.
In summary, both SII and NPS are independent predictors of early mortality risk in sepsis. Their combined use significantly improves the predictive accuracy of traditional severity models. The nomogram developed from these parameters shows good calibration and holds promise as a clinically valuable tool for personalized mortality risk estimation. However, prospective multicenter investigations are required to validate the model’s robustness and extend its applicability to broader patient populations.
All data included in this study are available from the corresponding author upon reasonable request.
XYC and YL designed the study. XYC, KL, and SDX performed the experiments and data analyses. XYC drafted the manuscript. YL supervised the project. All authors contributed to the important editorial changes in the manuscript. All authors read and approved the final manuscript. All authors have participated sufficiently in the work and agreed to be accountable for all aspects of the work.
This study was conducted in accordance with the principles of the Declaration of Helsinki and its later amendments. The research protocol was reviewed and approved by the Ethics Committee of The People’s Hospital of Cangnan (Approval No. 2024021). Given the retrospective and non-interventional nature of the study, which involved the use of anonymized data extracted from electronic medical records, the requirement for written informed consent was formally waived by the Ethics Committee.
Not applicable.
This work was supported by the Basic Research Project of Wenzhou City (No. Y20240181).
The authors declare no conflict of interest.
References
Publisher’s Note: IMR Press stays neutral with regard to jurisdictional claims in published maps and institutional affiliations.