


1 Department of Endocrinology, The Third Affiliated Hospital of Anhui Medical University (Hefei First People’s Hospital), 230001 Hefei, Anhui, China
Abstract
Lipoprotein(a) [Lp(a)] is recognized as a cardiovascular risk indicator; however, its connection to peripheral arterial disease (PAD) in individuals with type 2 diabetes mellitus (T2DM) is not well established. This research seeks to explore how Lp(a) concentrations relate to the occurrence of PAD in T2DM patients.
A retrospective analysis was conducted on 590 patients diagnosed with T2DM who were admitted to Hefei First People’s Hospital from January 2022 to August 2024. Participants were grouped into tertiles according to their Lp(a) levels. The diagnosis of PAD was made using the ankle-brachial index (ABI), with an ABI <0.9 considered indicative of PAD. The association between Lp(a) concentrations and PAD was examined using multivariate logistic regression models, subgroup analyses, receiver operating characteristic (ROC) curves, and restricted cubic spline (RCS) plotting.
Compared to lower Lp(a) levels, the group with higher Lp(a) levels exhibited a higher prevalence of PAD (p = 0.001). Multivariate logistic regression analysis indicated that, after stepwise adjustment for all confounding factors, the risk of PAD in the higher Lp(a) group was 1.961 times that of the lower Lp(a) group (odds ratio [OR] = 1.961, 95% confidence interval [CI]: 1.071–3.588, p = 0.029). Additionally, for each 1 standard deviation increase in Lp(a) or each unit increase in the normalized Lp(a) (Log10Lp(a)), the risk of PAD increased by 25.7% and 80.3%, respectively (OR: 1.257, 95% CI: 1.016–1.555, p = 0.035; OR: 1.803, 95% CI: 1.013–3.209, p = 0.045). Subgroup analysis revealed a stratified association between Lp(a) and PAD risk across multiple subgroups (p < 0.05). ROC analysis demonstrated that Lp(a) had a certain predictive ability for PAD prevalence (area under the curve (AUC): 0.622, 95% CI: 0.568–0.677, p < 0.001). RCS analysis indicated that there was no evidence of a nonlinear relationship between Log10Lp(a) and PAD risk, regardless of the logistic regression model used (p for nonlinearity > 0.05).
A significant correlation was observed between elevated Lp(a) levels and an increased risk of PAD in patients with T2DM.
Keywords
- lipoprotein(a)
- type 2 diabetes mellitus
- peripheral arterial disease
- ankle brachial index
- cross-sectional study
Peripheral arterial disease (PAD) is a frequently encountered vascular condition
involving impaired blood circulation to the extremities, which can result in
discomfort and restricted mobility [1, 2]. The incidence of PAD is notably elevated in individuals with type 2
diabetes mellitus (T2DM) due to the combined effects of hyperglycemia, oxidative
stress, and vascular inflammation accelerating atherosclerosis [3, 4, 5, 6].
T2DM, which comprises more than 90% of all diabetes cases, is defined by a
combination of insulin resistance and insufficient insulin production [7]. The diagnosis of T2DM is established according to recognized
thresholds: fasting plasma glucose
Lipoprotein(a) [Lp(a)] is increasingly recognized for its contribution to CVD and mortality, due to its low-density lipoprotein (LDL)-like structure and unique pro-inflammatory and pro-thrombotic properties [11, 12, 13, 14]. Structurally, Lp(a) consists of an LDL-like particle covalently bound to apolipoprotein(a) [apo(a)], a glycoprotein homologous to plasminogen, enabling it to interfere with fibrinolysis and promote thrombosis while simultaneously driving atherosclerosis through endothelial dysfunction, oxidative stress, inflammatory cytokine and adhesion molecule expression, impaired endothelial repair, and thrombus formation [15]. Clinically, elevated Lp(a) levels have been identified as an independent risk factor for a range of cardiovascular conditions, including atherosclerotic CVD and heart valve disease [11, 12, 13]. Furthermore, numerous studies have linked high Lp(a) concentrations to a greater likelihood of developing PAD and its related complications, such as amputation and revascularization, and these associations vary across different sexes, ethnicities, and types of diabetic foot [16, 17, 18, 19]. This implies that Lp(a) could be actively involved in the pathogenesis and advancement of PAD and warrants further investigation as a potential therapeutic target. However, despite the established correlation between Lp(a) and PAD, its specific impact on PAD in the T2DM population remains insufficiently explored [16]. In the context of T2DM, where vascular complications are more common due to chronic hyperglycemia and oxidative stress, Lp(a) may play a more pronounced role [20]. Given that PAD shares common pathophysiological pathways with other atherosclerotic conditions, investigating the role of Lp(a) in this specific context may offer new insights into early diagnosis and risk stratification in PAD patients [21].
Given the existing research context, this study investigates how Lp(a) concentrations relate to the prevalence of PAD among individuals with T2DM, with the aim of identifying a potential biomarker for early diagnosis and risk stratification, ultimately aiding in the prevention of severe complications such as cardiovascular events and limb amputations.
This study retrospectively analyzed 590 individuals diagnosed with T2DM who received treatment at Hefei First People’s Hospital between January 2022 and August 2024 (Fig. 1). The inclusion criteria were as follows: (1) a verified diagnosis of T2DM according to the 2025 American Diabetes Association (ADA) guidelines, (2) age of 18 years or older, and (3) availability of complete clinical data, including Lp(a) measurements and PAD status. Exclusion criteria included (1) history of cardiovascular events not related to PAD (such as myocardial infarction, stroke), (2) presence of severe hepatic or renal dysfunction (such as decompensated liver cirrhosis and uremia), (3) active infection or malignancy, and (4) presence of serious diabetic complications, including diabetic ketoacidosis, diabetic foot ulcers, or advanced diabetic retinopathy. Eligible participants were identified using T2DM diagnostic codes extracted from the hospital’s electronic medical record system. After initial electronic screening, all cases underwent manual verification to ensure conformity with the defined inclusion and exclusion parameters. The research was carried out in compliance with the ethical principles outlined in the Declaration of Helsinki. The study protocol received approval from the Ethics Committee of Hefei First People’s Hospital [Approval No. 2022 (74)], and all subjects provided informed consent before participation.
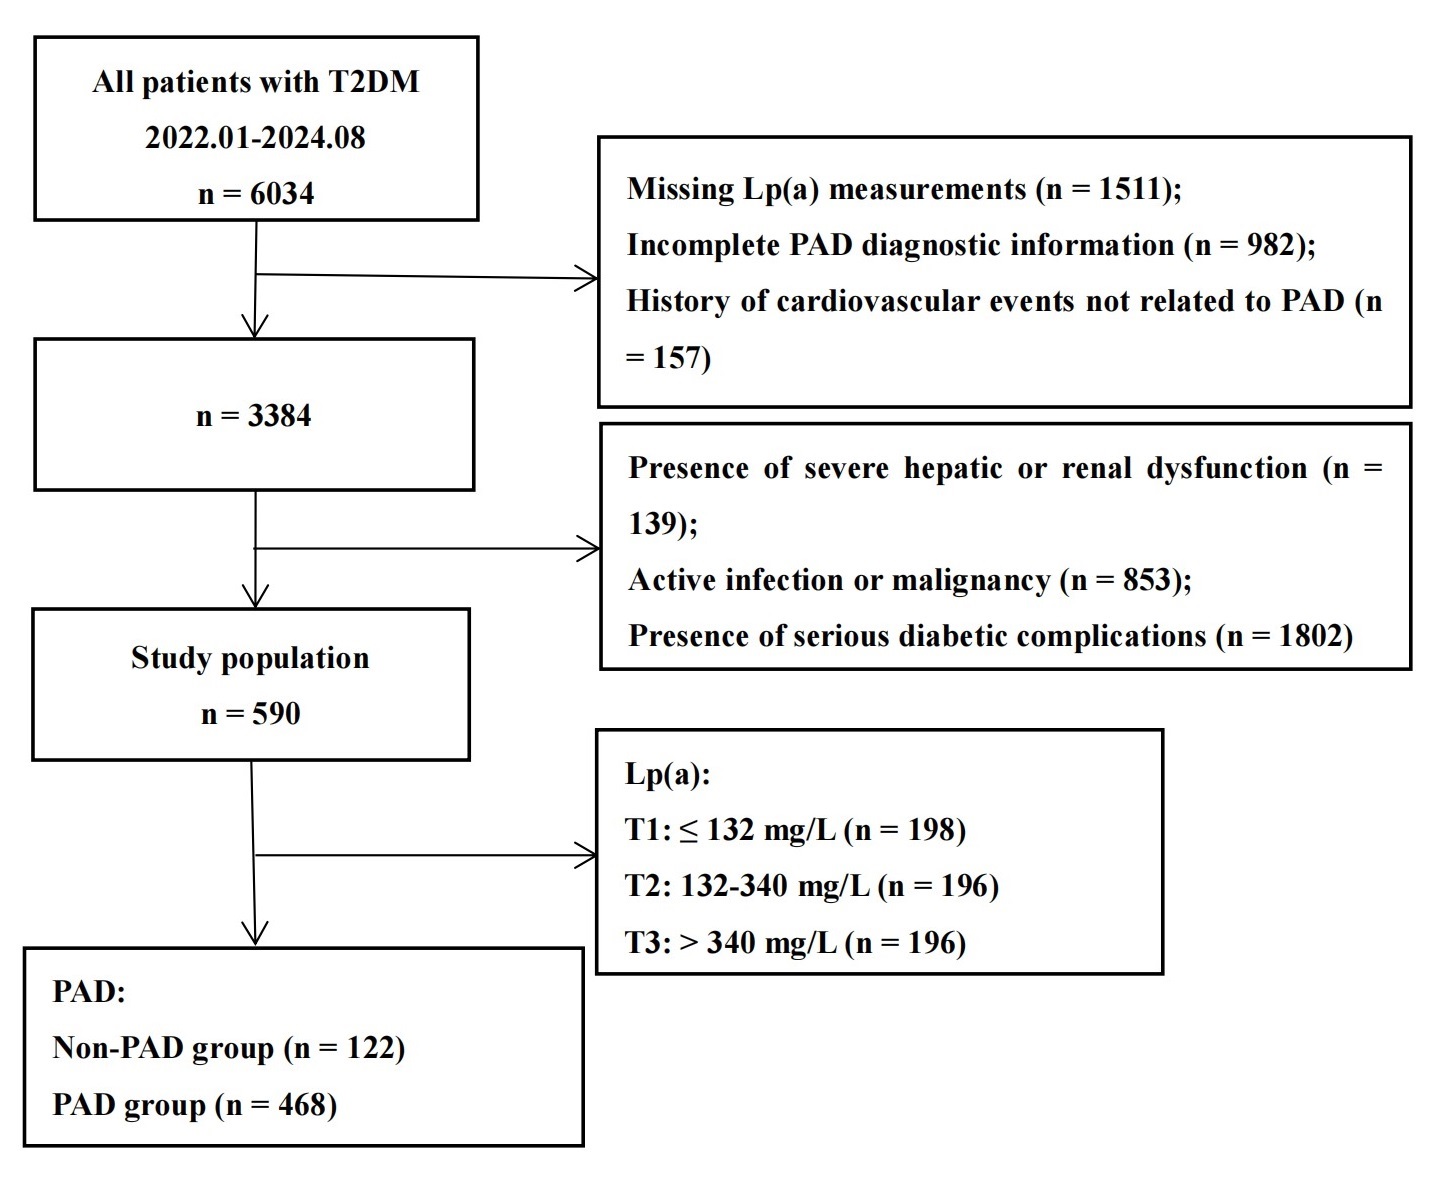 Fig. 1.
Flowchart of patient selection and grouping process. T2DM, type 2 diabetes mellitus; PAD, peripheral arterial disease; Lp(a), lipoprotein(a).
In this study, essential patient information—including age, gender, smoking
habits, clinical characteristics, and laboratory test results—was obtained.
Smoking status was determined through the patients’ electronic medical records
and classified as smoker (yes) or non-smoker (no). Hypertension was identified
either by a prior diagnosis or by elevated blood pressure measured during
hospitalization—defined as systolic blood pressure (SBP)
PAD was diagnosed based on a combination of clinical symptoms, physical examination, and objective diagnostic tests, with the ankle-brachial index (ABI) being the primary assessment tool [25]. ABI was calculated by dividing the SBP at the ankle by the SBP at the brachial artery. Following a minimum 10-minute rest in the supine position, SBP was assessed bilaterally at the upper limbs and at the posterior tibial and dorsalis pedis arteries in the lower limbs, using a handheld Doppler ultrasound device (Bidop ES-100V3, Hadeco Inc., Kawasaki, Japan). An ABI value of less than 0.90 was diagnostic of PAD [25].
To assess Lp(a), an immunoturbidimetric assay was employed, utilizing
antigen–antibody interactions that produce a turbidity signal proportional to
Lp(a) content [26]. Participants provided fasting blood
samples following an overnight fast of
Data analyses were executed by R (version 4.1.4, R Foundation for Statistical
Computing, Vienna, Austria) and SPSS (version 26.0, IBM Corp., Armonk, NY, USA).
The Shapiro-Wilk procedure was utilized to assess the normality assumption for
continuous variables. For variables that followed a normal distribution, results
were described using means and standard deviations (SDs), and group differences
were evaluated through one-way analysis of variance (ANOVA). Levene’s test was employed to examine
equality of variances. In contrast, skewed data were summarized as medians and
interquartile ranges (IQR), and non-parametric comparisons were conducted via the
Kruskal-Wallis method. Categorical variables were expressed as counts (n) and
percentages (%), and group differences were assessed using the chi-square
(
The relation between Lp(a) and PAD was assessed through a four-step hierarchical
logistic-regression strategy that produced odds ratios (ORs) and 95% confidence
intervals (CIs): Model 1 (baseline): no covariate adjustment; Model 2
(+demographics): Model 1 plus age and sex; Model 3 (+lifestyle/clinical): Model 2
plus smoking status, hypertension, antihypertensive treatment, and CKD; Model 4
(full adjustment): Model 3 plus heart rate, BMI, DBP, fasting glucose, HbA1c,
triglycerides, eGFR, and uric acid. Covariates were chosen from univariable
analyses in which p
Table 1 summarized baseline data: participants were separated into Lp(a)
tertiles (T1–T3), and their baseline profiles were contrasted across these
categories. First, the incidence of PAD differed significantly between the groups
with varying Lp(a) levels (p = 0.001). The prevalence of PAD rose with
higher Lp(a) concentrations. Specifically, in the T1 group (Lp(a)
| Variables | Total patients | T1 | T2 | T3 | F/H/ |
p-value | |
| N | 590 | 198 | 196 | 196 | |||
| Age, years | 63.94 |
61.92 |
64.93 |
64.99 |
3.915 | 0.020 | |
| Sex, n (%) | 4.176 | 0.124 | |||||
| Male | 429 (72.7%) | 154 (77.8%) | 140 (71.4%) | 135 (68.9%) | |||
| Female | 161 (27.3%) | 44 (22.2%) | 56 (28.6%) | 61 (31.1%) | |||
| Smoking, n (%) | 2.320 | 0.314 | |||||
| Yes | 292 (49.5%) | 105 (53.0%) | 98 (50.0%) | 89 (45.4%) | |||
| No | 298 (50.5%) | 93 (47.0%) | 98 (50.0%) | 107 (54.6%) | |||
| Hypertension, n (%) | 6.575 | 0.037 | |||||
| Yes | 423 (71.7%) | 155 (78.3%) | 136 (69.4%) | 132 (67.3%) | |||
| No | 167 (28.3%) | 43 (21.7%) | 60 (30.6%) | 64 (32.7%) | |||
| Antihypertensive drugs, n (%) | 8.100 | 0.017 | |||||
| Yes | 349 (59.2%) | 133 (67.2%) | 106 (54.1%) | 110 (56.1%) | |||
| No | 241 (40.8%) | 65 (32.8%) | 90 (45.9%) | 86 (43.9%) | |||
| Hyperlipidemia, n (%) | 3.015 | 0.221 | |||||
| Yes | 305 (51.7%) | 110 (55.6%) | 92 (46.9%) | 103 (52.6%) | |||
| No | 285 (48.3%) | 88 (44.4%) | 104 (53.1%) | 93 (47.4%) | |||
| Lipid-lowering drugs, n (%) | 0.297 | 0.862 | |||||
| Yes | 7 (1.2%) | 2 (1.0%) | 2 (1.0%) | 3 (1.5%) | |||
| No | 583 (98.8%) | 196 (99.0%) | 194 (99.0%) | 193 (98.5%) | |||
| Chronic kidney disease, n (%) | 23.891 | ||||||
| Yes | 143 (24.2%) | 28 (14.1%) | 46 (23.5%) | 69 (35.2%) | |||
| No | 447 (75.8%) | 170 (85.9%) | 150 (76.5%) | 127 (64.8%) | |||
| BMI, kg/m2 | 25.54 |
25.58 |
25.86 |
25.18 |
1.789 | 0.168 | |
| Heart rate, bpm | 83.29 |
83.45 |
82.26 |
84.17 |
0.764 | 0.466 | |
| SBP, mmHg | 134.50 |
132.69 |
136.72 |
134.12 |
1.582 | 0.206 | |
| DBP, mmHg | 79.09 |
79.51 |
79.70 |
77.92 |
0.930 | 0.395 | |
| Fasting glucose, mmol/L | 8.71 (7.12, 11.75) | 8.70 (7.19, 11.88) | 8.93 (7.26, 12.00) | 8.26 (6.96, 11.57) | 2.042 | 0.360 | |
| HbA1c, % | 8.04 |
7.91 |
8.04 |
8.16 |
1.008 | 0.366 | |
| Total cholesterol, mmol/L | 4.69 |
4.46 |
4.66 |
4.95 |
6.876 | 0.001 | |
| Triglyceride, mmol/L | 1.63 (1.14, 2.40) | 1.76 (1.22, 2.66) | 1.56 (1.13, 2.19) | 1.63 (1.08, 2.30) | 5.441 | 0.066 | |
| LDL-C, mmol/L | 2.83 |
2.54 |
2.83 |
3.12 |
18.672 | ||
| HDL-C, mmol/L | 1.14 |
1.14 |
1.14 |
1.13 |
0.073 | 0.929 | |
| eGFR, mL/min/1.73 m2 | 88.12 |
100.38 |
85.93 |
77.91 |
16.461 | ||
| Uric acid, µmol/L | 358.22 |
352.94 |
356.22 |
365.55 |
0.622 | 0.537 | |
| PAD, n (%) | 13.504 | 0.001 | |||||
| Yes | 122 (20.7%) | 27 (13.6%) | 39 (19.9%) | 56 (28.6%) | |||
| No | 468 (79.3%) | 171 (86.4%) | 157 (80.1%) | 140 (71.4%) | |||
T1:
Univariate logistic regression (Table 2) revealed that age, sex, smoking,
hypertension, use of antihypertensive drugs, CKD, BMI, heart rate, DBP, fasting
glucose, HbA1c, triglycerides, eGFR, and uric acid were all significantly
associated with PAD risk (p
| SE | Wald | OR (95% CI) | p-value | ||
| Age | 0.084 | 0.011 | 58.394 | 1.088 (1.065, 1.112) | |
| Male | –0.526 | 0.217 | 5.896 | 0.591 (0.386, 0.904) | 0.015 |
| Smoking | –0.476 | 0.207 | 5.301 | 0.622 (0.415, 0.932) | 0.021 |
| Hypertension | 0.713 | 0.256 | 7.772 | 2.041 (1.236, 3.369) | 0.005 |
| Antihypertensive drugs | 0.622 | 0.219 | 8.037 | 1.862 (1.212, 2.862) | 0.005 |
| Hyperlipidemia | –0.334 | 0.204 | 2.681 | 0.716 (0.480, 1.068) | 0.102 |
| Chronic kidney disease | 1.549 | 0.218 | 50.444 | 4.707 (3.070, 7.218) | |
| Body mass index | –0.085 | 0.030 | 8.163 | 0.919 (0.867, 0.974) | 0.004 |
| Heart rate | 0.019 | 0.006 | 9.074 | 1.020 (1.007, 1.032) | 0.003 |
| Systolic blood pressure | 0.005 | 0.004 | 1.132 | 1.005 (0.996, 1.014) | 0.287 |
| Diastolic blood pressure | –0.017 | 0.007 | 5.299 | 0.984 (0.970, 0.998) | 0.021 |
| Fasting glucose | 0.054 | 0.023 | 5.519 | 1.055 (1.009, 1.104) | 0.019 |
| Hemoglobin A1c | 0.171 | 0.056 | 9.320 | 1.187 (1.063, 1.325) | 0.002 |
| Total cholesterol | –0.094 | 0.080 | 1.366 | 0.911 (0.778, 1.065) | 0.242 |
| Triglyceride | –0.219 | 0.088 | 6.217 | 0.803 (0.676, 0.954) | 0.013 |
| Low-density lipoprotein cholesterol | –0.060 | 0.107 | 0.308 | 0.942 (0.763, 1.163) | 0.579 |
| High-density lipoprotein cholesterol | 0.056 | 0.381 | 0.022 | 1.058 (0.502, 2.231) | 0.882 |
| Estimated glomerular filtration rate | –0.025 | 0.003 | 60.283 | 0.975 (0.969, 0.982) | |
| Uric acid | 0.003 | 0.001 | 13.569 | 1.003 (1.001, 1.005) |
OR, odds ratio; CI, confidence interval; SE, standard error.
As presented in Table 3, higher Lp(a) concentrations were independently
correlated with an increased likelihood of PAD. Without covariate adjustment
(Model 1), individuals in the highest tertile (T3) exhibited a markedly greater
risk of PAD relative to those in the lowest group (T1), with an OR of 2.533 (95%
CI: 1.520–4.222; p
| Model 1 | Model 2 | Model 3 | Model 4 | |||||||||||||
| SE | OR (95% CI) | p-value | SE | OR (95% CI) | p-value | SE | OR (95% CI) | p-value | SE | OR (95% CI) | p-value | |||||
| Lp(a): T1 | Ref | - | Ref | - | Ref | - | Ref | - | ||||||||
| Lp(a): T2 | 0.453 | 0.274 | 1.573 (0.920, 2.690) | 0.098 | 0.322 | 0.289 | 1.379 (0.782, 2.432) | 0.266 | 0.226 | 0.305 | 1.254 (0.690, 2.278) | 0.458 | 0.296 | 0.321 | 1.345 (0.717, 2.522) | 0.355 |
| Lp(a): T3 | 0.930 | 0.261 | 2.533 (1.520, 4.222) | 0.838 | 0.278 | 2.311 (1.340, 3.985) | 0.003 | 0.666 | 0.292 | 1.947 (1.098, 3.454) | 0.023 | 0.673 | 0.308 | 1.961 (1.071, 3.588) | 0.029 | |
| Lp(a) (per 1-unit) | 0.001 | 0.000 | 1.001 (1.001, 1.002) | 0.001 | 0.000 | 1.001 (1.000, 1.002) | 0.003 | 0.001 | 0.000 | 1.001 (1.000, 1.002) | 0.020 | 0.001 | 0.000 | 1.001 (1.000, 1.002) | 0.035 | |
| Log10Lp(a) | 0.950 | 0.251 | 2.585 (1.582, 4.225) | 0.815 | 0.265 | 2.259 (1.344, 3.799) | 0.002 | 0.615 | 0.273 | 1.850 (1.084, 3.156) | 0.024 | 0.589 | 0.294 | 1.803 (1.013, 3.209) | 0.045 | |
| Lp(a) (per 1-SD) | 0.353 | 0.093 | 1.423 (1.186, 1.707) | 0.300 | 0.101 | 1.350 (1.108, 1.645) | 0.003 | 0.238 | 0.102 | 1.268 (1.038, 1.550) | 0.020 | 0.229 | 0.108 | 1.257 (1.016, 1.555) | 0.035 | |
Model 1 (baseline): no covariate adjustment; Model 2 (+demographics): Model 1 plus age and sex; Model 3 (+lifestyle/clinical): Model 2 plus smoking status, hypertension, antihypertensive treatment, and CKD; Model 4 (full adjustment): Model 3 plus heart rate, BMI, DBP, fasting glucose, HbA1c, triglycerides, eGFR, and uric acid. Lp(a), lipoprotein(a); PAD, peripheral arterial disease; CKD, chronic kidney disease; BMI, body mass index; DBP, diastolic blood pressure; HbA1c, hemoglobin A1c; eGFR, estimated glomerular filtration rate; OR, odds ratio; CI, confidence interval; SD, standard deviation.
Treating Lp(a) as a continuous metric—whether assessed per unit, on a
logarithmic scale, or standardized by SD—consistently revealed a robust link
with PAD risk across all regression models. In the crude analysis (Model 1), each
1 mg/L increase in Lp(a) corresponded to an OR of 1.001 (95% CI: 1.001–1.002,
p
As presented in the subgroup analysis (Table 4), elevated Lp(a) levels were significantly linked to increased PAD risk within multiple population strata. In individuals older than 60, those in the highest tertile (T3) exhibited a markedly greater likelihood of developing PAD relative to the lowest tertile (T1), with an OR of 1.869 (95% CI: 1.006–3.469, p = 0.048). In male patients, the PAD risk in the T3 group also significantly increased (OR = 2.131, 95% CI: 1.087–4.177, p = 0.028). Similarly, in patients with hypertension, the PAD risk in the T3 group was significantly elevated (OR = 1.996, 95% CI: 1.080–3.690, p = 0.028). For patients with hyperlipidemia, the OR for PAD in the highest
| T2 vs. T1 | T3 vs. T1 | p for trend | p for interaction | ||||||
| SE | OR (95% CI) p-value | SE | OR (95% CI) p-value | ||||||
| Age | 0.397 | ||||||||
| –0.058 | 0.823 | 0.944 (0.188, 4.738) 0.944 | 0.986 | 0.665 | 2.681 (0.728, 9.874) 0.138 | 0.203 | |||
| 0.335 | 0.322 | 1.398 (0.744, 2.627) 0.298 | 0.625 | 0.316 | 1.869 (1.006, 3.469) 0.048 | 0.138 | |||
| Sex | 0.212 | ||||||||
| Male | –0.175 | 0.380 | 0.839 (0.398, 1.769) 0.645 | 0.756 | 0.344 | 2.131 (1.087, 4.177) 0.028 | 0.013 | ||
| Female | 0.912 | 0.539 | 2.488 (0.866, 7.151) 0.090 | 0.542 | 0.544 | 1.719 (0.591, 4.996) 0.320 | 0.234 | ||
| Hypertension | 0.041 | ||||||||
| Yes | 0.088 | 0.333 | 1.092 (0.569, 2.098) 0.791 | 0.691 | 0.314 | 1.996 (1.080, 3.690) 0.028 | 0.045 | ||
| No | 0.818 | 0.858 | 2.267 (0.422, 12.177) 0.340 | 0.647 | 0.854 | 1.909 (0.358, 10.178) 0.449 | 0.634 | ||
| Hyperlipidemia | 0.039 | ||||||||
| Yes | –0.166 | 0.434 | 0.847 (0.362, 1.983) 0.702 | 0.860 | 0.384 | 2.364 (1.115, 5.013) 0.025 | 0.014 | ||
| No | 0.718 | 0.426 | 2.050 (0.890, 4.724) 0.092 | 0.669 | 0.430 | 1.953 (0.841, 4.534) 0.119 | 0.198 | ||
| CKD | 0.786 | ||||||||
| Yes | 0.116 | 0.522 | 1.123 (0.404, 3.124) 0.824 | 0.177 | 0.491 | 1.194 (0.456, 3.128) 0.718 | 0.936 | ||
| No | 0.289 | 0.389 | 1.336 (0.623, 2.863) 0.457 | 0.908 | 0.375 | 2.479 (1.189, 5.170) 0.015 | 0.040 | ||
OR, odds ratio; CI, confidence interval; PAD, peripheral arterial disease; Lp(a), lipoprotein(a); CKD, chronic kidney disease.
Lp(a) tertile (T3) was 2.364 (95% CI: 1.115–5.013, p = 0.025). Likewise, among those without CKD, the T3 group showed a similarly elevated PAD risk, with an OR of 2.479 (95% CI: 1.189–5.170, p = 0.015).
As shown in Fig. 2, the ROC curve demonstrated the discriminative capacity of
Lp(a) for identifying PAD. The AUC reached 0.622 (95% CI: 0.568–0.677;
p
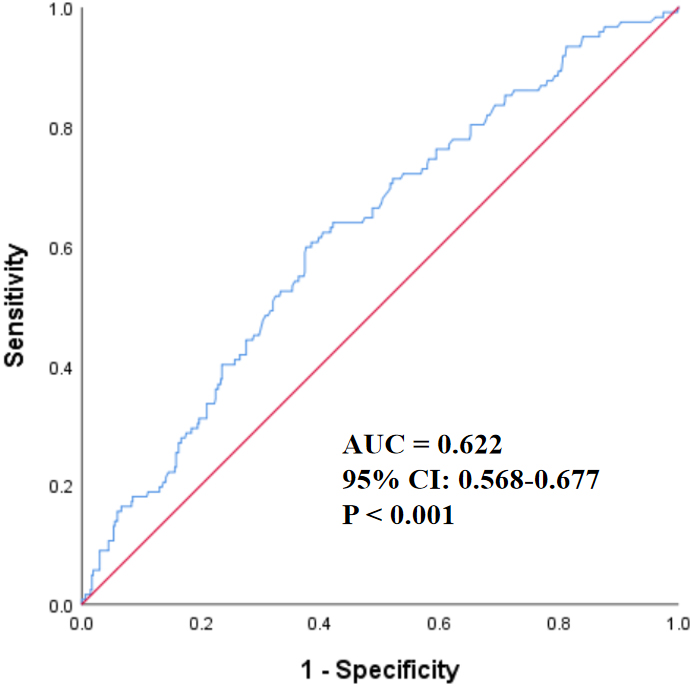 Fig. 2.
The ROC curve of Lp(a) for predicting PAD. The ROC curve,
depicted in blue, reflected the diagnostic performance of Lp(a), whereas the red
diagonal served as the reference line (AUC = 0.5). With an AUC of 0.622 (95% CI:
0.568–0.677; p
As illustrated in Fig. 3, a strong linear relationship between Log10Lp(a)
and PAD risk was observed in Model 1 (unadjusted), with statistical significance
(p
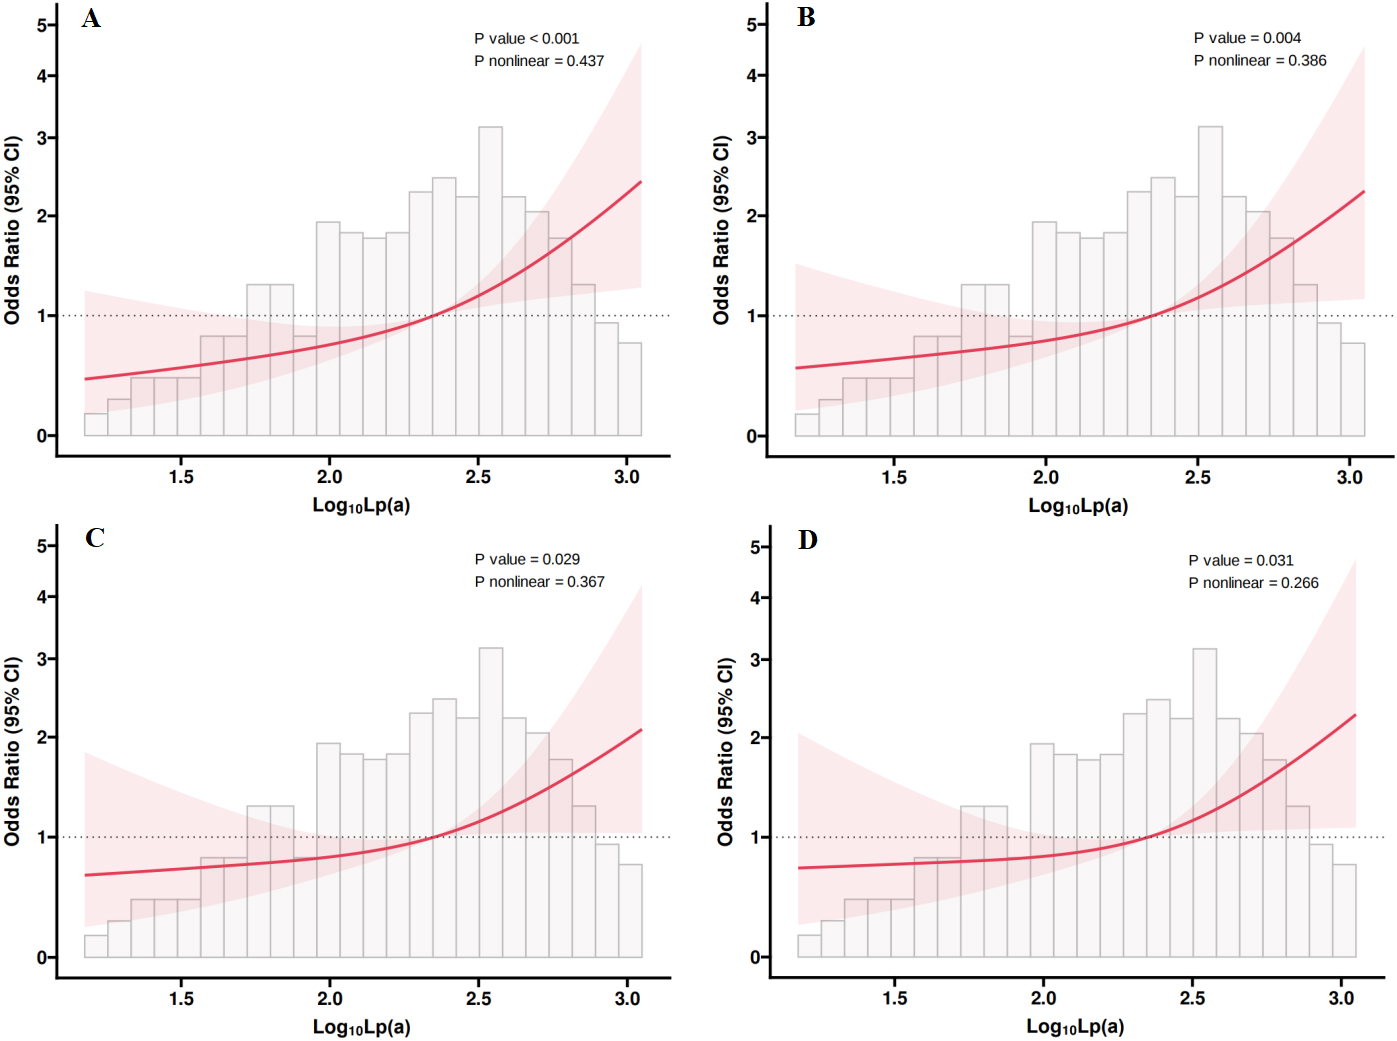 Fig. 3.
The restricted cubic spline plots of Lp(a) with PAD in four
models. The x-axis represented Log10-transformed Lp(a) concentrations,
while the y-axis showed the OR with 95% CI for PAD. The red solid lines
indicated the fitted spline curves, shaded areas represented the 95% CI, and the
grey bars displayed the distribution of participants. A significant association
between Lp(a) and PAD risk was found in all models, with no indication of
nonlinearity (p for nonlinearity
In individuals with T2DM, higher Lp(a) levels were independently linked to a greater prevalence of PAD. Multivariate logistic regression, adjusted for relevant confounders, revealed that those with elevated Lp(a) had nearly twice the odds of developing PAD (OR = 1.961). Notably, the risk increased by 25.7% with each SD rise in Lp(a), and by approximately 80.3% for every unit increment in its log-transformed form. Subgroup analysis confirmed this association across sex, age, hypertension, and hyperlipidemia. ROC analysis showed weak but statistically significant predictive power. RCS analysis further confirmed a significant relationship between Log10Lp(a) and PAD risk, with no evidence of non-linearity.
Extensive evidence supports the role of Lp(a) in promoting atherosclerotic disease and implicates it as a standalone contributor to cardiovascular pathology [27, 28, 29]. However, studies on the relationship between Lp(a) and PAD are relatively few, particularly in T2DM patients. For example, Laschkolnig et al. [16] found that Lp(a) concentration, low molecular weight apo(a) phenotype, and the rs10455872 polymorphism were significantly associated with PAD across three cohorts. Mendelian randomization further supported a causal link driven by genetically determined apo(a) traits and single nucleotide polymorphism (SNP) variants. Forbang et al. [17] also showed that despite higher Lp(a) levels in African Americans, a significant independent association with PAD was found only in Hispanic Americans, highlighting the need for further research on Lp(a)-lowering interventions in this population. Additionally, in a dose-response meta-analysis, Wang et al. [30] identified a linear increase in PAD risk, estimating a 6% elevation for every 10 mg/dL increment in Lp(a). Yi et al. [31] reported that this relationship was sex-specific, showing statistical significance exclusively in women. In a large-scale cohort comprising 108,146 participants, Thomas et al. [32] reported a two- to threefold heightened risk of both PAD and major adverse limb events among individuals with elevated Lp(a). Besides, Okubo et al. [33], studying patients with acute coronary syndrome, noted that increased Lp(a) concentrations were linked to both the presence and severity of lower-limb PAD. A comprehensive systematic review by Masson et al. [18], covering over 490,000 subjects, further established associations between elevated Lp(a) and a wide spectrum of PAD-related complications, including intermittent claudication, restenosis, disease progression, amputation, revascularization, hospital admissions, and PAD-related mortality. And, Gazzaruso et al. [19] found that Lp(a) levels varied by diabetic foot type, being elevated in vascular diabetic foot with PAD and decreased in neuropathic diabetic foot, suggesting a bidirectional role of Lp(a) in both vascular damage and impaired wound healing. Moreover, although Tseng [34], in a limited-sample investigation focused on individuals with T2DM, reported a link between elevated Lp(a) and both greater risk and severity of PAD. However, the analysis did not incorporate systematic subgroup evaluations or explore potential nonlinear associations. In conclusion, prior investigations have not definitively established a positive link between Lp(a) and PAD among individuals with T2DM. In contrast, the present study reinforces this association using robust multivariable approaches, thereby addressing an existing gap in the literature. By integrating multiple statistical techniques, the analysis offers a more nuanced perspective on how elevated Lp(a) relates to PAD prevalence in this patient population. Importantly, RCS modeling indicated a linear association, with no evidence of nonlinearity, underscoring the need for future research to explore this relationship across broader demographic and clinical subgroups.
Several biological mechanisms may underlie the relationship between Lp(a) and PAD. First, Lp(a), as a lipoprotein particle, is structurally similar to LDL but contains the specific apo(a) protein [15]. This makes Lp(a) not only atherogenic like LDL but also capable of promoting thrombosis through its apo(a) component [35]. Studies have shown that Lp(a) can accelerate the atherosclerotic process by enhancing lipid deposition, inducing endothelial dysfunction, and promoting inflammation [15, 35, 36, 37]. Moreover, Lp(a) impairs fibrinolysis, thereby enhancing thrombosis risk [15]. In diabetic patients, the risks of atherosclerosis and thrombosis are higher, likely due to vascular damage and inflammation caused by long-term elevated blood glucose levels [38]. Lp(a) may aggravate these pathological mechanisms, which could help explain the pronounced link observed between elevated Lp(a) and PAD in individuals with T2DM. This outcome indicates that patients with T2DM—especially those exhibiting high Lp(a) concentrations—are potentially more susceptible to developing PAD.
Several limitations should be acknowledged in this study. First, its retrospective nature precludes any inference of causality between Lp(a) levels and PAD. Future longitudinal research is necessary to explore the temporal sequence of this relationship. Second, important confounding variables—such as lifestyle factors and dietary behaviors—were not evaluated and may have influenced the outcomes. Third, although a significant association between Lp(a) and PAD was observed, its ability to discriminate PAD cases was suboptimal. The area under the ROC curve was 0.622, reflecting limited predictive strength. This may be due to the multifactorial nature of PAD pathogenesis, which involves numerous metabolic, inflammatory, and vascular mechanisms. As Lp(a) represents only one of these factors, its predictive capacity on its own is inherently limited. Therefore, Lp(a) may not be sufficient as a standalone predictive tool for PAD but could serve as a supportive risk factor when used in combination with other clinical indicators. Moreover, as the study population was limited to individuals with T2DM, the results may not be applicable to non-diabetic groups. Future research should aim to broaden the sample scope to investigate the Lp(a)–PAD relationship across more diverse populations.
In summary, this investigation highlights a clear link between increased Lp(a) concentrations and the prevalence of PAD among individuals with T2DM. Further studies are warranted to assess this relationship in broader populations and to examine whether reducing Lp(a) levels could contribute to PAD prevention.
All data included in this study are available from the corresponding author upon reasonable request.
CC designed and performed the research. CC analyzed the data and drafted the manuscript. FL designed the research, reviewed and revised the manuscript. Both authors contributed to revising the manuscript critically for important intellectual content. Both authors read and approved the final manuscript. Both authors have participated sufficiently in the work and agreed to be accountable for all aspects of the work.
This study was conducted in accordance with the principles of the Declaration of Helsinki. The study protocol was reviewed and approved by the Ethics Committee of Hefei First People’s Hospital [Approval No. 2022 (74)], and all participants provided written informed consent.
Not applicable.
This research received no external funding.
The authors declare no conflict of interest.
References
Publisher’s Note: IMR Press stays neutral with regard to jurisdictional claims in published maps and institutional affiliations.