


 , Siddig Ibrahim Abdelwahab 3, Ibrahim Gosadi 1, Manal Mohamed Elhassan Taha 3, Doaa Abdulwahab Mohammed Ayish 4, Fatma Ayish 5, Amal H. Mohamed 5
1 Department of Family and Community Medicine, Faculty of Medicine, Jazan University, 45142 Jazan, Saudi Arabia
2 King Salman Center for Disability Research, 11614 Riyadh, Saudi Arabia
3 Health Research Center, Jazan University, 45142 Jazan, Saudi Arabia
4 Department of Internal Medicine, Jazan General Hospital, 45142 Jazan, Saudi Arabia
5 Department of Internal Medicine, Faculty of Medicine, Jazan University, 45142 Jazan, Saudi Arabia
Abstract
The World Health Organization Disability Assessment Schedule 2.0 (WHODAS 2.0) is extensively used internationally for assessing disabilities across diverse cultures and health conditions; however, psychometric validation of its Arabic version remains scarce. This study aimed to evaluate the psychometric properties regarding the Arabic WHODAS 2.0 using Rasch analysis, providing the first validation evidence of reliability, validity, dimensionality, and item functioning among individuals with disabilities in Arabic-speaking populations.
This cross-sectional study included 486 Arabic-speaking participants. Rasch analysis was performed using WINSTEPS software to assess item fit, item and person reliability, unidimensionality, separation indices, differential item functioning (DIF), and category functioning.
The Arabic WHODAS 2.0 showed strong person (0.80) and item (0.99) reliability, with adequate item-person targeting. Most items fit the Rasch model, except for World Health Organization Disability Assessment Schedule 5 (WHODAS5), which displayed misfit and disorder thresholds. Principal component analysis supported unidimensionality (53.4% variance explained), and no significant DIF was detected across the demographic groups.
The Arabic version of the WHODAS 2.0 is a reliable and valid tool for assessing disability in Arabic-speaking populations. Overall, it demonstrated strong psychometric properties, although the WHODAS5 requires revision. This scale is suitable for clinical and research use, with recommendations for further qualitative validation and longitudinal testing.
Keywords
- disability evaluation
- World Health Organization
- cross-cultural comparison
- psychometrics
- Arabic
The widely accepted definition of disability, as delineated in the United Nations Convention on the Rights of Persons with Disabilities, refers to individuals who have long-term physical, mental, intellectual, or sensory impairments which, in interaction with several barriers, can hinder their full and equal participation in society [1, 2]. Disability ultimately results from the confluence of impairments (e.g., visual) and environmental, social, or personal obstacles [3]. The World Health Organization (WHO) estimates that 1.3 billion individuals worldwide have a disability [4], a figure projected to rise with the growth and aging of the global population. A recent analysis found that all-cause mortality was 2.24 times higher among individuals with impairments than among those without disabilities [5]. Individuals with disabilities are at a higher risk of adverse health outcomes and increased mortality, which may be attributed to underlying impairments or health conditions, elevated exposure to risk factors, such as malnutrition, and significant barriers to accessing healthcare. These disparities are largely influenced by social determinants of health, which play a significant role in determining overall well-being and access to services [6, 7].
The World Health Organization Disability Assessment Schedule 2.0 (WHODAS 2.0) is an internationally validated tool designed to assess functioning and disability across different cultures and health conditions. Although it has been translated into multiple languages, comprehensive psychometric validation of the Arabic version—particularly through modern methods like Rasch analysis—remains scarce [8, 9, 10]. Traditional validation using Classical Test Theory (CTT) has provided limited insights, offering surface-level metrics without addressing item-level functioning or measurement invariance across subpopulations. In contrast, the Rasch model—rooted in item response theory—enables deeper evaluation of item fit, unidimensionality, person and item reliability, and differential item functioning (DIF), providing a more robust framework for scale validation [11].
In the Arab world, there is a pressing need for culturally sensitive, psychometrically sound instruments to assess disability in both clinical and research contexts. Validating the WHODAS 2.0 using advanced psychometric approaches is essential. The Rasch model, a modern measurement theory grounded in probabilistic principles, transforms ordinal-level data into interval-level measures, allowing for the assessment of both item difficulty and person ability on the same scale. It offers several advantages over traditional approaches, including its capacity to evaluate item-level fit, ensure unidimensionality, assess measurement precision through reliability and separation indices, and detect DIF across subgroups. Unlike CTT, Rasch analysis provides sample-independent item calibrations and item-independent person measures, enhancing the scale’s generalizability and interpretability. Applying the Rasch model, therefore, enables a more rigorous and nuanced validation of assessment tools like WHODAS 2.0 [12]. Therefore, this study aimed to examine the psychometric properties of the Arabic version of WHODAS 2.0—specifically evaluating its validity, reliability, item fit, unidimensionality, and DIF—using the Rasch model via WINSTEPS software. Notably, this is the first study to apply Rasch analysis for validating the Arabic WHODAS 2.0 among individuals with disabilities, thus contributing novel evidence on its appropriateness for this population.
This cross-sectional, descriptive study was conducted in Saudi Arabia across various healthcare levels, including primary, secondary, and tertiary centers. Participants were recruited from outpatient clinics, rehabilitation units, and community health programs. A total of 486 individuals with disabilities participated. Inclusion criteria were: (1) self-identified or clinically documented physical, sensory, intellectual, or mental disability, and (2) ability to provide informed consent and complete the questionnaire independently. Exclusion criteria included acute illness or severe cognitive impairment that could hinder questionnaire completion [13]. Data collection for this study was conducted between September 2024 and January 2025, ensuring coverage within an appropriate timeframe for cross-sectional analysis. In addition to administering the WHODAS 2.0 questionnaire, demographic and social information was also collected from participants, including gender, age, education level, marital status, main work status, residence (urban/rural), and living situation. These variables were analyzed to examine group differences in disability scores and are presented in Table 1.
| Category | Variable | N | % | WHODAS 2.0 score | p-value |
| Gender | Male | 152 | 31.30 | 2.50 |
0.621 |
| Female | 334 | 68.70 | 2.55 | ||
| Age | Less than 18 | 66 | 13.60 | 2.88 |
|
| 18–24 years | 22 | 4.50 | 2.52 | ||
| 24–39 years | 128 | 26.30 | 2.07 | ||
| 40–65 years | 187 | 38.50 | 2.52 | ||
| More than 65 years | 83 | 17.10 | 2.54 | ||
| Education | I don’t read or write | 173 | 35.60 | 2.87 |
|
| School or pre-university | 191 | 39.30 | 2.51 | ||
| University | 112 | 23.00 | 2.06 | ||
| Post-graduate | 10 | 2.10 | 2.51 | ||
| Marital status | Never married | 159 | 32.70 | 2.35 |
|
| Currently married | 210 | 43.20 | 2.46 | ||
| Separated | 28 | 5.80 | 2.54 | ||
| Divorced | 15 | 3.10 | 2.50 | ||
| Widowed | 74 | 15.20 | 3.20 | ||
| Main work status | Paid work | 72 | 14.80 | 2.06 |
|
| Unemployed for health reasons | 22 | 4.50 | 2.67 | ||
| Student | 70 | 14.40 | 2.38 | ||
| Retired | 66 | 13.60 | 2.76 | ||
| Unemployed for other reasons | 45 | 9.30 | 2.44 | ||
| Housewife | 192 | 39.50 | 2.77 | ||
| Self-employment | 19 | 3.90 | 2.00 | ||
| Residence | Rural | 240 | 49.40 | 2.54 |
0.686 |
| Urban | 246 | 50.60 | 2.53 | ||
| Living situation | Alone | 26 | 5.30 | 2.08 |
0.023 |
| With family | 460 | 94.70 | 2.52 | ||
| Total | 486 | 100 | |||
Regarding the use of mean
The WHODAS 2.0, an internationally recognized measure of health and social disability developed by the WHO [14, 15]. It balances the depth of information provided about an individual’s functionality and disability with the ease of administration. The tool exists in two variants: one with 36 items that offers detailed evaluation, and the other with 12 items intended for rapid assessment. Respondents answer each item using a 5-point Likert scale from “none” to “extreme or cannot do”, and scoring can be done through simple summation or more intricate methods based on item-response theory, as WHO suggests. WHODAS 2.0 has a broad scope that covers clinical evaluations, health surveys, and research studies to assess disability, monitor treatment results, and policy evaluation. Because it can be administered in multiple languages via self-report, interviewer-led, and proxy methods, WHODAS 2.0 is flexible and enhances both clinical and research [16, 17, 18, 19].
The translation of WHODAS 2.0 into Arabic followed a standardized forward-backward translation process in accordance with the WHO guidelines for cross-cultural adaptation of instruments [20]. Initially, two independent bilingual translators performed forward translations from English to Arabic. The translations were reconciled into a single version through expert consensus. This preliminary Arabic version was back-translated into English by three independent translators who were unfamiliar with the original scale. Discrepancies were discussed and resolved by a committee consisting of language and subject-matter experts. The final version was pilot-tested on a small sample to ensure clarity, cultural relevance, and conceptual equivalence to the original instrument.
Rasch analysis was conducted using WINSTEPS software (version 5.5.3), developed by John M. Linacre (Winsteps.com, Beaverton, OR, USA), to evaluate the psychometric properties of the Arabic version of WHODAS 2.0, including item fit, scale functioning, and measurement reliability [21, 22, 23]. The Rasch rating scale model was adopted to assess item fit, personal and item reliability, separation indices, scale dimensionality, and category functioning. Item and person fit statistics were evaluated using infit and outfit mean squares (MNSQ) and standardized z-values (ZSTD). The acceptable MNSQ values ranged between 0.5 and 1.5. Reliability and separation indices were obtained to assess the internal consistency and discrimination ability of the items and participants. Unidimensionality was tested through principal component analysis (PCA) of residuals, with the variance explained by the Rasch dimension expected to exceed 50% and the first contrast eigenvalue ideally below 2.0. Additionally, mean person measure and mean item measure were calculated to determine the relative positioning of item difficulty and participant ability along the logit scale, providing insights into scale targeting. DIF was also examined to detect potential item bias. Finally, category probability curves were reviewed to ensure that response options functioned in an ordered and interpretable manner. Items demonstrating a poor fit or disordered thresholds were flagged for further review.
Statistical analyses were performed using IBM SPSS Statistics (version 26),
developed by IBM Corporation (Armonk, NY, USA). Descriptive statistics, such as
means, standard deviations, percentages, and frequencies, were employed to
summarize the participants’ demographic characteristics and WHODAS 2.0 scores,
providing an overview of the sample distribution and scale responses. Normality
of the data was assessed using the Shapiro–Wilk test. Due to violations of
normality assumptions in variables, non-parametric tests were employed. The
Mann–Whitney U test was used to examine differences in WHODAS scores between
dichotomous variables, such as gender (male vs. female), residence (rural vs.
urban), and living situation (alone vs. with family). The Kruskal–Wallis test
assessed differences across multi-category variables, including age group,
education level, marital status, and main work status. A significance threshold
of p
The demographic summary shows that the majority of participants were female (68.7%), had completed school or pre-university education (39.3%), and were married (43.2%) (Table 1). Most respondents were housewives (39.5%), indicating the predominance of non-working individuals. The distribution of urban (50.6%) and rural (49.4%) residences was nearly equal. Additionally, a vast majority (94.7%) lived with their families. These findings reflect a sample largely composed of married, non-working women with a basic education living in family households across both urban and rural areas. The age distribution revealed that the largest group of participants was 40–65 years (38.5%), followed by 24–39 years (26.3%). Participants over 65 years of age comprised 17.1% of the sample, while those under 18 accounted for 13.6%. The smallest group was 18–24 years of age (4.5%). This indicates that the sample consisted primarily of middle-aged and older adults, with fewer young adults and adolescents.
The Kruskal–Wallis test revealed several significant
differences in WHODAS 2.0 scores across demographic groups. The ANOVA results
showed significant differences in WHODAS scores by age (p
Table 2 presents key Rasch model statistics evaluating the psychometric properties of WHODAS 2.0. The person reliability was 0.80, indicating good consistency in measuring differences in disability levels among respondents. Person separation was 2.00, suggesting the instrument can distinguish among approximately three levels of functional ability. Item reliability was exceptionally high at 0.99, with an item separation of 9.83, confirming a well-dispersed and discriminative item set. The mean person measure was –0.49 logits, indicating that respondents were slightly more able than the average item difficulty. The mean item measure was 0.00 logits, aligning with Rasch model expectations. Infit and outfit mean square values for persons (1.03 and 1.10) and items (1.01 and 1.10) were within the acceptable range of 0.5 to 1.5, indicating a good model fit with no substantial misfitting responses or items. These findings reflect the strong psychometric performance of the Arabic version of WHODAS 2.0, demonstrating excellent reliability and construct validity, and supporting its suitability for assessing functional disability in Arabic-speaking populations.
| Parameter | Value | Interpretation | Threshold | Remarks |
| Person reliability | 0.80 | Acceptable | Good internal consistency | |
| Person separation | 2.00 | Can distinguish 3 ability levels | Adequate spread of persons | |
| Item reliability | 0.99 | Excellent | Strong item discrimination | |
| Item separation | 9.83 | Excellent | Wide range of item difficulties | |
| Mean person measure | –0.49 | Participants slightly more able | Centered at 0 | Scale is slightly difficult for this sample |
| Mean item measure | 0.00 | Standardized Rasch scale | Expected: 0 | Items centered around average difficulty |
| Infit MNSQ (person) | 1.03 | Good fit | 0.5–1.5 | Within acceptable range |
| Outfit MNSQ (person) | 1.10 | Acceptable | 0.5–1.5 | No major outliers |
| Infit MNSQ (item) | 1.01 | Excellent | 0.5–1.5 | Indicates good item fit |
| Outfit MNSQ (item) | 1.10 | Acceptable | 0.5–1.5 | No item misfit |
MNSQ, mean squares.
Table 3 depicts the findings of the PCA of the standardized residuals from the Rasch model, expressed in eigenvalue units. The total raw variance in the observations is 25.73, representing 100% of the variance in the dataset. Of these, 53.4% were explained by the Rasch measures, which is above the commonly accepted 50% threshold, supporting the assumption of unidimensionality. This explained variance is further divided into 36.6% by person measures and 16.8% by item measures, closely aligned with the expected values. The remaining 46.6% of the variance was unexplained. The largest portion of this residual variance is found in the first contrast, with an eigenvalue of 1.82 and accounting for 11.6% of the unexplained variance, which is lower than the expected value of 25%. Although this may indicate a potential minor secondary dimension, it does not exceed the critical eigenvalue threshold of 2.0. The second through fifth contrasts all have eigenvalues below 2.0, and contribute progressively smaller proportions to the unexplained variance (ranging from 3.9% to 7.8%), suggesting that these contrasts reflect random noise rather than meaningful multidimensionality. Overall, this table supports the conclusion that WHODAS 2.0 demonstrates a predominantly unidimensional structure in this sample.
| Component | Eigenvalues | Observed (%) | Expected (%) |
| Total raw variance in observations | 25.73 | 100.0% | 100.0% |
| Raw variance explained by measures | 13.72 | 53.4% | 53.2% |
| - by persons | 9.42 | 36.6% | 36.5% |
| - by items | 4.31 | 16.8% | 16.7% |
| Raw unexplained variance (total) | 12.00 | 46.6% | 46.8% |
| - 1st contrast | 1.82 | 11.6% | 25.0% |
| - 2nd contrast | 1.56 | 7.8% | 16.7% |
| - 3rd contrast | 1.37 | 5.3% | 11.4% |
| - 4th contrast | 1.07 | 4.2% | 9.0% |
| - 5th contrast | 0.99 | 3.9% | 8.3% |
Table 4 presents item-level Rasch statistics for WHODAS 2.0. Most items exhibited good fit, with infit and outfit MNSQ values within the satisfactory range (0.5–1.5). World Health Organization Disability Assessment Schedule 5 (WHODAS5) showed significant misfit. Exact match percentages were close to expectations, confirming model-data fit. Overall, the scale demonstrates strong psychometric properties, though one item may require review to ensure cultural appropriateness and construct alignment.
| Item | Infit MNSQ | Infit ZSTD | Outfit MNSQ | Outfit ZSTD |
| WHODAS5 | 1.80 | 9.90 | 2.36 | 9.90 |
| WHODAS11 | 1.46 | 4.81 | 1.50 | 3.90 |
| WHODAS1 | 1.21 | 3.07 | 1.46 | 5.20 |
| WHODAS10 | 1.27 | 3.04 | 1.36 | 2.79 |
| WHODAS7 | 1.10 | 1.59 | 1.07 | 0.95 |
| WHODAS6 | 0.93 | –1.12 | 1.00 | 0.07 |
| WHODAS4 | 0.77 | –3.96 | 0.84 | –2.17 |
| WHODAS9 | 0.74 | –3.77 | 0.84 | –1.56 |
| WHODAS12 | 0.76 | –4.04 | 0.68 | –4.47 |
| WHODAS8 | 0.74 | –3.85 | 0.67 | –3.58 |
| WHODAS3 | 0.70 | –5.38 | 0.71 | –4.14 |
| WHODAS2 | 0.67 | –5.93 | 0.64 | –5.29 |
ZSTD, standardized z-values; WHODAS, World Health Organization Disability Assessment Schedule.
Fig. 1 displays the category probability curve for item No. 5 (WHODAS5), illustrating the probability of endorsing each response category across varying levels of person ability relative to the item’s difficulty. Ideally, each category should have a distinct peak indicating the point at which it is the most likely response. However, this figure shows disordered thresholds—only the lowest (red: “None”) and highest (cyan: “Extreme”) categories dominate, while the middle categories (blue, pink, green) overlap and never peak distinctly. This suggests poor category functioning, meaning that the respondents are unlikely to choose intermediate options. This pattern indicates that WHODAS5 may not effectively differentiate among moderate levels of disability, possibly due to ambiguous wording, cultural misinterpretation, or difficulty understanding the rating scale. Consequently, this item may need to be revised to enhance the scale’s measurement accuracy.
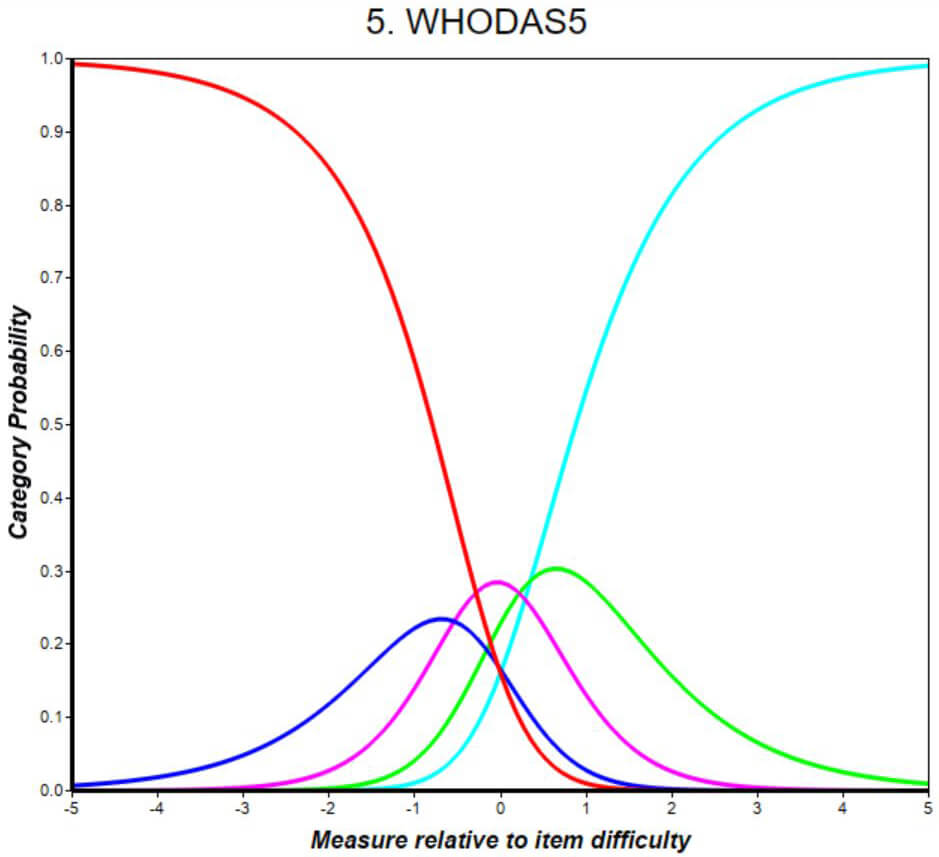 Fig. 1.
Category probability curve for World Health Organization Disability Assessment Schedule 5 (WHODAS5), showing disordered thresholds and poor distinction among middle response categories. The lowest and highest categories dominate, while intermediate options fail to peak. This suggests response scale dysfunction and limited measurement precision, indicating the item may require revision or removal.
DIF analysis showed no significant DIF across the examined classification groups, indicating that all World Health Organization Disability Assessment Schedule 2.0 (WHODAS 2.0) items function equivalently across subgroups. There were zero DIF classifications and no flagged pairwise comparisons, confirming that the items did not show evidence of measurement bias. The largest item calibration change was only 0.005 logits in the first iteration, reducing to –0.001 logits by the third iteration with zero active cells, suggesting model stability and convergence. These findings support the measurement invariance of WHODAS 2.0, and affirm its validity and fairness for comparing disability scores across different demographic or clinical groups.
Fig. 2 illustrates the Wright Map for WHODAS 2.0, which visually aligns the distribution of person abilities (left side) with item difficulties (right side) along the same logit scale. Each “#” symbol on the left represents a cluster of respondents at a particular ability level, while item labels on the right reflect their relative difficulty. The majority of participants were positioned between –1 and +1 logits, indicating a moderate level of self-reported disability. WHODAS10 and WHODAS11 emerged as the most difficult items, requiring higher levels of functional limitation to be endorsed, whereas WHODAS1, WHODAS2, and WHODAS7 were the easiest items for participants to affirm. The average person ability was slightly lower than the average item difficulty, suggesting that the items were somewhat more challenging than the sample’s functional level. While the item distribution shows good overall targeting, WHODAS5—although of average difficulty—may warrant revision due to its misfit as identified in previous Rasch outputs.
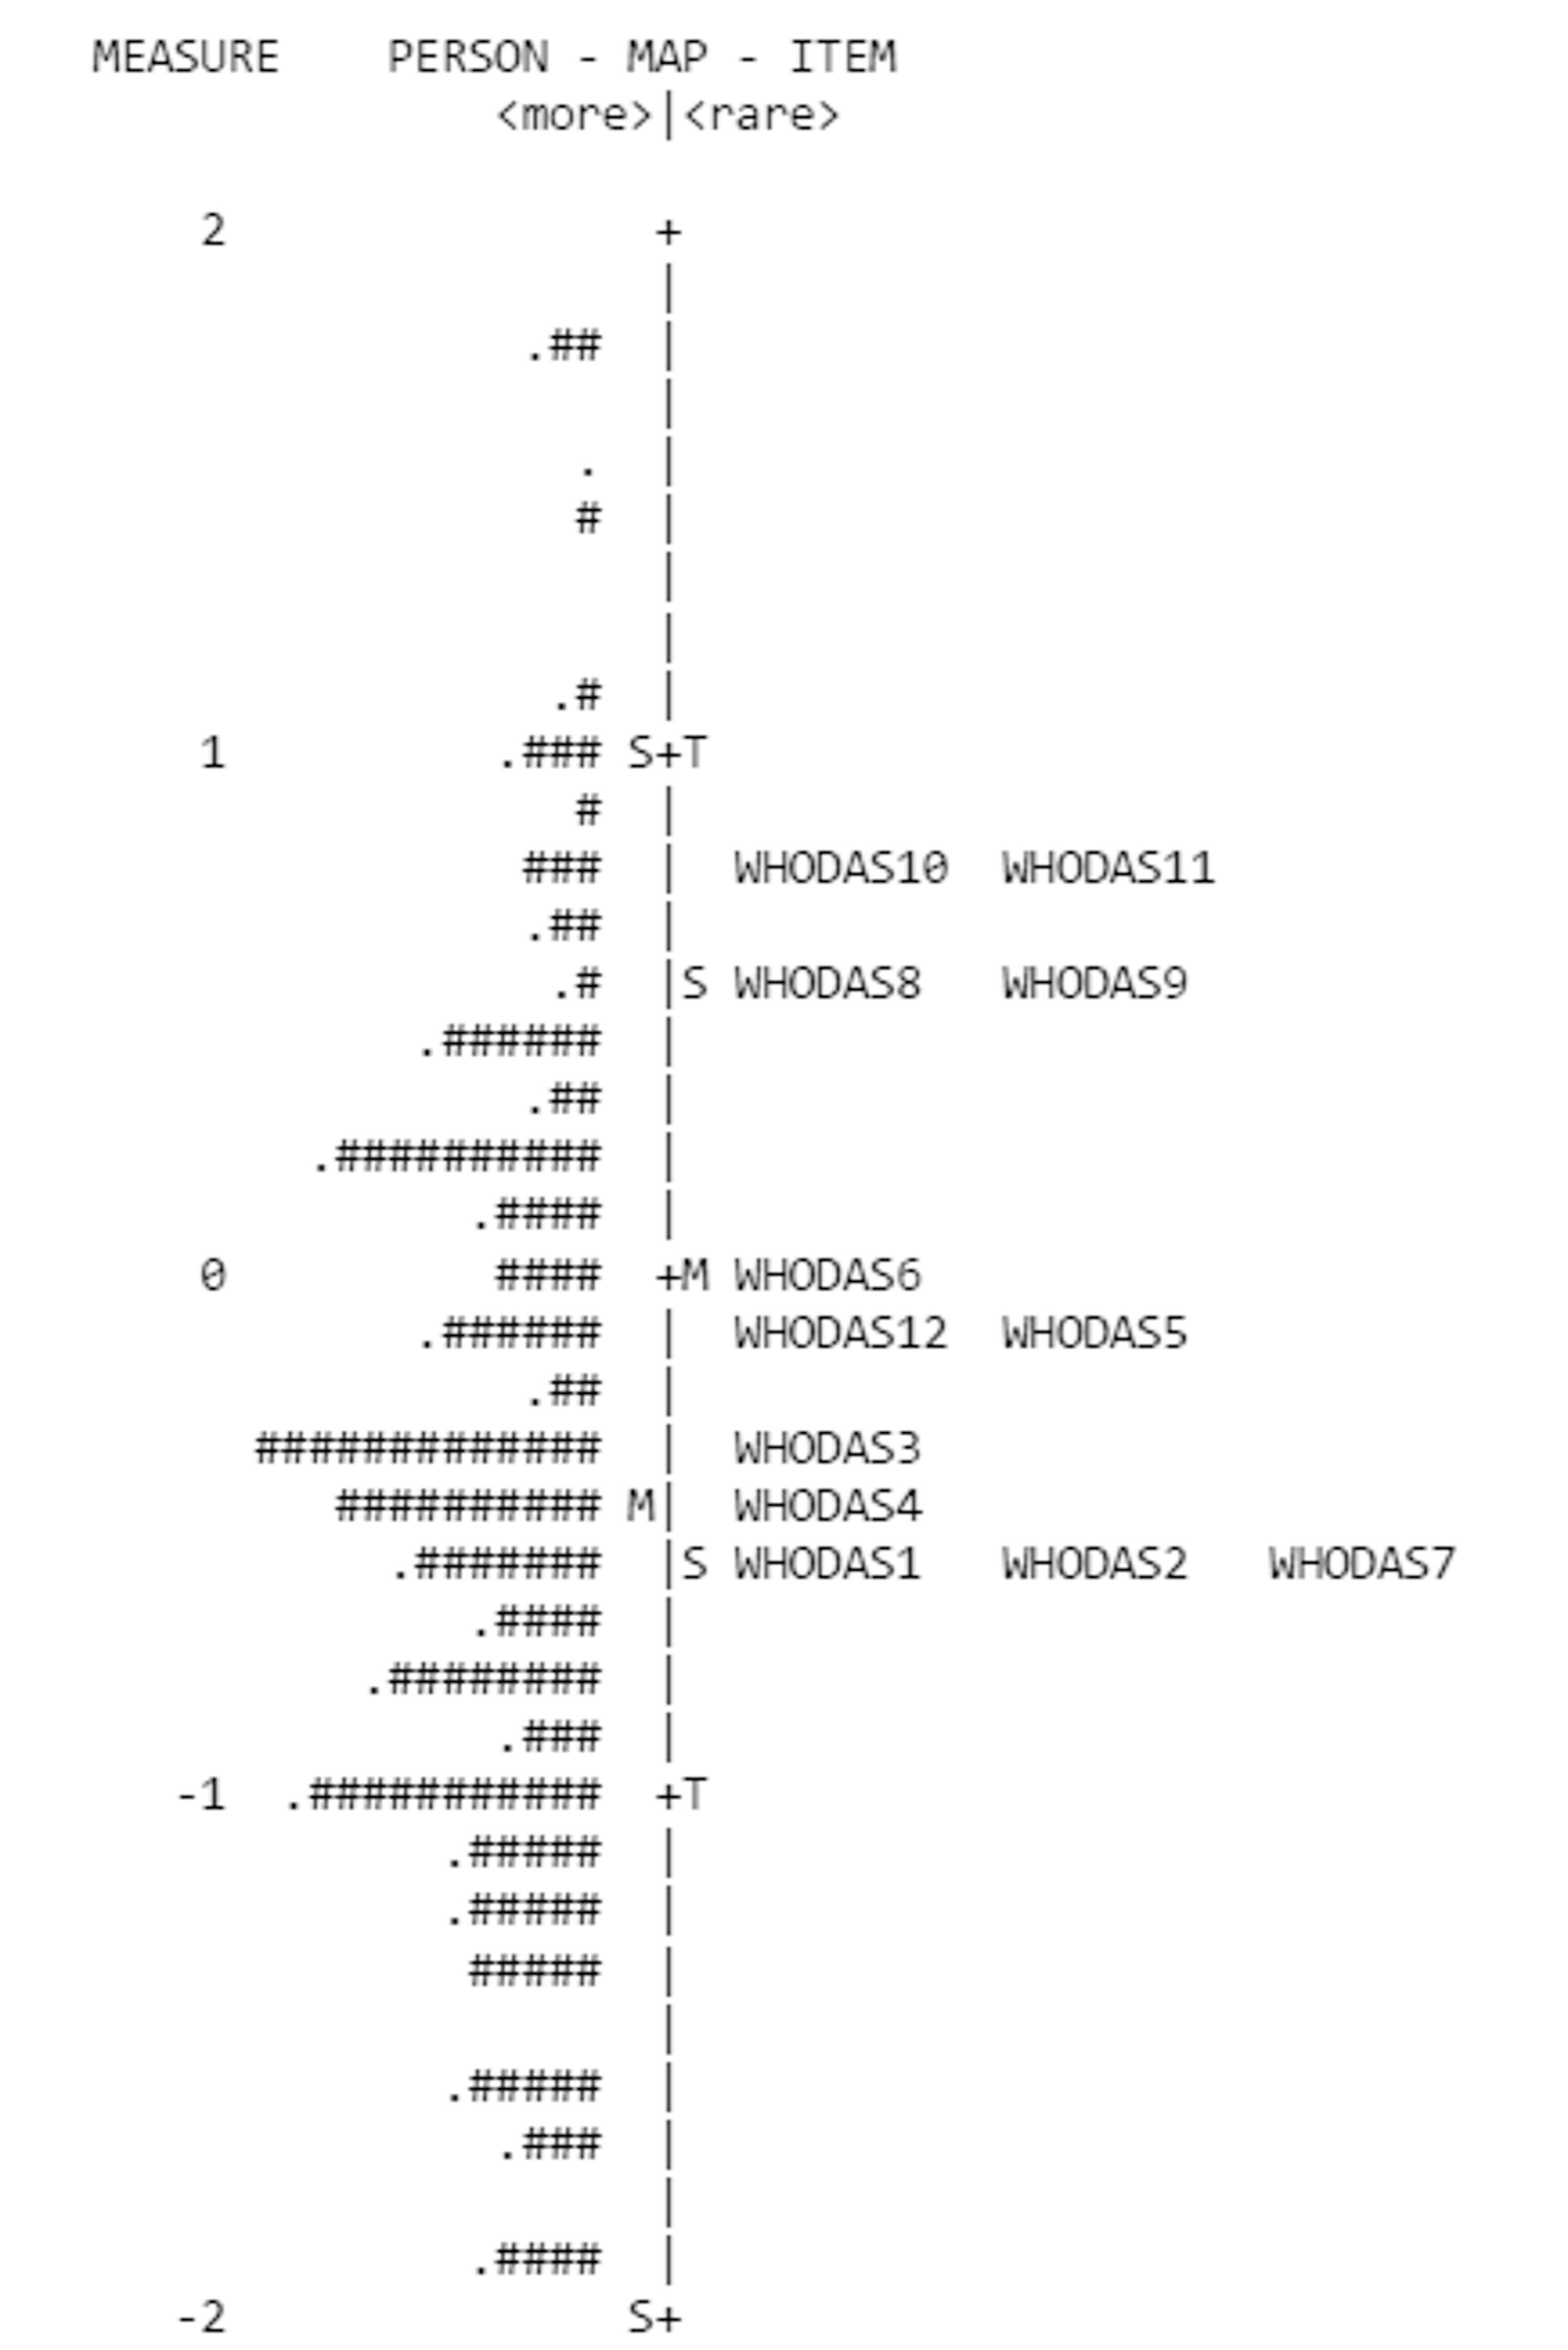 Fig. 2.
Wright Map displaying the alignment of person ability (left) and item difficulty (right) on the same logit scale for WHODAS 2.0. Each “#” symbol represents the frequency of respondents at a given ability level. Items above 0 logits (e.g., WHODAS10, WHODAS11) are more difficult for participants, while those below (e.g., WHODAS1, WHODAS2, WHODAS7) are easier. The map demonstrates good item-person targeting, with most individuals’ abilities distributed across the range of item difficulties. Symbols (S, T, M, +, .) are auto-generated WINSTEPS indicators denoting summary statistics and mean locations.
The Rasch analysis conducted on the Arabic version of the WHODAS 2.0 demonstrates its overall psychometric strength and applicability within Arabic-speaking populations. The person and item reliability values (0.80 and 0.99, respectively) indicate a high level of internal consistency and strong discrimination among items, consistent with the standards for Rasch modeling [24, 25, 26, 27, 28]. The item-person map (Wright Map) showed appropriate targeting, with a reasonable alignment between item difficulty and respondent ability, although items were slightly more difficult than the average respondent ability level [29, 30].
Most items fit the Rasch model well, with outfit and infit mean square values within the suitable range of 0.5–1.5 [31]. However, WHODAS5 exhibited substantial misfit, with high infit and outfit values and disordered thresholds observed in the category probability curve. These findings suggest that WHODAS5 may not effectively differentiate levels of disability, likely due to ambiguous wording or cultural interpretation. Revising or removing this item should be considered to enhance the measurement precision [32].
PCA of residuals supported the unidimensionality of the scale [22], with 53.4% of the variance explained by Rasch measures [23]. Although the first contrast approached a potentially meaningful level, it remained below the critical threshold of eigenvalue = 2.0 for substantial multidimensionality [21]. Moreover, DIF analysis showed no significant item bias across classification groups, further confirming the instrument’s fairness and validity [33, 34].
The findings imply that the Arabic WHODAS 2.0 can be used effectively and accurately for assessing disability across different cultures. Its strong item scale structure, robust targeting, and absence of DIF validate its clinical utility and relevance in health research [35]. However, more qualitative research is required to analyze the cultural relevance of all items and ensure that interpretations are contextually appropriate, given that culture can affect performance and response interpretation [36].
While the current findings are promising, the limitations include the use of a single regional sample, the cross-sectional design, and the lack of classification of disability types or severity levels. Additionally, the sample’s gender imbalance (68.7% female) and the high proportion of housewives (39.5%) may introduce gender- and role-related response biases, potentially affecting the generalizability and interpretability of the results. Future studies should explore broader, longitudinal samples and incorporate detailed categorizations of disability to strengthen the applicability and robustness of findings. In conclusion, with minor refinements, the Arabic WHODAS 2.0 provides a psychometrically sound tool for assessing functional disability in Arabic-speaking populations.
This study confirms that the Arabic version of WHODAS 2.0 is a valid, reliable, and psychometrically sound instrument for assessing disability in Arabic-speaking populations. Rasch analysis demonstrated good item and person reliability, unidimensionality, and appropriate item-person targeting. Most items fit the model well, supporting the structural integrity of the scale. However, WHODAS5 exhibited misfit and disordered thresholds, suggesting the need for linguistic or cultural refinement. These findings support the instrument’s application in both clinical and research contexts for evaluating functional disability. Future research should explore item interpretation through qualitative methods, such as cognitive interviews, and conduct longitudinal studies to assess the tool’s responsiveness to change and its applicability across different subgroups and regions.
The datasets used and analyzed during the current study are available from the corresponding author upon reasonable request.
OA, SIA, IG and MT conceived and designed the study. OA, IG, and MT coordinated data collection and study administration. DA and FA contributed to data acquisition and quality control. AHM and SIA performed data analysis and interpretation. SIA, OA, and MT drafted the initial manuscript. All authors (OA, SIA, IG, MT, DA, FA, AHM) critically reviewed the manuscript, approved the final version, and agreed to be accountable for all aspects of the work.
The Jazan Health Cluster Ethics Committee of Saudi Arabia granted ethical permission for the study (no. 2487 on 2 December 2024) and was conducted in accordance with the Declaration of Helsinki. Within the boundaries of the Kingdom of Saudi Arabia, this study complied with ethical standards. All participants or their legal guardians provided informed consent before completing the survey, guaranteeing their privacy and voluntary involvement. The information gathered was kept anonymous and was used only for this study.
The authors extend their appreciation to the King Salman Center for Disability Research for funding this work through Research Group no. KSRG-2024-406.
This research was supported by the King Salman Center for Disability Research through Research Group no. KSRG-2024-406.
The authors declare no conflict of interest.
References
Publisher’s Note: IMR Press stays neutral with regard to jurisdictional claims in published maps and institutional affiliations.