


 , Man-Jeong Paik 1,*
1 College of Pharmacy, and Research Institute of Life and Pharmaceutical Sciences, Sunchon National University, 57922 Suncheon, Republic of Korea
2 Central R&D Center, B&Tech Co., Ltd., 58205 Naju, Republic of Korea
3 Department of Pharmacy, College of Pharmacy, Pusan National University, 46241 Busan, Republic of Korea
†These authors contributed equally.
Abstract
Background: Aging is a progressive process characterized by weakness in
brain function. Although metabolomics studies on the brain related with aging
have been conducted, it is not yet fully understood. A systematic metabolomics
study was performed to search for biomarkers and monitor altered metabolism in
various brain tissues of the cortex, cerebellum, hypothalamus, and hippocampus of
young (8 months old) and old rats (22 months old). Methods: Simultaneous
profiling analysis of amino acids (AAs), organic acids (OAs), and fatty acids
(FAs) in the brain tissues of young and old rats were performed by gas
chromatography-tandem mass spectrometry. Results: Under optimal
conditions, AA, OA, and FA profiling methods showed good linearity (r
Keywords
- aging
- amino acid
- organic acid
- fatty acid
- metabolic profiling analysis
- rat brain tissues
- gas chromatography-tandem mass spectrometry
Aging is a process that involves the physiological deterioration of tissues and
organs, which involves the gradual accumulation of cell damage and increased
susceptibility to diseases over time [1, 2]. Therefore, many studies have been
conducted on organs that deteriorate with age [3, 4, 5]. Especially, Alzheimer’s and
Parkinson’s diseases are known as neurodegenerative brain diseases [6, 7, 8]. The
brain requires a large amount of energy; thus, it is sensitive to changes in
energy supply and mitochondrial function. Mitochondrial dysfunction,
inflammation-related oxidative stress, and glucose metabolism may lead to
brain-related energy metabolism disorders associated with age-related functional
changes [9, 10]. Therefore, metabolomics studies on brain aging is essential.
Metabolomics is a comprehensive study of low-molecular-weight metabolites
(
The standards used in this study, including 32 AAs, 19 OAs, and 25 FAs, were purchased from Sigma-Aldrich (St. Louis, MO, USA) and Tokyo Chemical Industry (Kita-ku, Tokyo, Japan). Norvaline, 3,4-dimethoxybenzoic acid, and pentadecanoic acid (PDA) were purchased from Sigma-Aldrich (St. Louis, MO, USA) and were used as internal standards (ISs). HPLC-grade distilled water (DW) and acetonitrile (ACN) were purchased from J.T. Baker, Inc. (Phillipsburg, NJ, USA). Triethylamine (TEA) was purchased from Sigma Aldrich. Toluene, diethyl ether (DEE), ethyl acetate (EA), dichloromethane (DCM), and sodium chloride (NaCl) were purchased from Kanto Chemical Co. (Chuo-ku, Tokyo, Japan). Sodium hydroxide (NaOH) and sulfuric acid (H2SO4) were purchased from Daejung Reagent Chemicals (Siheung, South Korea). As derivatization reagents, methoxyamine hydrochloride, N-methyl-N-(tert-butyldimethylsilyl) trifluoroacetamide (MTBSTFA) + 1% tert-butyldimethylchlorosilane, and ethyl chloroformate (ECF) were obtained from Thermo Fisher Scientific (Bellefonte, PA, USA). All chemicals were analytical grade.
For standard and IS stock solutions, 32 AAs and norvaline (IS) were prepared at a concentration of 10 mg/mL in 0.1 M HCl. 19 OAs and 3,4-dimethoxybenzoic acid (IS) were prepared at a concentration of 10 mg/mL in methanol. 25 FAs and PDA (IS) were prepared at a concentration of 10 mg/mL in toluene. All standard stock solutions were stored at –20 ℃. For GC-MS/MS analysis, 19 OAs standard working solution mixtures were prepared at concentrations of 10 µg/mL and 100 µg/mL in methanol, and 3,4-dimethoxybenzoic acid (IS) was prepared at a concentration of 10.0 µg/mL in methanol. The 32 AAs standard working solution mixtures were prepared at concentrations of 10 µg/mL and 100 µg/mL in 0.1 M HCl, and norvaline was prepared at a concentration of 20 µg/mL in 0.1 M HCl. The 25 FAs standard working solution mixtures were prepared at concentrations of 10 µg/mL and 100 µg/mL in toluene, and PDA was prepared at a concentration of 10 µg/mL in toluene.
Eight male Sprague-Dawley rats (Osan, South Korea), aged 8 months (young) and 22
months (old), were used in the experiment. Rats were individually housed in
polycarbonate cages with wood chip bedding, maintained in an air-conditioned
animal room (temperature: 24 °C; relative humidity: 55
Analyses of standards and samples were performed using a GCMS-TQ8040 (Shimadzu,
Tokyo, Japan) interfaced with a triple quadrupole mass spectrometer (70 eV,
electron impact ionization mode) in the selected reaction monitoring (SRM) mode
for quantitative analysis. The injector, interface, and ion source temperatures
were maintained at 260, 300, and 230 °C, respectively. An Ultra-2 (5%
phenyl–95% methylpolysiloxane bonded phase; 25 m
Pooled brain tissues including the cortex, cerebellum, hypothalamus, and hippocampus of rats were used for matrix validation of AAs, OAs and FAs. A mixed standard solution containing 18 AAs of 20–1000 ng and norvaline of 200 ng as IS was used for optimization of AA profiling analysis as EOC/TBDMS derivatives. For the method validation of simultaneous OA and FA profiling analyses as MO/TBDMS derivatives, mixed standard solution containing 13 OAs and 10 FAs of 20–1000 ng, and ISs [3,4-dimethoxybenzoic acid (100 ng) as IS of OAs and PDA (100 ng) as IS of FAs] were used in this study [24, 25]. Then, these were spiked to pooled brain tissue solution of 0.2 mg and was vortex-mixed with acetonitrile (150 µL) to precipitate proteins and centrifuged at 13,500 rpm for 3 min. Then, each method validation was performed according to the following method.
In method validation for AA profiling analysis, the supernatant was transferred
to a vial containing ECF (40 µL) and DCM (2 mL), and then DW (820 µL)
was added. The aqueous phase was then adjusted to pH
In method validation for OA and FA profiling analyses, the supernatant was
transferred to a vial and DW (820 µL) was added. Methoxyamine hydrochloride
(1 mg) was added to the aqueous phase, adjusted to pH
These methods were performed in triplicate under optimal conditions and were validated for analytical parameters including linearity, repeatability, accuracy, limits of detection (LOD) and limits of quantitation (LOQ). The values of slope, intercept and correlation coefficient were determined to linearity test using the least squares regression analysis on a calibration curve constructed based on the relative peak area ratios to IS. The LOD and LOQ value for each metabolite were calculated as three- and 10-times the standard deviation of the blank divided by the slope of calibration curve. Repeatability as relative standard deviation (% RSD) and accuracy as relative error (% RE) were performed in triplicate within the range that included metabolite levels detected.
For the metabolomics study, profiling analyses of AAs, OAs, and FAs were performed using GC-MS/MS as EOC/TBDMS and MO/TBDMS [24, 25]. Briefly, each brain tissue sample was homogenized in DW and centrifuged at 13,500 rpm for 3 min.
For AA profiling analysis, an aliquot of the homogenate equivalent to the weight
of each brain tissue (4 mg cortex, 1 mg cerebellum, 1 mg hypothalamus, 0.5 mg
hippocampus), and norvaline (0.2 µg) were added to 60 µL of ACN and
centrifuged at 13,500 rpm for 3 min. The supernatant was transferred to a vial
containing ECF (40 µL) and DCM (2 mL), and then DW (1 mL) was added. The
aqueous phase was then adjusted to pH
For OAs and FAs profiling analysis, an aliquot of the homogenate equivalent to
the weight of each brain tissue (8 mg cortex, 2 mg cerebellum, 2 mg hypothalamus,
1 mg hippocampus) and 3,4-dimethoxybenzoic acid and PDA (0.1 µg) were added
to 120 µL of ACN and centrifuged at 13,500 rpm for 3 min. The supernatant
was transferred to a vial and DW (1 mL) was added. Methoxyamine hydrochloride (1
mg) was added to the aqueous phase, adjusted to pH
 Fig. 1.
Workflow the steps of metabolomics analysis. EOC, ethoxycarbonyl; AAs, amino acids; MO, methoximation; OAs, organic acids; FAs, fatty acids; TBDMS, tert-butyldimethylsilyl; GC-MS/MS, gas chromatography-tandem mass spectrometry.
The levels of AAs, OAs, and FAs in the brain tissues were calculated according
to each calibration curve. For drawing a star graphic patterns, the mean levels
of AAs, OAs, and FAs in the older group were normalized to the mean level in the
young group, and then Microsoft Excel Office 365 (Microsoft, Redmond, WA, USA) to
draw a star graphic pattern [20, 21, 24, 25]. Univariate statistical analysis was
performed by a Student’s t-test to compare the average differences in
all metabolites between the young and aging groups. The normality of the data was
evaluated using the Shapiro-Wilk test, and the Wilcoxon rank sum test as a
non-parametric test was used because the data did not follow a normal
distribution. Due to the small sample size, multiple comparison tests were
performed using the Benjamini-Hochberg procedure to control the false discovery
rate (FDR) for enhancing the accuracy and reliability of the data. The
p-values from the results of the Wilcoxon rank sum test were adjusted
using FDR, and metabolites with a Q-value
In this study, the precursor ion of each AA, OA, and FA generated by 70 eV electron impact (EI) in ion source was detected and selected in the first quadrupole (Q1). Precursor ions of AAs were fragmented by collision energy (CE) in the range of –5– –45 V using argon gas, a collision-induced dissociation gas, in a collision cell (Q2) to generate product ions, which were collected in the third quadrupole (Q3). Three product ions were selected for identification of AA, OA, and FA, and one product ion with high sensitivity and selectivity was selected as the quantitative ion for each AA, OA, and FA without matrix effect of the tissue sample. The SRM mode conditions of AAs, OAs, and FAs were presented in Table 1.
| No. | Metabolite | Retention time | SRM (m/z) | CE (V) |
| 1 | Alanine | 5.3 | 218.00 |
5 |
| 2 | Glycine | 5.5 | 204.00 |
5 |
| 3 | 6.5 | 218.00 |
15 | |
| 4 | Valine | 6.6 | 246.00 |
5 |
| 5 | Leucine | 7.5 | 260.00 |
5 |
| 6 | Isoleucine | 7.7 | 260.00 |
5 |
| 7 | Proline | 8.2 | 244.00 |
10 |
| 8 | 8.2 | 232.00 |
5 | |
| 9 | Pyroglutamic acid | 10.3 | 300.00 |
20 |
| 10 | Methionine | 10.9 | 278.00 |
5 |
| 11 | Serine | 11.1 | 348.00 |
25 |
| 12 | Threonine | 11.2 | 362.00 |
25 |
| 13 | Phenylalanine | 12.3 | 294.00 |
10 |
| 14 | Cysteine | 12.7 | 322.00 |
10 |
| 15 | Aspartic acid | 12.9 | 376.00 |
35 |
| 16 | Glutamic acid | 14.3 | 390.00 |
30 |
| 17 | Asparagine | 14.5 | 375.00 |
10 |
| 18 | Ornithine | 14.9 | 333.00 |
5 |
| 19 | Glutamine | 15.8 | 389.00 |
30 |
| 20 | Lysine | 16.0 | 301.00 |
10 |
| 21 | Tyrosine | 17.9 | 335.00 |
20 |
| 22 | Tryptophan | 18.5 | 244.00 |
15 |
| 23 | Pyruvic acid | 4.7 | 174.00 |
15 |
| 24 | Acetoacetic acid | 5.9 | 188.00 |
9 |
| 25 | Lactic acid | 7.7 | 261.00 |
15 |
| 26 | Glycolic acid | 7.8 | 247.00 |
15 |
| 27 | 3-Hydroxypropionic acid | 8.7 | 261.00 |
15 |
| 28 | Succinic acid | 10.7 | 289.00 |
10 |
| 29 | Fumaric acid | 11.1 | 287.00 |
15 |
| 30 | Oxaloacetic acid | 12.1 | 332.00 |
10 |
| 31 | Malic acid | 14.2 | 419.00 |
10 |
| 32 | Citric acid | 18.4 | 459.00 |
20 |
| 33 | Myristic acid | 13.9 | 285.00 |
10 |
| 34 | Palmitoleic acid | 15.5 | 311.00 |
10 |
| 35 | Palmitic acid | 15.7 | 313.00 |
10 |
| 36 | Linoleic acid | 17.1 | 337.00 |
15 |
| 37 | Oleic acid | 17.1 | 339.00 |
10 |
| 38 | Stearic acid | 17.3 | 341.00 |
10 |
| 39 | Arachidonic acid | 18.3 | 361.00 |
5 |
| 40 | Eicosadienoic acid | 18.6 | 365.00 |
25 |
| 41 | Gondoic acid | 18.7 | 367.00 |
10 |
| 42 | Docosahexaenoic acid | 19.7 | 385.00 |
24 |
| 43 | Docosatetraenoic acid | 19.8 | 389.00 |
25 |
| 44 | Erucic acid | 20.1 | 395.00 |
15 |
| 45 | Nervonic acid | 21.4 | 423.00 |
15 |
| IS | Norvaline | 7.1 | 246.00 |
5 |
| IS | 3,4-Dimethoxybenzoic acid | 12.8 | 239.00 |
10 |
| IS | Pentadecanoic acid | 14.0 | 299.00 |
10 |
Note: SRM, Selective reaction mode; CE, Collision energy; IS, Internals standard.
Profiling method for 22 AAs was validated under optimal conditions. The calibration curves of 22 AAs ranging from 20 to 10,000 ng examined under optimal condition were linearity (correlation coefficients; r) better than 0.9950 with good LODs (0.1–30 ng) and LOQs (0.2–90.1 ng). The repeatability and accuracy of the analysis method were measured in concentrations range and varied from 0.4 to 10.4 (% RSD) and –11.3 to 10.3 (% RE), respectively. The repeatability and accuracy of the overall procedure measured at three different concentrations are shown in Table 2. The results of the validated assay parameters indicated that this assay was suitable for the quantitative analysis of 22 AAs in brains tissues.
| No. | Metabolite | Calibration | Linearity (r) | LOD (ng) | LOQ (ng) | Repeatability | Accuracy |
| range (ng) | (% RSD) | (% RE) | |||||
| 1 | Alanine | 200–5000 | 0.9998 | 1.1 | 3.4 | 1.3–2.2 | 0.11–3.5 |
| 2 | Glycine | 20–2000 | 0.9999 | 3.5 | 10.6 | 1.2–10.4 | –11.3–4.4 |
| 3 | 20–200 | 0.9990 | 0.4 | 1.1 | 2.4–3.2 | –2.9–6.1 | |
| 4 | Valine | 50–2000 | 1.0000 | 0.1 | 0.4 | 0.4–3.7 | –10.2–1.5 |
| 5 | Leucine | 50–5000 | 0.9999 | 0.3 | 1.0 | 0.6–1.4 | –7.3–2.6 |
| 6 | Isoleucine | 20–2000 | 0.9999 | 0.3 | 0.9 | 0.9–5.1 | –0.60–3.4 |
| 7 | Proline | 50–2000 | 0.9999 | 0.3 | 1.0 | 1.0–8.4 | –4.7–1.3 |
| 8 | r-Aminobutyric acid | 50–10,000 | 0.9982 | 0.3 | 0.8 | 2.9–7.3 | –10.2–2.9 |
| 9 | Pyroglutamic acid | 200–10,000 | 0.9993 | 17.2 | 51.5 | 2.8–6.5 | –4.4–7.1 |
| 10 | Methionine | 200–10,000 | 0.9966 | 30.0 | 90.1 | 4.9–5.8 | 1.7–5.1 |
| 11 | Serine | 50–2000 | 0.9986 | 2.7 | 8.2 | 2.9–6.8 | –2.3–10.3 |
| 12 | Threonine | 20–2000 | 0.9991 | 2.9 | 8.8 | 0.8–2.9 | –2.1–0.53 |
| 13 | Phenylalanine | 50–5000 | 0.9972 | 0.1 | 0.3 | 5.7–8.0 | –5.4–3.2 |
| 14 | Cysteine | 50–500 | 0.9995 | 1.8 | 5.5 | 1.7–6.6 | 0.13–1.8 |
| 15 | Aspartic acid | 50–10,000 | 0.9971 | 1.8 | 5.4 | 1.1–5.0 | –8.7–10.1 |
| 16 | Glutamic acid | 50–10,000 | 0.9962 | 0.5 | 1.6 | 1.1–2.5 | –2.5–4.9 |
| 17 | Asparagine | 50–5000 | 0.9963 | 3.8 | 11.3 | 4.0–7.3 | 4.9–6.9 |
| 18 | Ornithine | 50–2000 | 0.9980 | 2.0 | 5.9 | 2.8–3.6 | –6.4–9.6 |
| 19 | Glutamine | 20–5000 | 0.9971 | 2.0 | 6.1 | 5.3–5.9 | –0.82–9.9 |
| 20 | Lysine | 20–2000 | 0.9950 | 2.0 | 5.9 | 6.7–7.3 | –9.8–7.8 |
| 21 | Tyrosine | 50–10,000 | 0.9985 | 0.4 | 1.1 | 3.2–3.8 | –0.17–3.1 |
| 22 | Tryptophan | 50–10,000 | 0.9982 | 0.1 | 0.2 | 4.3–5.7 | 0.028–4.0 |
Note: LOD, Limit of detection; LOQ, Limit of quantification; RSD, Relative standard deviation; RE, Relative error.
Profiling method for 10 OAs and 13 FAs was validated under optimal conditions. The calibration curves of 10 OAs and 13 FAs ranging from 20 to 10,000 ng examined under optimal condition were linearity (r) better than 0.9950 with good LODs (0.1–73.2 ng) and LOQs (0.2–219.5 ng). The repeatability and accuracy of the analysis method were measured in concentrations range and varied from 0.8 to 14.8 (% RSD) and –12.8 to 14.1 (% RE), respectively. The repeatability and accuracy of the overall procedure measured at three different concentrations are shown in Table 3. The results of the validated assay parameters indicated that this assay was suitable for the quantitative analyses of 10 OAs and 13 FAs in brains tissues.
| No. | Metabolite | Calibration range (ng) | Linearity (r) | LOD (ng) | LOQ (ng) | Repeatability | Accuracy |
| (% RSD) | (% RE) | ||||||
| 23 | Pyruvic acid | 20–200 | 0.9959 | 4.2 | 12.7 | 6.3–6.4 | –4.9–10.2 |
| 24 | Acetoacetic acid | 200–10,000 | 0.9960 | 1.8 | 5.3 | 3.2–4.5 | –10.2–10.7 |
| 25 | Lactic acid | 50–10,000 | 0.9953 | 16.0 | 47.9 | 5.5–8.5 | –4.7–3.2 |
| 26 | Glycolic acid | 50–2000 | 0.9981 | 12.2 | 36.6 | 4.0–6.1 | –12.1–5.5 |
| 27 | 3-Hydroxypropionic acid | 20–200 | 0.9972 | 1.4 | 4.1 | 4.1–8.7 | –4.3–2.0 |
| 28 | Succinic acid | 20–200 | 0.9967 | 4.0 | 12.0 | 5.3–8.2 | –3.5–7.4 |
| 29 | Fumaric acid | 20–2000 | 0.9994 | 0.9 | 2.7 | 1.8–10.5 | –12.3–5.1 |
| 30 | Oxaloacetic acid | 50–2000 | 0.9951 | 4.9 | 14.8 | 7.0–14.8 | –2.7–1.1 |
| 31 | Malic acid | 50–5000 | 0.9994 | 1.7 | 5.1 | 2.4–7.6 | –1.6–6.7 |
| 32 | Citric acid | 20–2000 | 0.9969 | 2.4 | 7.1 | 5.6–13.9 | –2.0–3.6 |
| 33 | Tetradecanoic acid | 20–2000 | 0.9954 | 3.9 | 11.6 | 5.2–7.1 | –12.8–3.8 |
| 34 | Palmitoleic acid | 20–500 | 0.9951 | 3.5 | 10.4 | 7.4–9.7 | 0.3–10.3 |
| 35 | Palmitic acid | 50–10,000 | 0.9985 | 4.7 | 14.1 | 4.8–11.7 | 1.3–14.1 |
| 36 | Linoleic acid | 50–2000 | 0.9973 | 6.6 | 19.7 | 4.0–5.1 | –1.6–1.1 |
| 37 | Oleic acid | 20–10,000 | 0.9985 | 2.6 | 7.8 | 2.4–11.3 | –5.3–9.3 |
| 38 | Stearic acid | 50–10,000 | 0.9967 | 16.1 | 48.2 | 3.5–9.3 | –3.4–8.9 |
| 39 | Arachidonic acid | 500–10,000 | 0.9950 | 73.2 | 219.5 | 0.8–4.5 | –7.7–9.6 |
| 40 | Eicosadienoic acid | 20–2000 | 0.9989 | 0.3 | 0.8 | 0.9–7.7 | –0.08–6.1 |
| 41 | Gondoic acid | 20–2000 | 0.9985 | 2.5 | 7.4 | 2.9–3.1 | –5.1–10.9 |
| 42 | Docosahexaenoic_acid | 500–10,000 | 0.9953 | 1.7 | 5.2 | 4.8–6.7 | –3.4–3.3 |
| 43 | Docosatetraenoic acid | 500–10,000 | 0.9983 | 2.1 | 6.4 | 2.9–9.4 | –1.8–5.3 |
| 44 | Erucic acid | 20–200 | 0.9986 | 1.0 | 2.9 | 2.5–5.7 | –13.9–6.7 |
| 45 | Nervonic acid | 20–200 | 0.9991 | 0.1 | 0.4 | 2.2–7.7 | –0.9–1.9 |
Note: LOD, Limit of detection; LOQ, Limit of quantification; RSD, Relative standard deviation; RE, Relative error.
Metabolites determined in each brain tissue were analyzed using the Wilcoxon rank-sum test by comparing the young and old groups.
In the cortex, the levels of 32 metabolites were determined in the young (n = 8)
and old (n = 6) groups. In the young group, acetoacetic acid was the most
abundant, followed by lactic acid and glutamic acid, whereas in the old group,
lactic acid was the most abundant, followed by glutamic acid and acetoacetic acid
(Table 4). In particular, 10 AAs (alanine, glycine, valine, leucine, isoleucine,
threonine, serine, proline, phenylalanine, and tyrosine) and lactic acid were
increased (p-value
| No. | Metabolite | Concentration (ng/mg, Mean |
Normalized Value* | Wilcoxon rank-sum test | PCA Loading score | OPLS-DA (VIP score) | ||||
| Young | Old | Young | Old | p-value | Q-value (FDR) | PC1 | PC2 | |||
| Amino acid | ||||||||||
| 1 | Alanine | 279.7 |
323.0 |
1.00 | 1.15 | 0.005 | 0.019 | 0.254 | 0.177 | 1.28 |
| 2 | Glycine | 190.5 |
198.5 |
1.00 | 1.04 | 0.043 | 0.124 | 0.206 | 0.180 | 0.77 |
| 3 | 4.3 |
4.0 |
1.00 | 0.92 | 0.108 | 0.216 | –0.065 | 0.194 | 1.09 | |
| 4 | Valine | 142.6 |
163.6 |
1.00 | 1.15 | 0.003 | 0.012 | 0.238 | 0.103 | 1.53 |
| 5 | Leucine | 253.2 |
301.4 |
1.00 | 1.19 | 0.001 | 0.005 | 0.258 | 0.087 | 1.75 |
| 6 | Isoleucine | 165.9 |
197.4 |
1.00 | 1.19 | 0.001 | 0.005 | 0.255 | 0.160 | 1.59 |
| 7 | Proline | 134.3 |
156.7 |
1.00 | 1.17 | 0.001 | 0.005 | 0.256 | 0.139 | 1.61 |
| 8 | 408.6 |
397.4 |
1.00 | 0.97 | 0.662 | 0.730 | 0.051 | 0.170 | 0.50 | |
| 9 | Pyroglutamic acid | 96.2 |
95.9 |
1.00 | 1.00 | 0.345 | 0.460 | 0.037 | 0.422 | 0.08 |
| 10 | Methionine | 28.4 |
44.0 |
1.00 | 1.55 | 0.081 | 0.200 | 0.035 | –0.031 | 0.71 |
| 11 | Serine | 345.9 |
432.3 |
1.00 | 1.25 | 0.003 | 0.012 | 0.216 | 0.212 | 1.33 |
| 12 | Threonine | 178.1 |
270.3 |
1.00 | 1.52 | 0.001 | 0.009 | 0.259 | 0.019 | 1.38 |
| 13 | Phenylalanine | 166.3 |
204.2 |
1.00 | 1.23 | 0.001 | 0.005 | 0.273 | –0.001 | 1.69 |
| 14 | Cysteine | 10.9 |
12.5 |
1.00 | 1.14 | 0.491 | 0.582 | 0.164 | –0.156 | 0.78 |
| 15 | Aspartic acid | 677.9 |
636.5 |
1.00 | 0.94 | 0.108 | 0.216 | –0.200 | –0.047 | 1.21 |
| 16 | Glutamic acid | 808.2 |
830.6 |
1.00 | 1.03 | 0.282 | 0.430 | 0.122 | –0.309 | 0.41 |
| 17 | Asparagine | 128.0 |
132.3 |
1.00 | 1.03 | 0.950 | 0.950 | 0.172 | –0.080 | 0.37 |
| 18 | Ornithine | 11.8 |
11.3 |
1.00 | 0.95 | 0.852 | 0.909 | 0.108 | –0.172 | 0.35 |
| 19 | Glutamine | 422.3 |
431.7 |
1.00 | 1.02 | 0.950 | 0.950 | 0.146 | –0.289 | 0.05 |
| 20 | Lysine | 328.1 |
411.2 |
1.00 | 1.25 | 0.108 | 0.216 | 0.209 | –0.289 | 0.78 |
| 21 | Tyrosine | 145.9 |
230.1 |
1.00 | 1.58 | 0.020 | 0.071 | 0.250 | –0.147 | 1.27 |
| 22 | Tryptophan | 58.4 |
79.0 |
1.00 | 1.35 | 0.228 | 0.019 | 0.228 | –0.231 | 0.83 |
| Organic acid | ||||||||||
| 23 | Pyruvic acid | 7.3 |
7.2 |
1.00 | 0.99 | 0.491 | 0.582 | 0.003 | –0.197 | 0.27 |
| 24 | Acetoacetic acid | 1346.0 |
812.7 |
1.00 | 0.60 | 0.142 | 0.267 | –0.177 | –0.025 | 0.96 |
| 25 | Lactic acid | 912.0 |
1019.5 |
1.00 | 1.12 | 0.043 | 0.124 | 0.103 | –0.054 | 1.05 |
| 26 | Glycolic acid | 75.5 |
65.5 |
1.00 | 0.87 | 0.081 | 0.200 | –0.178 | 0.044 | 1.09 |
| 27 | 3-Hydroxypropionic acid | 7.8 |
8.4 |
1.00 | 1.09 | 0.573 | 0.655 | 0.144 | 0.040 | 0.33 |
| 28 | Succinic acid | 2.5 |
3.1 |
1.00 | 1.23 | 0.181 | 0.322 | 0.144 | 0.020 | 0.97 |
| 29 | Fumaric acid | 8.8 |
7.9 |
1.00 | 0.90 | 0.345 | 0.460 | –0.033 | 0.019 | 0.76 |
| 30 | Oxaloacetic acid | 31.7 |
25.5 |
1.00 | 0.81 | 0.414 | 0.529 | –0.082 | –0.138 | 0.42 |
| 31 | Malic acid | 69.9 |
74.6 |
1.00 | 1.07 | 0.345 | 0.460 | 0.042 | –0.318 | 0.27 |
| Fatty acid | ||||||||||
| 35 | Palmitic acid | 21.4 |
9.7 |
1.00 | 0.46 | 0.228 | 0.366 | –0.123 | –0.130 | 0.44 |
NOTE: * Values normalized to the corresponding mean value of each metabolite in the young group; PCA, Principal component analysis; OPLS-DA, Orthogonal partial least square discriminant analysis.
In the cerebellum, the levels of 43 metabolites were measured in the young (n =
8) and old (n = 7) groups. In the young group, docosatetraenoic acid was the most
abundant, followed by aspartic acid and acetoacetic acid, whereas in the old
group, docosatetraenoic acid was the most abundant, followed by acetoacetic acid
and aspartic acid (Table 5). Especially, 11 AAs (alanine, glycine, valine,
leucine, isoleucine, threonine, serine, proline, methionine, phenylalanine, and
cysteine) and 3-hydroxypropionic acid were increased, whereas two FAs
(eicosadienoic acid and erucic acid) were decreased (p-value
| No. | Metabolite | Concentration (ng/mg, Mean |
Normalized Value* | Wilcoxon rank-sum test | PCA Loading score | OPLS-DA | ||||
| Young | Old | Young | Old | p-value | Q-value (FDR) | PC1 | PC2 | (VIP score) | ||
| Amino acid | ||||||||||
| 1 | Alanine | 315.4 |
429.9 |
1.00 | 1.36 | 0.002 | 0.040 | –0.238 | 0.117 | 1.58 |
| 2 | Glycine | 438.8 |
553.1 |
1.00 | 1.26 | 0.009 | 0.055 | –0.242 | 0.006 | 1.28 |
| 3 | 10.0 |
11.4 |
1.00 | 1.14 | 0.094 | 0.252 | –0.189 | 0.136 | 0.92 | |
| 4 | Valine | 84.3 |
105.0 |
1.00 | 1.25 | 0.014 | 0.055 | –0.174 | 0.013 | 1.14 |
| 5 | Leucine | 242.5 |
320.9 |
1.00 | 1.32 | 0.009 | 0.055 | –0.253 | 0.060 | 1.49 |
| 6 | Isoleucine | 217.4 |
296.8 |
1.00 | 1.36 | 0.006 | 0.051 | –0.252 | 0.060 | 1.46 |
| 7 | Proline | 189.2 |
253.9 |
1.00 | 1.34 | 0.040 | 0.123 | –0.241 | 0.088 | 1.26 |
| 8 | 828.1 |
945.0 |
1.00 | 1.14 | 0.189 | 0.313 | –0.171 | 0.194 | 1.00 | |
| 9 | Pyroglutamic acid | 176.5 |
246.7 |
1.00 | 1.40 | 0.072 | 0.207 | –0.169 | 0.207 | 1.10 |
| 10 | Methionine | 61.4 |
110.6 |
1.00 | 1.80 | 0.021 | 0.074 | –0.174 | –0.007 | 1.18 |
| 11 | Serine | 1164.0 |
1609.5 |
1.00 | 1.38 | 0.014 | 0.055 | –0.231 | 0.128 | 1.36 |
| 12 | Threonine | 438.2 |
590.3 |
1.00 | 1.35 | 0.014 | 0.055 | –0.183 | 0.147 | 1.15 |
| 13 | Phenylalanine | 220.0 |
286.8 |
1.00 | 1.30 | 0.004 | 0.040 | –0.253 | –0.015 | 1.44 |
| 14 | Cysteine | 32.5 |
37.8 |
1.00 | 1.17 | 0.014 | 0.055 | –0.177 | 0.031 | 1.40 |
| 15 | Aspartic acid | 1611.3 |
1779.9 |
1.00 | 1.10 | 0.281 | 0.403 | –0.189 | 0.063 | 0.74 |
| 16 | Glutamic acid | 993.0 |
1122.6 |
1.00 | 1.13 | 0.281 | 0.403 | –0.100 | –0.033 | 0.68 |
| 17 | Asparagine | 79.4 |
90.5 |
1.00 | 1.14 | 0.232 | 0.356 | –0.169 | –0.011 | 0.60 |
| 18 | Ornithine | 45.7 |
53.1 |
1.00 | 1.16 | 0.867 | 0.932 | –0.102 | 0.013 | 0.18 |
| 19 | Glutamine | 528.7 |
465.5 |
1.00 | 0.88 | 0.189 | 0.313 | 0.124 | –0.072 | 0.78 |
| 20 | Lysine | 385.3 |
392.4 |
1.00 | 1.02 | 0.955 | 0.955 | –0.066 | –0.058 | 0.01 |
| 21 | Tyrosine | 180.5 |
180.6 |
1.00 | 1.00 | 0.955 | 0.955 | –0.005 | –0.145 | 0.05 |
| Organic acid | ||||||||||
| 23 | Pyruvic acid | 13.2 |
14.7 |
1.00 | 1.11 | 0.536 | 0.640 | –0.060 | 0.113 | 0.53 |
| 24 | Acetoacetic acid | 1455.3 |
2052.7 |
1.00 | 1.41 | 0.232 | 0.356 | –0.066 | 0.089 | 0.86 |
| 25 | Lactic acid | 1412.3 |
1416.6 |
1.00 | 1.00 | 0.955 | 0.955 | –0.036 | 0.125 | 0.32 |
| 26 | Glycolic acid | 69.0 |
77.0 |
1.00 | 1.12 | 0.336 | 0.466 | –0.105 | –0.177 | 0.60 |
| 27 | 3-Hydroxypropionic acid | 10.6 |
13.0 |
1.00 | 1.23 | 0.002 | 0.040 | –0.185 | –0.121 | 1.45 |
| 28 | Succinic acid | 5.8 |
6.0 |
1.00 | 1.04 | 0.536 | 0.640 | 0.047 | 0.020 | 0.47 |
| 29 | Fumaric acid | 39.4 |
41.7 |
1.00 | 1.06 | 0.536 | 0.640 | –0.102 | 0.195 | 0.68 |
| 30 | Oxaloacetic acid | 64.4 |
56.8 |
1.00 | 0.88 | 0.463 | 0.623 | 0.055 | –0.096 | 0.58 |
| 31 | Malic acid | 108.7 |
114.0 |
1.00 | 1.05 | 0.613 | 0.712 | –0.054 | 0.119 | 0.40 |
| 32 | Citric acid | 37.2 |
49.0 |
1.00 | 1.31 | 0.121 | 0.259 | –0.100 | 0.091 | 1.08 |
| Fatty acid | ||||||||||
| 34 | Palmitoleic acid | 14.2 |
13.4 |
1.00 | 0.94 | 0.536 | 0.640 | 0.066 | 0.282 | 0.56 |
| 35 | Palmitic acid | 877.0 |
714.0 |
1.00 | 0.81 | 0.152 | 0.297 | 0.144 | 0.266 | 0.99 |
| 36 | Linolenic acid | 54.0 |
62.3 |
1.00 | 1.15 | 0.694 | 0.766 | –0.021 | 0.269 | 0.20 |
| 37 | Oleic acid | 1256.3 |
1040.8 |
1.00 | 0.83 | 0.121 | 0.259 | 0.104 | 0.269 | 1.05 |
| 38 | Stearic acid | 748.8 |
621.9 |
1.00 | 0.83 | 0.121 | 0.259 | 0.137 | 0.272 | 1.01 |
| 39 | Arachidonic acid | 1052.5 |
841.6 |
1.00 | 0.80 | 0.152 | 0.297 | 0.140 | 0.260 | 1.15 |
| 40 | Eicosadienoic acid | 23.5 |
15.5 |
1.00 | 0.66 | 0.004 | 0.040 | 0.197 | 0.153 | 1.54 |
| 41 | Gondoic acid | 105.2 |
94.2 |
1.00 | 0.90 | 0.189 | 0.313 | 0.038 | 0.202 | 0.87 |
| 42 | Docosahexaenoic acid | 651.1 |
516.8 |
1.00 | 0.79 | 0.189 | 0.313 | 0.130 | 0.269 | 1.00 |
| 43 | Docosatetraenoic acid | 2732.3 |
2102.0 |
1.00 | 0.77 | 0.121 | 0.259 | 0.130 | 0.259 | 1.26 |
| 44 | Erucic acid | 25.3 |
21.8 |
1.00 | 0.86 | 0.040 | 0.123 | 0.155 | 0.037 | 1.22 |
| 45 | Nervonic acid | 9.8 |
10.2 |
1.00 | 1.05 | 0.694 | 0.766 | –0.046 | 0.064 | 0.05 |
NOTE: * Values normalized to the corresponding mean value of each metabolite in the young group; PCA, Principal component analysis; OPLS-DA, Orthogonal partial least square discriminant analysis.
In the hypothalamus, the levels of 45 metabolites were measured in the young (n
= 8) and old (n = 7) groups. In the young group, docosatetraenoic acid was the
most abundant, followed by aspartic acid and acetoacetic acid. In the old group,
docosatetraenoic acid was the most abundant, followed by aspartic acid and
glutamic acid (Table 6). Specifically, seven AAs (glycine,
| No. | Metabolite | Concentration (ng/mg, Mean |
Normalized Value* | Wilcoxon rank-sum test | PCA Loading score | OPLS-DA | ||||
| Young | Old | Young | Old | p-value | Q-value (FDR) | PC1 | PC2 | (VIP score) | ||
| Amino acid | ||||||||||
| 1 | Alanine | 435.7 |
408.3 |
1.00 | 0.94 | 0.281 | 0.702 | –0.037 | –0.290 | 1.39 |
| 2 | Glycine | 606.7 |
512.6 |
1.00 | 0.84 | 0.021 | 0.217 | –0.051 | –0.257 | 2.20 |
| 3 | 19.7 |
14.6 |
1.00 | 0.74 | 0.006 | 0.089 | 0.039 | –0.226 | 2.12 | |
| 4 | Valine | 79.1 |
85.9 |
1.00 | 1.09 | 0.029 | 0.217 | –0.113 | –0.070 | 1.39 |
| 5 | Leucine | 326.3 |
322.8 |
1.00 | 0.99 | 0.955 | 1.000 | –0.160 | –0.243 | 0.40 |
| 6 | Isoleucine | 295.0 |
295.5 |
1.00 | 1.00 | 1.000 | 1.000 | –0.172 | –0.238 | 0.20 |
| 7 | Proline | 276.1 |
246.1 |
1.00 | 0.89 | 0.040 | 0.258 | –0.085 | –0.238 | 1.63 |
| 8 | 1711.6 |
1420.3 |
1.00 | 0.83 | 0.002 | 0.089 | 0.005 | –0.279 | 2.41 | |
| 9 | Pyroglutamic acid | 591.5 |
422.2 |
1.00 | 0.71 | 0.336 | 0.755 | –0.062 | 0.020 | 1.37 |
| 10 | Methionine | 56.6 |
50.8 |
1.00 | 0.90 | 0.779 | 1.000 | 0.119 | 0.069 | 0.30 |
| 11 | Serine | 1780.1 |
1787.9 |
1.00 | 1.00 | 0.867 | 1.000 | –0.071 | –0.193 | 0.11 |
| 12 | Threonine | 659.1 |
772.0 |
1.00 | 1.17 | 0.281 | 0.702 | 0.001 | –0.037 | 0.88 |
| 13 | Phenylalanine | 258.7 |
262.3 |
1.00 | 1.01 | 0.694 | 1.000 | –0.130 | –0.245 | 0.09 |
| 14 | Cysteine | 47.9 |
40.6 |
1.00 | 0.85 | 0.029 | 0.217 | 0.047 | –0.134 | 1.67 |
| 15 | Aspartic acid | 2672.3 |
2231.8 |
1.00 | 0.84 | 0.006 | 0.089 | –0.022 | –0.230 | 2.42 |
| 16 | Glutamic acid | 1864.5 |
1832.1 |
1.00 | 0.98 | 1.000 | 1.000 | –0.086 | 0.13 | |
| 17 | Asparagine | 88.9 |
82.0 |
1.00 | 0.92 | 0.955 | 1.000 | –0.058 | –0.081 | 0.62 |
| 18 | Ornithine | 80.8 |
77.0 |
1.00 | 0.95 | 0.779 | 1.000 | 0.051 | –0.260 | 0.32 |
| 19 | Glutamine | 691.4 |
691.1 |
1.00 | 1.00 | 0.955 | 1.000 | 0.090 | –0.125 | 0.25 |
| 20 | Lysine | 396.4 |
421.3 |
1.00 | 1.06 | 1.000 | 1.000 | 0.078 | –0.164 | 0.54 |
| 21 | Tyrosine | 189.0 |
194.8 |
1.00 | 1.03 | 0.613 | 1.000 | 0.130 | –0.076 | 0.59 |
| 22 | Tryptophan | 27.7 |
27.6 |
1.00 | 1.00 | 0.779 | 1.000 | 0.110 | –0.182 | 0.16 |
| Organic acid | ||||||||||
| 23 | Pyruvic acid | 19.8 |
20.7 |
1.00 | 1.04 | 0.955 | 1.000 | –0.094 | –0.039 | 0.25 |
| 24 | Acetoacetic acid | 2320.4 |
1413.7 |
1.00 | 0.61 | 0.152 | 0.570 | –0.161 | 0.009 | 0.69 |
| 25 | Lactic acid | 1190.5 |
1278.8 |
1.00 | 1.07 | 0.336 | 0.755 | 0.033 | 0.235 | 0.82 |
| 26 | Glycolic acid | 125.0 |
117.9 |
1.00 | 0.94 | 0.397 | 0.850 | –0.050 | 0.121 | 0.77 |
| 27 | 3-Hydroxypropionic acid | 20.0 |
21.9 |
1.00 | 1.10 | 0.867 | 1.000 | –0.162 | 0.092 | 0.15 |
| 28 | Succinic acid | 5.5 |
5.5 |
1.00 | 1.00 | 0.955 | 1.000 | –0.023 | 0.002 | 0.04 |
| 29 | Fumaric acid | 34.2 |
34.7 |
1.00 | 1.02 | 0.613 | 1.000 | –0.137 | 0.007 | 0.19 |
| 30 | Oxaloacetic acid | 68.7 |
65.8 |
1.00 | 0.96 | 0.613 | 1.000 | –0.001 | 0.168 | 0.10 |
| 31 | Malic acid | 111.6 |
113.4 |
1.00 | 1.02 | 0.779 | 1.000 | –0.144 | –0.097 | 0.28 |
| 32 | Citric acid | 43.0 |
42.5 |
1.00 | 0.99 | 1.000 | 1.000 | 0.017 | –0.193 | 0.08 |
| Fatty acid | ||||||||||
| 33 | Myristic acid | 4.7 |
4.1 |
1.00 | 0.88 | 0.281 | 0.702 | 0.077 | –0.156 | 1.06 |
| 34 | Palmitoleic acid | 20.4 |
17.9 |
1.00 | 0.88 | 0.152 | 0.570 | 0.261 | –0.074 | 0.94 |
| 35 | Palmitic acid | 1347.2 |
1294.1 |
1.00 | 0.96 | 0.463 | 0.948 | 0.266 | –0.002 | 0.37 |
| 36 | Linolenic acid | 55.2 |
65.4 |
1.00 | 1.18 | 0.189 | 0.655 | 0.150 | 0.047 | 1.32 |
| 37 | Oleic acid | 1518.1 |
1449.8 |
1.00 | 0.95 | 0.232 | 0.702 | 0.261 | –0.014 | 0.69 |
| 38 | Stearic acid | 1240.4 |
1180.0 |
1.00 | 0.95 | 0.281 | 0.702 | 0.260 | –0.022 | 0.49 |
| 39 | Arachidonic acid | 1981.2 |
1683.0 |
1.00 | 0.85 | 0.121 | 0.543 | 0.292 | –0.042 | 1.16 |
| 40 | Eicosadienoic acid | 14.1 |
13.6 |
1.00 | 0.96 | 0.955 | 1.000 | 0.229 | –0.072 | 0.14 |
| 41 | Gondoic acid | 62.3 |
62.6 |
1.00 | 1.00 | 0.779 | 1.000 | 0.261 | –0.068 | 0.24 |
| 42 | Docosahexaenoic acid | 889.2 |
742.6 |
1.00 | 0.84 | 0.121 | 0.543 | 0.260 | –0.051 | 1.11 |
| 43 | Docosatetraenoic acid | 5748.1 |
4925.0 |
1.00 | 0.86 | 0.072 | 0.406 | 0.302 | –0.061 | 0.92 |
| 44 | Erucic acid | 8.4 |
7.9 |
1.00 | 0.93 | 0.536 | 1.000 | 0.192 | 0.002 | 0.70 |
| 45 | Nervonic acid | 7.4 |
7.7 |
1.00 | 1.04 | 0.613 | 1.000 | 0.135 | 0.020 | 0.17 |
NOTE: * Values normalized to the corresponding mean value of each metabolite in the young group; PCA, Principal component analysis; OPLS-DA, Orthogonal partial least square discriminant analysis.
In the hippocampus, the levels of 30 metabolites were measured in the young (n =
4) and old (n = 6) groups. In all groups, acetoacetic acid was the most abundant,
followed by lactic acid and glutamic acid (Table 7). Acetoacetic acid was higher
in the old group than that of the young group (p-value
| No. | Metabolite | Concentration (ng/mg, Mean |
Normalized Value* | Wilcoxon rank-sum test | PCA Loading score | OPLS-DA | ||||
| Young | Old | Young | Old | p-value | Q-value (FDR) | PC1 | PC2 | (VIP score) | ||
| Amino acid | ||||||||||
| 1 | Alanine | 265.3 |
307.6 |
1.00 | 1.16 | 0.352 | 0.813 | –0.184 | 0.264 | 1.32 |
| 2 | Glycine | 221.5 |
224.2 |
1.01 | 1.01 | 0.762 | 0.994 | –0.130 | 0.227 | 0.26 |
| 4 | Valine | 141.1 |
162.8 |
1.15 | 1.15 | 0.352 | 0.813 | –0.224 | 0.172 | 0.96 |
| 5 | Leucine | 458.4 |
516.6 |
1.00 | 1.13 | 0.352 | 0.813 | –0.233 | 0.138 | 0.74 |
| 6 | Isoleucine | 192.3 |
209.7 |
1.00 | 1.09 | 0.352 | 0.813 | –0.229 | 0.168 | 0.74 |
| 7 | Proline | 134.7 |
142.2 |
1.00 | 1.06 | 0.352 | 0.813 | –0.230 | 0.155 | 0.52 |
| 8 | 494.5 |
496.2 |
1.00 | 1.00 | 0.476 | 0.893 | –0.200 | 0.134 | 0.10 | |
| 9 | Pyroglutamic acid | 245.3 |
293.8 |
1.00 | 1.20 | 0.114 | 0.813 | –0.115 | 0.201 | 1.57 |
| 11 | Serine | 436.3 |
444.3 |
1.00 | 1.02 | 1.000 | 1.000 | –0.206 | 0.097 | 0.23 |
| 12 | Threonine | 243.7 |
270.9 |
1.00 | 1.11 | 0.610 | 0.962 | –0.159 | 0.153 | 0.28 |
| 13 | Phenylalanine | 385.4 |
406.8 |
1.00 | 1.06 | 0.476 | 0.893 | –0.252 | 0.082 | 0.29 |
| 14 | Cysteine | 34.5 |
35.5 |
1.00 | 1.03 | 0.257 | 0.813 | –0.185 | 0.119 | 0.63 |
| 15 | Aspartic acid | 978.9 |
888.1 |
1.00 | 0.91 | 0.476 | 0.893 | –0.204 | –0.136 | 1.56 |
| 16 | Glutamic acid | 1210.4 |
1092.6 |
1.00 | 0.90 | 0.610 | 0.962 | –0.223 | –0.132 | 1.27 |
| 17 | Asparagine | 111.4 |
109.4 |
1.00 | 0.98 | 0.762 | 0.994 | –0.209 | 0.025 | 0.44 |
| 19 | Glutamine | 430.7 |
407.0 |
1.00 | 0.94 | 0.914 | 1.000 | –0.216 | 0.047 | 0.80 |
| 20 | Lysine | 186.4 |
177.3 |
1.00 | 0.95 | 0.762 | 0.994 | –0.191 | 0.015 | 0.90 |
| 21 | Tyrosine | 506.8 |
540.2 |
1.00 | 1.07 | 0.914 | 1.000 | –0.179 | 0.023 | 0.16 |
| Organic acid | ||||||||||
| 23 | Pyruvic acid | 21.5 |
26.5 |
1.00 | 1.24 | 0.257 | 0.813 | 0.181 | 0.237 | 1.51 |
| 24 | Acetoacetic acid | 5451.6 |
11111.7 |
1.00 | 2.04 | 0.038 | 0.813 | 0.060 | 0.306 | 2.31 |
| 25 | Lactic acid | 2585.4 |
2419.5 |
1.00 | 0.94 | 1.000 | 1.000 | 0.209 | 0.161 | 0.31 |
| 26 | Glycolic acid | 169.7 |
214.1 |
1.00 | 1.26 | 0.257 | 0.813 | 0.152 | 0.250 | 1.13 |
| 27 | 3-Hydroxypropionic acid | 22.8 |
25.4 |
1.00 | 1.12 | 0.762 | 0.994 | 0.136 | 0.300 | 0.85 |
| 28 | Succinic acid | 12.7 |
13.2 |
1.00 | 1.04 | 0.257 | 0.813 | 0.178 | 0.205 | 0.66 |
| 29 | Fumaric acid | 10.9 |
10.9 |
1.00 | 1.00 | 1.000 | 1.000 | 0.182 | 0.191 | 0.39 |
| 30 | Oxaloacetic acid | 136.8 |
101.5 |
1.00 | 0.74 | 0.914 | 1.000 | 0.151 | –0.168 | 0.42 |
| 31 | Malic acid | 124.0 |
176.4 |
1.00 | 1.42 | 0.067 | 0.813 | 0.139 | 0.172 | 2.04 |
| Fatty acid | ||||||||||
| 35 | Palmitic acid | 652.6 |
652.9 |
1.00 | 1.00 | 0.914 | 1.000 | 0.139 | 0.232 | 0.41 |
| 37 | Oleic acid | 229.2 |
313.9 |
1.00 | 1.37 | 0.257 | 0.813 | 0.089 | 0.222 | 1.37 |
| 38 | Stearic acid | 348.3 |
390.7 |
1.00 | 1.12 | 0.610 | 0.962 | 0.121 | 0.242 | 0.65 |
NOTE: * Values normalized to the corresponding mean value of each metabolite in the young group; PCA, Principal component analysis; OPLS-DA, Orthogonal partial least square discriminant analysis.
The AA levels in the old group were normalized to the corresponding mean levels
of the young group. A star plots of the normalized AAs in each brain tissue were
shown in Fig. 2. In the cortex, the normalized values of the 22 AAs ranged from
0.92 to 1.58 in the old group (Table 4). In particular, 13 AAs (alanine, valine,
leucine, isoleucine, threonine, serine, proline, methionine, phenylalanine,
cysteine, lysine, tyrosine, and tryptophan) were increased by 14–58% in the old
group (Fig. 2a). In the cerebellum, normalized values of 21 AAs ranged from 0.88
to 1.80 in the old group (Table 5). Especially, 18 AAs (alanine, glycine,
 Fig. 2.
Star symbol plots of AAs in the (a) in cortex, (b) cerebellum,
(c) hypothalamus, and (d) hippocampus from young and old groups. Ray; 1 =
Alanine, 2 = Glycine, 3 =
The OA and FA levels in the old group were normalized to the corresponding mean levels of the young group. A star plots of the normalized OAs and FAs of each brain tissue were shown in Fig. 3. In the cortex, the normalized values of nine OAs and one FA ranged from 0.46 to 1.23 in the old group (Table 4). In particular, two metabolites (lactic acid and succinic acid) were increased by 12–23%, whereas five metabolites (acetoacetic acid, glycolic acid, fumaric acid, oxaloacetic acid, and palmitic acid) were decreased by 10–54% in the old group (Fig. 3a). In the cerebellum, the normalized values of 10 OAs and 12 FAs ranged from 0.66 to 1.41 in the old group (Table 5). Especially, six metabolites (pyruvic acid, acetoacetic acid, glycolic acid, 3-hydroxypropionic acid, citric acid, and linolenic acid) were increased by 11–41%, whereas 10 metabolites (oxaloacetic acid, palmitic acid, oleic acid, stearic acid, arachidonic acid, eicosadienoic acid, gondoic acid, docosahexaenoic acid, docosatetraenoic acid, and erucic acid) were decreased by 10–34% in the old group (Fig. 3b). In the hypothalamus, the normalized values of 10 OAs and 13 FAs ranged from 0.61 to 1.18 in the old group (Table 6). Specifically, two metabolites (3-hydroxypropionic acid and linolenic acid) were increased by 10–18%, whereas six metabolites (acetoacetic acid, myristic acid, palmitoleic acid, arachidonic acid, docosahexaenoic acid, and docosatetraenoic acid) were decreased by 12–39% in the old group (Fig. 3c). In the hippocampus, the normalized values of nine OAs and three FAs ranged from 0.74 to 2.04 in the old group (Table 7). Additionally, seven metabolites (pyruvic acid, acetoacetic acid, glycolic acid, 3-hydroxypopionic acid, malic acid, oleic acid, and stearic acid) were increased by 12–104%, whereas oxaloacetic acid was decreased by 26% in the old group (Fig. 3d).
 Fig. 3.
Star symbol plots of OAs and FAs in the (a) in cortex, (b) cerebellum, (c) hypothalamus, and (d) hippocampus from young and old groups. Ray; 23 = Pyruvic acid, 24 = Acetoacetic acid, 25 = Lactic acid, 26 = Glycolic acid, 27 = 3-Hydroxypropionic acid, 28 = Succinic acid, 29 = Fumaric acid, 30 = Oxaloacetic acid, 31 = Malic acid, 32 = Citric acid, 33 = Myristic acid, 34 = Palmitoleic acid, 35 = Palmitic acid, 36 = Linoleic acid, 37 = Oleic acid, 38 = Stearic acid, 39 = Arachidonic acid, 40 = Eicosadienoic acid, 41 = Gondoic acid, 42 = Docosahexaenoic acid, 43 = Docosatetraenoic acid, 44 = Erucic acid, 45 = Nervonic acid.
In the cortex, the PCA score plot explained 51.7% of total variance with PC1
and PC2 (Fig. 4a). To discriminate between the two groups, PCA loading scores
were evaluated using loading 1 and loading 2. The variable that had the greatest
influence on loading 1, the main component of PCA, was phenylalanine, and on
loading 2 was pyroglutamic acid (Table 4). Although the young and old groups were
not completely separated in the PCA score plots (Fig. 4a), they were clearly
separated in OPLS-DA (Fig. 4b). The OPLS-DA presents R2Y and Q2 values equal to
0.927 and 0.736, respectively with p-values from permutation test less than or
equal to 0.01. According to OPLS-DA analysis, 13 metabolites (leucine,
phenylalanine, proline, isoleucine, valine, threonine, serine, alanine, tyrosine,
aspartic acid, glycolic acid,
 Fig. 4.
PCA (a,c,e,g) and OPLS-DA (b,d,f,h) score plots in the cortex, cerebellum, hypothalamus, and hippocampus from young and old groups.
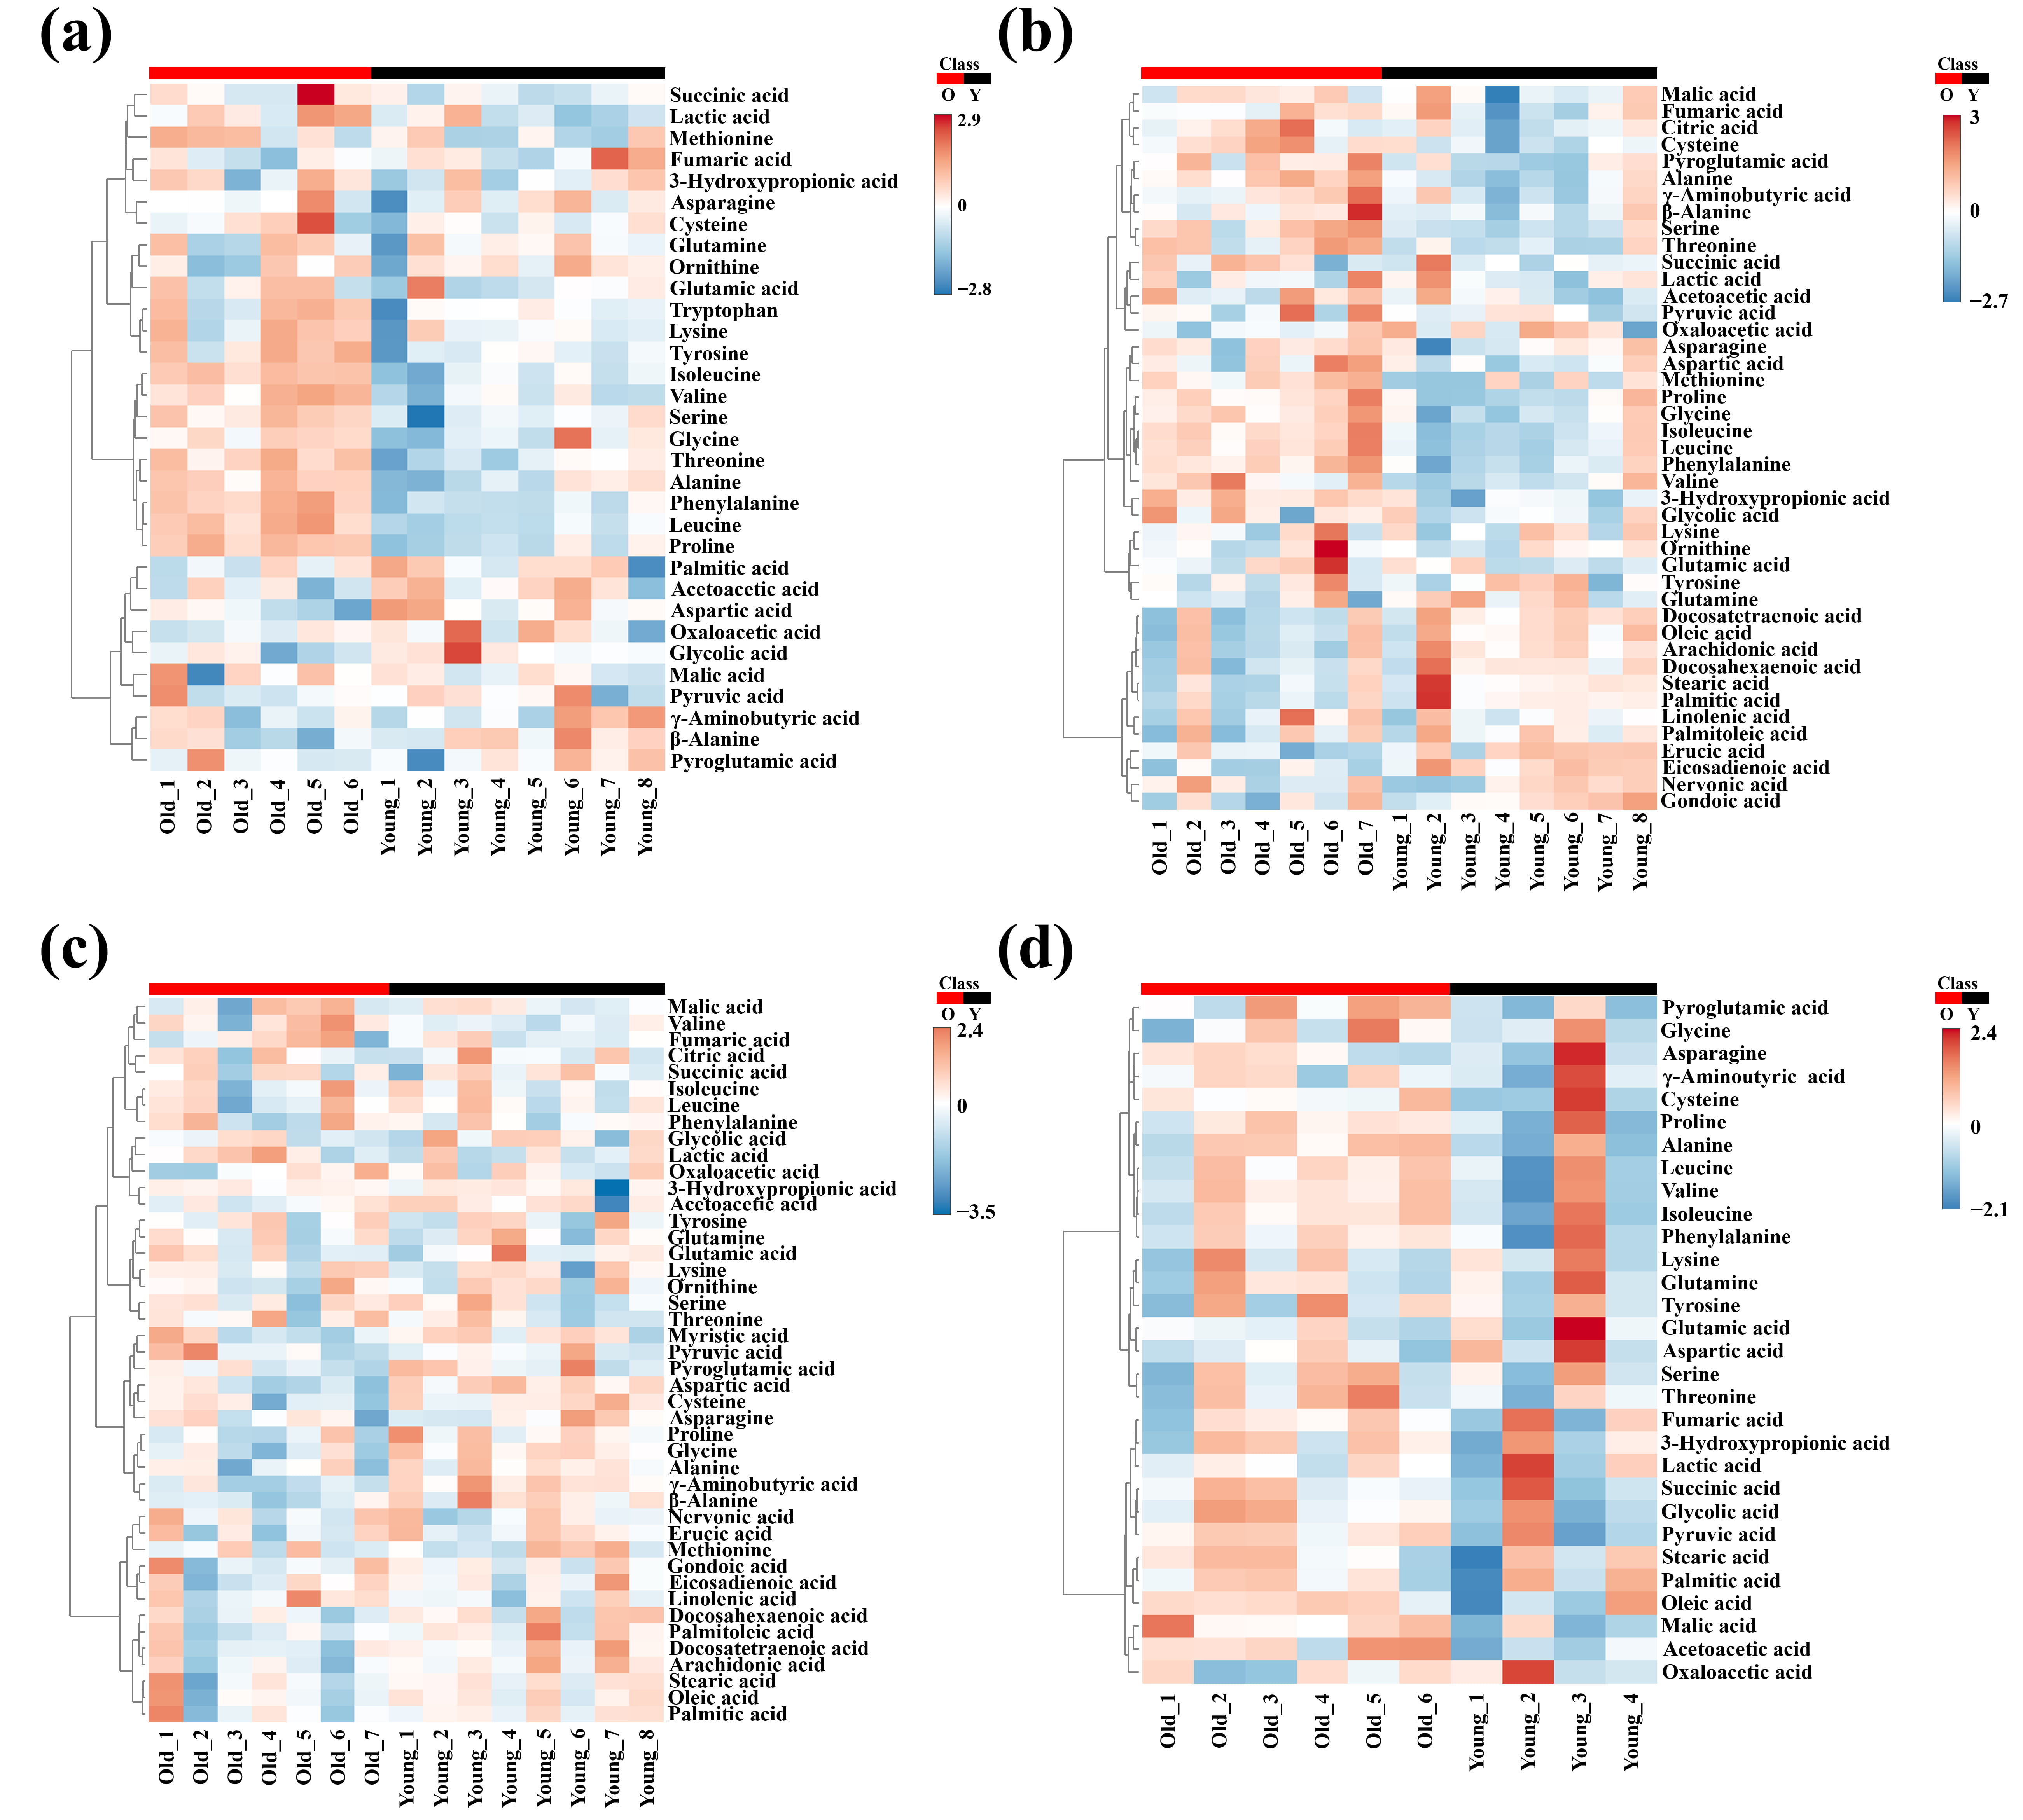 Fig. 5.
Heatmap analysis in the in (a) cortex, (b) cerebellum, (c) hypothalamus, and (d) hippocampus from young and old groups.
In the cerebellum, the PCA score plot explained 53.6% of total variance with
PC1 and PC2 (Fig. 4c). To discriminate between the two groups, PCA loading scores
were evaluated using loading 1 and loading 2. The variable that had the greatest
influence on loading 1 was eicosadienoic acid, and that of loading 2 was
palmitoleic acid (Table 5). Although the young and old groups were not completely
separated in the PCA score plots (Fig. 4c), they were clearly separated in
OPLS-DA (Fig. 4d). The OPLS-DA presents R2Y and Q2 values equal to 0.872 and
0.595, respectively with p-values from permutation test equal to 0.02. According
to OPLS-DA analysis, 20 metabolites (alanine, eicosadienoic acid, leucine,
isoleucine, 3-hydroxypropionic acid, phenylalanine, cysteine, serine, glycine,
docosatetraenoic acid, proline, erucic acid, methionine, arachidonic acid,
threonine, valine, pyroglutamic acid, citric acid, oleic acid, and stearic acid)
with a VIP score
In the hypothalamus, the PCA score plot explained 39.8% of total variance with
PC1 and PC2 (Fig. 4e). The variable that had the greatest influence on loading 1
was docosatetraenoic acid, and that of loading 2 was lactic acid (Table 6).
Although the young and old groups were not completely separated in the PCA score
plots (Fig. 4e), they were clearly separated in OPLS-DA (Fig. 4f). The OPLS-DA
presents R2Y and Q2 values equal to 0.905 and 0.315, respectively with
p-values from permutation test less than 0.03. According to OPLS-DA
analysis, 13 metabolites (aspartic acid,
In the hippocampus, the PCA score plot explained 68.8% of total variance with
PC1 and PC2 (Fig. 4g). The variable that had the greatest influence on loading 1
was lactic acid, and that of loading 2 was acetoacetic acid (Table 7). Although
the young and old groups were not completely separated in the PCA score plots
(Fig. 4g), they were clearly separated in OPLS-DA (Fig. 4h). However, the OPLS-DA
presents R2Y and Q2 values equal to 0.881 and 0.249, respectively with p-values
from permutation test less than 0.16. According to OPLS-DA analysis, nine
metabolites (acetoacetic acid, malic acid, pyroglutamic acid, aspartic acid,
pyruvic acid, oleic acid, alanine, glutamic acid, and glycolic acid) with a VIP
score
The developed AA, OA and FA metabolic profiling methods were suitable for quantification of these metabolites in the cortex, cerebellum, hypothalamus, and hippocampus. Also, we investigated metabolic changes in rat brain tissues to monitor altered metabolism related to aging.
In the AA profiles, branched-chain amino acids (BCAAs) levels were increased in
all brain tissues of the old group. Especially, BCAAs were significantly elevated
in the cortex and cerebellum. Additionally, increased leucine, isoleucine, and
valine were similar to previous results in mice and rat brains with aging [26].
BCAAs, including leucine and isoleucine, are metabolites related to the
mechanistic targets of rapamycin complex 1 (mTORC1)-mediated pro-oxidative and
pro-inflammatory activation. The mTOR pathway is involved in cell growth,
proliferation, survival, motility, autophagy, and protein synthesis, and with
aging, the activation of mTOR characterizes such as cellular senescence,
decreased autophagy, mitochondrial dysfunction, glucose metabolism disorders, and
increased inflammation [27]. In addition, the relationship among BCAAs,
inflammation, oxidative damage, and mitochondrial dysfunction through the
activation of the nuclear factor kappa-light-chain-enhancer of the activated B
cell signaling pathway and the inflammasome was suggested in the previous reports
[28, 29]. Thus, increased BCAAs in this study may be associated with mTOR
activation. And higher leucine levels in the cerebrospinal fluid (CSF) of elderly
individuals were reported to be associated with cognitive decline and synaptic
dysfunction [30]. In addition, aromatic AAs (phenylalanine), alanine, and proline
were significantly increased in both the cortex and cerebellum. Aromatic AAs
involved in dopamine synthesis are associated with inflammatory diseases [31] and
affect the central nervous system, closely related to memory and learning ability
[32]. Elevated alanine levels in the CSF are associated with low glucose
utilization in the brain [30], and proline induces oxidative stress and increases
lipid peroxidation in the cerebral cortex [33]. Thus, our findings suggest that
the increased levels of AAs, including BCAAs, aromatic AAs, alanine, and proline
may explain age-related inflammation, mitochondrial dysfunction-induced changes,
and altered energy metabolism in the cortex and cerebellum. Although
neurotransmitter AAs in the hypothalamus (glycine, proline,
In OA profiles, even if not significant statistical result, increased lactic acid in the cortex was similar to the result in a previous report on rats. Increased levels of lactic acid on rats with aging explain the increase in anaerobic glycolysis, in which the use of pyruvic acid in the tricarboxylic acid (TCA) cycle is reduced because of the increase in the concentration of lactic acid dehydrogenase caused by oxidative stress [38]. Also, High lactic level was reported as a symptomatic marker of the aging process [39], and in the CSF was found to be correlated with cognitive decline in patients with Alzheimer’s disease [30]. Although acetoacetic acid in the hippocampus were not significantly evaluated in the FDR correction, these were indicated high score in VIP scores. In a previous report, increased level of 3-hydroxybutyric acid in the aged hippocampus was explained as a ketone body supply of the brain’s energy demand due to the reduced efficiency of glycolysis and the TCA cycle [40]. Acetoacetic acid as another ketone body, reported as an activator of pro-inflammatory signaling, is associated with the induction of monocyte chemoattractant protein-1 expression, reactive oxygen species (ROS) accumulation, and reduced cyclic adenosine monophosphate levels [41]. Moreover, 3-hydroxypropionic acid, which is related to ROS, oxidative stress, and inflammation, was increased in all brain tissues of the old group compared with those of the young group, and it was significantly increased in the cerebellum. Thus, in this study, increased levels of lactic acid in the cortex, 3-hydroxypropionic acid in the cerebellum, and acetoacetic acid in the hippocampus may associate the altered energy metabolism, aging-related mitochondrial dysfunction, increased inflammation due to ROS accumulation and oxidative stress, and cognitive decline.
In the FA profiles, eicosadienoic acid as polyunsaturated FA was identified as significantly decreased metabolite in the cerebellum, which is associated with anti-inflammatory and antioxidative effects [42, 43]. Thus, reduced FA levels may explain the weakened protective effects of aging on the increased inflammatory response and ROS accumulation.
In this study, AA, OA and FA profiling methods were developed and validated.
Under optimal conditions, these showed good linearity (r
AA, Amino acid; OA, Organic acid; FA, Fatty acid; GC-MS/MS, Gas chromatography-tandem-mass spectrometry; PDA, Pentadecanoic acid; IS, Internal standard; DW, Distilled water; ACN, Acetonitrile; TEA, Triethylamine; DEE, Diethyl ether; EA, Ethylacetate; DCM, Dichlororomethane; NaOH, Sodium chloride; MTBSTFA, N-Methyl-N-(tert-butyldimethylsilyl) trifluoroacetamide; ECF, Ethylchloroformate; TBDMS, tert-butyldimethylsilylation; MO, Mehtoximation; SRM, Selective reaction monitoring; LOD, Limit of detection; LOQ, Limit of quantitation; RSD, relative standard deviation; RE, Relative error; FDR, False discovery rate; PCA, Principal component analysis; OPLS-DA, Orthogonal partial least square discriminant analysis; VIP, Variable importance for projection; CE, collision energy; BCAA, Branched chain-amino acid; mTOR, mechanistic target of rapamycin complex; CSF, Cerebrospinal fluid; TCA, Tricarboxylic acid; ROS, Reactive oxygen species.
The data presented in this study are contained within this article, or are available upon request to the corresponding author.
MJP and HYC designed the research study. BC and MJ performed metabolite profiling and statistical analyses. HWK contributed to sample handling and collection. SO, YK, and SC performed sample preparation for metabolites. BC and MJP wrote the manuscript. MJP and HYC performed data interpretation and revised the manuscript. All authors contributed to editorial changes in the manuscript. All authors read and approved the final manuscript. All authors have participated sufficiently in the work and agreed to be accountable for all aspects of the work.
All procedures performed in studies involving animals were in accordance with the ethical standards of the Pusan National University Institutional Animal Care and Use Committee (approval No. PNU-2014-0601).
We thank the Aging Tissue Bank for providing research materials for the study.
This study was supported by a National Research Foundation of Korea (NRF) grant funded by a grant from the Ministry of Education, Science, and Technology (2023R1A2C1003696).
The author Youngbae Kim is from the company (B&Tech Co.). All authors declare no conflict of interest.
References
Publisher’s Note: IMR Press stays neutral with regard to jurisdictional claims in published maps and institutional affiliations.