


 , Haichuan Liu 2,†, Mingzhu Zhang 1, Jianwei Wang 3, Qiling Peng 3,*
 , Ning Jiang 4,5,6,*, Yuxian Wei 1,*
1 Department of Breast and Thyroid Surgery, The First Affiliated Hospital of Chongqing Medical University, 400016 Chongqing, China
2 Department of Hepatobiliary surgery, The First Affiliated Hospital of Chongqing Medical University, 400016 Chongqing, China
3 School of Basic Medical Science, Chongqing Medical University, 400016 Chongqing, China
4 Department of Pathology, Chongqing Medical University, 400016 Chongqing, China
5 Molecular Medicine Diagnostic and Testing Center, Chongqing Medical University, 400016 Chongqing, China
6 Department of Pathology, The First Affiliated Hospital of Chongqing Medical University, 400016 Chongqing, China
†These authors contributed equally.
Abstract
Background: Breast cancer (BC) ranks as the most prevalent malignancy affecting women globally, with apoptosis playing a pivotal role in its pathological progression. Despite the crucial role of apoptosis in BC development, there is limited research exploring the relationship between BC prognosis and apoptosis-related genes (ARGs). Therefore, this study aimed to establish a BC-specific risk model centered on apoptosis-related factors, presenting a novel approach for predicting prognosis and immune responses in BC patients. Methods: Utilizing data from The Cancer Gene Atlas (TCGA), Cox regression analysis was employed to identify differentially prognostic ARGs and construct prognostic models. The accuracy and clinical relevance of the model, along with its efficacy in predicting immunotherapy outcomes, were evaluated using independent datasets, Receiver Operator Characteristic (ROC) curves, and nomogram. Additionally, Kyoto Encyclopedia of Genes and Genomes (KEGG) and Gene Ontology (GO) analyses were used to predict potential mechanical pathways. The CellMiner database is used to assess drug sensitivity of model genes. Results: A survival risk model comprising eight prognostically relevant apoptotic genes (PMAIP1, TP53AIP1, TUBA3D, TUBA1C, BCL2A1, EMP1, GSN, F2) was established based on BC patient samples from TCGA. Calibration curves validated the ROC curve and nomogram, demonstrating excellent accuracy and clinical utility. In samples from the Gene Expression Omnibus (GEO) datasets and immunotherapy groups, the low-risk group (LRG) demonstrated enhanced immune cell infiltration and improved immunotherapy responses. Model genes also displayed positive associations with sensitivity to multiple drugs, including vemurafenib, dabrafenib, PD-98059, and palbociclib. Conclusions: This study successfully developed and validated a prognostic model based on ARGs, offering new insights into prognosis and immune response prediction in BC patients. These findings hold promise as valuable references for future research endeavors in this field.
Keywords
- breast cancer
- prognostic risk model
- apoptosis-related genes
- immuno-infiltration analysis
- drug sensitivity analysis
Based on data from the American Cancer Society, in 2024, breast cancer (BC) will account for 32% of all new cancer cases in women and remain the leading cause of cancer-related deaths for women [1]. Conventional treatment options for BC include surgery, chemotherapy, radiation and personalized treatment regimens based on BC’s molecular classification. However, despite these treatment options, the mortality rate of patients with BC remains 40%–60% in some countries, indicating its poor prognosis [2]. Some reports predict that by 2040, there will be more than 3 million new diagnosed cases of BC and 1 million deaths from BC worldwide [3].
Apoptosis is a programmed cell suicide death and is usually involved in the processes of development and senescence. Apoptosis is genetically regulated and occurs through endogenous and exogenous pathways mediated by cysteine aspartate, which effectively maintains homeostasis in the organism [4]. The theory that apoptosis may act as a cancer barrier was first proposed in 1972 when Kerr et al. [5] identified hormone-dependent tumors after massive apoptosis of tumor cells following hormone withdrawal. Since then, promotion of cancer programmed cell death has been a goal of clinical cancer therapy. Most current anticancer drugs utilize the apoptotic pathway to trigger cancer cell death, but resistance can result from upregulation of anti-apoptotic genes or inactivation of oncogenes and defects in signaling pathways in cancer cells. That is why one of the tumor characteristics is evasion of apoptosis [6].
Normal breast tissue development relies on a delicate balance between cell apoptosis and proliferation, but apoptosis anomaly and cell hyperproliferation lead to carcinogenesis [7]. Chemotherapy, endocrine therapy, and radiotherapy are primary treatment modalities for BC, all capable of inducing apoptosis to eliminate cancer cells. Doxorubicin (Adriamycin®) is an antitumor agent widely used in chemotherapy for breast cancer. Doxorubicin can induce apoptosis and cell cycle arrest by inhibiting topoisomerase II mediated DNA damage [8]. The novel camptothecin derivative CPT211 activates the P53-mediated apoptotic pathway in MCF-7 cells, leading to apoptosis [9]. Nevertheless, in 2024, overcoming therapeutic resistance resulting from the evasion of apoptosis remains a formidable challenge in the treatment of BC [10, 11]. Moreover, there are few studies on the relationship between apoptosis-related genes (ARGs) and the breast.
Therefore, it is crucial to explore new prognostic markers for BC and to build an efficient prognostic model to determine patient survival and treatment response. In this study, we constructed a prognostic risk model based on ARGs, which was able to efficiently predict the prognosis and treatment response of BC patients. These results may become a valuable reference in the future.
The expressed gene RNA sequencing (RNA-seq) datasets and corresponding clinical data for BC were extracted from The Cancer Gene Atlas (TCGA) database (https://portal.gdc.cancer.gov/) for breast tumor and normal breast tissue samples. The models were validated by downloading GSE42568 and GSE88770 datasets from Gene Expression Omnibus (GEO) database (https://www.ncbi.nlm.nih.gov/gds/). 268 ARGs were obtained from Kyoto Encyclopedia of Genes and Genomes (KEGG) using the keyword Apoptosis-homo sapiens: hsa04210 pathway (https://www.kegg.jp/entry/hsa04210) and previous related literature [12, 13]. CellMiner was utilized to retrieve RNA-seq expression data and compound activity information for the developmental therapeutics program (DTP) NCI-60 dataset [14] (Fig. 1).
 Fig. 1.
Research process. GEO, gene expression omnibus.
ARGs differentially expressed in BC were identified using the “limma” package (version 3.14) in R software (version 4.1.1, R Foundation for Statistical Computing, Vienna, Austria). “clusterProfiler” in R Gene Ontology (GO) and KEGG pathway analyses were performed using [13, 15, 16, 17]. The heatmap, ggpubr, and ggplot packages were used to visualize the genes.
Using univariate and multivariate Cox regression, the model was constructed by
identifying apoptotic genes associated with BC prognosis. Eight apoptotic genes
that were significantly associated with prognosis were finally retained. Risk
scores for all patients were calculated as follows:
Based on the CIBERSORT algorithm, 22 immune cells were identified in each BC specimen and the sum of the composition of each immune cell was equal to 1 [18]. The levels of infiltration of different immune cells and multiple immune pathway scores were analyzed using single sample gene enrichment analysis (ssGSEA) in the “GSVA” R package (version 3.14) [19]. Subsequently, the immune pathways of the two groups were then examined.
Immunotherapy targets commonly used in clinical immunotherapy were used to assess the sensitivity of the HRG to immunotherapy. A cohort of advanced renal hyaline cell carcinoma immunotherapy treated with PD-1 blockade was included (https://www.ncbi.nlm.nih.gov/pmc/articles/PMC7499153/), excluding patients with incomplete responses; finally, 311 patients were included in the analysis.
Age, stage, tumor size (T), lymph node status (N), metastasis (M), and risk scores were evaluated in terms of their prognostic value through univariate and multivariate Cox regression analyses in the ‘survival’ R package. (https://cran.r-project.org/web/packages/survival). Based on Kaplan-Meier (K-M) analysis and log-rank test, overall survival (OS) was compared between the two groups. A time-dependent Receiver Operator Characteristic (ROC) curve analysis was performed using the “timeROC” package (https://cran.r-project.org/web/packages/timeROC).
A clinical nomogram was generated using the “rms” R package (https://cran.R-project.org/package=rms) to predict individual survival. In order to assess the agreement between actual and predicted survival, calibration curves were used. Using external GEO data, the predictive power of the risk model was validated.
Gene expression data and the Z-scores for drug sensitivity were downloaded from
Cell Miner (National Cancer Institute) for 60 different tumor cell lines and
included 23,808 gene expression profiles and 352 drugs approved by the FDA or in
clinical trials [14]. The relationship between the model genes and drug treatment
response was investigated. Pearson’s correlation coefficients between genes and
drugs were calculated and screened for statistical significance at p
Sections of BC tissue and adjacent tissue were embedded in paraffin and fixed in formalin. Sections were dewaxed after baking at 65 °C for 1 h, passed through a gradient alcohol series (Absolute ethanol, 90% ethanol, 80% ethanol, and 70% ethanol), rehydrated and washed. The paraffin-embedded sections were boiled in an antigen repair solution for 10 min for antigen repair at a temperature of 96–98 degrees and then incubated with the following primary antibodies TUBA1C (1:50; D123443; Sangon Biotech, Shanghai, China), BCL2A1 (1:50; D220158; Sangon Biotech), TUBA3D (1:100; D110022; Sangon Biotech), EMP1 (1:100; D162994; Sangon Biotech), F2 (1:100; A00044; Boster Bio, Pleasanton, CA, USA), GSN (1:50; D160423; Sangon Biotech), PMAIP1 (1:100; A9801; ABclonal, Woburn, MA, USA), TP53AIP1 (1:100; D262005; Sangon Biotech) overnight at 4 ℃. The secondary antibodies at 37 ℃ for 30 min. Furthermore, samples were back stained with hematoxylin, dehydrated with an ethanol-xylene series, and covered for 30 minutes with neutral balm (Biosharp; BL704A). Gene staining intensity was rated as follows: no staining (negative), 0; light yellow (weakly positive), 1; brownish-yellow (positive), 2; and tan brown (strongly negative), 3. The final score of each gene was determined by a qualified pathologist blinded to the study to determine its expression as low or high.
Our statistical analyses were performed using R software (version 4.1.1, R
Foundation for Statistical Computing, Vienna, Austria), the Perl language for
processing the data matrix, and GSEA4.1 for analyzing the KEGG enrichment pathway
in the two groups in GEO. p
The expression of 268 ARGs obtained from the KEGG pathway and previous
literature was in 1096 breast tumor samples and 112 non-tumor breast tissue
samples in TCGA, using the limma package. 74 differential ARGs were screened
based on false discovery rate
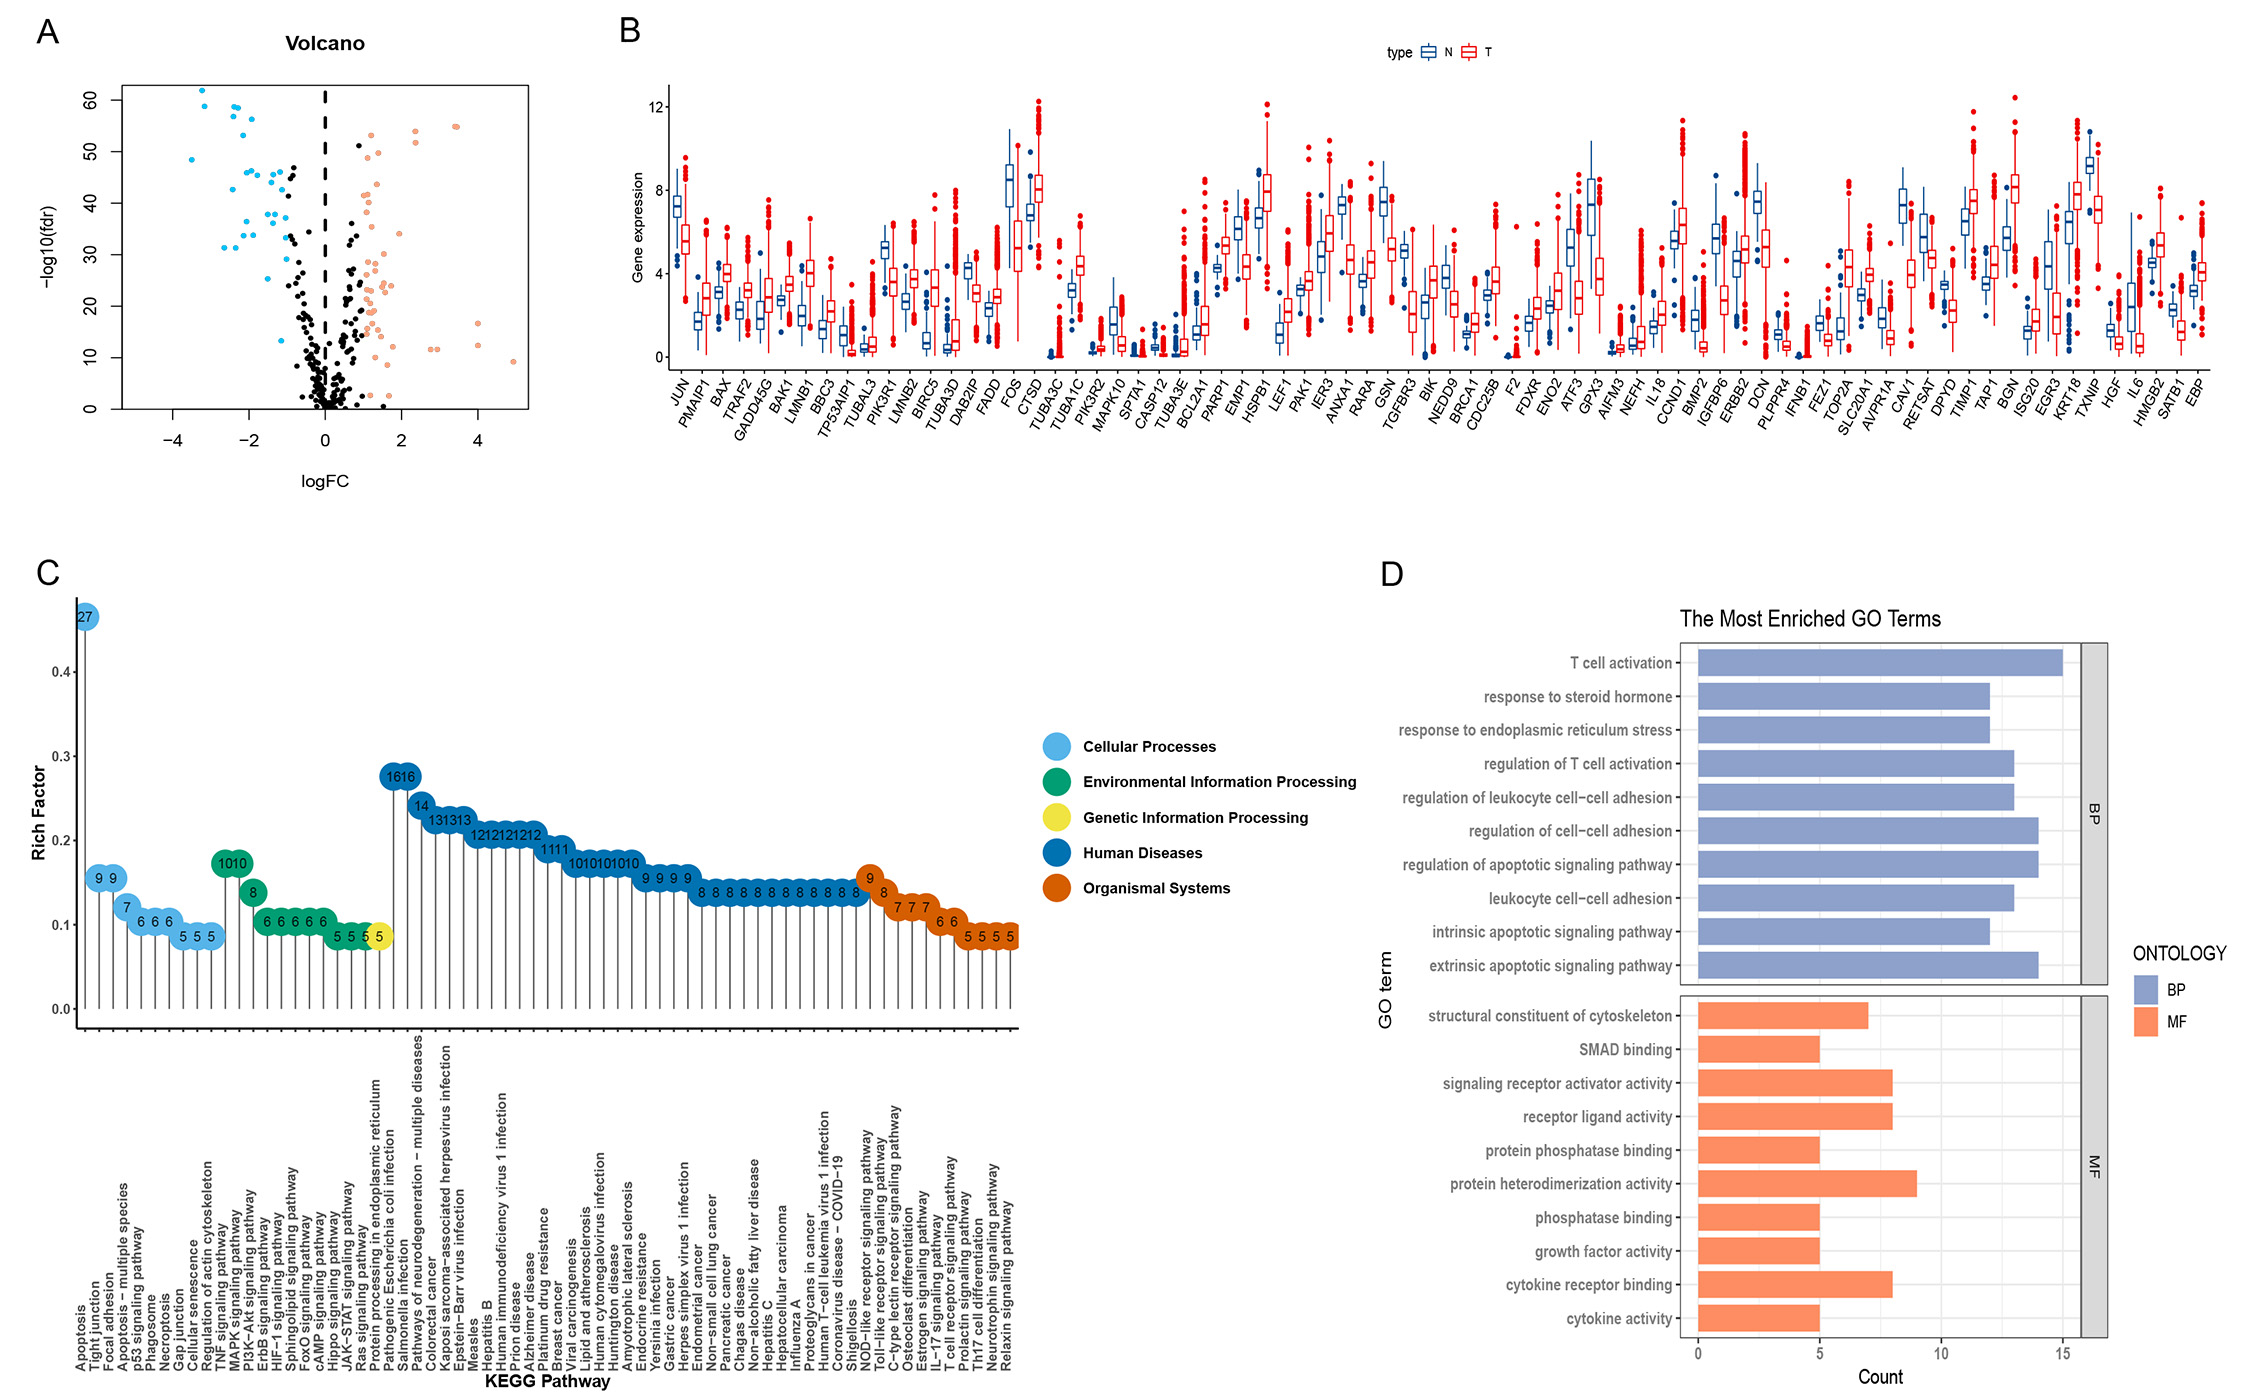 Fig. 2.
Analysis of apoptosis-related genes (ARGs) and functions
differentially expressed in breast cancer (BC) and normal tissues. (A,B) Volcano
and box line plots of differentially expressed apoptosis-associated genes
(p
In the KEGG pathway enrichment analysis of ARGs, five categories of related pathways were identified (Fig. 2C). Apoptosis pathways, TNF signaling pathways, mitogen-activated protein kinase (MAPK) signaling pathways, NOD-like receptor signaling pathways, and NOD-regulatory pathways were enriched. In addition, ARGs were enriched in breast cancer-related pathways. In the GO analysis (Fig. 2D), endogenous and exogenous apoptosis-related pathways and apoptosis regulatory processes were enriched in biological processes (BP), immune T cell activation and interleukocyte adhesion. Molecular functions (MF) were enriched for protein heterodimeric activity and cytokine receptor binding.
From the 74 different ARGs, 17 were identified as being related to prognosis through univariate Cox analysis. Furthermore, a multivariate analysis was performed to eight ARGs significantly associated with prognosis, and the expression coefficients of 8 independent risk genes were calculated using multivariate Cox regression ratios. The following formula was developed to calculate the prognosis of each patient with BC using the eight genes:
With the increasing number of fatalities, the risk score increased (Fig. 3D,E). K-M survival analysis found significant OS in the LRG compared to the HRG (Fig. 3B). For the area under the curve (AUC) at 3, 5, and 10 years, the survival time-dependent ROC curve predictive model showed excellent results with values of 0.73, 0.736, and 0.783 (Fig. 3A).
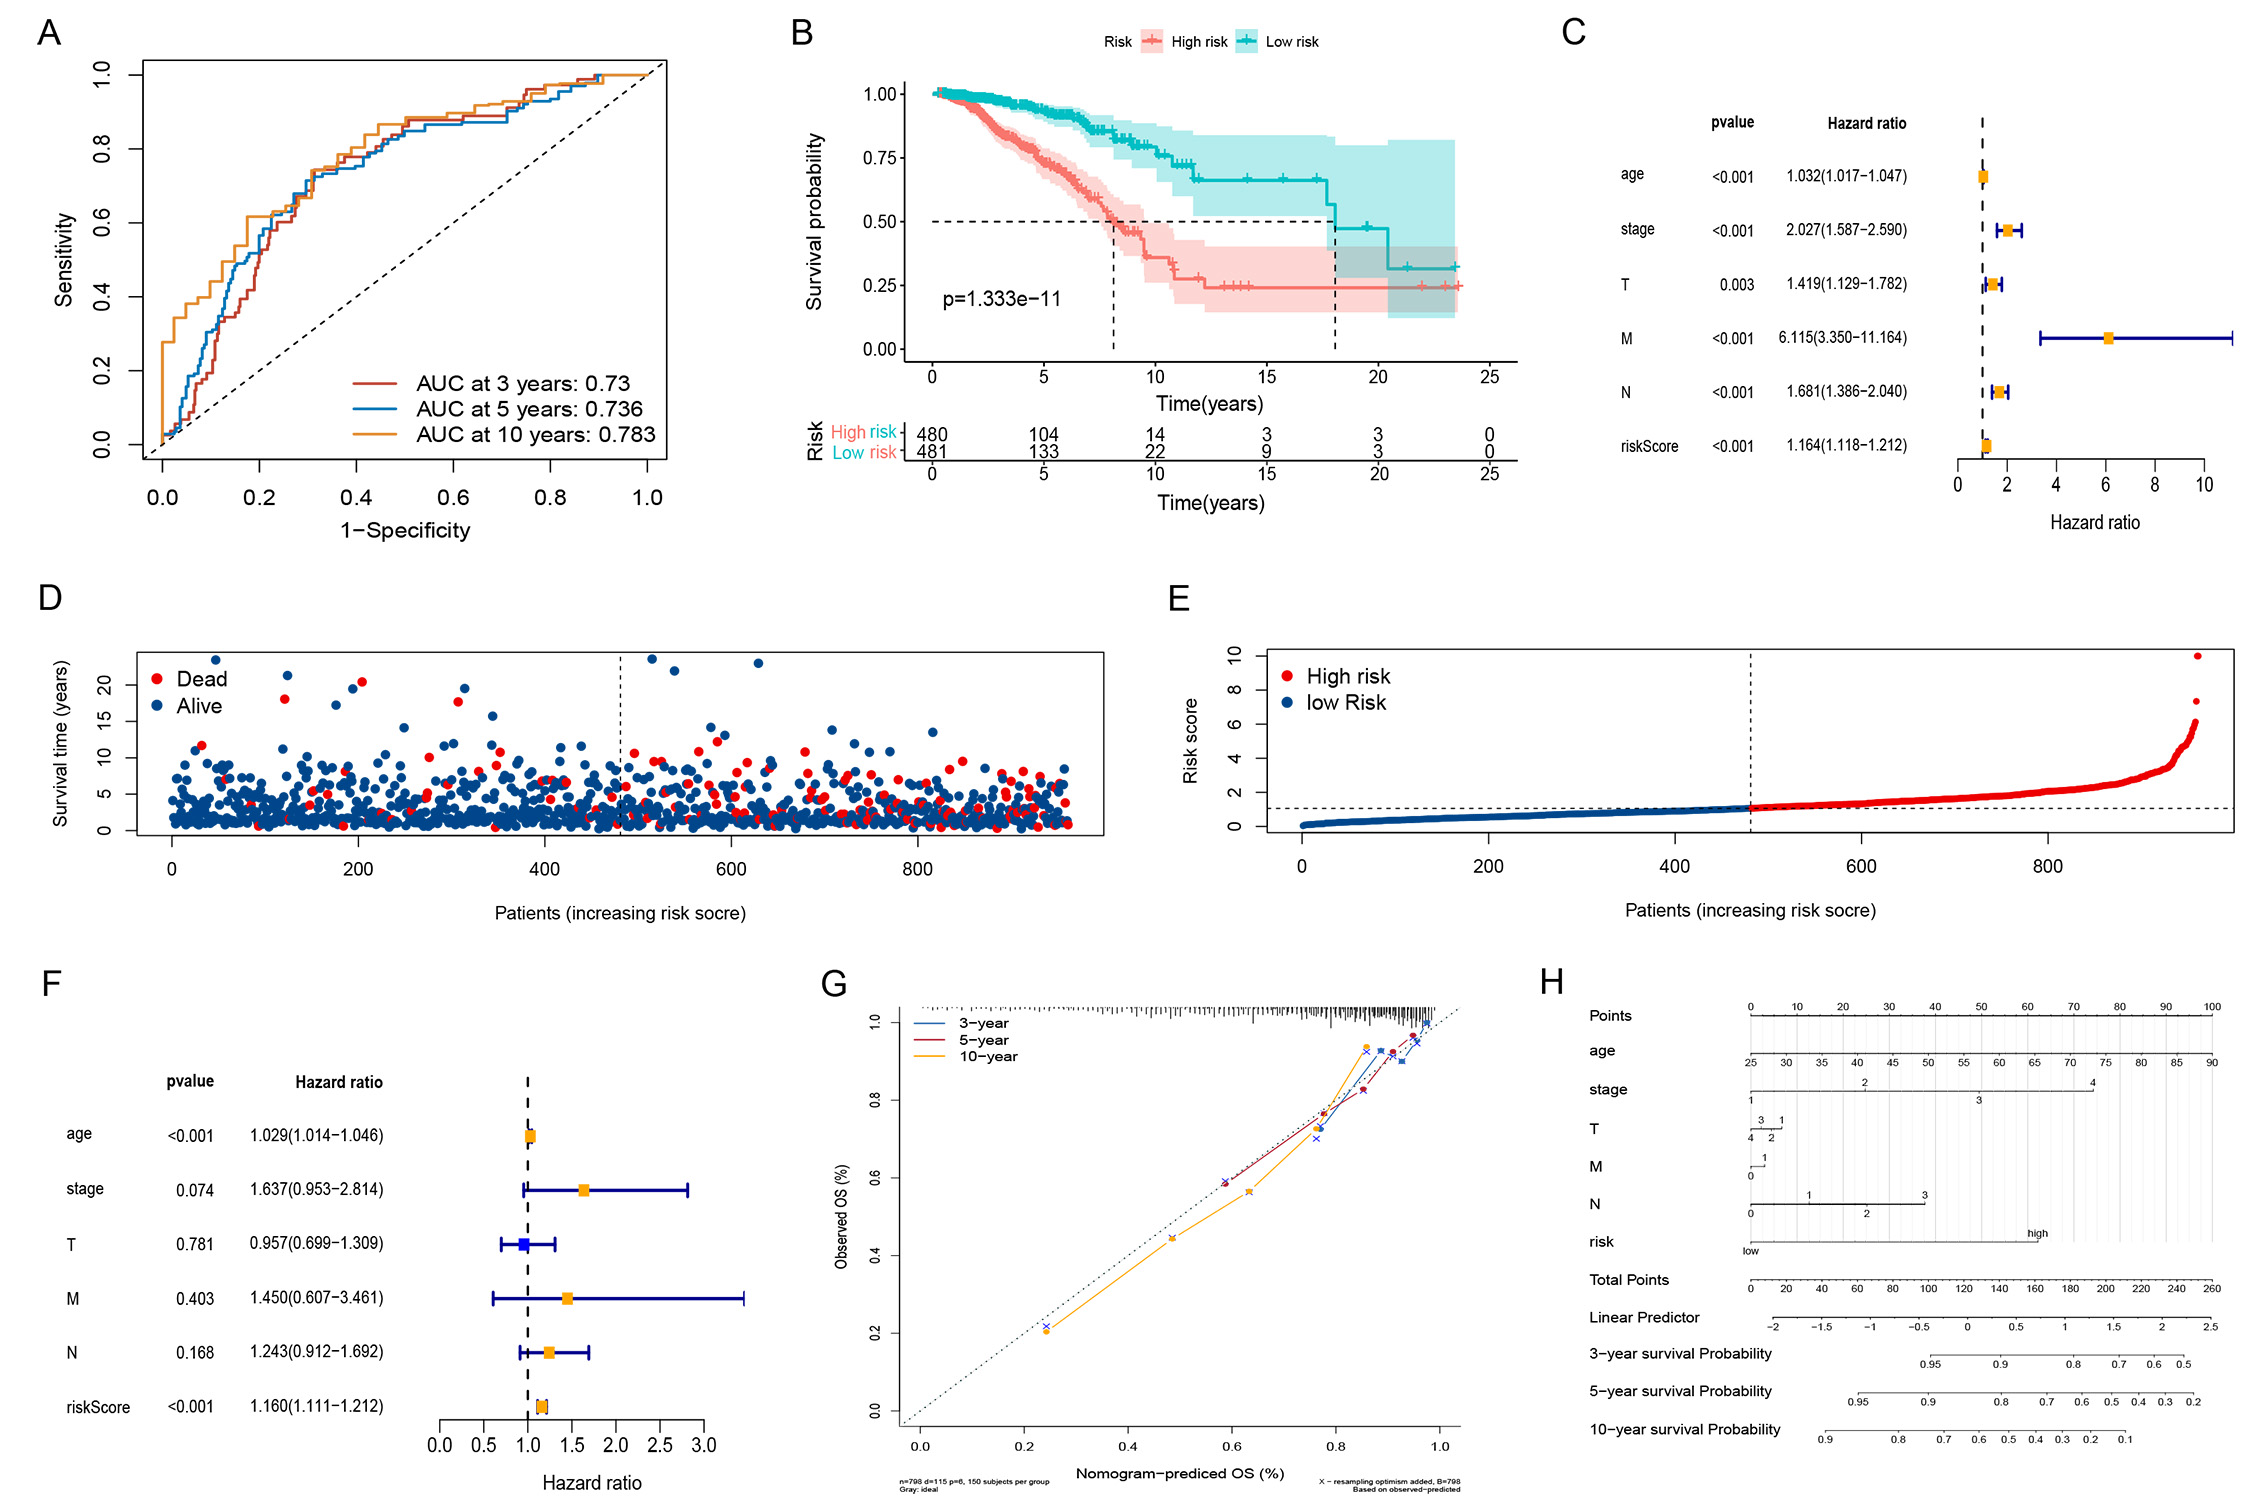 Fig. 3.
Construction of risk scores and their relationship to clinical characteristics. (A) The Receiver Operator Characteristic (ROC) curves to assess the prognostic ability of the risk model. (B) Two groups Kaplan-Meier (K-M) survival curves. (C) Forest plot for univariate Cox regression analysis. (D) Survival distribution of BC patients in The Cancer Gene Atlas (TCGA). (E) Risk score distribution of BC patients. (F) Forest plot of multivariate Cox regression analysis. (G) Calibration curve checking the accuracy of the model. (H) Nomogram predicts survival in BC Patients.
Cox analyses were conducted on age, staging, and T, tumor size; N, lymph node status;
M, metastasis (TNM) as univariate and
multivariate variables. Both clinical variables could be used as predictors in
the univariate Cox regression analysis (Fig. 3C); however, the multifactorial Cox
regression analysis showed that age (hazard ratio [HR] 1.029 [1.014–1.046]
p
A new expression matrix was obtained by combining the GSE42568 (104 BC specimens) and GSE88770 (117 BC specimens) datasets to validate model accuracy. Heatmaps of ARGs (Fig. 4A) showed LRG and HRG for patients with BC based on risk scores; as the risk score increased, the mortality rate also increased (Fig. 4B). According to the K-M curves (Fig. 4C), survival rates were significantly higher in the LRG, whereas the modeled AUC values at 3, 5, and 10 years were 0.795, 0.748, and 0.753, respectively (Fig. 4D). In the LRG, immune pathways were enriched (Fig. 4E).
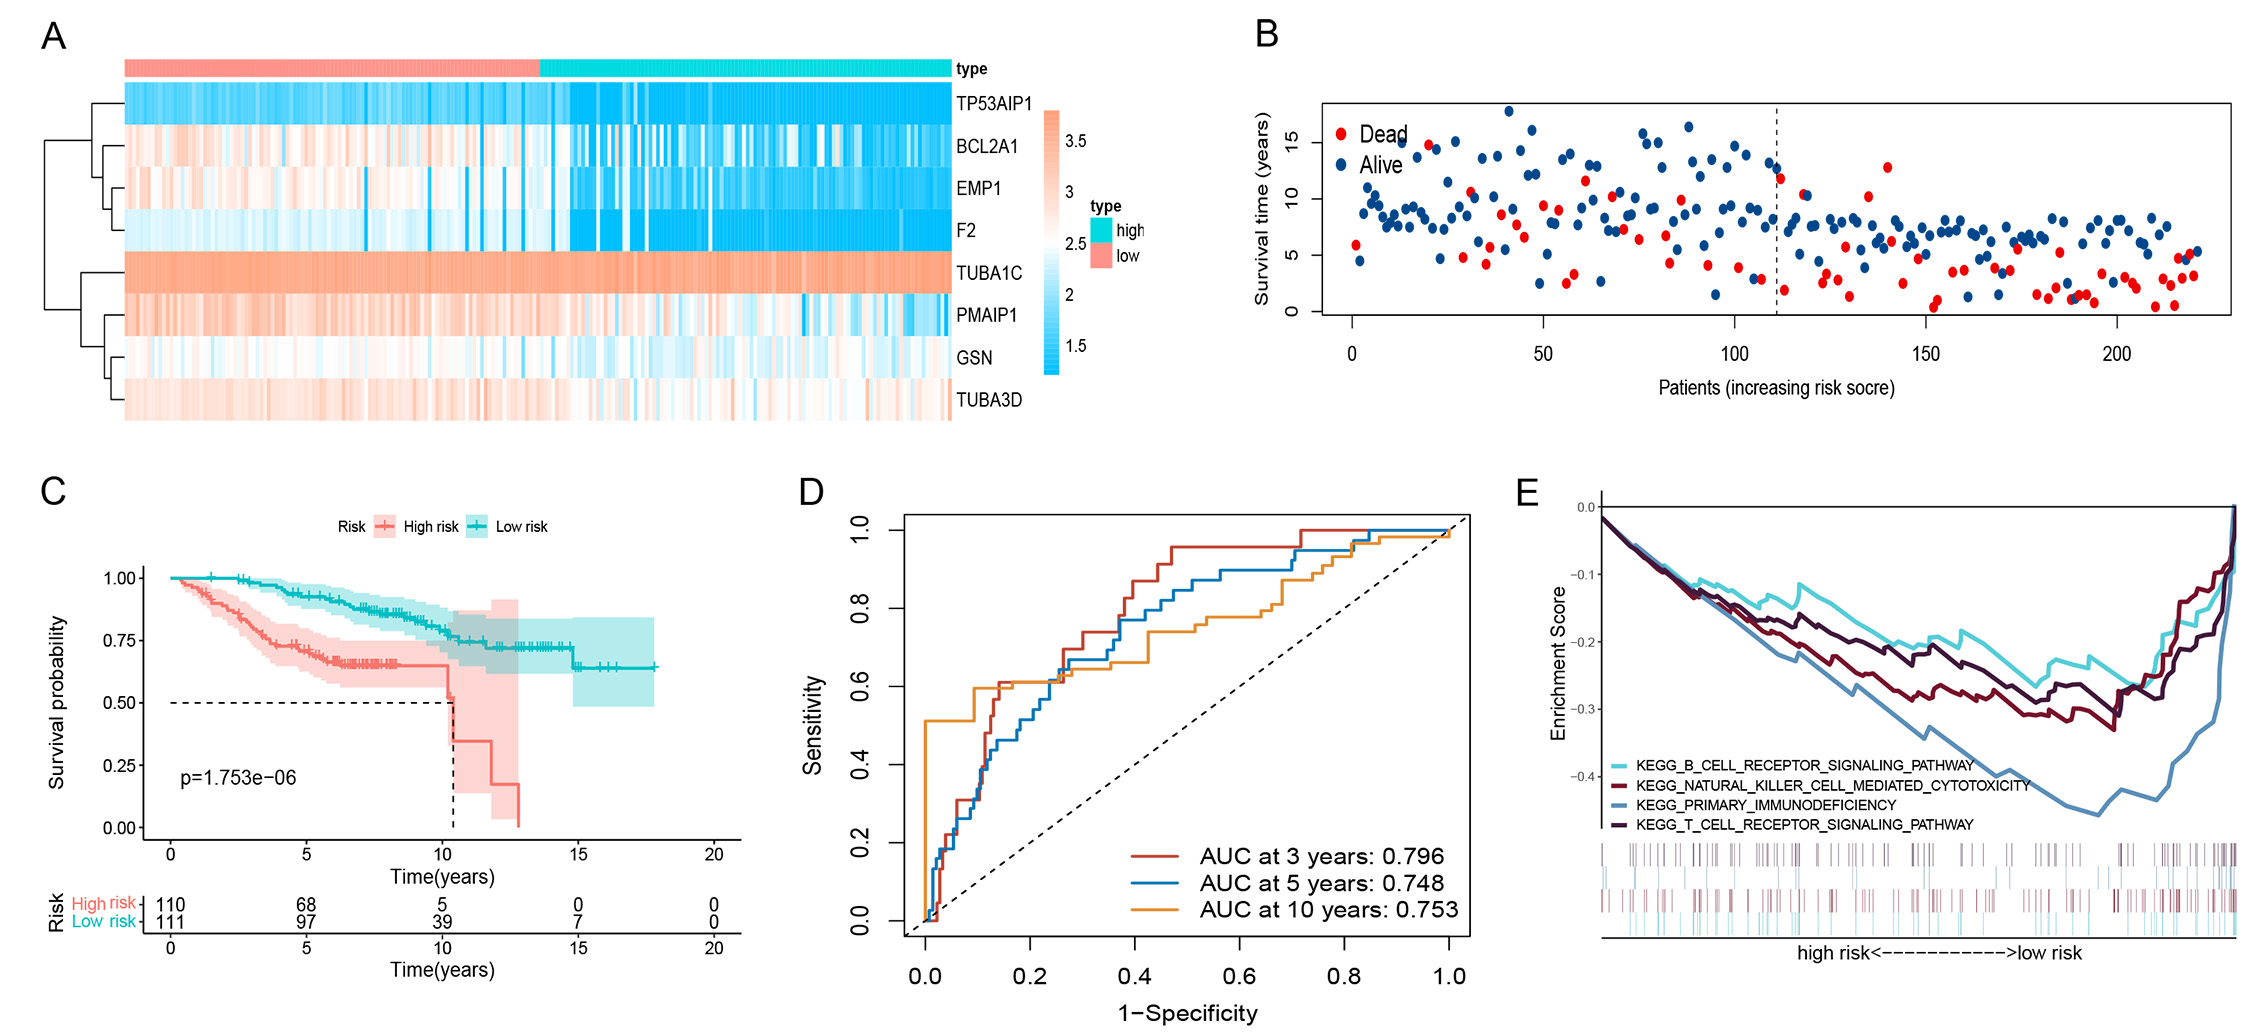 Fig. 4.
GEO dataset validate. (A) Heatmap of 8 risk genes. (B) Survival distribution of BC patients in GEO dataset. (C) K-M survival curves. (D) The time-dependent ROC curves. (E) Analysis of KEGG-related pathways of risk model in GEO dataset. GEO, gene expression omnibus; BC, breast cancer; ROC, receiver operator characteristic; KEGG, kyoto encyclopedia of genes and genomes.
To better understand their immunological differences, we performed CIBERSORT,
ssGSEA, and immune-related pathway analysis. According to CIBERSORT analysis, the
LRG had significantly higher levels of plasma cells, CD8 T cells, activated CD4
memory T cells, activated natural killer (NK) cells, T-cells regulatory (T regs), and
 Fig. 5.
Immunological analysis of two groups. (A) Cibersort analyses
the proportion of immune cells. (B) single sample gene set enrichment analysis (ssGESA) analysis of immune cell
expression. (C) Scores of 13 Immune-related pathways in both groups.
*p
To assess the sensitivity of the risk models to immune checkpoints, we used commonly used immune checkpoint targets in the two groups to verify CD274 (PD-L1), CTLA4, PDCD1, and PDCD1LG2 (PD-L2) expression (Fig. 6A–D,G). A PD-1 blocking treatment cohort, employed to verify the immunotherapy response of the model, revealed that longer life in the LRG (Fig. 6E) and a higher immunotherapy response than the HRG (Fig. 6F). These data indicate the excellent response of this model to immunotherapy.
 Fig. 6.
Comparison of immune checkpoints between the two groups and
validate PD-L1 immunotherapy response. (A–D,G) Comparison of immunological
checkpoints. (E) Survival curves of risk models in the PD-L1
treatment cohort. (F) Results of PD-L1 treatment in both groups of
patients. *p
Interestingly (Fig. 7), with an increase gene expression, both GSN and BCL2A1 showed a strong correlation with vemurafenib, dabrafenib, and PD-98059. PMAIP1 showed a strong correlation with palbociclib. These results indicate that these genes are sensitive to these drugs; however, EMP1 and GSN were negatively correlated with palbociclib but also to oxaliplatin, which indicated the emergence of drug resistance with high expression of this gene. EMP1 was resistant to dexrazoxane.
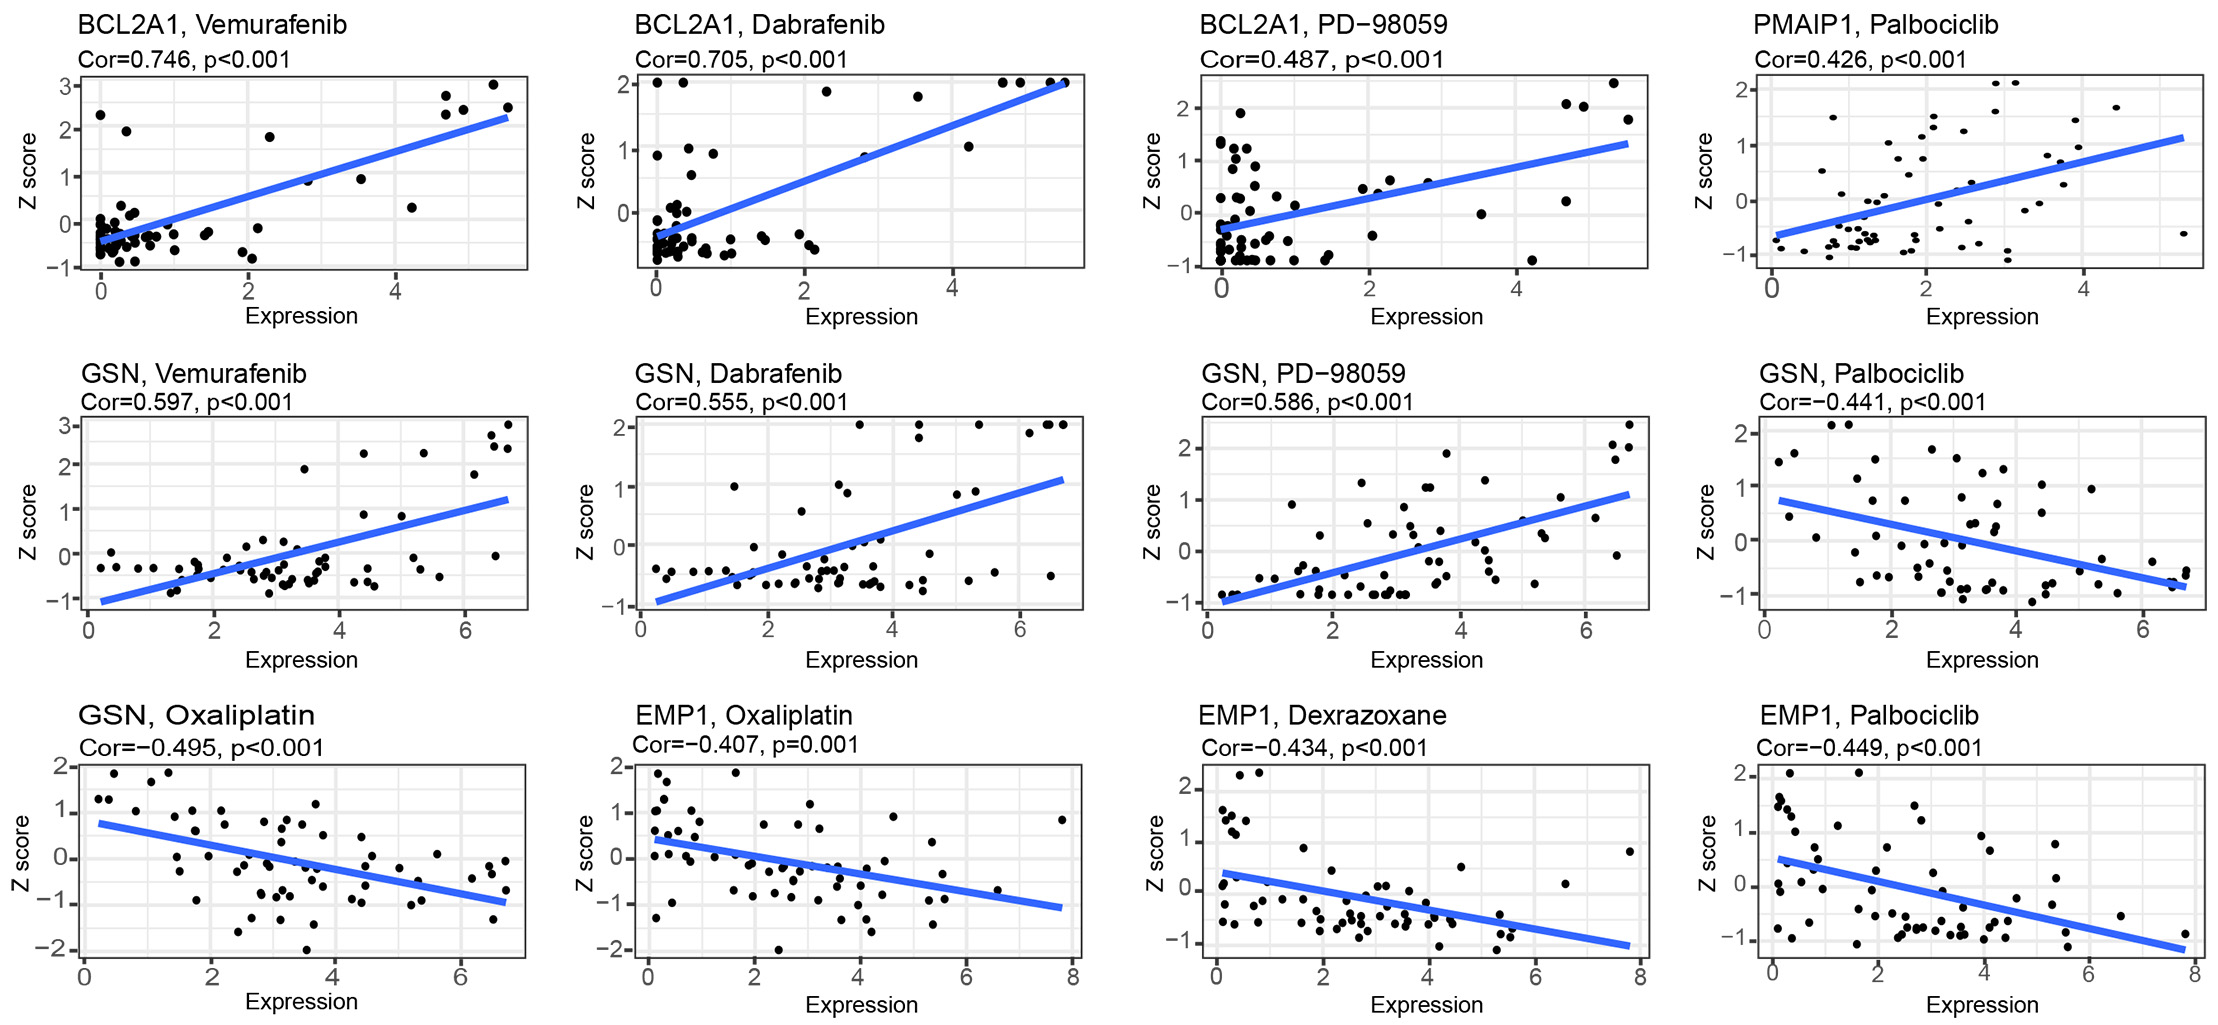 Fig. 7.
Drug sensitivity analysis of model genes.
Immunohistochemistry (IHC) techniques were used to test expression levels of risk model genes in BC tissues and adjacent tissues. Our findings validated the predicted results (Fig. 8) that PMAIP1, TUBA3D, TUBA1C, F2, and BCL2A1 were highly expressed in BC tissues, however, GSN, EMP1, and TP53AIP1 expression showed contrasting results.
 Fig. 8.
Image of gene expression in BC tissue and adjacent tissue
Immunohistochemical. (A) Representative images of eight ARGs expression
in BC tissue and their adjacent normal tissues (right magnification 400
Despite significant technological, imaging, pathology, and early detection advancements, BC remains the most prevalent tumor with high mortality rates among women. The poor prognosis of BC is largely attributed to local and distant metastases. Apoptosis, a critical process in cancer development, is a primary target of non-surgical cancer therapies, and evasion of apoptosis is a recognized characteristic of nearly all cancer cells [20, 21]. Therefore, we developed a prognostic risk model for apoptosis with good predictive properties. The model can be used to guide the treatment and management of BC patients and improve their survival.
In this study, 268 ARGs were identified, of which 74 were differentially expressed in BC. The analysis of ARGs in KEGG shows a strong enrichment in the apoptotic pathway, as well as in both endogenous and exogenous pathways related to apoptosis. GO analysis suggested the activation of immune T-cells and adhesion in leukocytes. The activation of immune T-cells caused antitumor effects on BC cells, and higher T-cell levels were associated with a better prognosis [22].
Eight of 74 ARGs, viz. PMAIP1, TP53AIP1, TUBA3D, TUBA1C, BCL2A1, EMP1, GSN and F2, were screened to construct a prognostic risk model. In our risk model for apoptosis-related genes, the AUC at 3, 5, and 10 years showed an increasing trend from 0.73 to 0.783. In the data validation set, it was found that the AUC could reach as high as 0.796, which illustrated the good predictive performance of our model. Combining risk scores and clinical risk factors to construct nomogram, the calibration curves affirmed the validity of the model. It provides an accurate tool for predicting 3-, 5-, and 10-years survival in BC patients.
TUBA1C was highly expressed in both HRG and tumor tissues, while the remaining seven genes were relatively highly expressed in the LRG, but GSN, TP53AIP1 and EMP1 were more highly expressed in normal breast tissues. Specifically, higher TUBA1C expression predicted poorer patient outcomes, while higher GSN, TP53AIP1 and EMP1 expression was associated with better outcomes. This suggests that GSN, TP53AIP1 and EMP1 may function as oncogenes in BC, while TUBA1C may be the oncogene. In gliomas, TUBA1C was positively correlated with B-cell, CD8 T+ cell, and CD4 T-cell infiltration, and high expression of TUBA1C accelerated tumor progression through tumor-infiltrating cells [23]. It has been reported that in BC, low GSN expression predicts a poorer prognosis and that GSN is positively correlated with immune cell expression, which is essential in anti-tumor immune cell infiltration [24]. For TP53AIP1, it has been shown in a study to be a novel oncogene in BC and may become a new therapeutic target in the future [25]. Sun et al. [26] suggest that Low EMP1 expression is associated with lymph node metastasis and low survival rates. These are consistent with the results of our study.
In contrast, a high BCL2A1 expression in BC promotes tumor cell resistance to chemotherapeutic agents and inhibits the apoptosis of tumor cells, the prognosis for patients with BC expressing high levels of BCL2A1 is usually poorer [27, 28]. We found that BCL2A1 was highly expressed in BC and higher in the LRG, suggesting that BC patients with higher expression could show better survival advantage. This is consistent with the validation results of Dai et al. [29]. We hypothesize that it may be caused by the association of BCL2A1 with immune response and immune cells. Furthermore, PMAIP1, the only pro-apoptotic protein in the BCL2 family, enhances the sensitivity of cancer cells to chemotherapeutic drugs by inducing apoptosis [30]; its downregulation in triple-negative BC implies worse OS and distant metastasis-free survival [31]. PMAIP1 has been previously reported as a predictor of survival in BC [32].
Gene set enrichment analysis (GSEA) enrichment analysis revealed stronger immune pathways in the LRG. On further analysis, significant differences were found between the two groups in the type of immune cell infiltration and immune pathways. The LRG had high proportions of CD8 T-cells, T cells activated CD4 memory T-cells, and natural killer (NK) cells. According to previous reports that in most cancers, the degree of tumor infiltration of lymphocytes is correlated with prognosis, and T-cells and NK cells can activate granzyme-activated apoptotic pathways [33, 34]. Further, we included a cohort of advanced renal clear cell carcinoma treated with immunotherapy using a PD-1 blocker to validate the model’s effect on immunotherapy, and found that the LRG responded better to immunotherapy and had a longer survival time. The study noted an increased response to PD-1 in BC with higher levels of CD8 T- cells [35]. Recent studies have shown higher recurrence free survival in patients with high immune cell infiltration in her2 positive and triple negative BC [36, 37]. These surface that the LRG in our model has excellent immunogenicity and better immunotherapy response.
According to some studies, multidrug resistant genes limit chemotherapeutic drug effectiveness due to a reduced expression of oncogenes and an inhibition of apoptosis [38, 39]. Researchers have discovered that natural compounds may be useful in treating cancer, such as berberine and apigenin derivatives, which promote apoptosis in cancer cells [40, 41]. In addition, there are studies that suggest natural compounds can improve patients’ survival rates when used along with conventional chemotherapy [11]. In order to investigate the drug sensitivity of the model genes, we decided to conduct a drug sensitivity analysis. In this study, RNA expression and drug data from Cell Miner were downloaded to analyze drug sensitivity against eight model genes, wherein GSN and BCL2A1 exhibited strong sensitivity to vemurafenib, dabrafenib, and PD-98059. The above-mentioned three drugs are MAPK kinase (MEK) inhibitors and have been widely used in the treatment of melanoma, thyroid cancer, and non-small cell lung cancer with excellent clinical outcomes [42, 43, 44, 45]. During clinical trials, palbociclib, an oral CDK4/6 inhibitor, showed good clinical efficacy in patients with advanced BC that was hormone receptor-positive (HR+) [46]. Our results showed that the sensitivity of PMAIP1 to palbociclib was positively correlated in the model; however, EMP1 and GSN showed resistance to palbociclib as their expression increased. Dexrazoxane is the sole medication sanctioned by the FDA to manage cardiotoxicity caused by anthracyclines, which are the primary chemotherapy drugs used for various cancers [47]. However, resistance to dexrazoxane increases with the increase of EMP1 expression, suggesting that patients with cancer with high EMP1 expression should be carefully c treated with anthracyclines. Some of the above drugs, although well reported in BC, have model genes that are sensitive to them, which can provide an additional option for patients.
In summary, we constructed a prognostic model based on the identification of ARGs, effectively predicting the survival outcomes of BC patients. Validation using independent datasets confirmed the model’s accuracy and clinical relevance, while validation in immunotherapy cohorts demonstrated its efficacy in predicting treatment response. Additionally, drug sensitivity analysis identified relevant therapeutic options. This study offers promising new tools for prognostication and predicting immune responses in BC patients, aiding medical decision-making and enabling personalized therapeutic interventions.
The datasets analyzed during the current study are available in The Cancer Genome Atlas (https://portal.gdc.cancer.gov) and the Gene Expression Omnibus (https://www.ncbi.nlm.nih.gov/geo/query/acc.cgi?acc=GSE42568, https://www.ncbi.nlm.nih.gov/geo/query/acc.cgi?acc=GSE88770), the Kyoto Encyclopedia of Genes and Genomes (KEGG) (https://www.kegg.jp/entry/hsa04210). A cohort of advanced renal hyaline cell carcinoma immunotherapy treated with PD-1 blockade (https://www.ncbi.nlm.nih.gov/pmc/articles/PMC7499153/). All data used in this study are available from public databases and can be provided by the authors upon reasonable request.
ZHL and HCL conceived and designed this study. MZZ and JWW performed the bioinformatics analyses and visualization. ZHL and HCL collected data and performed the statistical analysis. ZHL and HCL wrote the original draft. NJ, QLP and YXW participated in experiments, critical review and revision of the manuscript. All authors have participated sufficiently in the work to take public responsibility for appropriate portions of the content and agreed to be accountable for all aspects of the work in ensuring that questions related to its accuracy or integrity. All authors contributed to editorial changes in the manuscript. All authors read and approved the final manuscript.
Involving human participants was approved by the Ethics Committee of Chongqing Medical University (with approval number: K2023-514). All patients provided written informed consent to participate in this study. All methods were carried out in accordance with the Declaration of Helsinki.
This manuscript has been preprinted [https://doi.org/10.21203/rs.3.rs-2898842/v1].
This work was supported by the National Natural Science Foundation of China (Grant No. 81972023), the Natural Science Foundation of Chongqing City (Grant No. cstc2021jcyj-msxm0172), the Science and Technology Research Program of Chongqing Education Commission of China (Grant No. KJQN201900425), Creative Research Group of CQ University (Grant No. CXQT21017), and Program for Youth Innovation in Future Medicine from Chongqing Medical University.
The authors declare no conflict of interest.
References
Publisher’s Note: IMR Press stays neutral with regard to jurisdictional claims in published maps and institutional affiliations.