
Academic Editor: Soo-Jin Choi
Background: Brewer’s spent grain (BSG) is one of the main by-products
of beer industry, little used because of its high moisture making it difficult to
transport and store. Mainly used as animal feed and for energy production, the
agro-industrial waste have recently attracted attention as source of bioactive
compounds, with potential applications in many sectors as food, nutraceutical,
pharmaceutical, cosmetic, food packaging. The present work focuses on BSG as
potential source of valuable small-size bioactive compounds. Methods:
Laboratory-made BSG was obtained by using four base malts for mashing. After
drying, BSG was eco-friendly extracted with water and the extracts analyzed by
untargeted ElectroSpray Ionization (ESI)-Mass Spectrometry (MS)/Mass Spectrometry (MS) (ESI-MS/MS) infusion experiments and by targeted High Performance Liquid Chromatography-PhotoDiodeArray-ElectroSpray Ionization-Mass Spectrometry (HPLC-PDA-ESI-MS) in Selected Ion Recording (SIR)
mode analysis, to investigate the metabolic profile, the phenolic profile, the
individual phenolic content, and tryptophan content. Aqueous extracts of malts
and wort samples were also analyzed for a comparison. Data were statistically
analyzed by ANOVA test. An explorative analysis based on Principal Component
Analysis (PCA) was also carried out on malts, wort and threshes, in order to
study correlation among samples and between samples and variables.
Results: The untargeted ESI-MS/MS infusion experiments provided the mass
spectral fingerprint of BSG, evidencing amino acids (
Brewer’s spent grain (BSG) is the main by-product of the brewing process, about 85% of the total beer production waste [1]. It accounts for about 30% of starting malt weight [2], thus 100 liters of beer produced generate approximately 20 kg of BSG [3]. Barley is the most used cereal for brewing. After dormancy for 4–6 weeks from the harvest, it is malted, i.e., subjected to steeping (in water at 5–18 °C), germination (in a humid air stream at 15–21 °C for approximately one week) and drying (40–60 °C, to 4–5% moisture amount), in order to obtain the optimal enzymes content, necessary in the next mashing step (in water up to 78 °C) to break down starches and proteins to sugars and amino acids, respectively. These are the main components of wort, a sweet liquid ready for the fermentation by yeasts, while the BSG is the solid wet by-product.
The huge amount of this lignocellulosic bio-waste contains undegraded material, with bioorganic fractions rich in carbohydrates, proteins, lipids, along with small amounts of minerals, vitamins, phenolic compounds, and its nutritional potential is still very high, reason why the BSG is, up today, mainly used as animal feed, although the high content of water renders it a perishable food hard to store. Nonetheless, a large part of the BSG remains unused, and until recently, most of the investigation focuses on the conversion of the BSG biomass into bioenergy, by thermo- and bio-chemical methods, from combustion to anaerobic digestion, as recently reported [4] and widely reviewed [5, 6]. Conversely, the high potential of BSG as renewable bio-source of value-added compounds is still waiting to be deeply explored. Increasing attention is being paid to the valorization and up-cycling of this nutrient-rich source BSG for health-promoting additional compounds in food production, as an example. Processes for recovering valuable compounds from BSG and analytical methods for the characterization of individual components, starting from pre-treatment methods, has been recently reviewed [6].
The chemical composition of BSG was studied, with particular regard to the main
components, that are 15% fibers, 28% proteins, 7% lipids, 4% ash, by
physico-chemical and enzymatic methods [7, 8, 9, 10]. Proteins (10 g per 100 g dried
BSG, BDG (brewer’s dried grain)) were obtained by ultrasound irradiation of an alkaline BSG solution
[11]; xylo-oligosaccharides (13 g per 100 g BDG) were obtained by extraction with
water after heating at 190 °C [12]; lignin (32 g per 100 g BDG) was
obtained by alkaline hydrolysis followed by acid treatment [13]; arabinoxylans
were obtained by water extraction after heating and alkaline treatment [14]; a
protein-enriched isolate (BSG-PI) of BSG was obtained and used as an angiotensin
converting enzyme (ACE) inhibitor [15]. Furthermore, supercritical CO
Since polar compounds as polyphenols and amino acids can be extracted simply using water without pretreatment, the present work focused on the phytochemical composition of the polar fraction of BSG, explored by using the combined tools of mass spectrometry and liquid chromatography for the untargeted and the targeted analysis of aqueous extracts of BSG, obtained through a simple, eco-friendly and cheap process, with the aim to evaluate the presence of small-size bioactive metabolites of interest for potential applications in different sectors as food, nutraceutical, pharmacological, cosmetic and smart materials ones. In fact, understanding the specific composition is the first step towards the valorization of waste and by-products as renewable bio-sources. Major attention was focused on free phenolic compounds (available without any pretreatment) and tryptophan, not previously individually investigated in BSG, at least to the best of our knowledge, although its presence in proteins was put in evidence [1, 30]. The focus on tryptophan was due to the pharmacological and nutraceutical applications of this essential amino acid, important precursor through its metabolic pathway of bioactive compounds as serotonin (a neurotransmitter), melatonin (a hormone) and vitamin B3 [31, 32, 33, 34, 35].
To obtain results reasonably representative of the waste BSG, herein simply called threshes, four BSG samples were produced in our laboratory by using four base malts, meaning those malts that have the optimal enzyme content and for this reason are used, rarely alone (100%) and more often mixed with special malts, in all brewing processes.
All chemicals were of analytical grade, purchased from Sigma-Aldrich (Milano, Italy) and used as received. HPLC-grade acetonitrile and methanol were purchased from Carlo Erba (Milano, Italy); HPLC-grade water was freshly prepared with the Milli-Q purification system (Millipore, Vimodrone, Italy).
Four commercial samples of freshly ground base malt, namely Pilser malt 2.8–3.8 EBC (Rhön Malz, Mellrichstadt, Germany), Monaco malt 18–20 European Brewing Convention (EBC) (Rhön Malz, Mellrichstadt, Germany), Vienna malt 6–10 EBC (Crisp Malting, Great Ryburgh Fakenham Norfolk, United Kingdom), Extra Pale Maris Otter malt 3–4 EBC (Crisp Malting, Great Ryburgh Fakenham Norfolk, United Kingdom), were purchased from Birramia.it — Enterprise SRL (Querceta, Lucca, Italy), each sample identified by batch number and expiration date. The samples, stored under vacuum, are available by our laboratory.
Before using the samples, water activity and absolute humidity were measured in duplicate by a Schaller Humimeter Rh2 (Schaller Messtechnik GmbH, St. Ruprecht an der Raab, Austria); the microbiological analysis for the total aerobic count, yeasts and molds, lactic acid bacteria and enterobacteriaceae were performed as previously described [36]. All measurements were performed in duplicate. Results are resumed in Table 1.
| Malt sample | Abs H (g/m |
aw 28.0 °C | TAC (CFU/g) | Y&M (CFU/g) | LAB (CFU/g) | EB (CFU/g) |
|---|---|---|---|---|---|---|
| Vienna | 1.51 | 0.055 |
1.20 |
3.30 |
6.20 |
1.94 |
| Monaco | 2.95 | 0.108 |
4.00 |
3.75 |
7.10 |
8.40 |
| Pilsner | 3.33 | 0.122 |
3.11 |
3.82 |
4.24 | |
| Extra Pale Maris Otter | 3.40 | 0.124 |
1.48 |
1.78 |
2.87 |
8.60 |
Aqueous extracts were obtained by adding 1.0 g of Vienna, Monaco, Pilsner and
Extra Pale Maris Otter malt, in turn, to 10 mL of Milli-Q purified water, and
keeping the mixture under magnetic stirring for 1 hour, at room temperature.
Mixtures were then centrifuged at 3000 rpm for 10 min; supernatants were
recovered, filtered at 0.22
Malts were used for the wort production, with the aim to collect the spent grains (BSG or threshes) after mashing. Malts were mashed according to a typical multi-steps mashing procedure. In detail: 15 g of malt were put in a cylindrical glass apparatus equipped with a tap, complemented with 45 mL of mineral water, pre-heated at 52 °C, and immersed in a thermostated bath, for the following mashing program: 45 °C (20 min rest), 50 °C (10 min rest), 65 °C (60 min rest), 78 °C (15 min rest). A Crison GLP 21 (Crison Instruments) pHmeter was used to measure the pH along the mashing. The iodine test was performed to verify the absence of residual starch.
Wort was then collected, while threshes were washed by adding 45 mL of hot water
(80 °C) acidified with HCl at pH = 5.5. After shaking, followed by 5
minutes of rest, the washing water was collected and centrifuged by an ALC
Centrifugette 4206, at 3000 rpm for 10 min. Supernatant was recovered, filtered
at 0.22
Threshes, coming from mashing, were recovered and dried overnight at 60 °C, until they reached a constant weight. Water activity and absolute humidity were measured in duplicate by a Schaller Humimeter Rh2 (Schaller Messtechnik GmbH, Austria). Results are resumed in Table 2. The resulting product was stored under vacuum.
| BSG sample | Abs H (g/m |
aw 28.0 °C |
|---|---|---|
| Vienna | 15.10 | 0.502 |
| Monaco | 11.20 | 0.521 |
| Pilsner | 16.30 | 0.528 |
| Extra Pale Maris Otter | 10.30 | 0.501 |
Aqueous extracts of the BSG samples were obtained by mixing the dried threshes
and Milli-Q purified water in the weight/volume ratio 1:10 (w:v), and keeping the
mixture under magnetic stirring for 1 hour, at room temperature. After
centrifugation at 3000 rpm for 10 min, the supernatant was recovered, filtered at
0.22
All the samples, namely wort, aqueous extracts of malts and aqueous extracts of
threshes, were analyzed for the targeted phenolic profile and the individual
phenolic and tryptophan content, by a Waters apparatus composed of a
1525
All the samples, namely wort, aqueous extracts of malts and aqueous extracts of
threshes, were analyzed for the untargeted metabolic profiling by direct infusion
into the ESI source through an external syringe, flow rate 5
Mass spectral data were acquired in full scan for 2 minutes in both ES- and ES+ ionization, in the mass range 80–800 Da, cone voltage 27 (ES-) and 24 V (ES+), ionization source temperature 100 °C, desolvation gas temperature 150 °C, cone gas flow 30 L/h, and desolvation gas flow 400 L/h. The main signals evidenced in the full scan spectra (Figs. 1,2,3,4) were identified by the fragmentation pattern, obtained by selecting each m/z value as precursor ion and fragmenting with argon, using collision energy (CE) in the range of 10–25 eV (see Tables 3,4): fragmentation spectra were acquired for 2 minutes, in the appropriate mass range. All acquisitions were carried out in duplicate.
 Fig. 1.
ES+ mass spectral profiling of BSG. Full scan spectra of
threshes, Monaco, Extra Pale Maris Otter, Pilsner and Vienna, from bottom to top,
acquired by direct infusion into the ESI source in positive ionization ES+. 1,
 Fig. 2.
ES+ mass spectral profiling of Monaco samples. Full scan
spectra of Monaco samples: threshes, malt and wort, from bottom to top, acquired
by direct infusion into the ESI source in positive ionization (ES+). 1–9, amino
acids (as described in Fig. 1); 10, maltose (as described in Fig. 1); 11, glucose
([M+Na]
 Fig. 3.
ES- mass spectral profiling of BSG. Full scan spectra of
threshes, Monaco, Extra Pale Maris Otter, Pilsner and Vienna, from bottom to top,
respectively, acquired by direct infusion into the ESI source in negative
ionization ES-: 10, maltose ([M-H]
 Fig. 4.
ES- mass spectral profiling of Monaco samples. Full scan spectra of Monaco samples: malt, threshes and wort, from bottom to top, respectively, acquired by direct infusion into the ESI source in negative ionization (ES-).
| n. | Amino acid | Precursor ion [M+H] |
Fragment (m/z) | Collision energy (eV) | Ref. |
|---|---|---|---|---|---|
| 1 | 104 | 87 | 20 | [53] | |
| 2 | Proline (Pro) | 116 | 70 | 15 | [54] |
| 3 | Valine (Val) | 118 | 72 | 20 | [54] |
| 4 | Threonine (Thr) | 120 | 103, 91, 74 | 20 | [54] |
| 5 | Leucine/Isoleucine (Leu/I) | 132 | 86 | 10 | [54] |
| 6 | Lysine (Lys) | 147 | 130, 84 | 15 | [54] |
| 7 | Histidine (His) | 156 | 110 | 15 | [54] |
| 8 | Phenylalanine (Phe) | 166 | 149, 120 | 15 | [54] |
| 9 | Arginine (Arg) | 175 | 116, 70 | 20 | [54] |
| n. | Organic acid | Precursor ion [M-H] |
Fragment (m/z) | Collision energy (eV) | Ref. |
|---|---|---|---|---|---|
| 15 | Piruvic a. (Pyr) | 87 | 43 | 10 | [56] |
| 16 | Lactic a. (Lac) | 89 | 71, 43 | 10 | [56] |
| 17 | Phosphoric a. (Pho) | 97 | 79 | 10 | [57] |
| 18 | Valerianic a. (Valer) | 101 | 73, 57 | 10 | [58] |
| 19 | Malonic a. (Malon) | 103 | 74, 59 | 10 | [58] |
| 20 | 2-Furoic a. (Fur) | 111 | 67, 41 | 15 | [59] |
| 21 | Malic a. (Mal) | 133 | 115, 89, 71 | 10 | [60] |
| 22 | Citric a. (Cit) | 191 | 129, 111 | 10 | [60] |
| 23 | Gluconic a. (Glu) | 195 | 129, 111, 99 | 25 | [61] |
All samples were analyzed in triplicate for quantitation, and results were
reported as mean values
Phenolic chromatographic profiles of all samples were investigated through chemometric tools in order to study correlations among samples and to identify the variables affecting most the results. Multivariate statistical analysis is largely applied to study multiparametric data achieved by several techniques in order to simplify the interpretation of chemical problems and point out the relevant information as well as the variables that can be considered more informative for the analytical issue [41]. In this study, an explorative analysis based on Principal Component Analysis (PCA) was carried out on malts, wort and threshes, in order to study correlation among samples and between samples and variables.
Starting from chromatographic results referred to malts, wort and threshes, four matrices were imported into the chemometric package V-JDSU Unscrambler Lite (V-JDSU Unscrambler X 10.4, Camo software AS, Oslo, Norway) and different mathematical pre-treatments [42, 43] were tested in order to select the optimal one which separates samples according to the different chemical composition. The investigation of samples and variables correlation was performed by Principal Component Analysis using NIPALS algorithm.
Four samples of BSG were prepared in our laboratory by a typical multi-step mashing process, starting from the four base malts Vienna, Monaco, Pilsner and Extra Pale Maris Otter, all from barley grains. That pool of malts was chosen because they are used, rarely alone (100%) and more frequently mixed with a variety of special malts, for the production of the whole wide choice of industrial and craft beers due to their optimal enzyme content. For this reason, results could be expected reasonably representative for the waste.
Dried threshes (Table 2), obtained as described in Materials and Methods, were eco-friendly extracted with water at room temperature to explore the presence of residual metabolites in the waste, that if recovered might find interesting applications in nutraceutical, pharmaceutical, cosmetic, or food-additive industry, just to name a few.
The aqueous extracts were analyzed for the metabolic profile by direct infusion ESI-MS/MS experiments and for the phenolic profile and the individual phenolic and tryptophan content by HPLC-PDA-ESI-MS in SIR mode. The aqueous extracts of the corresponding starting malt and the corresponding wort were also analyzed for a comparison.
Since all threshes were produced by the same mashing procedure, any differences can be ascribed to the starting raw material, that is represented by the four different base malts used herein, all barley malts. Similarities might be likely due to the same kind of raw cereal, namely barley, although differences may be expected mainly due to different environmental conditions, storage, or to the presence of other cereals in trace, as wheat, rye, oats [44, 45]. Conversely, differences might be likely due to the different malting procedures, leading from barley to the different malts [38, 39, 46, 47, 48, 49].
The untargeted mass spectral profile of the four samples of threshes obtained by infusion experiments resulted quite similar, as shown and discussed just below, suggesting that our results might be actually representative for this kind of brewery by-products, produced in very high amount all over the world.
Starting from the mass spectral analysis in positive ionization (ES+), carried
out by direct infusion of the sample into the ESI source, a set of signals were
well evidenced, corresponding to protonated ions [M+H]
Among the signals, ten characteristic peaks, 1–10 in Fig. 1, were assigned on
the base of the molecular mass, the behaviour in positive and negative ionization
and fragmentation spectra, these last data also supported by literature. Peaks
1–9 at the monoisotopic values m/z 104, 116, 118, 120, 132, 147, 156,
166 and 175 were assigned to the protonated ion [M+H]
Although infusion experiments do not provide quantitative data, the relative abundance of compounds is given respect to the most abundant signal (100 %, height). In all BSG samples, GABA (1) is the main peak, followed by Pro (2), Val (3), with an inverted order in the case of Vienna, Leu/I (5) and Thr (4). Lys (6), His (7), Phe (8) and Arg (9) follow, with amounts around 10% compared to 1. The free amino acids evidenced by infusion experiments are in good agreement with literature reporting the content of free amino acids in craft BSG after pretreatment [25].
The presence of free amino acids in barley grains, malt, wort and finished beer were well reviewed recently [55]. Proline and glutamic acid, followed by leucine, are generally the main amino acidic component of barley; during malting, the activated proteolytic enzymes start to metabolize barley proteins, the cleavage of proteins continuing during mashing. Therefore, the proteogenic amino acidic profile of threshes is expected to reflect that one of the starting malt, with some changes occurred during mashing. The profile of BSG was compared with those ones obtained for the aqueous extract of malt (see Materials and Methods) and for wort (see Materials and Methods), obtaining four pools of samples BSG-malt-wort, namely Pilsner, Monaco, Vienna and Extra Pale Maris Otter. In Fig. 2, the ES+ mass spectral profiles of Monaco pool of samples, namely threshes, malt, wort from bottom to top, respectively, are shown as an example.
The amino acidic profiles of threshes, malt and wort (Fig. 2) are very similar from a qualitative point of view, although a different distribution can be observed among the samples. The main difference regards GABA (1), evidenced in all samples but becoming the main compound in threshes. GABA is not generally reported in barley [55], it is not a proteogenic amino acid and it generates by decarboxylation from glutamic acid, representative of barley [55]. Its presence in finished beers with different malt composition has been reported [38, 39]. Since glutamic acid was not evidenced in the profile of malt, as well in wort and threshes, GABA was likely generated from glutamic acid during malting, due to temperature or to the metabolic activity of microorganisms under different malting conditions. Moreover, the comparison among profiles in Fig. 2 suggests that among the identified amino acids, proline (2) is mainly transferred from malt to wort, while threshes remain richer in GABA (1). Noteworthy, besides the nutritional values, the free amino acids find applications as flavour ingredients in food, due to their organoleptic properties as the sweet taste (proline and threonine) and bitter taste (histidine, leucine/isoleucine, lysine, valine and phenylalanine) [25].
The other peaks evidenced in the ES+ profiles, 10 and 11 (Fig. 1 and Fig. 2), were identified as maltose and glucose, respectively: maltose
10 (M = 342 Da) is typically evidenced in ES+ by sodium and potassium
adducts, [M+Na]
Wort is obviously the sample richest in maltose and glucose, besides other oligosaccharides at higher m/z values (Fig. 2, wort Monaco), because starches are catalyzed into simple sugars, during mashing, by the activated carbohydrase enzymes of malt. In fact, the free simple sugars of wort are necessary for the subsequent fermentation by yeast to produce beer.
The ES- spectral analysis confirmed maltose 10 (Fig. 3), by the signals
at m/z 341 and 377 corresponding to the deprotonated ion [M-H]
Among the other signals, nine characteristic peaks at lower m/z values,
15–23 in Fig. 3, were assigned on the base of the molecular
mass, the behaviour in negative and positive ionization, and fragmentation
spectra, these last data also supported by literature. Signals
15–23 at the m/z monoisotopic values 87, 89, 97, 101,
103, 111, 133, 191 and 195 were assigned to the deprotonated ion [M-H]
By the comparison between ES+ and ES- profiles, higher peaks for glucose and its anhydrohexose, 11 and 12, respectively, are observed in ES-. Taking into account that their amount is obviously the same in ES+ and ES-, and admitting for them a similar behaviour in ES+ and ES-, the organic acids fraction content in threshes seems minor respect to the amino acids fraction. Similar profiles are evidenced for BSG from Monaco, Extra Pale Maris Otter and Pilsner, Lac (16) and Pho (17) being the most representative, followed by Fur (20), Valer (18) and Mal (21), although little differences in the distribution are observed. Conversely, some differences are evidenced for Vienna, from both a qualitative point of view and distribution: Pho (17) remains a dominant peak with Glu (23), found in very low percentage in the other samples. Noteworthy, gluconic acid occurs in nature from the oxidation of glucose, it is considered a valuable chemical for many applications [62], and its potential use in cancer therapy has been recently reported [63]. Gluconic acid, found abundant in Vienna threshes, was not detected in the corresponding malt and wort, suggesting that it is likely formed during mashing, but further research is needed to investigate on it. Furthermore, malonic acid (19) is found only in Vienna. Noteworthy, the content and proportion of organic acids in final malt is influenced by raw barley, differing for gene type and environmental conditions, as well by malting process and microorganisms [64].
Similarly to what reported above for profiling in ES+, the profile of BSG was compared with those ones obtained for the aqueous extract of malt (see Materials and Methods) and for wort (see Materials and Methods), obtaining four pools of samples BSG-malt-wort, namely Pilsner, Monaco, Vienna and Extra Pale Maris Otter. In Fig. 4, the ES- mass spectral profiles of Monaco pool of samples, namely malt, threshes and wort from bottom to top, respectively, in which the most significant compounds are evidenced, are shown as an example.
Simple sugars (10, 11, 12) are confirmed predominant in wort samples, 2-furoic acid (20), malic acid (21) and citric acid (22) remain in threshes, lactic acid (16) is the second abundant peak in wort as well in threshes. BSG has been evaluated as low cost raw material for the production of lactic acid by fermentation, for bioplastic applications [22]. The possible abundant presence of lactic acid in the by-product BSG encourages further studies, due to the increasing interest in lactic acid based bio-polymers [65].
Results obtained by the untargeted ESI-MS/MS infusion experiments on BSG samples laboratory-made obtained by base malts used in all the recipes for brewing, also supported by the comparative analysis of malts and wort, can be likely considered reasonably representative of the waste BSG, for which the mass spectral fingerprint has been provided in the present work. No similar comparative study had been reported before, at least to the best of our knowledge. Noteworthy, the BSG samples were extracted with water at room temperature under one hour stirring, conditions chosen because cheap and eco-friendly, and therefore potentially suitable for possible treatments of waste and by-products. However, the identified amino acids, organic acids and saccharides are molecules characterized by high polarity, and in fact they eluted within the first 3 minutes in the chromatographic run described below: by the fact, they are not retained under the used reverse phase chromatographic conditions. Therefore, further investigation is needed to evaluate the real possibility to selectively recover at least some of the identified compounds, for various applications.
However, the untargeted ESI-MS/MS profiling has been confirmed a powerful tool for fast and confident characterization of complex matrix.
The phenolic profile of the aqueous extracts of threshes was investigated by HPLC-PDA-ESI-MS in SIR mode with a method previously developed [37] for the simultaneous identification and quantitation of 26 phenolic compounds, in detail: p-hydroxybenzoic acid (pHBA), m-hydroxybenzoic acid (mHBA), o-hydroxybenzoic acid (salicyclic acid, SaA), 2,5-dihydroxybenzoic acid (gentisic acid, 2,5-DHBA), 2,6-dihydroxybenzoic acid (2,6-DHBA), 3,5-dihydroxybenzoic acid (3,5-DHBA), 3,4-dihydroxybenzoic acid (protocatechuic acid, PCA), 3,4,5-trihydroxybenzoic acid (gallic acid, GA), vanillic acid (VA), syringic acid (SyA), caffeic acid (CA), p-coumaric acid (CouA), sinapic acid (SA), ferulic acid (FA), 4-caffeoylquinic acid (4CQA), 5-caffeoylquinic acid (5CQA), catechin (Cat), rutin (Ru), myricitrin (My), quercetin-3-O-glucoside (Q3G), kampferol-3-O-rutinoside (K3R), hesperidin (He), quercetin (Q), kampferol (K), isoxanthohumol (IsoX), xanthohumol (X). Furthermore, comparison with literature [36, 66] was used for the identification of 3-feruloylquinic acid (3FQA) and 4-feruloylquinic acid (4FQA) that were quantitated as ferulic acid equivalents; ellagic acid was searched by comparison with standard; lastly, tryptophan was identified and quantitated in the same chromatographic run, as previously described [36]. The aqueous extracts of malts and the corresponding wort were also analyzed for a comparison.
The HPLC-PDA chromatograms of the aqueous extracts of threshes are shown in Fig. 5, in which samples Monaco, Extra Pale Maris Otter, Pilsner and Vienna are reported from bottom top, respectively.
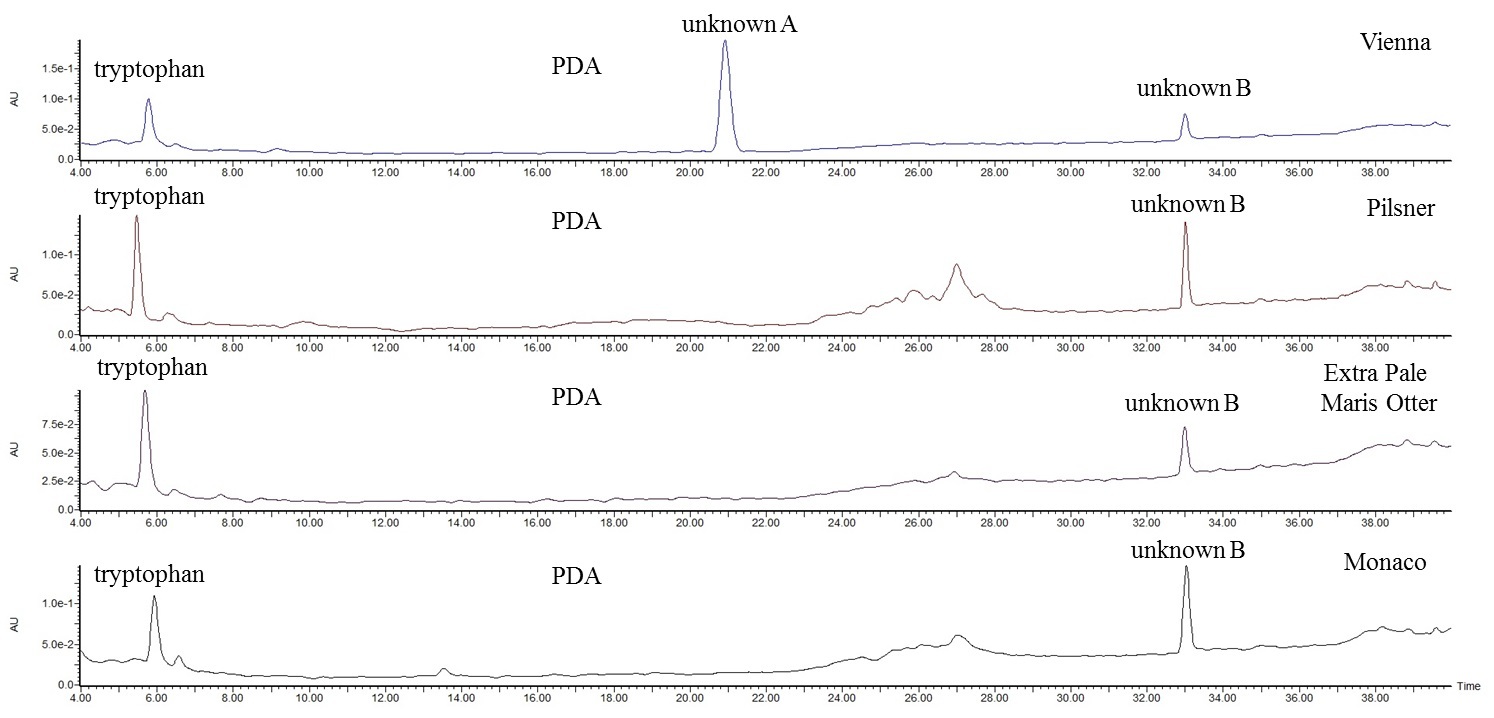 Fig. 5.
HPLC-PDA-ESI-MS/MS analysis of BSG. PDA chromatograms of the aqueous extracts of threshes from Monaco, Extra Pale Maris Otter, Pilsner and Vienna malt, from bottom to top, respectively, diluted 1:10 (v:v) with mobile phase (A:B, 95:5, v:v).
Immediately a poor of peaks chromatogram catches the eye, suggesting that the
matrix might contain a few polar molecules (water is the extraction solvent), or
very low content of compounds (soft dilution 1:10), or molecules with no
absorption in the UV-vis range (200–800 nm), or molecules not suitable for the
ESI mass spectral analysis because of the absence of moieties able to be
deprotonated or to be protonated (a very similar pattern is in fact observed in
the ES- and ES+ full scan chromatograms, even less abundant). However, all the
chromatograms are characterized by a peak at low retention time (t
Tryptophan and the phenolic profile were investigated by the Selected Ion Recording (SIR) mode, that is a highly selective and sensitive technique, and quantitation of each detected compound was carried by using the corresponding calibration curve, calculated with equal-weighted least-squares linear regression analysis of the SIR peak area against the standard nominal concentration, as previously reported [36, 37, 38, 39]. Results are resumed in Table 5 (Ref. [37, 38, 39]).
| Compound | t |
[M-H] |
Pilsner, T ( |
Pilsner, M ( |
Monaco, T ( |
Monaco, M ( |
Vienna, T ( |
Vienna, M ( |
E. P. Maris Otter, T ( |
E. P. Maris Otter, M ( |
|---|---|---|---|---|---|---|---|---|---|---|
| GA | 3.05 | 169 | nd | nd | 0.37 |
nd | nd | nd | 0.36 |
nd |
| TP | 5.25 | 203 | 67.90 |
319.74 |
75.35 |
82.16 |
69.98 |
161.65 |
62.33 |
156.84 |
| 3,5DHBA | 4.61 | 153 | nd | nd | nd | nd | nd | nd | nd | nd |
| PCA | 5.07 | 153 | 0.83 |
nd | nd | |||||
| 5CQA | 6.79 | 353 | nd | nd | nd | nd | nd | nd | nd | nd |
| 2,5DHBA | 6.95 | 153 | nd | nd | nd | nd | nd | nd | nd | nd |
| Cat | 7.32 | 289 | 1.13 |
5.44 |
2.92 |
5.51 |
2.37 |
5.06 |
4.24 |
12.83 |
| 4CQA | 7.14 | 353 | nd | nd | nd | nd | nd | nd | nd | nd |
| pHBA | 7.69 | 137 | 0.57 |
0.95 |
0.84 |
0.66 |
1.00 |
nd | 0.25 |
0.98 |
| 3FQA * | 7.77 | 367 | 0.55 |
nd | 0.24 |
0.67 |
nd | 0.14 | ||
| VA | 9.00 | 167 | 0.63 |
1.37 |
0.86 |
1.02 |
0.76 |
1.34 |
0.49 |
0.70 |
| CA | 9.34 | 179 | nd | nd | nd | nd | nd | nd | nd | nd |
| SyA | 9.47 | 197 | nd | 0.22 |
nd | nd | nd | nd | ||
| mHBA | 10.66 | 137 | nd | nd | nd | nd | nd | nd | nd | |
| 2,6DHBA | 10.88 | 153 | nd | nd | nd | nd | nd | nd | nd | nd |
| 4FQA * | 12.12 | 367 | nd | nd | nd | nd | nd | |||
| CouA | 14.05 | 163 | 2.69 |
0.48 |
1.43 |
2.70 |
1.38 | |||
| EA | 15.74 | 301 | nd | nd | nd | nd | nd | nd | nd | nd |
| SA | 15.80 | 223 | nd | 1.16 |
nd | 0.91 |
nd | 1.68 |
nd | 1.48 |
| FA | 16.04 | 193 | 0.68 |
6.18 |
1.73 |
3.66 |
nd | 8.39 |
0.79 |
10.23 |
| My | 16.74 | 463 | nd | nd | nd | nd | nd | nd | nd | nd |
| Ru | 16.83 | 609 | nd | nd | nd | nd | nd | nd | nd | nd |
| Q3G | 17.75 | 463 | nd | nd | nd | nd | nd | nd | nd | nd |
| K3R | 20.07 | 593 | nd | nd | nd | nd | nd | nd | nd | |
| SaA | 20.40 | 137 | nd | nd | nd | nd | nd | |||
| He | 23.61 | 609 | nd | nd | nd | nd | nd | nd | nd | nd |
| Q | 27.60 | 301 | nd | nd | nd | nd | nd | nd | ||
| K | 30.23 | 285 | nd | nd | nd | nd | nd | nd | nd | nd |
| IsoX | 32.70 | 353 | nd | nd | nd | nd | nd | nd | nd | nd |
| X | 38.04 | 353 | nd | nd | nd | nd | nd | nd | nd | nd |
| t | ||||||||||
Tryptophan is found the most abundant metabolite in threshes, with a content in
the range 62.33–75.35
Last, tryptophan is chromatographically eluted under the used conditions, differently from the other amino acids and from the organic acids, and this might be an advantage to take in mind for future recovery strategies from the waste. Taking into account the main role of tryptophan in the metabolic pathways leading to many important biologically active molecules as serotonin, melatonin and vitamin B3 [31, 32, 33, 34, 35], these novel results encourage further studies for the selective recovery of free tryptophan from brewing by-products for a wide choice of applications, mainly in nutraceutical and pharmacological field.
The phenolic profile of threshes resulted quite poor, from both qualitative and quantitative point of view, as shown in Table 5: less than half among the searched compounds was detected.
Catechin resulted the second representative compound of threshes, after
tryptophan, the content ranging between 1.13 and 4.24
Ferulic acid FA was found as the third representative compound (range 0.68–1.73
Amounts
Conversely, most of phenolic compounds herein investigated, and generally not reported in the literature for BSG, were not detected in any threshes samples, namely the hydroxybenzoic acids 3,5DHBA, 2,5DHBA, 2,6DHBA, the hydroxycinnamic acids and quinic esters CA, 5CQA, 4CQA and SA, EA, most of flavonoids My, Ru, Q3G, K3R, He, K.
The absence of the prenylflavonoids X and IsoX, typical of beer, was expected because they come from hops. A very few other compounds were detected in low amount or under LOQ [37, 38, 39].
The analysis of malts evidenced a quite similar phenolic profile, in which in general Cat and FA are the most abundant, followed by CouA, VA and SA, besides tryptophan, whose higher content is confirmed also in the starting malt.
Noteworthy, the same results were obtained also after 2 hours extraction, suggesting that 1 hour is sufficient for a good extraction of metabolites.
If the phenolic profile of threshes appears quite definite from a qualitative point of view, differences among the samples, regarding the individual phenolic content, were well evidenced by the ANOVA test (Table 5, lowercase letters for the analysis among threshes). Differences among malt samples were also confirmed (Table 5, capital letters for the analysis among malts).
Based on the similarities occurring between threshes and the corresponding starting malt, although with an obvious decreased individual amount in threshes, residual metabolites in BSG available for a possible waste-recovery can be therefore expected, known the metabolic composition of the starting malt.
According to results reported herein, BSG can represents a good source of valuable compounds, first of all tryptophan and catechin, with satisfactory results obtained through a simple, fast, cheap and eco-friendly handling of the by-product.
In Table 6, for completeness, the phenolic distribution, beside tryptophan
content, in the four wort samples is also reported. Due to the liquid nature of
the matrix, the amounts are reported as
| Compound | Pilsner, W ( |
Monaco, W ( |
Vienna, W ( |
E. P. Maris Otter, W ( |
|---|---|---|---|---|
| GA | nd | nd | 45.80 |
nd |
| TP | 43771.28 |
36727.78 |
30070.28 |
31445.54 |
| 3,5DHBA | nd | nd | 26.57 |
nd |
| PCA | 17.11 |
41.51 |
||
| 5CQA | nd | nd | nd | |
| 2,5DHBA | nd | nd | 38.10 |
nd |
| Cat | 1838.04 |
1129.00 |
1608.78 |
1939.46 |
| 4CQA | nd | nd | nd | |
| pHBA | 116.00 |
116.85 |
214.88 |
94.10 |
| 3FQA * | 158.29 |
173.50 |
234.38 |
118.25 |
| VA | 240.79 |
111.06 |
168.42 |
123.06 |
| CA | nd | nd | nd | nd |
| SyA | 72.59 |
148.46 |
77.13 |
48.72 |
| mHBA | nd | nd | nd | nd |
| 2,6DHBA | nd | nd | nd | nd |
| 4FQA * | 32.22 |
52.61 |
43.29 |
24.11 |
| CouA | 355.28 |
755.01 |
432.02 |
168.50 |
| EA | nd | nd | nd | nd |
| SA | 267.06 |
213.74 |
286.04 |
262.66 |
| FA | 1247.25 |
1303.68 |
1184.28 |
1485.46 |
| My | nd | nd | 107.10 |
nd |
| Ru | nd | nd | nd | nd |
| Q3G | 37.24 |
nd | 70.40 |
0.74 |
| K3R | nd | nd | nd | 0.16 |
| SaA | 48.41 |
|||
| He | nd | nd | nd | nd |
| Q | nd | 31.01 |
nd | |
| K | nd | nd | nd | |
| IsoX | nd | nd | nd | nd |
| X | nd | nd | nd | nd |
| Mean
value | ||||
Interesting to note, such a comparative study well evidenced the phenolic contribution to beer antioxidants due to malt.
A more in-depth statistical analysis was carried on the four samples sets of threshes, malt and wort, with the aim of identifying specific parameters able to ensure a rapid and accurate quality control of raw materials and beer fermentation process. Therefore, a careful evaluation of the phenolic profiles of malts, wort and threshes, resulting from HPLC-ESI-MS/MS characterization, was performed using chemometric tools.
The exploratory PCA provided scores (Fig. 6a, 6c, 6e) and loadings plots (Fig. 6b, 6d, 6f), useful to highlight samples and variables correlations, respectively. The plot of scores points out similarities and differences between samples based on the distance among each other, showing the presence of possible samples grouping. Referring to scores plots reported in Fig. 6 (a, c and e), samples belonging to the same base malts group (Vienna, Monaco, Pilsner and Extra Pale Maris Otter) were well grouped and clearly separated from the others in the space described by the first two principal components (PCs), which explained the 75% of the total variance for malts scores plot (Fig. 6a), the 69% for wort (Fig. 6c) and the 78% for threshes (Fig. 6e). Factor loadings analysis permitted to highlight contribution of each variable on the concerns PCs: differences in phenolic characteristic compounds of the four studied samples groups and differences in the chemical composition of raw and waste materials as well as products of fermentation. Relevant information can be achieved considering the loadings position in the space: in fact, the longer the vector along a specific component, the greater the statistical weight of the variables over the PC. Based on this consideration, variables responsible for malts samples differentiation according to PC-1 and PC-2 may be identified: CouA, 3FQA, VA and Cat affected more PC-1 with respect to the other parameters, while SA and FA were considered more significant in PC-2 computing (Fig. 6b).
 Fig. 6.
PCA of malt, wort and BSG. Scores plot from PCA of Malts (a), Worts (c), Threshes (e), on the left; loadings plot from PCA of Malts (b), Worts (d), Threshes (f).
Observing both scores (Fig. 6a) and loadings plot (Fig. 6b), samples located in the right side of the plot (Pilsner and Vienna) were found characterized by higher content of 3FQA, CouA and VA respect to the others. On the contrary, Extra Pale Maris Otter malts were located in the left side of the plot and showed a higher value of Cat. Moreover, FA and SA were associated to PC-2 samples distribution resulting higher in Extra Pale Maris Otter and Vienna samples respect to Pilsner and Monaco. An important consideration could be made on the TRP variable. Position of the phenolic compound in the contribution plot allowed to detect its slight but significant weight on PC-1 and thus in the sample’s differentiation according to malt base origin.
Taking into account the same approach for wort and threshes loadings plots interpretation (Fig. 6d and 6f), it was possible to observe the contribution of Cat, CouA and 3FQA in samples grouping as a function of the different chemical composition of the four studied base malts. Moreover, wort loadings plot pointed out the possibility to examine other phenolic compounds for fermentation process monitoring such as 4FQA and SyA. As well highlighted in Fig. 6d, PC-1 was found to be affected by these molecules resulting higher in wort from Monaco malt with respect to the others.
A further significant outcome of the exploratory analysis consisted in the ability to monitor malts and threshers, simultaneously. Scores plot reported in Fig. 7a showed a clear distinction of malts and threshers samples according to PC-1 (63% of explained variance). As a result of the loadings plot interpretation (Fig. 7b), CouA, SA, 3FQA, FA and VA were found to be the variables affecting most PC-1 and thus molecules responsible for samples separation, confirming the importance of this parameters in the monitoring of raw and waste materials involved in beer process production.
 Fig. 7.
PCA for malt and threshes. Resulting scores (a) and loadings (b) plot for malts and threshes.
Outcomes demonstrated the possibility to monitor a small number of molecules to ensure the quality of a final product that satisfies consumer’s request. Further, in this framework, chemometrics proved to be a valuable tool for time-saving and sensitive multiparametric chromatographic data evaluation that permitted to accurately detect characteristic parameters.
In conclusion, four samples of Brewer’s spent grain were prepared in our
laboratory by a typical mashing recipe from four base malts, chosen because used
alone (100%) or more frequently mixed with special malts for all beer
preparation. Malt spent grain (BSG, threshes) were then collected from wort,
dried and eco-friendly extracted with water for 1 hour at room temperature. The
phytochemical characterization of the aqueous extracts was carried out by the
untargeted ESI-MS/MS infusion experiments and by the targeted HPLC-PDA-ESI-MS I
SIR mode analysis for the metabolic and phenolic profile, and results compared to
those ones obtained for the four starting malts and the four wort samples. The
comparative analysis of the aqueous extracts by ESI-MS/MS infusion experiments
provided the mass spectral fingerprint of the polar fraction of BSG, not reported
before up to our knowledge, evidencing at least nine amino acids
(
The comparison with literature highlighted the satisfactory results obtained through a simple, fast, cheap and eco-friendly handling of the by-product, opening to new perspectives of application for the high amount of spent grains produced all over the world as brewery by-products.
All data generated or analyzed during this study are included in this published article.
MF, RP and AC designed the research study and wrote the manuscript. PDM and MB performed formal analysis research. PDM performed the statistical analysis. MB provided writing-revision. RR, SM and GG performed the chemometric analysis. All authors contributed to editorial changes in the manuscript. All authors read and approved the final manuscript.
Not applicable.
The authors thank Mr. Alessandro Trani for technical support.
This research was financially supported by Sapienza University of Rome (project no. RP11715C63A2EC44).
The authors declare no conflict of interest.
Publisher’s Note: IMR Press stays neutral with regard to jurisdictional claims in published maps and institutional affiliations.