
- Academic Editor
Hepatocellular carcinoma (HCC) is one of the leading causes of cancer death worldwide. The hypoxic microenvironment in HCC enhances glycolysis and co-directed lactate accumulation, which leads to increased lactylation. However, the exact biological pattern remains to be elucidated. Therefore, we sought to identify hypoxia-glycolysis-lactylation (HGL) prognosis-related signatures and validate this in vitro.
Transcriptomic data of patients with HCC were collected from The Cancer Genome Atlas (TCGA), International Cancer Genome Consortium (ICGC), and Gene Expression Omnibus (GEO) databases. Differentially expressed HGL genes between HCC and normal tissues were obtained by DEseq2. The consensus clustering algorithm was employed to stratify patients into two distinct clusters. Subsequently, the single sample Gene Set Enrichment Analysis (ssGSEA), Tumor Immune Estimation Resource (TIMER) and Tumor Immune Dysfunction and Exclusion (TIDE) algorithms were utilized to assess immune infiltration and immune evasion. Least Absolute Shrinkage and Selection Operator (LASSO) and COX regression analysis were used to identify an HGL prognosis-related signature. Based on spatial transcriptome and histological data, we analyzed the expression of these genes in HCC and explored the function of Homer Scaffold Protein 1 (HOMER1) in HCC cells.
We identified 72 differentially expressed HGL genes and two HGL clusters. Cluster2, with better survival (p < 0.001), was significantly enriched in metabolic-related pathways. The HGL prognosis-related signature exhibited great predictive efficacy for patients in TCGA, ICGC, and GSE148355 databases (3-year area under the curve (AUC) = 0.822, 0.738, and 0.707, respectively). The elevated expression of HOMER1 in HCC was revealed by the combination of spatial transcriptome and histological data. Knocking down HOMER1 significantly inhibited the malignant progression of HCC cells.
We identified a signature with great predictive efficacy and discovered a gene, HOMER1, that influences the malignant progression of HCC with the potential to become a novel therapeutic target.
Hepatocellular carcinoma (HCC) is the major histologic subtype of liver cancer, the third most common cause of cancer-related mortality worldwide [1]. At present, surgical treatment along with ablation, radiotherapy, chemotherapy, immunotherapy and targeted therapy, constitute the main form of treatment [2]. Accurate and effective classification can help to select the most suitable treatment for patients with HCC [3]. Along with the rapid development of multi-omics, the molecular characteristics along with immune and metabolic microenvironment helps to measure precise and effective treatments for patients with HCC [4, 5]. However, the independent prognostic factors for HCC are still limited.
Metabolic reprogramming is one of the hallmark features of tumors. In the process of continuous proliferation [6], invasion and metastasis, the microenvironment gradually becomes nutrient-deficient. In order to cope with the nutrient-deficient microenvironment, the tumor constantly changes its metabolic characteristics to adapt. HCC is characterized by a variety of metabolic changes: first, changes in energy metabolism occur. The hypoxic environment and tumor characteristics lead to enhanced glycolysis and lactate accumulation; increased fatty acid synthesis supports the production of cell membranes and energy storage. Amino acid metabolism is also altered, resulting in an increasing in glutamine, which plays a role in cellular energy metabolism and antioxidant responses [7].
Hypoxia is one of the common features of malignant solid tumors [8], which also promotes the malignant process of HCC. The malignant proliferation of HCC will consume an increased supply of oxygen and create a hypoxic tumor microenvironment. Hypoxia can activate the Hypoxia-Inducible Factor (HIF) signaling pathway, which is a core transcription factor in the hypoxic response. HIF sense low oxygen levels and regulate the expression of various genes, promoting the survival and proliferation of tumor cells in the hypoxic environment [9]. Hypoxia also plays a crucial role in the development of chemoradiotherapy resistance and immune evasion [9, 10, 11, 12]. As a major form of glucose metabolism, glycolysis is the primary energy source for tumor cells. It is also key in driving malignant proliferation, invasion, metastasis, and drug resistance in HCC [7, 10, 11, 12, 13]. These processes interact with each other and collectively play an important role in the progression of HCC.
Hypoxia promotes glycolysis which produces lactate, which is the substrate for lactylation. It is a new form of protein post-transcriptional modification, which regulates the proteins by covalently coupling lactyl to lysine residues. The lactylation of histones can affect the binding ability of histones to DNA and alter the structure and function of chromatin. In the past two years, a growing body of research has begun to reveal the link between lactylation and tumor progression. It plays an important role in regulating DNA damage repair pathways, thus affecting the formation of chemoradiotherapy resistance [14, 15]. It also has been reported that lactylation can promote the proliferation and metastasis of HCC [16]. Employing hypoxia, glycolysis, or lactylation genesets alone to predict survival in hepatocellular carcinoma has been reported [12, 17, 18]. However, considering the relevance of three metabolic processes, it is worth exploring whether combining genesets could make more accurate predictions for HCC patients.
HOMER1 (also known as Homer Scaffold Protein 1) is a protein that is mainly expressed in the nervous system [19] and belongs to the Homer protein family. HOMER1 regulates a variety of signaling pathways in cells, including calcium signaling, G protein-coupled receptor signaling, and N-Methyl-D-Aspartate receptor function, mainly by interacting with other proteins. Recent studies have found that HOMER1 not only plays an important role in the nervous system, but also is closely related to the occurrence and development of tumors [20, 21]. HOMER1 has also been reported to be associated with HCC tumorigenesis and maybe a potential therapeutic target for HCC.
In this study, we divided HCC patients into two clusters based on the hypoxia-glycolysis-lactylation (HGL) gene set. Based on the two clusters of differentially expressed genes, we identified a signature with great predictive power and also found a malignant target gene, HOMER1. We have verified that the expression of HOMER1 is elevated in HCC by a combination of spatial transcriptome and histological data. Cell assays have revealed that it can affect the malignant progression of HCC.
Transcriptomic data and clinical information of HCC patients were obtained from
TCGA-LIHC (The Cancer Genome Atlas database-Liver Hepatocellular Carcinoma, n =
370; https://www.cancer.gov/ccg/research/genome-sequencing/tcga), the
International Cancer Genome Consortium (ICGC-LIHC, n = 232), which were
downloaded from UCSC XENA (https://xenabrowser.net/). GSE148355 (n = 52) was
derived from the Gene Expression Omnibus (GEO) database
(https://www.ncbi.nlm.nih.gov/geo/). Hypoxia and glycolysis-related gene sets
were obtained from the Molecular Signature Database (GSEA
The hypoxia, glycolysis and lactylation genesets were derived from a previously
published study [17] and the Molecular Signature Database (GSEA
Employing univariate COX analysis, prognostic HGL genes were obtained, then Kyoto Encyclopedia of Genes and Genomes (KEGG, https://www.genome.jp/kegg/), Gene Ontology (GO, https://www.geneontology.org/), Gene Set Enrichment Analysis (GSEA, https://www.gsea-msigdb.org/gsea/index.jsp) enrichment analysis were performed.
The TCGA-LIHC patients were divided into two clusters with prognostic HGL genes using the ‘CancerSubtypes’ R package (https://github.com/taoshengxu/CancerSubtypes, v.1.24.0).
To compare the immune microenvironment between the two clusters, we predicted differences in infiltration of 6 immune cells using the Tumor Immune Estimation Resource (TIMER) algorithm (http://cistrome.org/TIMER/). The difference of immune function was predicted by the ‘GSVA’ R package (https://github.com/rcastelo/GSVA, v1.46.0) [23]. The immune evasion ability of the two clusters was evaluated by the Tumor Immune Dysfunction and Exclusion (TIDE) algorithm (http://tide.dfci.harvard.edu/).
To assess the guiding potential of HGL clustering for clinical drug use, we measured the ‘PRROPHETIC’ R package (https://github.com/paulgeeleher/pRRophetic, v0.5) to predict IC50 values for each drug and compared differences between the two clusters for commonly used drugs in HCC.
We obtained DEGs between 2 clusters with the ‘Limma’ R package
(https://www.bioconductor.org/packages/release/bioc/html/limma.html, v3.54.2),
the criteria were
We explored the association between the HGL signature (HGLs) and clinical features, finding that HGLs had an independent ability to predict patients’ outcomes by K-M analysis.
A total of 8 pairs of HCC adjacent and tumor tissues were obtained from the Xiangya Hospital, Central South University. The Central South University Xiangya Hospital Ethics Committee approved this study. All patients or their families/legal guardians obtained their informed consent to use their materials. The patient’s clinical information is presented in Supplementary Table 1.
The tissue samples from patients were cryogenically ground, followed by RNA
extraction using the TRIZOL reagent (ET101-01-V2, Transcript®,
Beijing, China). The extracted RNA was then reverse transcribed into cDNA using
the reverse transcription kit (E047-01B, NovoScript®, Suzhou,
China). Finally, the PCR reaction system mixed with primers and cDNA was
prepared. Primers used are listed in Supplementary Table 2. To calculate
the relative expression of HOMER1, we used
Tissue or cell lysates were prepared using lysis buffer and protein
concentrations were measured. The protein was separated by SDS-PAGE and
transferred to a nitrocellulose membrane. The membrane was blocked with 5% milk,
followed by incubation with the primary antibody overnight at 4 °C.
After washing with Tris-Borate-Sodium Tween-20 (TBST) buffer, the membrane was
incubated with the secondary antibody for 2 hours. Protein was visualized using
chemiluminescent detection. Antibodies used were as follows: HOMER1 (1:1000,
db12743, Diagbio, Hangzhou, China),
LM3 and Hep3B in this study were purchased from BDBIO (Zhejiang, China). The two types of cells have been successfully authenticated by STR profiling and have passed mycoplasma testing. They were cultured in DMEM medium (10% FBS) under 5% CO2 at 37 °C.
According to the knocking down of HOMER1, Hep3B and LM3 cell lines were transfected with lipofectamine 2000 following the manufacturer’s instructions. All small interfering RNA (siRNA) fragments were designed and synthesized by Gene Pharma (Shanghai, China); and are listed in Supplementary Table 3.
After knocking down HOMER1 in Hep3B and LM3 cells as mentioned above, they were
incubated for 72 hours. Then the cells were digested and collected in a cell
suspension, and washed with PBS. The cells were fixed by incubating with 70%
ethanol for 12 hours. After removing the ethanol, the cells were permeabilized
using 0.1% Nonidet P-40 (NP-40) (N8030, Solarbio®, Beijing, China). Finally, the cells were stained with propidium
iodide for 30 minutes (The propidium iodide solution is prepared by combining 3
mL of staining buffer, 150 µL of 20
Hep3B and LM3 cells were seeded in 6 cm dishes, and transfected with a mixture
of 2 µL of lipofectamine 2000, 200 µL of Opti-MEM, and
3 µL of siHOMER1 to knock down the expression of HOMER1 in both cell
lines; subsequently 1
After transfected with HOMER1 siRNA or random control, 500 cells were seeded into six-well plates, and 10 days later fixed with 4% paraformaldehyde (G1101, Servicebio, Wuhan, China) and stained with crystal violet solution. The statistical results were analyzed by ImageJ.
We used a 24-hole Transwell chamber (Transwell, Corning Costar, Corning, NY,
USA). For migration assays, 2
We obtained 149 HGL-DEGs between tumor and normal tissues (Fig. 1A,B). Univariate COX regression showed that 72 genes were significantly associated with the prognosis of HCC. The GO and KEGG enrichment analyses revealed that prognostic-associated HGL genes were associated with metabolism-related pathways, including glycolysis, the HIF-1 signaling pathway, and organic acid catabolic and carboxylic acid catabolic processes (Fig. 1C,D). It reveals that both hypoxia, glycolysis and lactylation effect the prognosis of HCC.
 Fig. 1.
HGL associate genes differentially expressed in TCGA-LIHC. (A) The volcano plot showing the HGL-DEGs between tumor and normal samples in TCGA dataset. (B) Heatmap showing top 30 DEGs. (C) The bar plot of KEGG enrichment pathway of prognostic-associated HGL genes. (D) GO enrichment analysis bubble plot. HGL, hypoxia-glycolysis-lactylation; TCGA-LIHC, The Cancer Genome Atlas database-Liver Hepatocellular Carcinoma; DEGs, differentially expressed genes; KEGG, Kyoto Encyclopedia of Genes and Genomes; GO, Gene Ontology; NS, no significance.
Based on the prognostic-associated HGL genes, we conducted a consensus
clustering algorithm on the TCGA-LIHC dataset to further investigate the effect
of HGL on HCC. When K = 2, we obtained the appropriate clustering result (Fig. 2A). Principal component analysis (PCA) also displayed that the two clusters were
separated visibly (Fig. 2B). K-M curves revealed that patients in cluster1 had
better median survival time than those in cluster2 (Fig. 2C, p
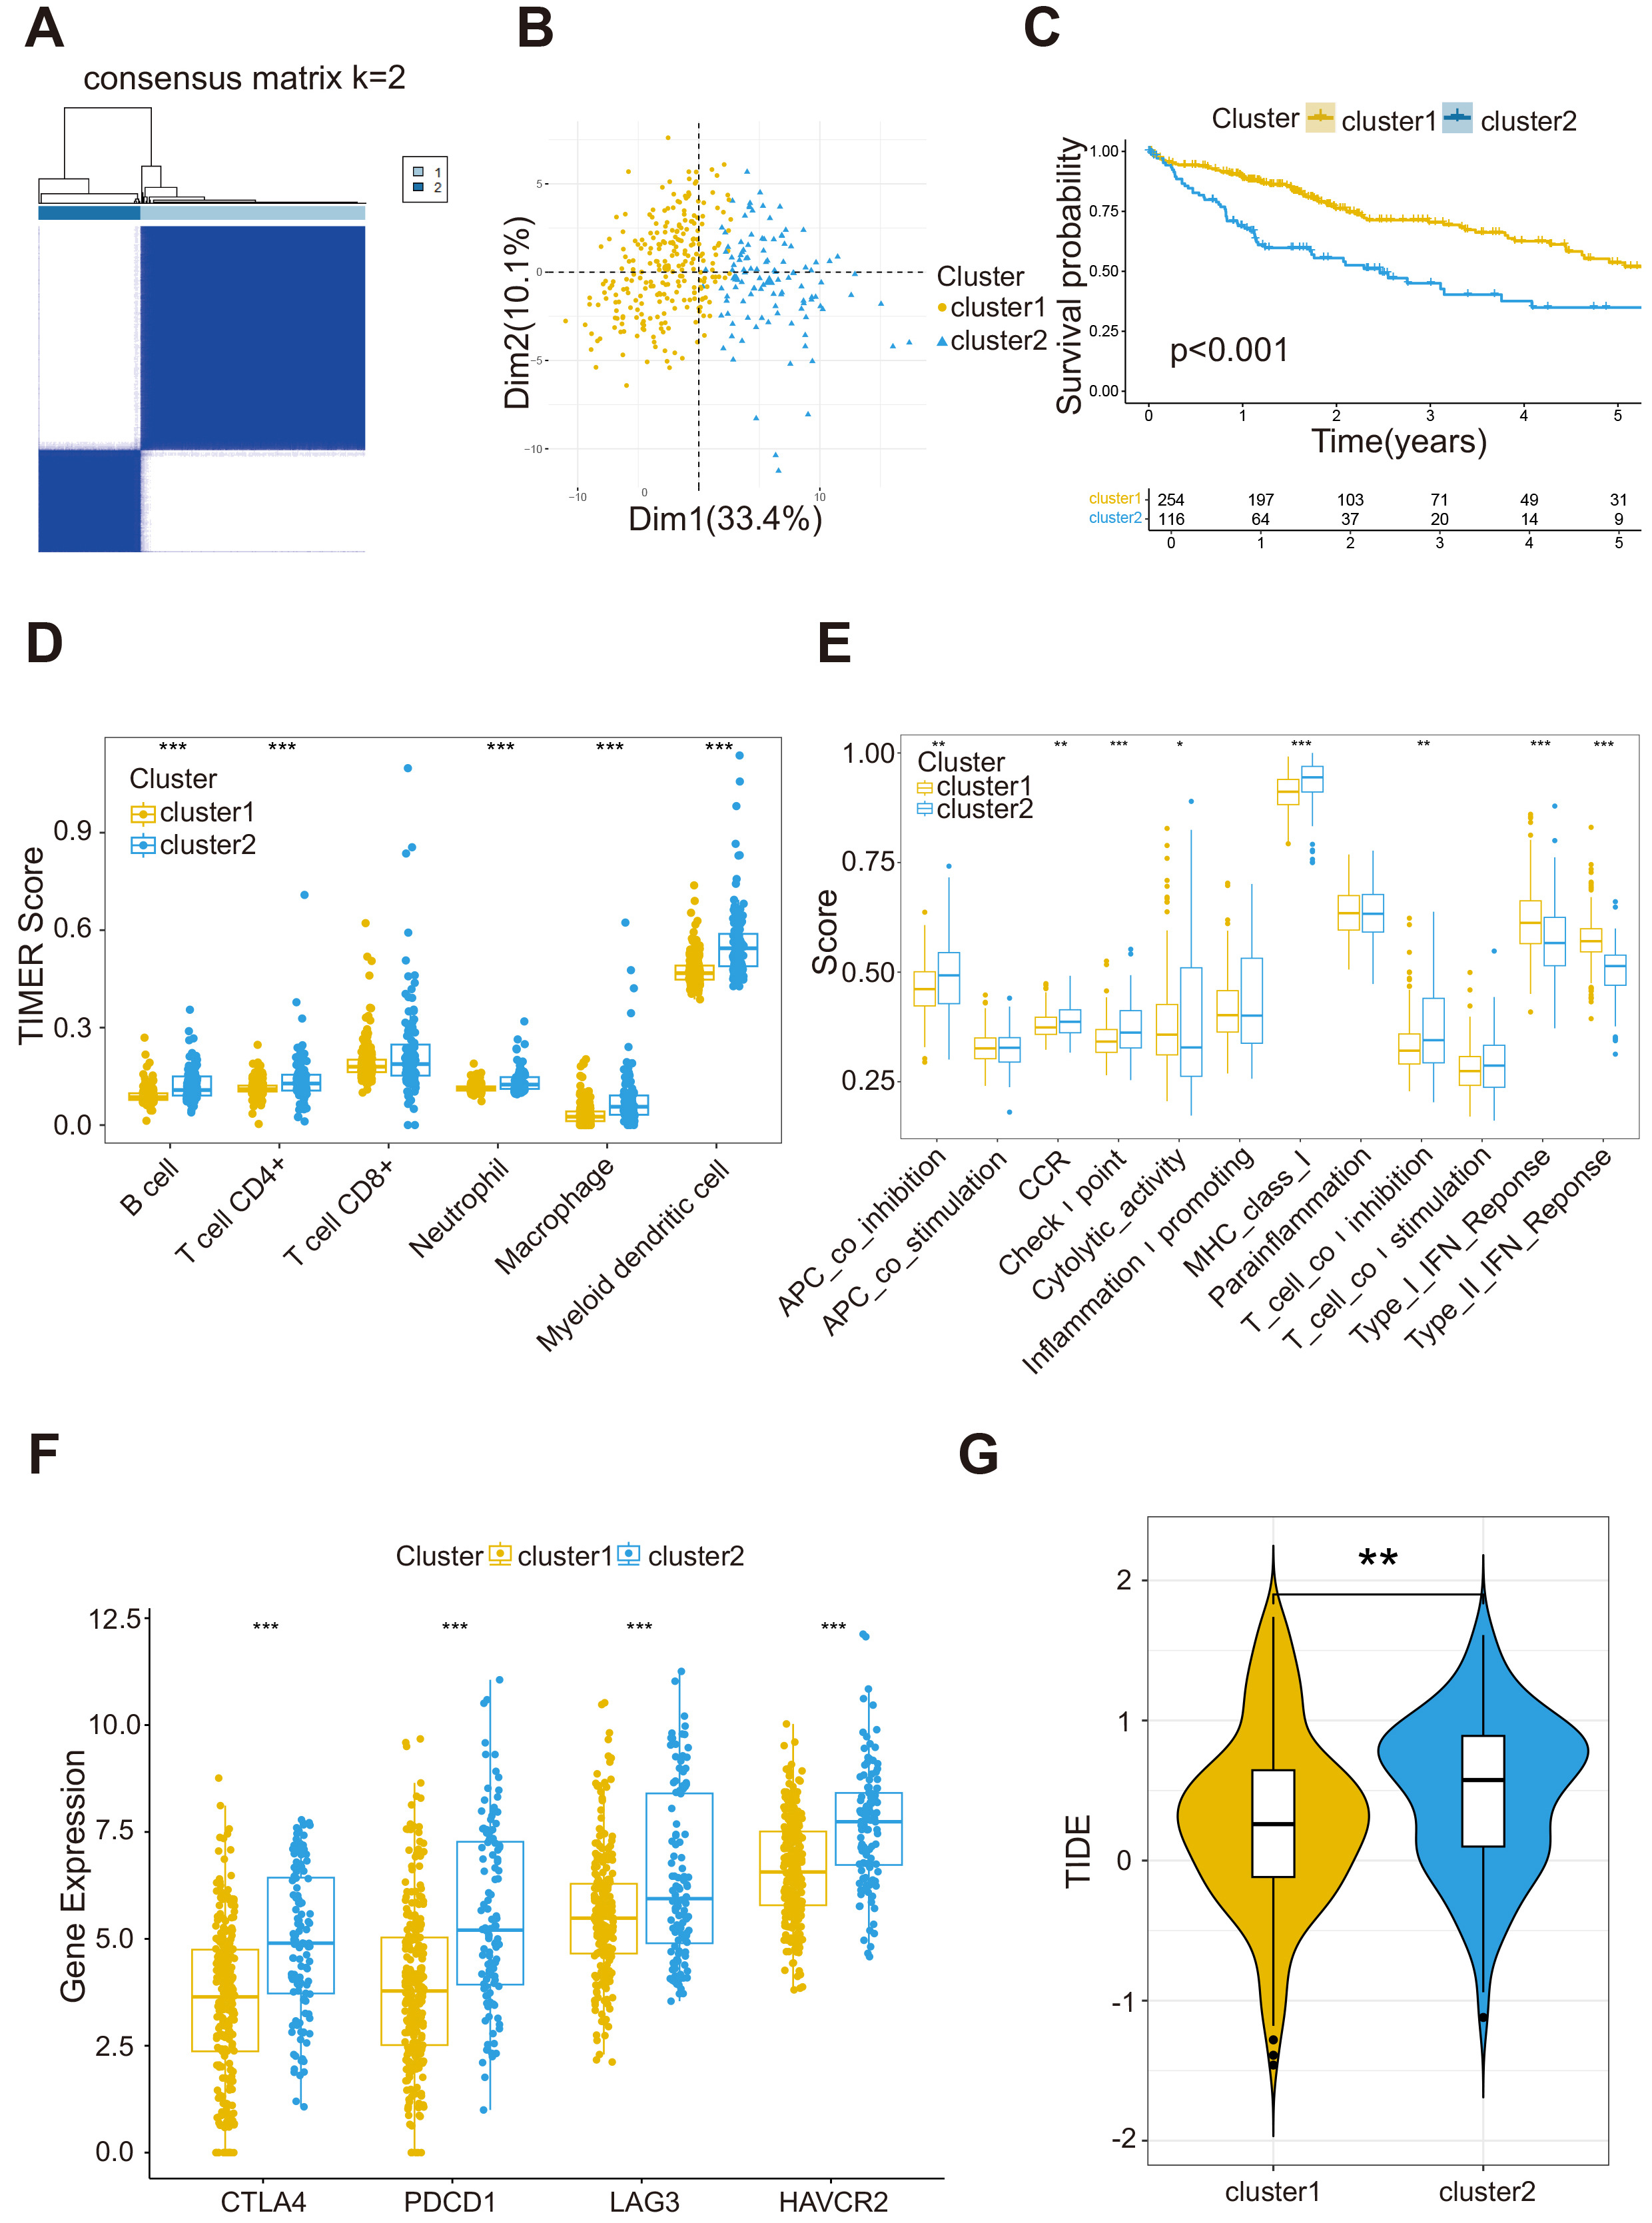 Fig. 2.
HGL clusters based on consensus clustering. (A) Consensus
clustering divides 370 patients in TCGA dataset into two distinct clusters. (B)
PCA analysis shows that the two clusters of patients are significantly segmented.
(C) Kaplan-Meier (K-M) curve analysis of cluster1 and cluster2. (D) Infiltration
differences of six immune cells between cluster1 and cluster2. (E) The levels of
immune function of the two HGL clusters. (F) The immune checkpoint receptor genes
are highly expressed in cluster2. (G) Cluster2 has higher TIDE score. Statistical
significance was denoted as follows. *p
There were variances in immune cells between the two clusters (Fig. 2D). The
check-point function of cluster2 was significantly higher than that of cluster1
(Fig. 2E, p
Chemotherapy and immunotherapy are both important therapeutic methods for HCC.
After IC50 prediction of chemotherapeutic drugs, we found that patients in
cluster1 were more sensitive to sorafenib than patients in cluster2 (p
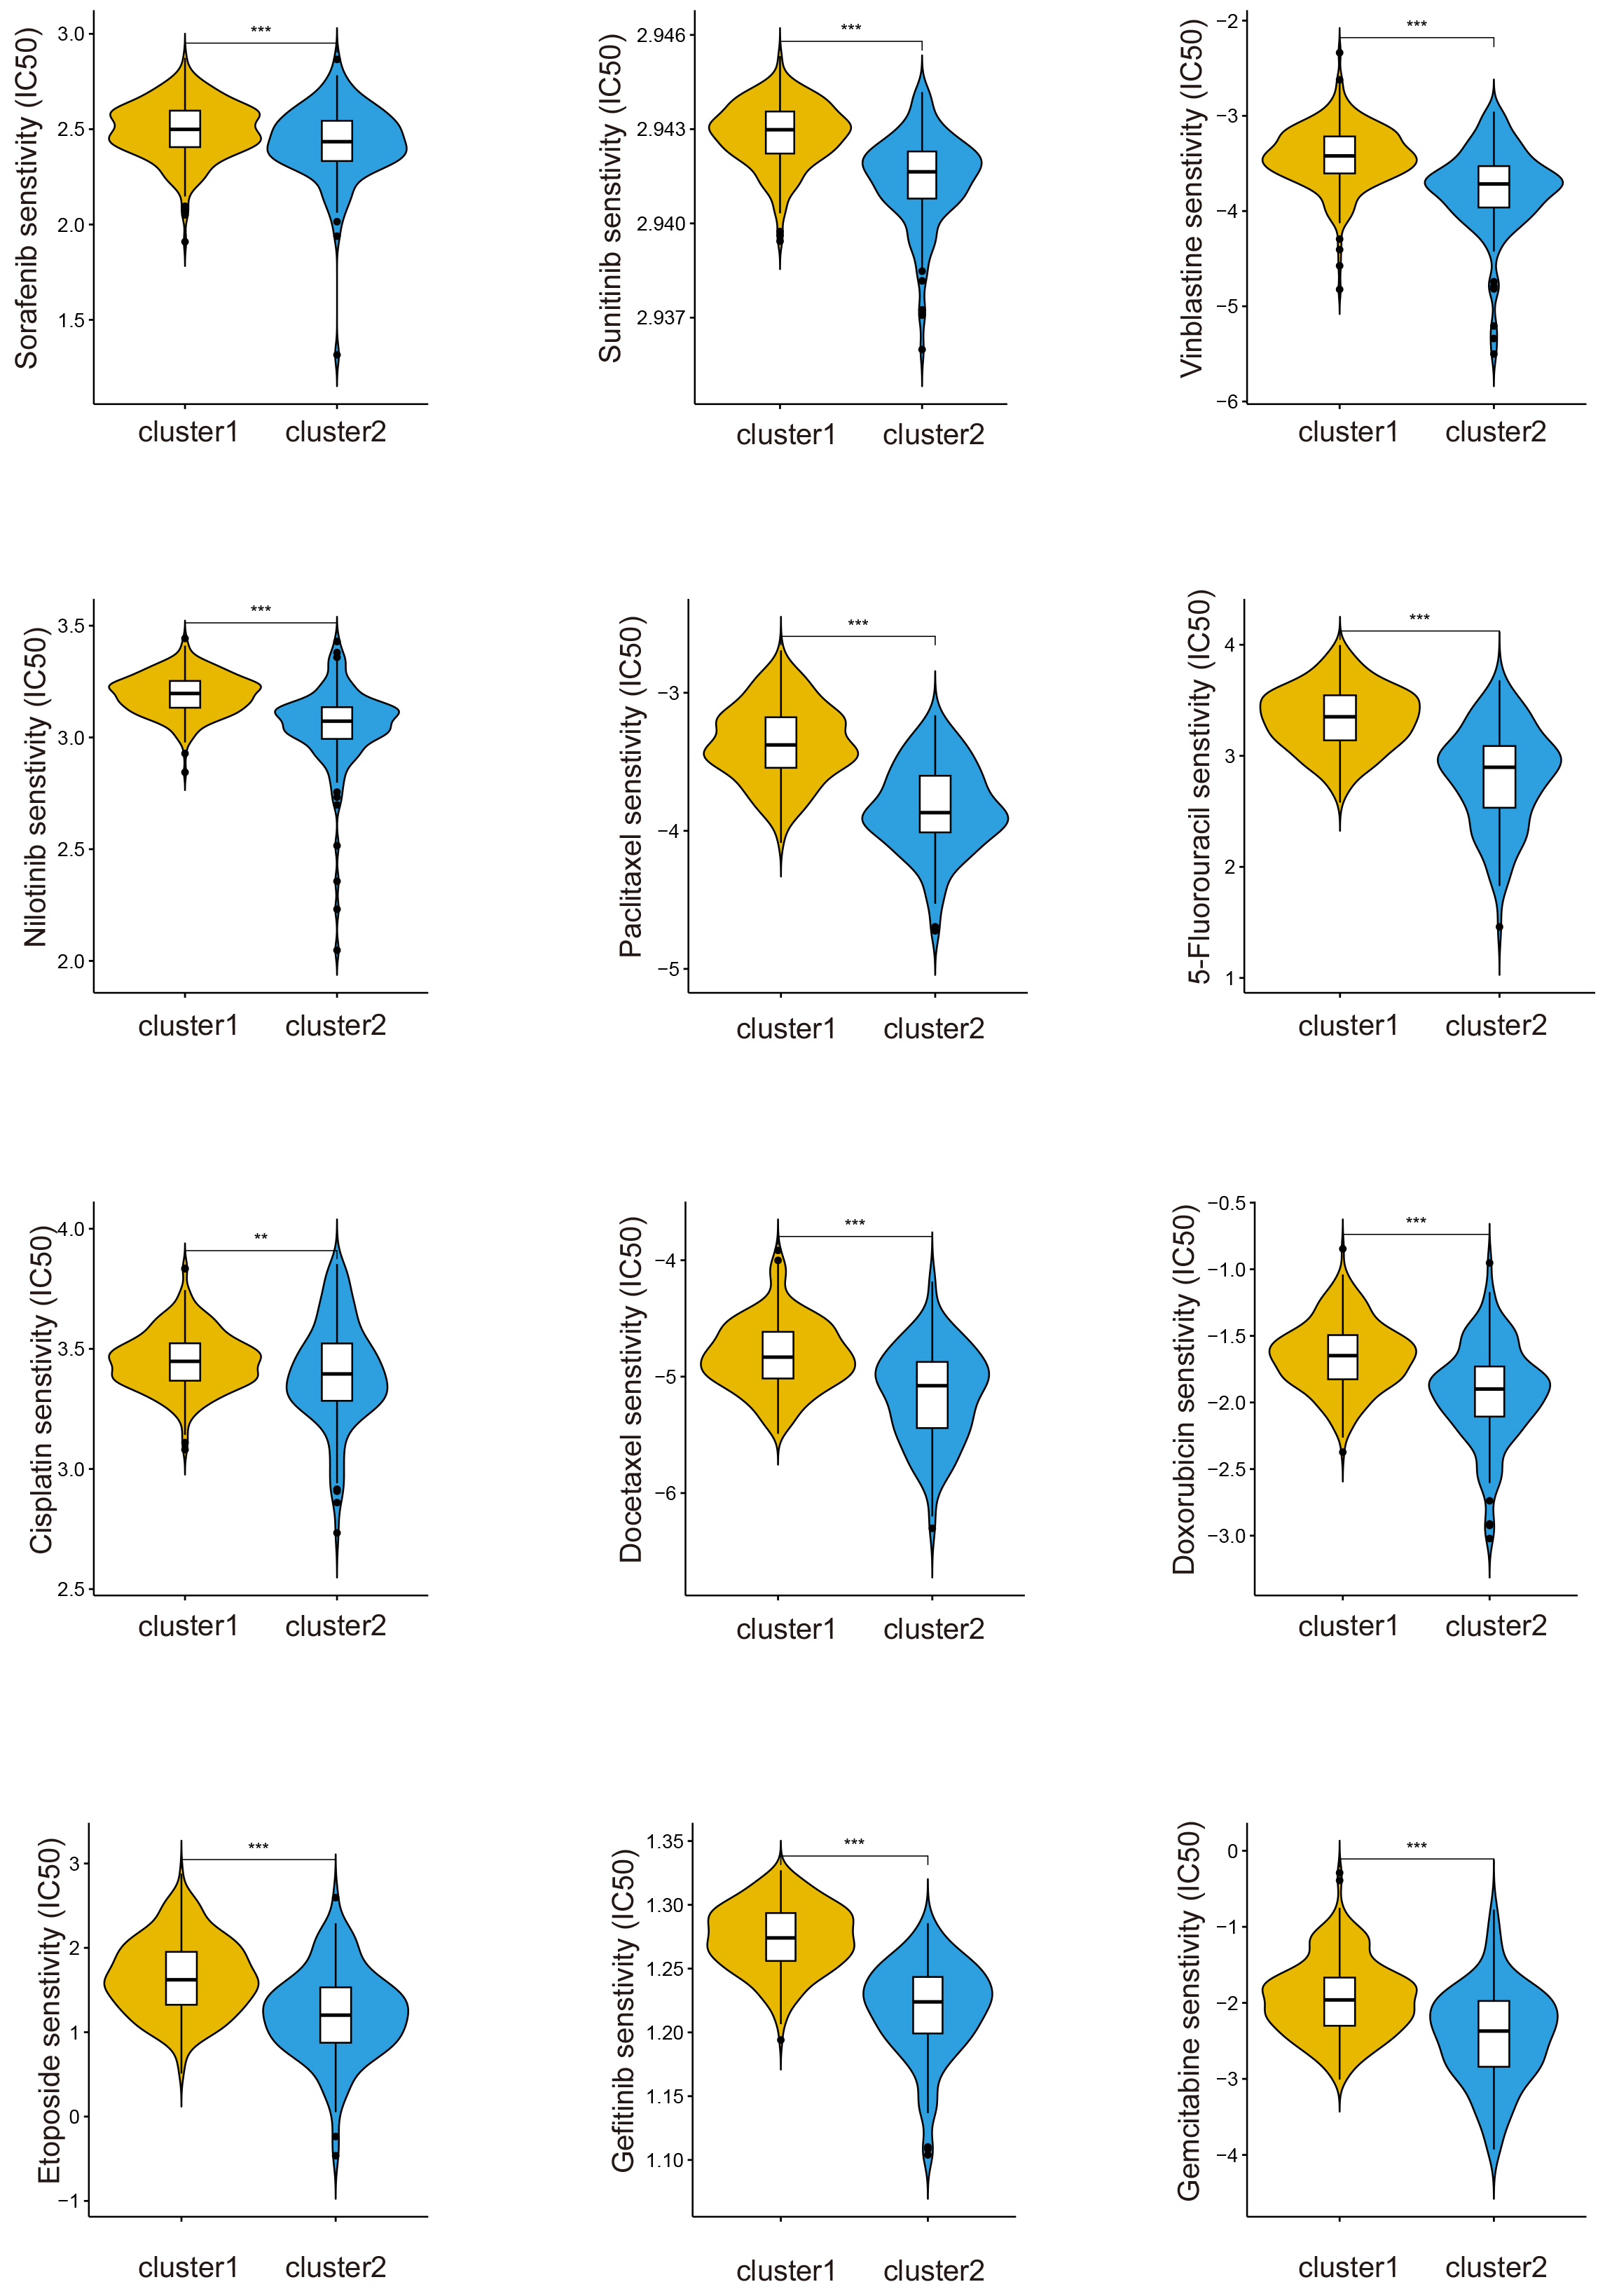 Fig. 3.
The drug sensitivity of cluster1 is better than cluster2.
**p
We performed differential analysis between the two clusters, and after
conducting univariate COX regression analysis on the differentially expressed
genes, we finally identified these 123 survival-related differential genes (Fig. 4A). Using LASSO and multivariate COX regression, we acquired 13 genes to
construct the signature (Supplementary Fig. 2A). The riskScore
calculation was as follows: riskScore = (0.20233
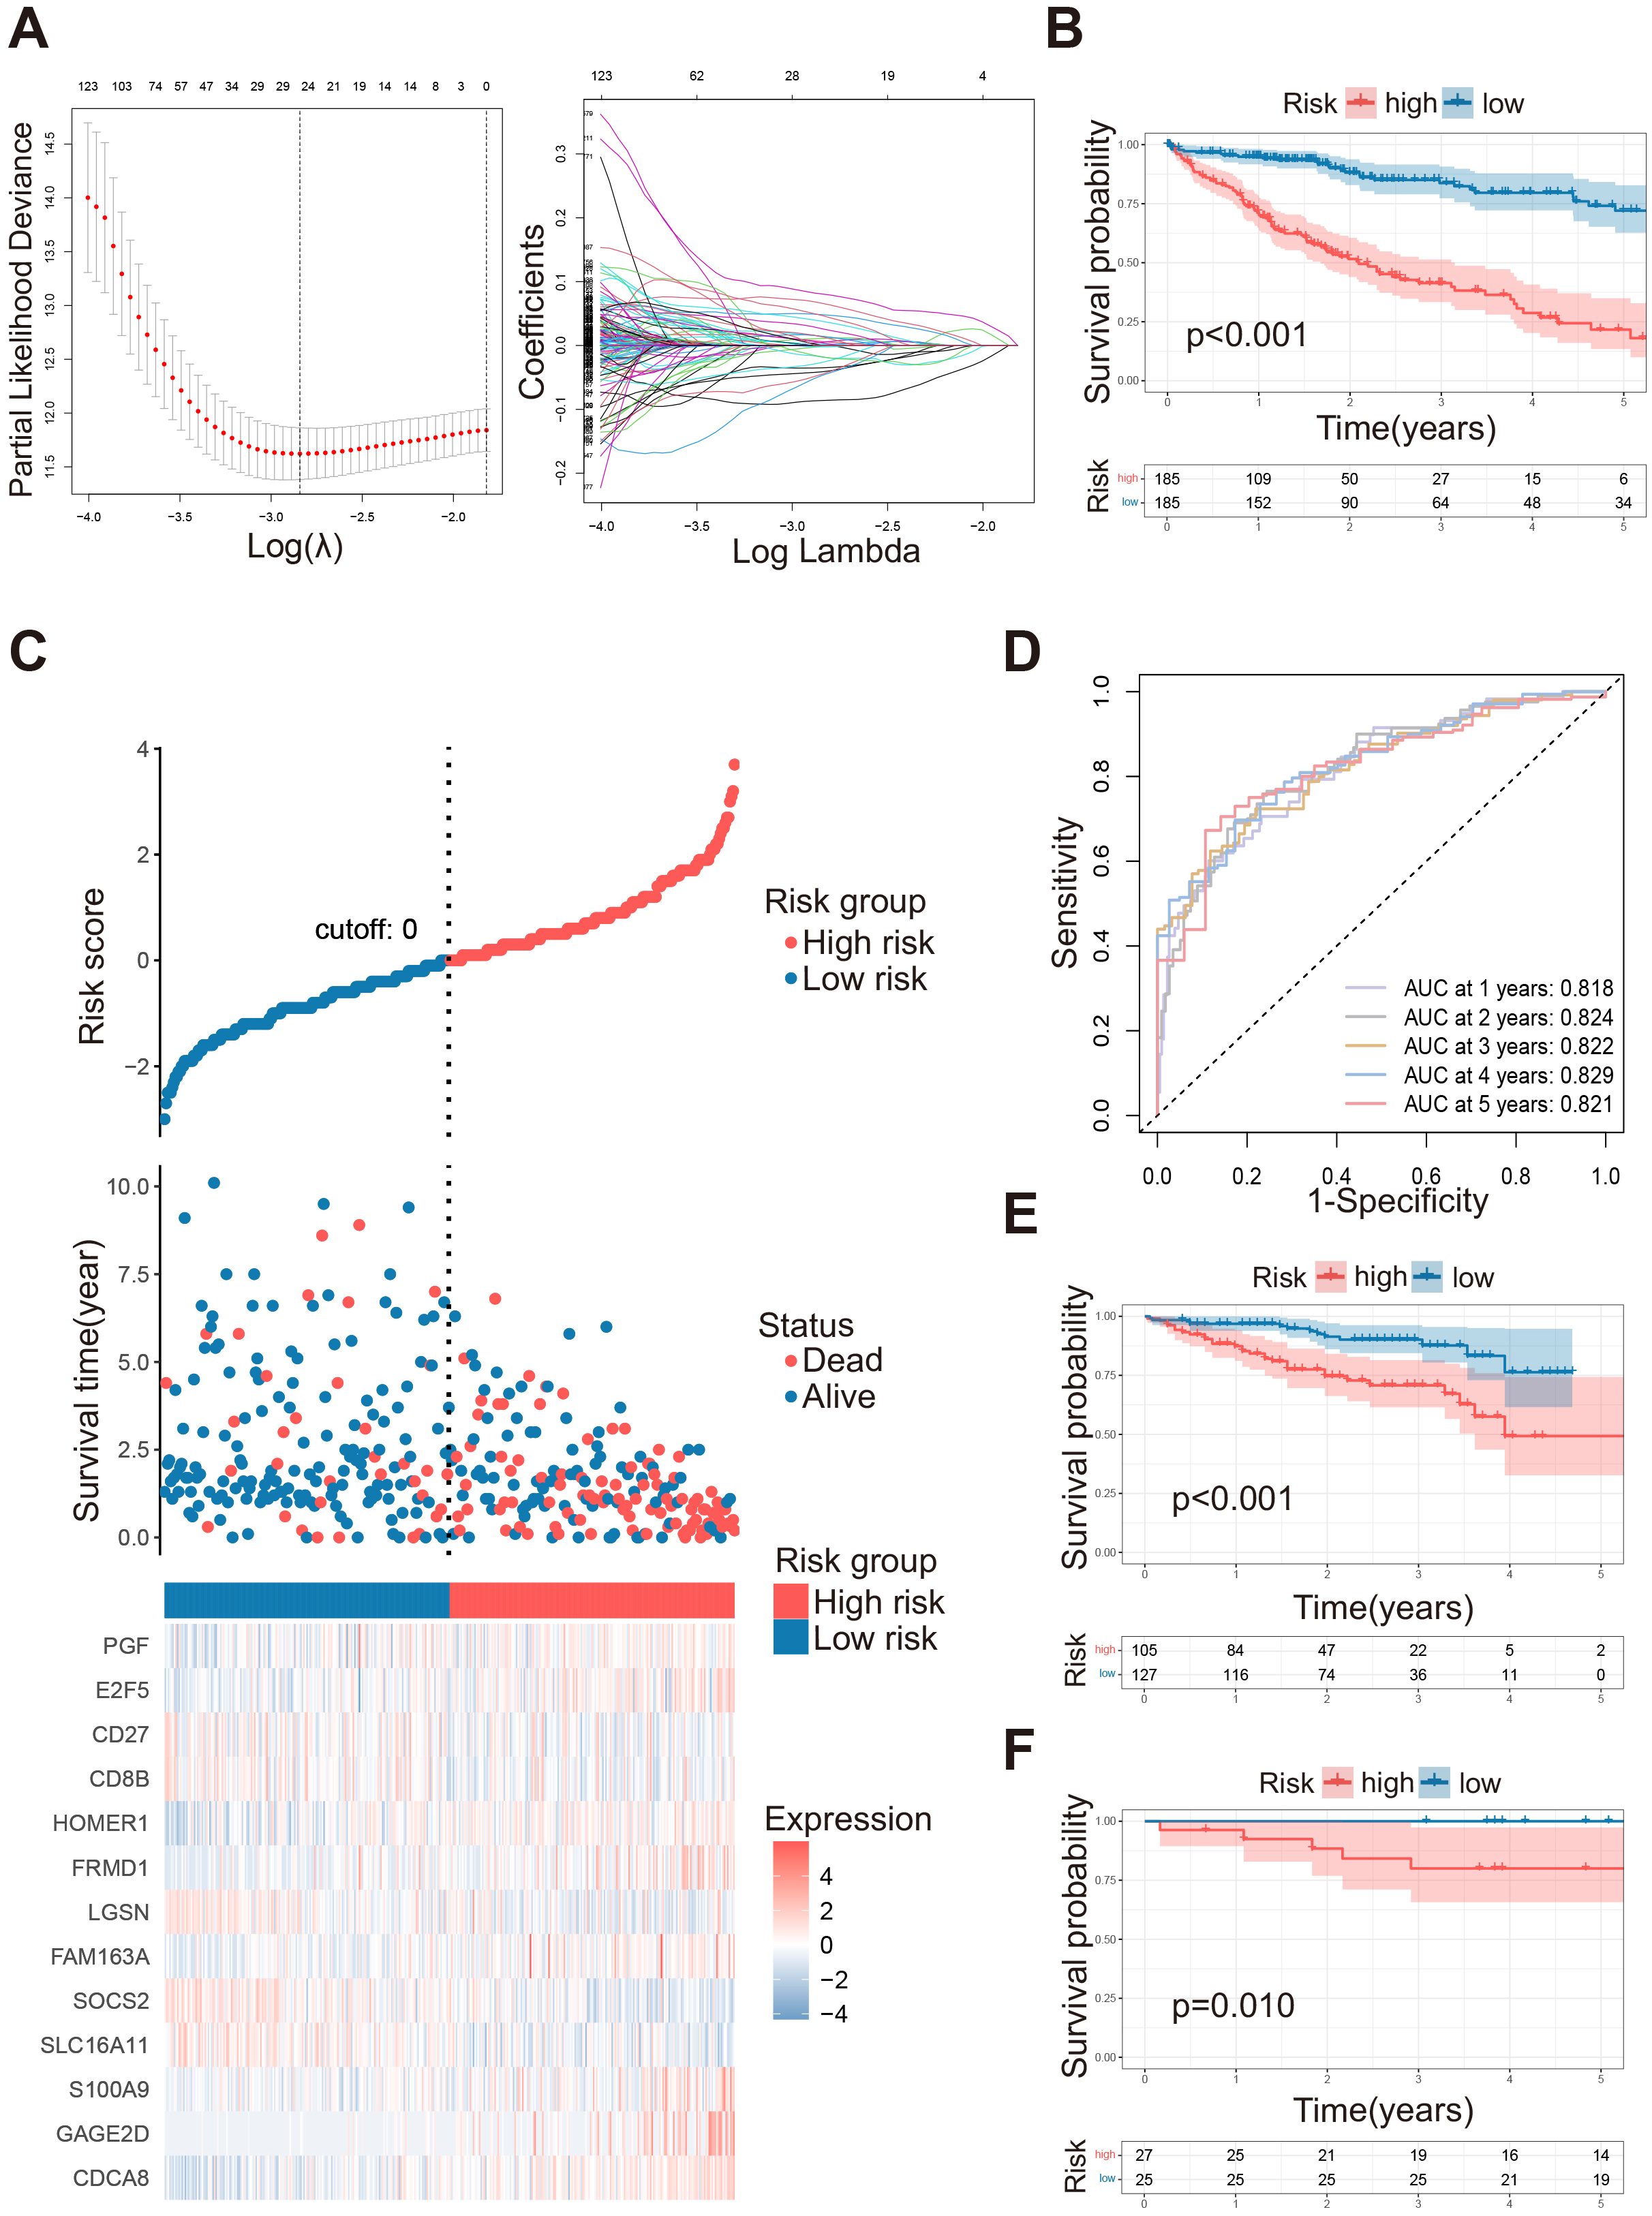 Fig. 4.
Construction of HGL signature in LIHC. (A) Parameter selection for LASSO. (B) Kaplan-Meier survival curve analysis between high risk and low risk groups in TCGA-LIHC datasets. (C) Risk curves: overall survival status, and the heatmap of the expression of 13 HGL signature associate genes. The dotted line represents the division of the median. (D) ROC curves of the 1–5 years survival rates of TCGA-LIHC dataset. (E) Kaplan-Meier survival curve analysis between high risk and low risk groups in ICGC-LIHC datasets. (F) Kaplan-Meier survival curve analysis between high risk and low risk groups in GSE148355 datasets. LASSO, Least Absolute Shrinkage and Selection Operator; ROC, receiver operating characteristic.
The patients in the TCGA training set were divided into a high-risk group (N =
185) and low-risk group (N = 185) based on the riskScore, while the OS of the
low-risk group was significantly better than the high-risk group (Fig. 4B,
p
To further validate the predictive effectiveness of the signature, we grouped
the ICGC and the GSE148355 together, since the validation set was similar: ICGC
high-risk group (N = 105), ICGC low-risk group (N = 127), and GSE148355 high-risk
group (N = 27), low-risk group (N = 25). Patients in the low-risk group still had
significantly better OS than those in the high-risk group (Fig. 4E,F, p
HGL signature exhibits predictive power, thus we desired to explore whether it
can be used as an independent prognostic factor for HCC patients. Age, gender,
alpha-fetoprotein level (AFP), microvascular invasion (MVI), and pathological
stage were crucial factors affecting the prognosis of HCC patients, riskScore
could also accurately predict the prognosis. In the K-M curve, patients in
different ages, different sex, and in different pathological stages, with
different expression of AFP, whether with microvascular invasion or not, showed a
significant variance in OS between the high and low risk group (Fig. 5A,
p
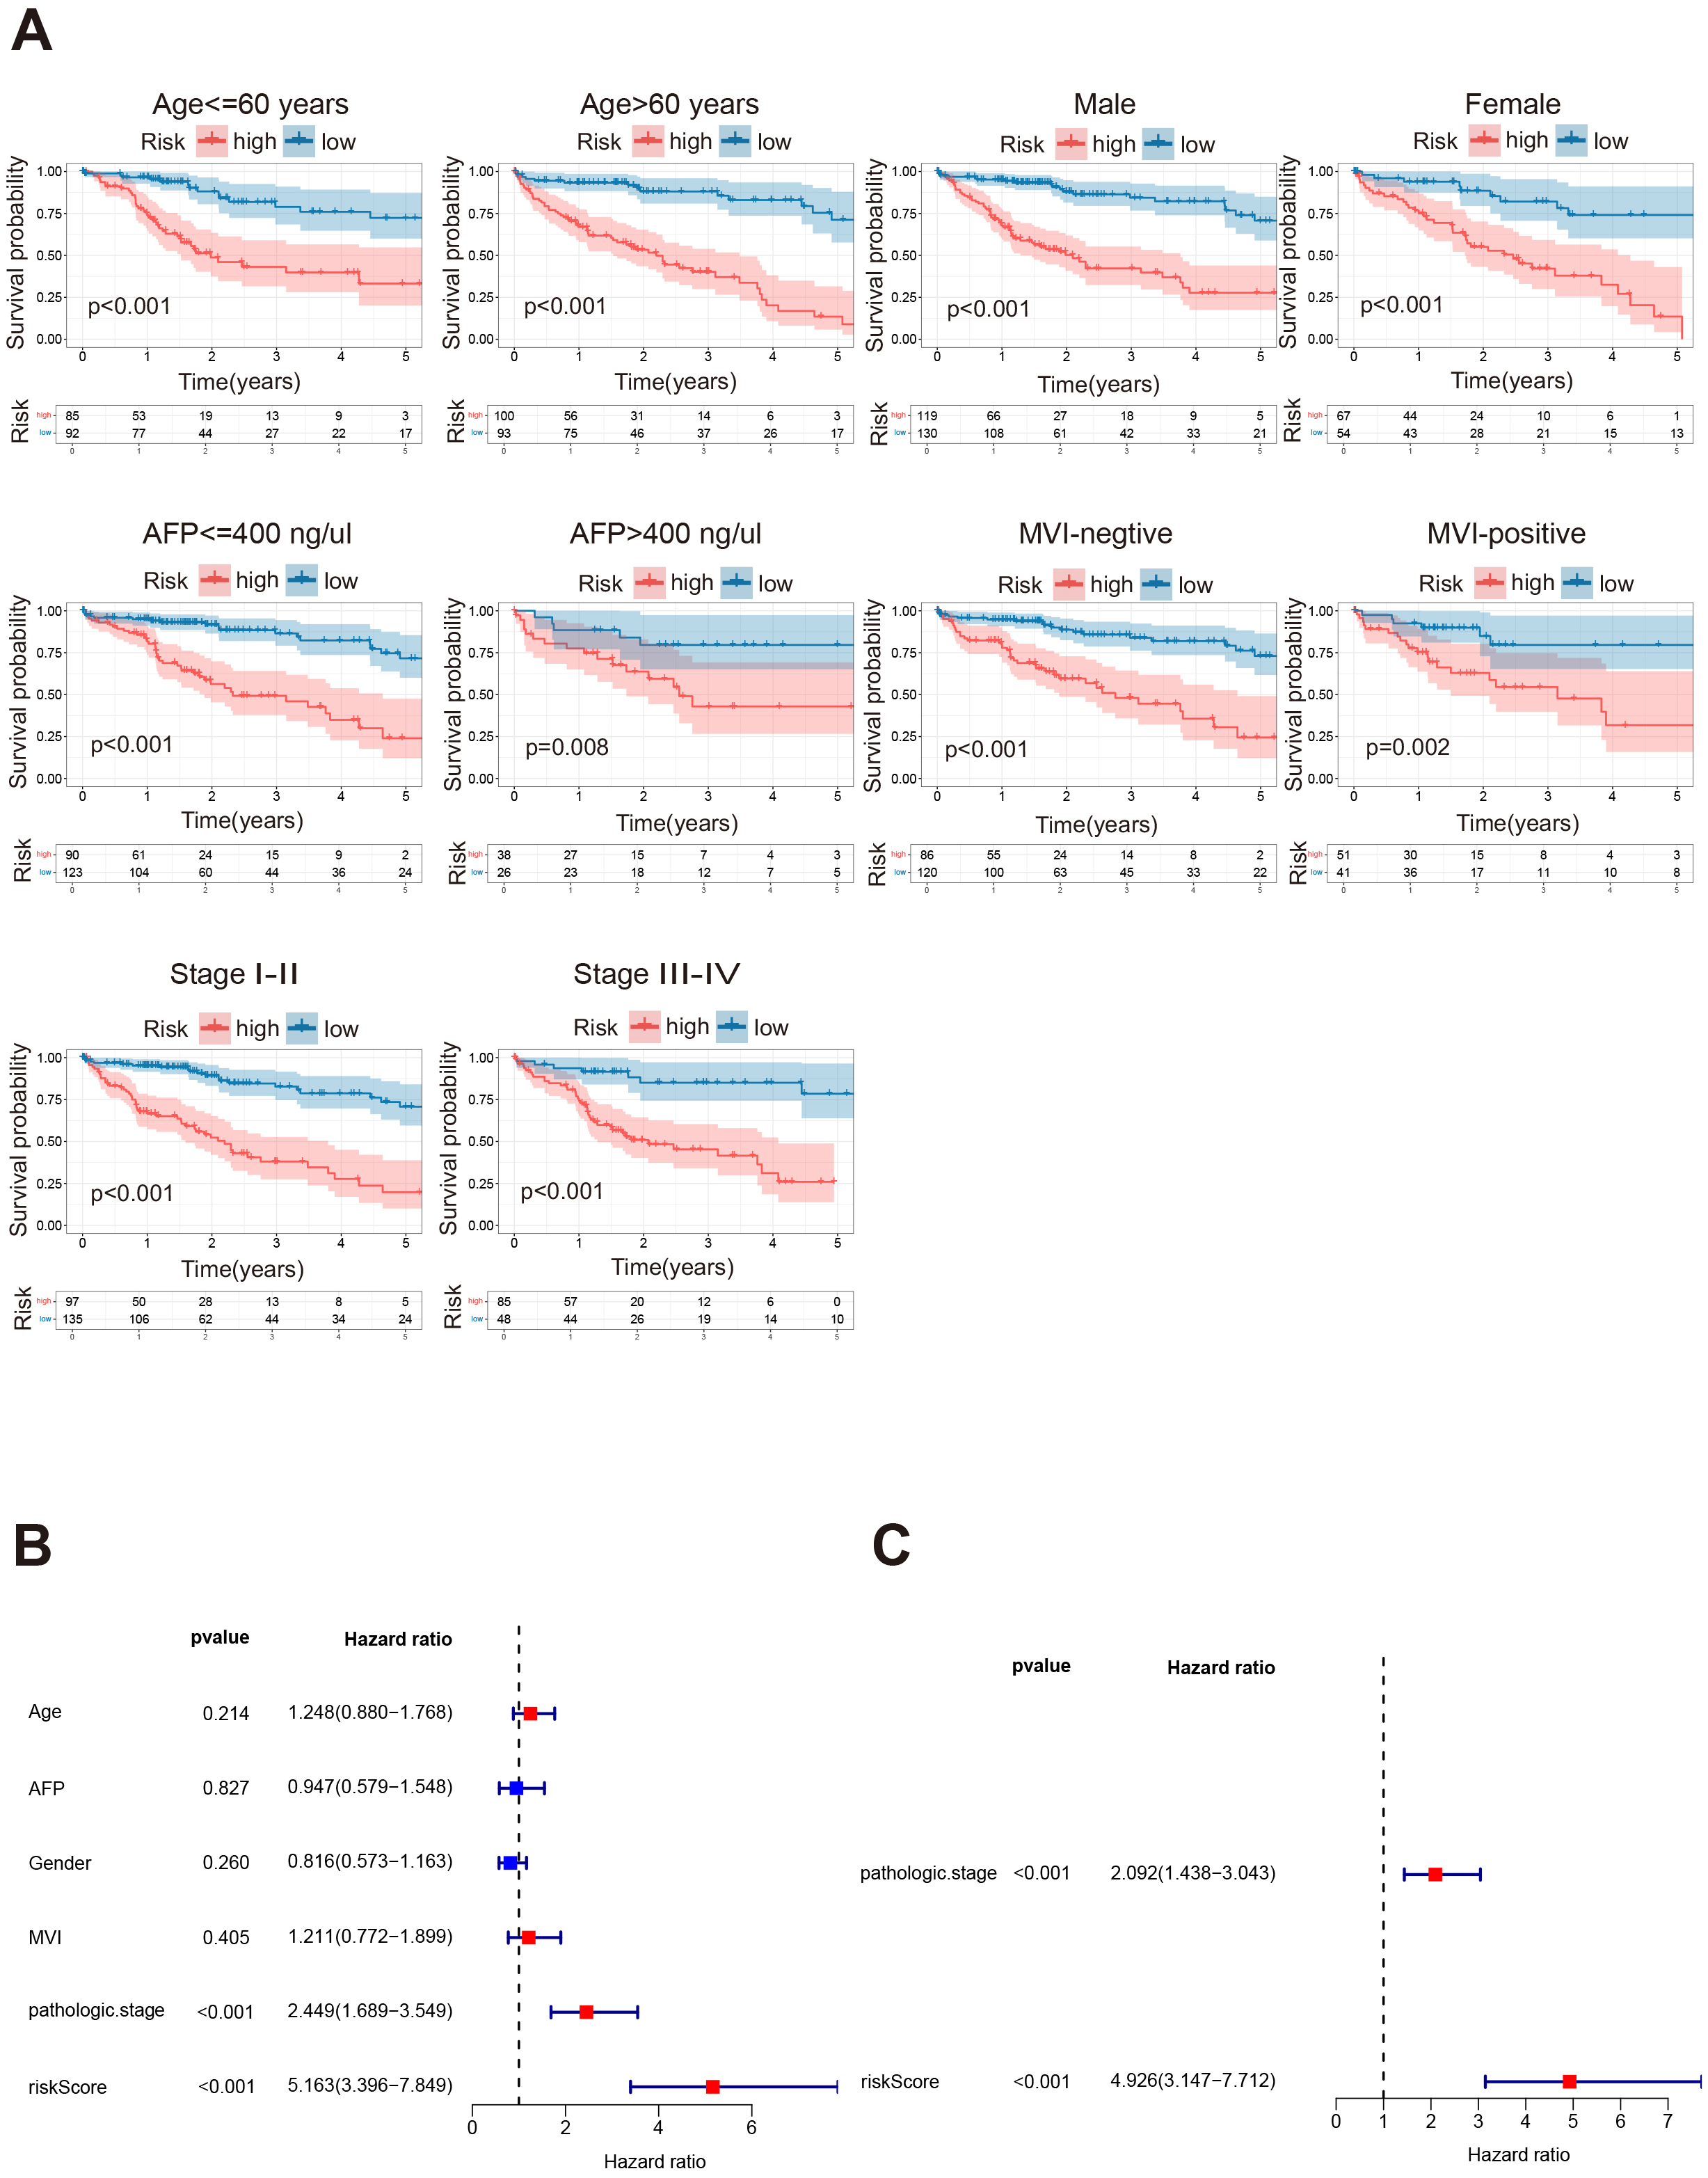 Fig. 5.
HGL riskScore is an independent prognostic factor. (A) The Kaplan-Meier survival analysis was performed based on HGL risk signature for patients with different gender, with different ages, different AFP values, different MVI and pathological stages. (B) Forest plot showing Univariate-COX analysis of the TCGA-LIHC cohort including age, AFP, MVI, pathologic stage, and riskScore as variables. (C) Forest plot showing Multivariate-COX analysis including Pathologic stage, and riskScore as variables in the TCGA-LIHC cohort. AFP, alpha-fetoprotein level; MVI, microvascular invasion.
To obtain a better prediction of prognosis, we incorporated the above clinical
factors together with the riskScore to construct a nomogram. Patients with a
higher score represent worse survival (Fig. 6A, p
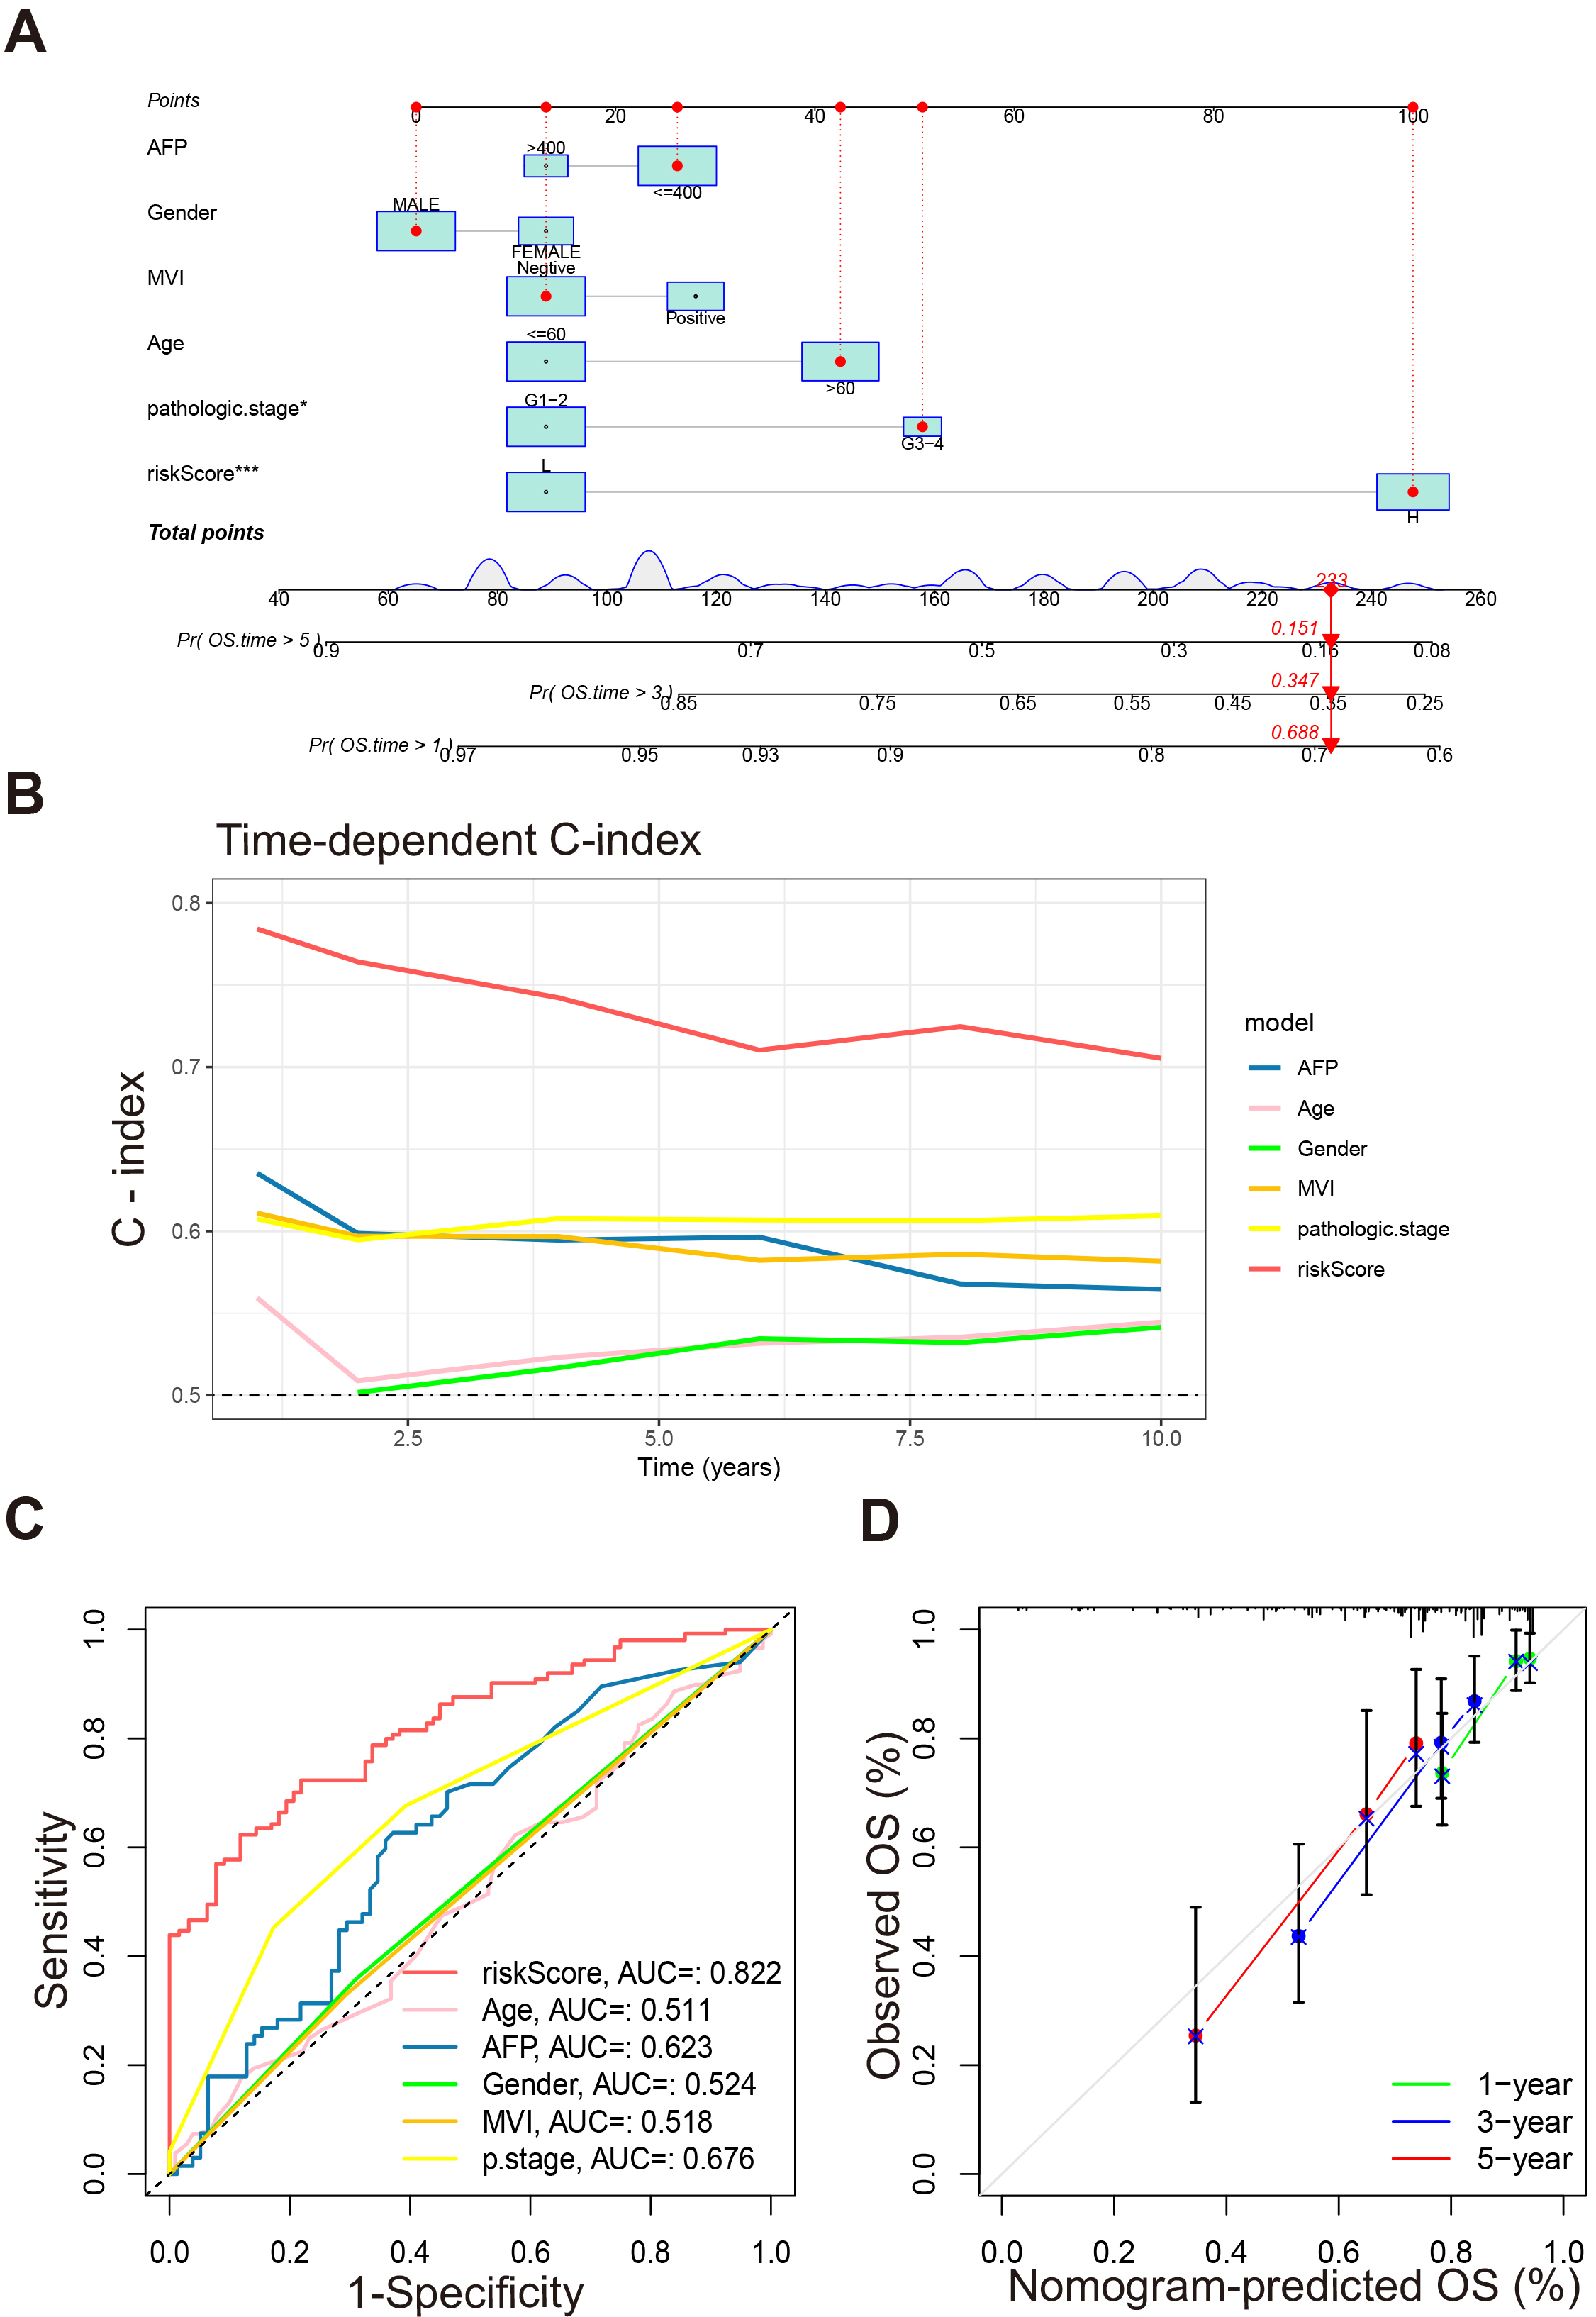 Fig. 6.
Construction and validation of the nomogram. (A) Nomogram for
predicting 1-, 3-, and 5-year OS. (B) Time-dependent C-index of riskScore and
other clinical factors. (C) ROC curves of riskScore and other clinical factors
predicting 3-year OS of patients. (D) Calibration curve for nomogram. *p
To explore the expression patterns in HCC, we incorporated a set of spatial transcriptomic data to investigate genes in HGL signature from both the expression level and spatial orientation [22]. The organization of four sets of spatial transcriptomes were taken from the junction of tumor and normal tissue, and cells obtained from these samples were divided into 14 cell clusters (Fig. 7A). Based on the annotations that come with the spatial transcriptome data, these cells could be defined as five kinds of localized cell populations, namely: Hepatocytes, Immune infiltration region (IIR), Transition, Tumor, Others (Fig. 7B).
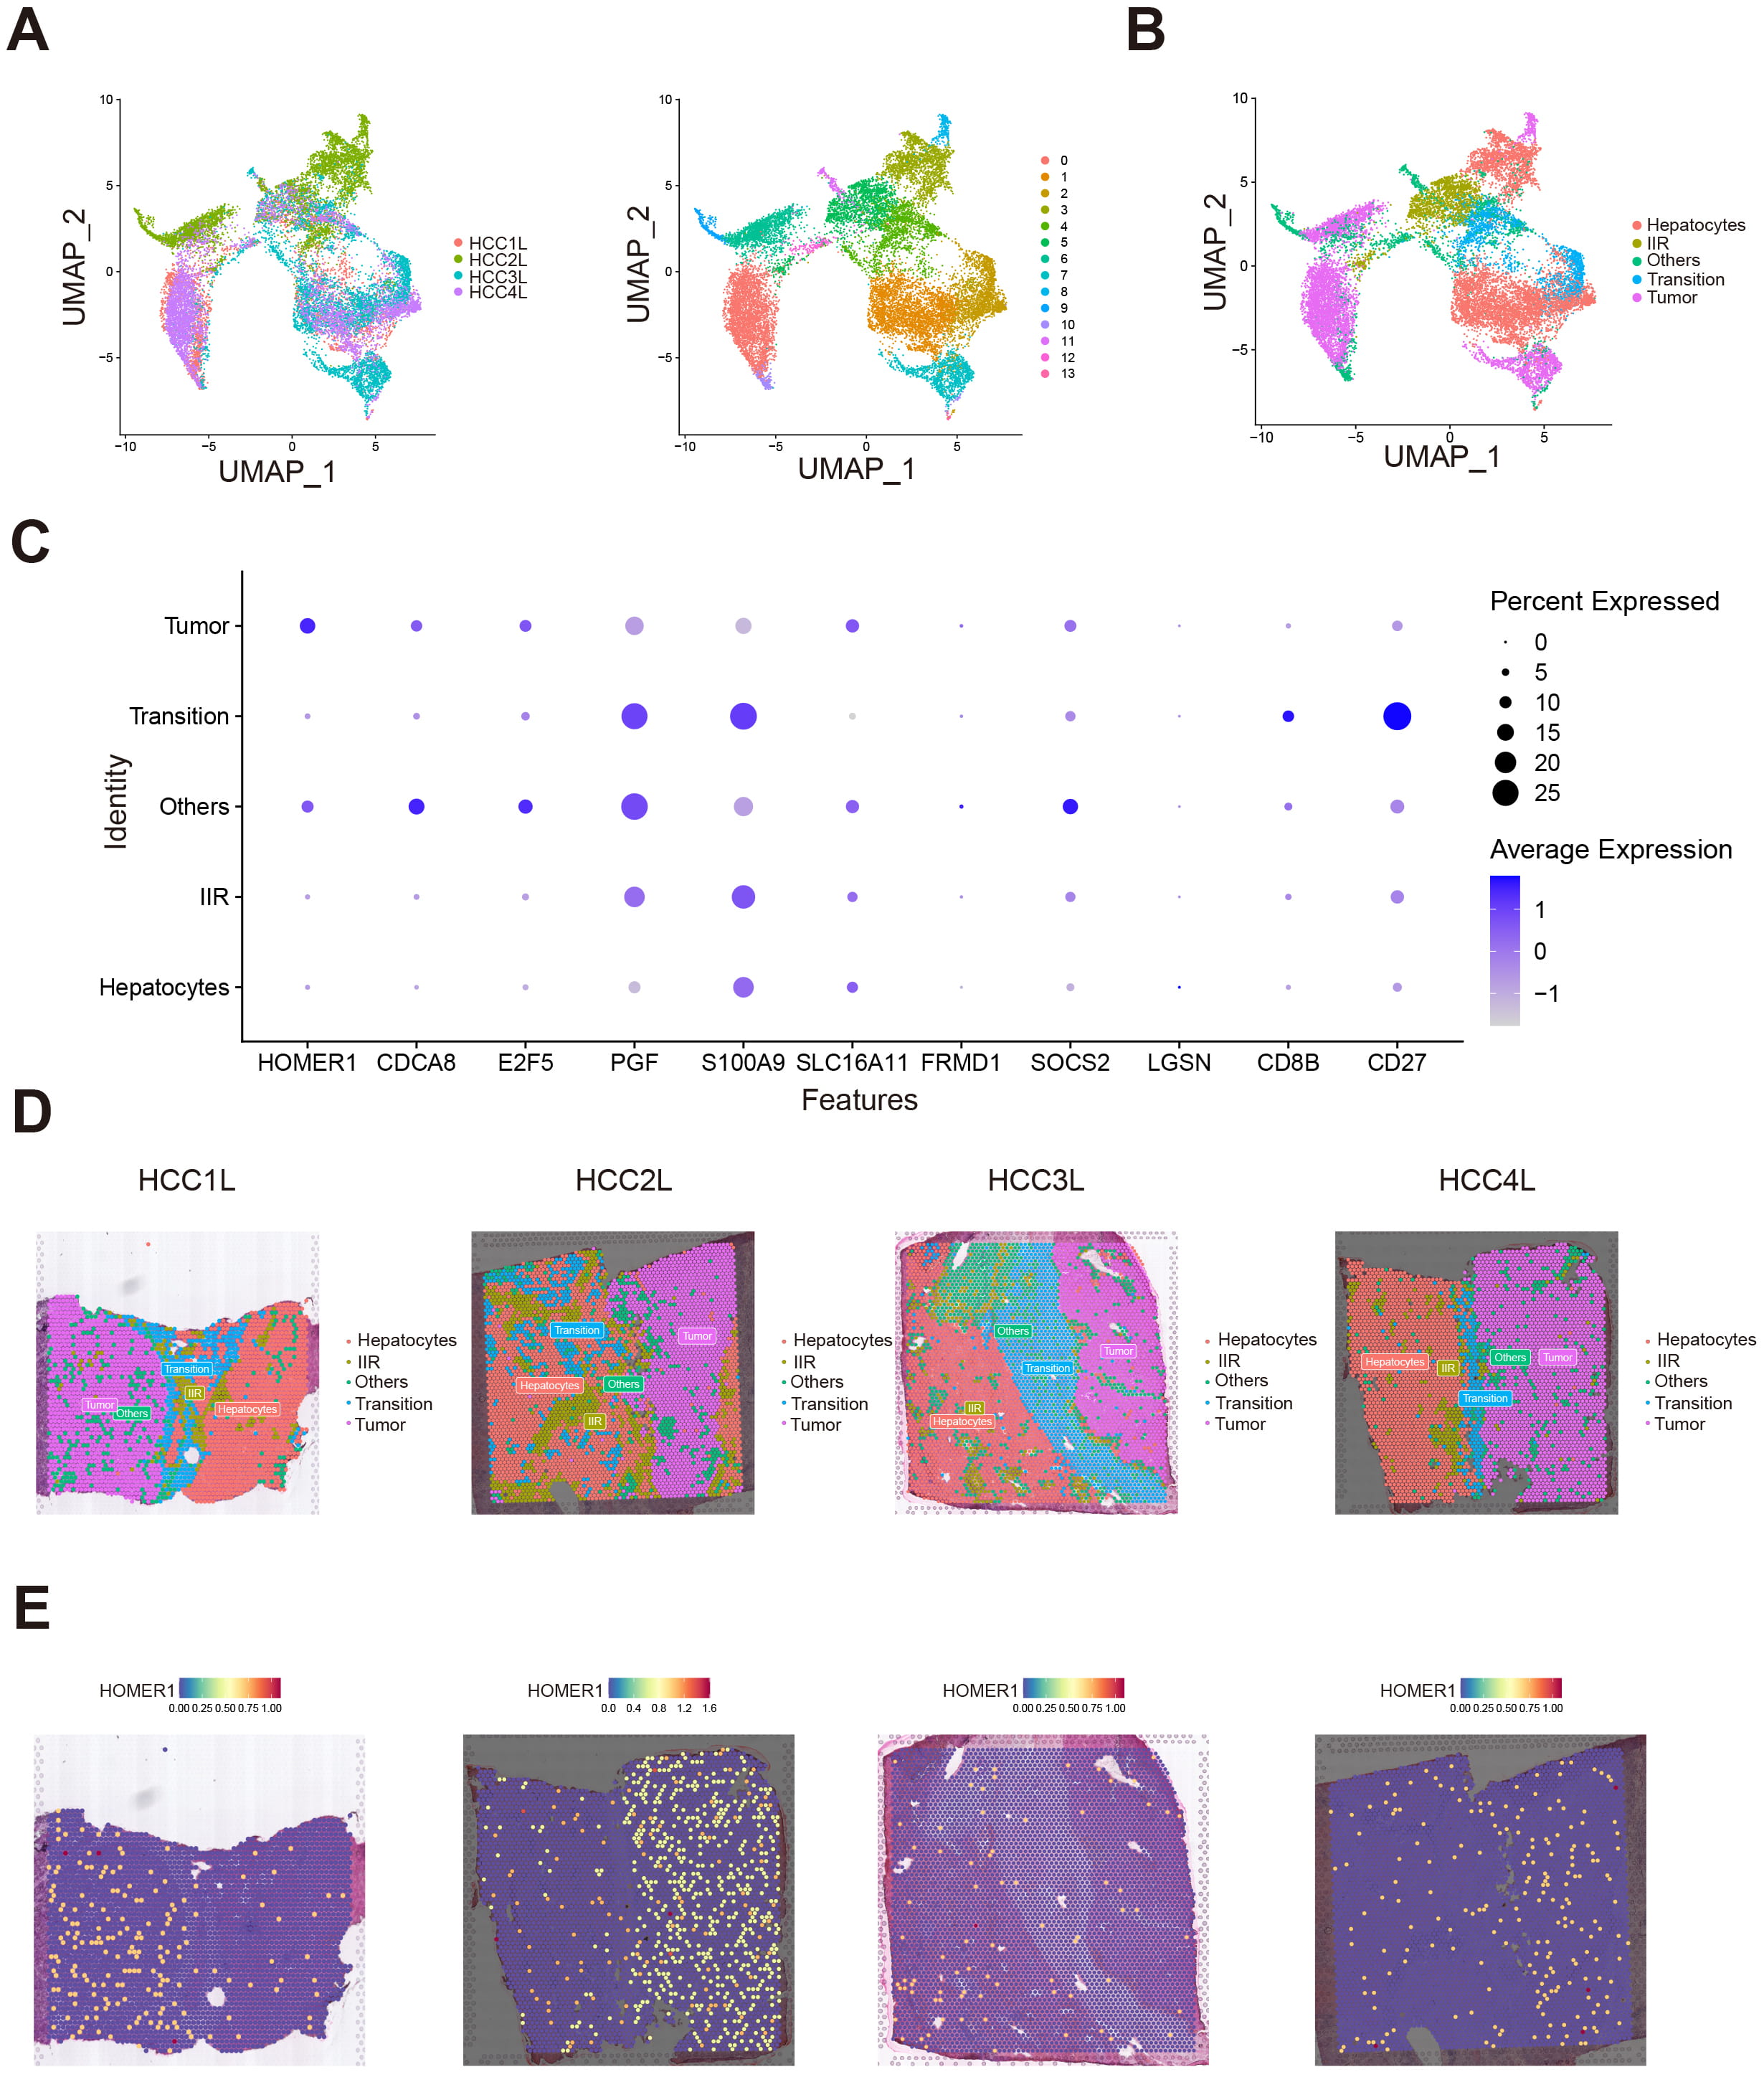 Fig. 7.
Spatial transcriptome data revealing HOMER1 significantly enriched in hepatocellular carcinoma cell. (A) Four spatial transcriptome samples taken from the junction of hepatocellular carcinoma and para-carcinoma were analyzed by dimensionality reduction and cluster analysis, 14 different clusters were identified. (B) We identified clusters derived from Hepatocytes, Tumor, Immune infiltrate region (IIR), Transition, Others these five regions. (C) Bubble diagram showing genes expression in each region. (D) Spatial distribution of different cell clusters. (E) Spatial distribution of HOMER1 is concentrated in tumor cells. UMAP, uniform manifold approximation and projection.
As shown in the bubble diagram, among the genes in the signature, HOMER1 is mainly expressed in tumor-derived cells (Fig. 7C). To further validate our findings, we performed spatial transcriptomic analysis on these four sets of samples. From the spatial distribution of the cell clusters and the spatial distribution of HOMER1, we found that HOMER1 highly coincides with the distribution of tumor cells (Fig. 7D,E). The differential expression of HOMER1 indicates that this protein may play a key role in the malignant process of hepatocellular carcinoma.
The mechanism of HOMER1 in HCC has not been explored, thus we sought to explore
the actual expression of HOMER1 in HCC. Eight pairs of adjacent and tumor tissues
from HCC patients were obtained. Western blot revealed HOMER1 was elevated in
tumor tissues (Fig. 8A,B, p
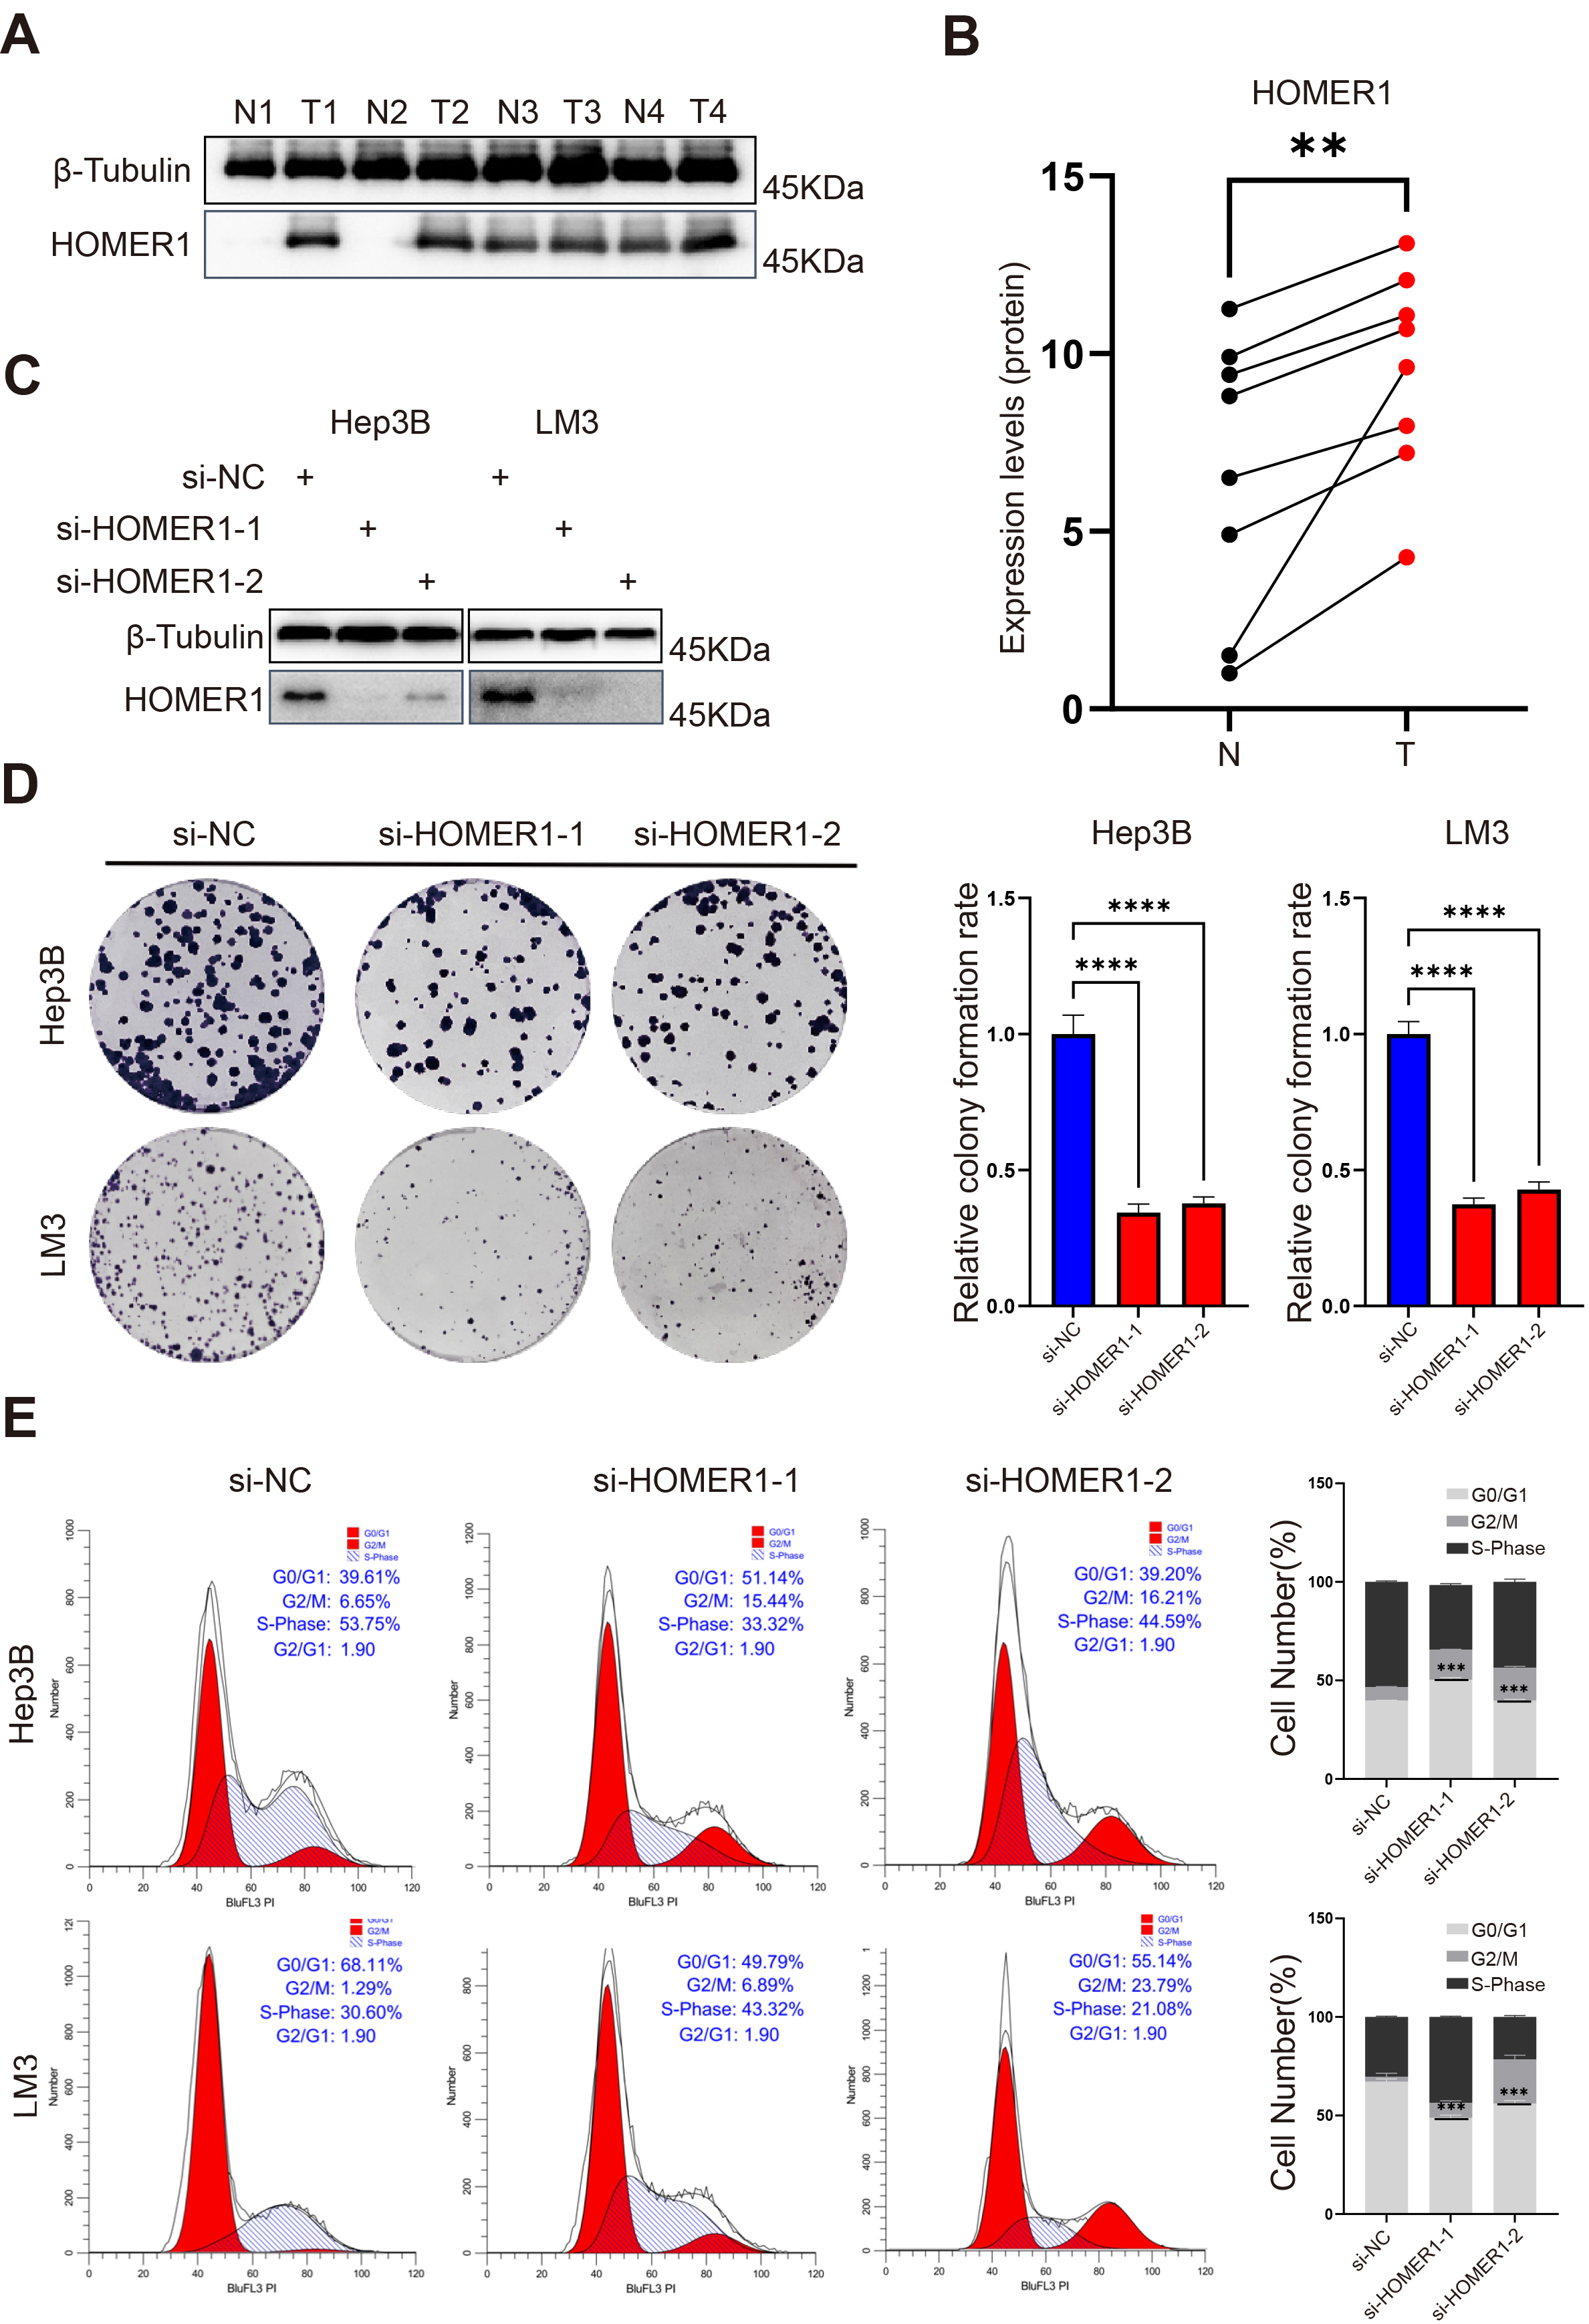 Fig. 8.
HOMER1 is highly expressed in tumor tissues and affects the
malignant proliferation of hepatocellular carcinoma cell lines. (A) Western Blot
revealed that the expression of HOMER1 was evaluated in tumors and in adjacent
tumors at the protein level. (B) The comparison of HOMER1 protein expression
levels between normal and tumor tissues. (C) HOMER1 was successfully knocked down
in LM3 and Hep3B cell lines. (D) The proliferation ability of LM3 and Hep3B
decreased after knock down of HOMER1. (E) Knock down of HOMER1 blocked the cell
cycle of LM3 and Hep3B. **p
To explore its function in hepatocellular carcinoma cell lines, we knocked down
HOMER1 in LM3 as well as in Hep3B cell lines, with Western-Blot demonstrating
that HOMER1 knock down was very successful (Fig. 8C; Supplementary Fig.
2E,F). We observed that knocking down HOMER1 significantly inhibited the
proliferation of LM3 and Hep3B. The colony formation assay clearly exhibited the
difference of cell proliferation between untreated and si-HOMER1 cells (Fig. 8D,
p
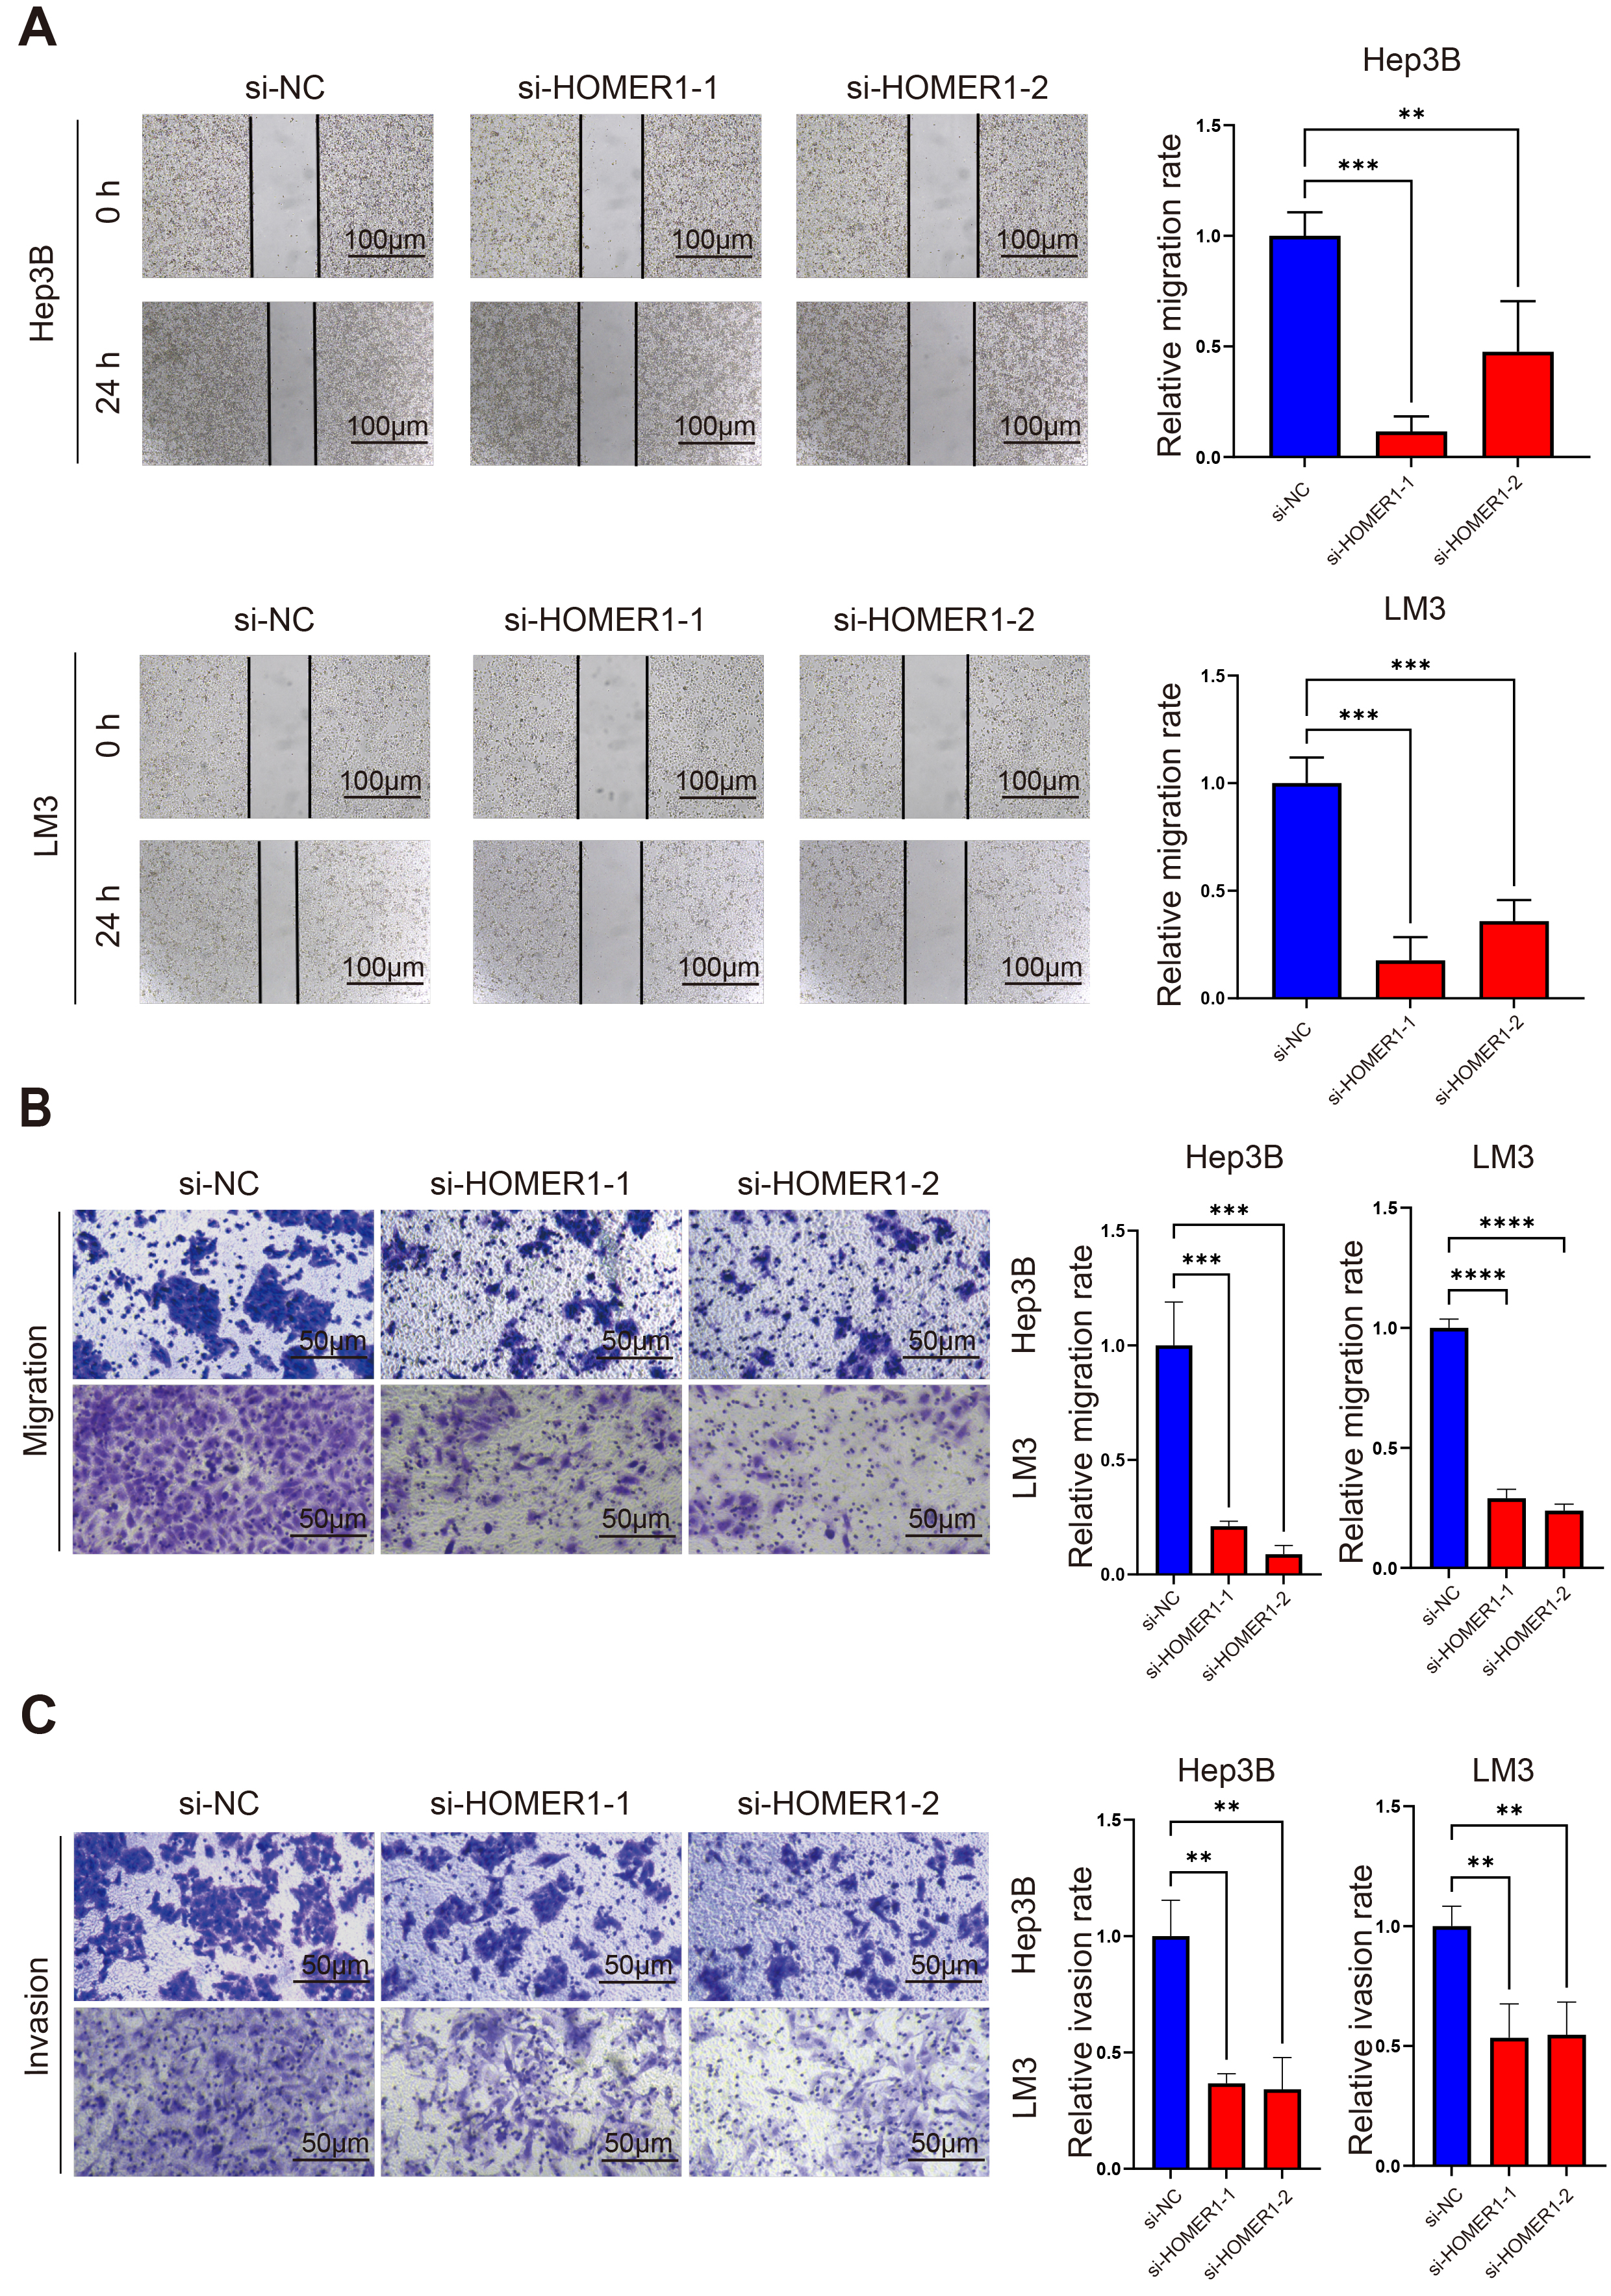 Fig. 9.
The knocking down of HOMER1 affected the ability of metastasis
and invasion of hepatocellular carcinoma cell lines. (A) The wound healing assay
showed that knocking down of HOMER1 significantly decreased the migration ability
of Hep3B and LM3. Scale bars = 100 µm. (B) The Transwell migration assay
showed that knocking down of HOMER1 decreased the migration ability of Hep3B and
LM3. Scale bars = 50 µm. (C) The Transwell invasion assay showed that
knocking down of HOMER1 decreased the invasion ability of Hep3B and LM3. Scale
bars = 50 µm. **p
The lactylation of histones is a new method for protein modification. In the past two years, it has been reported that lactylation has a definite regulatory effect on tumor progression, chemoradiotherapy resistance, and immune evasion. Lactylation has also been reported in hepatocellular carcinoma: Lactylation at K28 inhibits the function of Adenylate kinase and promotes the proliferation and metastasis of hepatocellular carcinoma cell; while the lactylation of Aldolase A (ALDOA) at the K230/322 site can affect its binding to DEAD-box helicase 17 (DDX17), thus regulating the stemness of hepatocytes.
Lactylation is vital to tumor progression. There have been numerous studies on constructing prognosis signature based on lactylation genesets: Huang et al. [25] developed a 23-gene lactylation-related risk signature predicting the prognosis of colorectal cancer patients by the multi-dimensional approach; Cheng et al. [17] also constructed a 6-lactylation-related gene signature in gastric cancer; Cheng et al. [17] constructed an 8-gene signature using LASSO regression analysis in HCC, which revealed that lactylation-related signature can be used as biomarkers for effective clinical treatment of HCC. Several metabolites can act as substrates for histone modifications, while lactate is the product of glycolysis and also the substrate for lactylation. The hypoxic microenvironment in HCC promotes enhanced glycolysis, which may lead to lactate accumulation; and drives the transcription changes of genes related to the degree of histone modification and the malignant biological behavior of HCC.
In view of the crosstalk between metabolic reprogramming with lactylation, we co-included the hypoxia-glycolysis-lactate genesets in this study. Since lactylation plays a key role in a variety of cancers, we believe that such a signature will have great predictive significance for patients and also assistant in identifying genes associated with lactylation for further study.
We divided patients in TCGA-LIHC into two clusters based on the prognosis-associated HGL genes. There are significant differences in OS between the two clusters which reveals the HGL gene set is capable of increased stratification in patients with HCC, which also has implications for the use of drugs such as sorafenib, immune checkpoint inhibitors, and others. In order to independently predict the prognosis of each patient, we performed LASSO COX regression analysis on the differential expressed genes between clusters and obtained a 13-gene HGL signature (CDCA8, GAGE2D, S100A9, SLC16A11, SOCS2, FAM163A, LGSN, FRMD1, HOMER1, CD8B, CD27, E2F5, PGF). The signature has good prediction accuracy in the TCGA-LIHC training set, also in the test set ICGC-LIHC with a slightly smaller number of patients, in the external validation set GSE148355. Due to the small number of patients in this dataset, the AUC at the first year is not satisfactory, but still shows some prognosis for the long-term survival of patients. In terms of prediction accuracy and specificity, this signature is superior to previously reported hypoxia-related signatures [26], glycolysis-related signatures [12, 27], and lactylation-related signatures [17]. It is also an independent prognostic factor for HCC patients.
The spatial transcriptome data revealed that, among the 13 genes, HOMER1 was mostly expressed in tumor cells and was concentrated most in tumor regions, suggesting that HOMER1 may have a critical role in the progression of hepatocellular carcinoma. It has been reported that circ-HOMER1 could regulate the growth and aggressiveness of hepatocellular carcinoma cells [28]. However, circ-HOMER1, as a circular RNA, is structurally and functionally different from the protein-coding HOMER1 gene. Although HOMER1 has been reported to be associated with tumor biology and also has potential clinical application in Hepatitis B Virus (HBV)-related HCC [29], there is still a lack of experimental verification for its mechanism. To investigate the effect of HOMER1 on HCC, we knocked it down in two cell lines, LM3 and Hep3B. We observed that knocking down of HOMER1 significantly inhibited cell proliferation which was confirmed by colony formation assays, while cell cycle analysis suggested that knocking down of HOMER1 effectively blocked the cell cycle. Wound healing assay and Transwell assay showed that knocking down of HOMER1 also inhibited the migration and invasion of LM3 and Hep3B. It is a novel discovery that HOMER1 affect the growth and invasiveness of HCC by blocking the cell cycle, which also reveals the possibility of HOMER1 as a potential therapeutic target for HCC.
However, this study still has some limitations. First, it does not provide specific guidance for the treatment of HCC patients. Second, we only investigated the effect of HOMER1 on the malignant progression of HCC, but didn’t explore its mechanism, nor did we explore the relationship between HOMER1 and lactylation.
In this study, we constructed an HGL prognosis-related signature to predict the prognosis of HCC patients, which has great predictive effect for patients in multiple data sets. We also found that HOMER1 can block the cell cycle and malignant progression of hepatocellular carcinoma, suggesting its potential as a new therapeutic target for hepatocellular carcinoma.
The datasets analyzed in this study are available in the Cancer Genome Atlas (TCGA) database (https://www.cancer.gov/ccg/research/genome-sequencing/tcga), Gene Expression Omnibus (GEO) database (https://www.ncbi.nlm.nih.gov/geo/) and the International Cancer Genome Consortium (ICGC) database (https://platform.icgc-argo.org/). The datasets used and/or analyzed during the current study are available from the corresponding author on reasonable request.
Conceptualization: KF; Data curation and Investigation: FY, SL, YY; Supervision: KF. All authors contributed to editorial changes in the manuscript. All authors read and approved the final manuscript. All authors have participated sufficiently in the work and agreed to be accountable for all aspects of the work.
The study was carried out in accordance with the guidelines of the Declaration of Helsinki. The study involving human patients were reviewed and approved by the Central South University Xiangya Hospital Research Ethics Committee, Ethics Number 202004191. Patients or their families/legal guardians provided their written consent to participate in the study.
The authors appreciate the tutors who conducted the experiment and corrected the paper, the TCGA, ICGC, GEO dataset who provided the data sources for this article, and finally the patients who provided the organization. Finally, we would like to thank Professor Wen-Zheng Li for providing ethical approval support for this study.
This work was supported by National Natural Science Foundation of China [32170726] to KF.
The authors declare no conflict of interest.
Supplementary material associated with this article can be found, in the online version, at https://doi.org/10.31083/FBL33422.
Publisher’s Note: IMR Press stays neutral with regard to jurisdictional claims in published maps and institutional affiliations.