


1 College of Pharmacy and Research Institute of Life and Pharmaceutical Sciences, Sunchon National University, 57922 Suncheon, Republic of Korea
†These authors contributed equally.
Abstract
Sepsis is a life-threatening condition characterized by a dysregulated host response to infection, often leading to multiorgan dysfunction. Despite their clinical importance, early diagnostic biomarkers that reflect organ-specific damage remain inadequately characterized.
Targeted metabolomic profiling of amino acids, organic acids, fatty acids, nucleosides, and kynurenine pathway metabolites was performed on lung, kidney, spleen, and liver tissues obtained from a lipopolysaccharide-induced mouse model of sepsis, using liquid chromatography-tandem mass spectrometry and gas chromatography-tandem mass spectrometry. Univariate and multivariate statistical analyses (principal component analysis and partial least squares discriminant analysis) were performed to identify potential biomarkers, followed by pathway analysis to elucidate their biological relevance.
Twenty-nine metabolites were significantly altered across the four tissues, exhibiting organ-specific metabolic signatures. Tyrosine, epinephrine, 5-hydroxytryptophan, and kynurenic acid in the kidney; serine, 4-hydroxyproline, normetanephrine, xanthosine, uridine, adenosine, succinic acid, cis-aconitic acid, linoleic acid, and eicosadienoic acid in the spleen; alanine, α-aminobutyric acid, ornithine, uridine, adenosine, 5′-deoxy-5′-methylthioadenosine, succinic acid, and cis-aconitic acid in the lung; and α-aminobutyric acid, pipecolic acid, uridine, inosine, adenosine, glycolic acid, and oxaloacetic acid in the liver were identified as potential biomarkers reflecting organ-specific dysfunction in sepsis.
This study highlights the distinct organ-specific metabolic alterations in sepsis and identifies candidate biomarkers that may reflect early organ dysfunction. These findings provide a foundation for the development of precise diagnostic and medical strategies for sepsis.
Keywords
- sepsis
- organ dysfunction
- metabolomics
- biomarker
Sepsis is a life-threatening condition characterized by a dysregulated host response to infection, resulting in physiological, pathological, and biochemical disturbances. It often leads to systemic inflammation, oxidative stress, multiple organ dysfunction, septic shock, and death [1, 2]. According to a global estimate, in 2017, sepsis accounted for approximately 489,000 cases and 110,000 related deaths, representing 19.7% of the global mortality [3]. Despite advances in medical care and clinical awareness, sepsis remains a major contributor to morbidity and mortality worldwide. The heterogeneous clinical manifestations of sepsis pose significant challenges to its diagnosis and management [4].
Biomarkers reflecting the pathophysiological changes in sepsis have been investigated as potential tools for improving clinical decision-making and patient outcomes. Among these, procalcitonin, C-reactive protein, interleukin-6, presepsin, and CD64 have been proposed as diagnostic markers [5]. However, most recent studies have focused on evaluating individual biomarkers in isolation, which may be insufficient given the multifactorial and dynamic nature of sepsis; thus, ongoing research aims to identify optimal combinations of biomarkers [6, 7, 8]. The Sepsis-3 consensus emphasizes the importance of early detection of organ dysfunction as a key determinant of prognosis and therapeutic success [9].
Recent studies have proposed urinary metabolites such as 3-methylhistidine as
early biomarkers for sepsis-associated acute kidney injury (SA-AKI) [10, 11].
Moreover, metabolic reprogramming in SA-AKI, including impaired fatty acid
oxidation and suppression of peroxisome proliferator-activated receptor
The standards, including 31 AAs (alanine, methionine, phenylalanine, cysteine,
proline, aspartic acid, glycine, valine, glutamic acid, serine, asparagine,
leucine, isoleucine, glutamine, threonine, lysine, histidine, tyrosine,
tryptophan,
The animal model used in this study (n = 5) was derived from the referenced
article [18]. Six week-old female BALB/c mice (about 20 g) were purchased from
Orient Bio (Daejeon, Korea) and housed under pathogen-free conditions with
controlled temperature and humidity for at least 1 week before experimentation.
To establish the mice model, lipopolysaccharide (LPS, 20 mg
Gas chromatography-tandem mass spectrometry (GC–MS/MS) analysis was performed
using a Shimadzu TQ 8040 triple-quadrupole mass spectrometer (Shimadzu, Kyoto,
Japan). Metabolite separation was achieved with a cross-linked Ultra-2 capillary
column (25 m
Liquid chromatography-tandem mass spectrometry (LC-MS/MS) analysis was performed using a Shimadzu LCMS-8050 triple-quadrupole mass spectrometer (Shimadzu, Kyoto, Japan). Separation of NSs and KP metabolites was achieved using a ZORBAX Eclipse XDB-C18 column measuring 150 mm in length, 4.6 mm in internal diameter, and 5 µm in particle size (Agilent Technologies, Palo Alto, CA, USA). The instrument was operated in the electrospray ionization mode with a nebulizing gas flow rate of 3.0 L/min and a heating gas flow rate of 10.0 L/min. The interface temperature was maintained at 300 °C, and the desolvation line temperature was set to 250 °C. Gradient elution was implemented for chromatographic separation using 10 mM ammonium acetate as mobile phase A and methanol as mobile phase B for NSs, whereas 0.1% formic acid in water was used as mobile phase A and 0.1% formic acid in acetonitrile as mobile phase B for KP metabolites.
Kidney, spleen, lung, and liver tissues were homogenized in water using an ultrasonicator (VCX-600; Sonics & Materials, Danbury, CT, USA). Supernatants were collected after centrifugation at 13,500 rpm for 5 min at 4 ℃. Profiling analysis of AAs, OAs, and FAs in tissue samples was performed using ethoxycarbonylation (EOC)/tert-butyldimethylsilylation (TBDMS) and methoximation (MO)/TBDMS derivatization, as previously described [19].
For AA analysis, 2 mg of tissue sample was deproteinized by adding 100 µL
of acetonitrile containing 0.2 µg of norvaline as an IS. After
centrifugation, the resulting supernatant was mixed with 1.0 mL of water and
transferred to 2.0 mL of dichloromethane containing ethyl chloroformate (ECF).
The pH was adjusted to
For the analysis of OA and FA, 5 mg of tissue sample was treated with 100
µL of acetonitrile containing internal standards (0.5 µg of
13C2-succinic acid, 0.1 µg of 3,4-dimethoxybenzoic acid, and 0.1
µg of pentadecanoic acid). After centrifugation, the supernatant was
combined with 1.0 mL of distilled water and 1 mg of methoxyamine hydrochloride.
The pH was adjusted to
 Fig. 1.
Flowchart of metabolomics analysis. EOC, ethoxycarbonylation; TBDMS, tert-butyldimethylsilylation; MO, methoximation; LC–MS/MS, Liquid chromatography-tandem mass spectrometry; GC–MS/MS, Gas chromatography-tandem mass spectrometry; AAs, amino acids; OAs, organic acids; FAs, fatty acids; NSs, nucleosides; KPs, Kynurenine pathway metabolites.
Profiling analyses of NSs and KP metabolites in the tissue samples were performed without derivatization using LC–MS/MS. For deproteinization, 2 mg of lung tissue was mixed with 80 µL of acetonitrile containing internal standards (0.5 ng of 3-deazauridine and 500 ng of 3,4-dimethoxybenzoic acid) in an Eppendorf tube and vortexed for 3 min. After centrifugation, the supernatant was filtered and transferred to an autosampler vial for injection into the LC–MS/MS system. The steps of metabolomics analysis shown in Fig. 1.
Quantitative levels of metabolites in the kidney, spleen, lung, and liver tissues were calculated using calibration curves. To visualize the metabolic alterations in the sepsis group, star plots were constructed based on values normalized to the mean of the control group using Microsoft Excel (version 2010; Microsoft Corporation, Redmond, WA, USA). Quantified metabolite data were log-transformed and auto-scaled to ensure comparability across variables. Univariate analysis was performed using the non-parametric Mann–Whitney U test to assess significant differences between groups. Principal component analysis (PCA) and partial least squares discriminant analysis (PLS-DA) were used to evaluate global metabolic patterns and identify discriminative features. The statistical significances of the group patterns are evaluated using PERMANOVA (based on 999 permutations) for validation of the PCA. The PLS-DA models were based on leave-one-out cross validation (LOOCV) method, that statistical significances of the group patterns providing the basis for the computation of the predictive ability (Q2), determination coefficient (R2), and the classification accuracy of the model. Pathway enrichment analysis was conducted to explore the biological relevance of altered metabolites. All statistical analyses were performed using MetaboAnalyst 6.0 (https://www.metaboanalyst.ca).
In total, 77 metabolites were identified in the kidney tissues of both control and sepsis groups, including 26 AAs, 15 OAs, 16 FAs, 12 NSs, and 8 KP metabolites. Quantitative differences in the metabolite profiles between the two groups are presented in Table 1. Normalized values of individual metabolites were visualized using star plots, enabling a clear observation of sepsis-induced metabolic alterations (Table 1, Supplementary Fig. 1). Compared to the control group, the sepsis group exhibited significant increases in the levels of ornithine (p = 0.032), tyrosine (p = 0.032), 2-hydroxybutyric acid (p = 0.008), malic acid (p = 0.016), cis-aconitic acid (p = 0.016), pseudouridine (p = 0.016), cytidine (p = 0.008), xanthosine (p = 0.016), 1-methylguanosine (p = 0.008), 5-hydroxytryptophan (p = 0.016), kynurenic acid (p = 0.008), and epinephrine (p = 0.008), as determined using the Mann–Whitney U test (Table 1, Fig. 2a).
 Fig. 2.
Star symbol plot of significant metabolites in tissues from control and sepsis mice. (a) Kidney (12 metabolites), (b) Spleen (17 metabolites), (c) Lung (12 metabolites), and (d) Liver (17 metabolites).
| No. | Metabolite | Amount (ng/mg, mean |
Normalized value | p-valuec | |||||
| Kidney | Spleen | (mean |
|||||||
| Control | Sepsis | Control | Sepsis | Kidney | Spleen | Kidney | Spleen | ||
| 1 | Alanine | 463.45 |
507.86 |
1076.41 |
904.05 |
1.10 |
0.84 |
0.690 | 0.151 |
| 2 | Glycine | 378.72 |
466.05 |
4278.73 |
2649.68 |
1.23 |
0.62 |
0.310 | 0.151 |
| 3 | 0.92 |
1.00 |
1.21 |
1.42 |
1.09 |
1.18 |
0.690 | 0.016 | |
| 4 | Valine | 333.56 |
343.67 |
226.83 |
215.83 |
1.03 |
0.95 |
0.690 | 0.421 |
| 5 | Leucine | 340.93 |
359.88 |
963.95 |
1278.86 |
1.06 |
1.33 |
0.151 | 0.032 |
| 6 | Isoleucine | 227.47 |
243.11 |
369.29 |
240.58 |
1.07 |
0.65 |
0.841 | 0.056 |
| 7 | Proline | 688.71 |
405.20 |
200.02 |
193.70 |
0.59 |
0.97 |
0.222 | 0.548 |
| 8 | Pipecolic acid | 2.55 |
0.85 |
N.D.a | N.D.a | 0.33 |
- | 0.310 | - |
| 9 | Pyroglutamic acid | 383.14 |
167.66 |
87.86 |
119.04 |
0.44 |
0.82 |
0.310 | 0.151 |
| 10 | Methionine | 164.05 |
161.98 |
243.02 |
238.14 |
0.99 |
1.35 |
1.000 | 0.690 |
| 11 | Serine | 156.87 |
265.26 |
972.71 |
155.49 |
1.69 |
0.98 |
0.222 | 0.008 |
| 12 | Threonine | 1103.15 |
1479.07 |
265.74 |
242.98 |
1.34 |
0.16 |
0.421 | 0.421 |
| 13 | 164.54 |
155.40 |
21.12 |
17.27 |
0.94 |
0.91 |
0.310 | 0.151 | |
| 14 | Phenylalanine | 228.55 |
251.92 |
794.89 |
863.13 |
1.10 |
1.09 |
0.310 | 0.690 |
| 15 | Cysteine | 48.87 |
51.20 |
861.29 |
772.81 |
1.05 |
0.90 |
0.548 | 0.222 |
| 16 | Aspartic acid | 330.83 |
358.01 |
2462.76 |
1158.08 |
1.08 |
0.47 |
0.690 | 0.095 |
| 17 | 4-Hydroxyproline | 33.36 |
23.66 |
3.15 |
2.73 |
0.71 |
0.87 |
0.151 | 0.032 |
| 18 | Glutamic_acid | 1795.35 |
1904.38 |
4197.56 |
2031.22 |
1.06 |
0.48 |
0.841 | 0.056 |
| 19 | Asparagine | 46.10 |
56.90 |
N.D.a | N.D.a | 1.23 |
- | 0.421 | - |
| 20 | Ornithine | 61.72 |
87.05 |
433.28 |
696.15 |
1.41 |
1.61 |
0.032 | 0.095 |
| 21 | 7.12 |
6.71 |
6.20 |
7.62 |
0.94 |
1.23 |
0.690 | 0.310 | |
| 22 | Glutamine | 848.84 |
1091.51 |
2654.83 |
1734.77 |
1.29 |
0.65 |
0.222 | 0.151 |
| 23 | Lysine | 546.75 |
680.29 |
1551.78 |
1292.32 |
1.24 |
0.83 |
0.095 | 0.151 |
| 24 | Histidine | 440.57 |
610.18 |
1750.86 |
2143.87 |
1.38 |
1.22 |
0.222 | 0.548 |
| 25 | Tyrosine | 409.69 |
665.84 |
76.68 |
102.74 |
1.63 |
1.34 |
0.032 | 0.310 |
| 26 | Tryptophan | 53.16 |
102.46 |
3373.07 |
751.65 |
1.93 |
0.22 |
0.151 | 0.095 |
| 27 | N-methyl-aspartic_acid | N.D.a | N.D.a | 3243.88 |
3228.26 |
- | 1.00 |
- | 0.841 |
| 28 | N.D.a | N.D.a | N.D.a | N.D.a | - | - | - | - | |
| 29 | Homocysteine | N.D.a | N.D.a | N.D.a | N.D.a | - | - | - | - |
| 30 | Pyruvic acid | 9.98 |
7.08 |
35.16 |
40.08 |
0.71 |
1.14 |
0.548 | 0.095 |
| 31 | Acetoacetic acid | 22.42 |
22.81 |
N.D.a | N.D.a | 1.02 |
- | 0.690 | - |
| 32 | Lactic acid | 360.98 |
309.80 |
239.02 |
250.30 |
0.86 |
1.05 |
0.222 | 0.548 |
| 33 | Glycolic acid | 40.02 |
39.05 |
41.81 |
47.31 |
0.98 |
1.13 |
1.000 | 0.222 |
| 34 | 2-Hydroxybutyric acid | 0.36 |
0.79 |
N.D.a | N.D.a | 2.22 |
- | 0.008 | - |
| 35 | 3-Hydroxybutyric acid | 5.42 |
6.68 |
1.78 |
6.43 |
1.23 |
3.60 |
0.548 | 0.032 |
| 36 | Malonic acid | 2.25 |
2.54 |
1.03 |
1.24 |
1.13 |
1.21 |
0.095 | 0.151 |
| 37 | Succinic acid | 316.26 |
346.77 |
22.51 |
28.08 |
1.10 |
1.25 |
0.056 | 0.095 |
| 38 | Fumaric acid | 3.59 |
3.83 |
7.10 |
8.68 |
1.07 |
1.22 |
0.548 | 0.095 |
| 39 | Oxaloacetic acid | 4.08 |
4.37 |
3.38 |
3.53 |
1.07 |
1.05 |
0.310 | 0.690 |
| 40 | 2.91 |
2.98 |
2.88 |
3.44 |
1.02 |
1.19 |
0.310 | 0.056 | |
| 41 | 4-Hydroxyphenylacetic acid | 0.22 |
0.26 |
0.50 |
0.50 |
1.17 |
1.01 |
0.056 | 0.421 |
| 42 | Malic acid | 22.61 |
34.86 |
59.17 |
69.15 |
1.54 |
1.17 |
0.016 | 0.222 |
| 43 | 2-Hydroxyglutaric acid | 5.02 |
4.99 |
N.D.a | N.D.a | 0.99 |
- | 0.690 | - |
| 44 | cis-Aconitic acid | 3.61 |
4.15 |
1.33 |
1.59 |
1.15 |
1.19 |
0.016 | 0.032 |
| 45 | 4-Hydroxyphenyllactic acid | N.D.a | N.D.a | 0.70 |
0.81 |
- | 1.15 |
- | 0.008 |
| 46 | Citric acid | N.D.a | N.D.a | 20.02 |
24.09 |
- | 1.20 |
- | 0.310 |
| 47 | Myristic acid | 2.02 |
2.83 |
N.D.a | N.D.a | 1.05 |
- | 1.000 | - |
| 48 | Palmitoleic acid | 4.01 |
7.67 |
1.13 |
2.91 |
1.91 |
2.59 |
0.690 | 0.008 |
| 49 | Palmitic acid | 97.93 |
95.88 |
19.00 |
46.48 |
0.98 |
2.45 |
0.690 | 0.056 |
| 50 | Linoleic acid | 116.55 |
130.41 |
19.25 |
38.41 |
1.12 |
2.00 |
0.690 | 0.008 |
| 51 | Oleic acid | 62.05 |
91.70 |
11.11 |
27.50 |
1.48 |
2.48 |
0.690 | 0.012 |
| 52 | a-Linolenic acid | 1.75 |
2.21 |
N.D.a | N.D.a | 0.95 |
- | 1.000 | - |
| 53 | Stearic acid | 60.56 |
54.56 |
19.55 |
21.97 |
0.90 |
1.12 |
0.310 | 0.091 |
| 54 | Arachidonic acid | 143.81 |
91.61 |
58.86 |
69.90 |
0.64 |
1.19 |
0.095 | 0.151 |
| 55 | Gondoic acid | 1.79 |
2.71 |
0.37 |
0.63 |
1.52 |
1.70 |
0.421 | 0.056 |
| 56 | Eicosadienoic acid | 7.33 |
6.15 |
2.95 |
5.40 |
0.84 |
1.83 |
0.421 | 0.008 |
| 57 | Arachidic acid | 0.86 |
1.12 |
N.D.a | N.D.a | 1.31 |
- | 0.690 | - |
| 58 | Docosahexaenoic acid | 35.46 |
30.57 |
N.D.a | N.D.a | 0.65 |
- | 0.142 | - |
| 59 | Adrenic acid | 41.29 |
50.60 |
71.32 |
104.91 |
0.92 |
1.47 |
1.000 | 0.056 |
| 60 | Behenic acid | 0.87 |
0.94 |
1.09 |
N.D.a | 1.08 |
- | 0.526 | 0.007 |
| 61 | Nervonic acid | 0.65 |
0.71 |
1.18 |
0.83 |
1.08 |
0.70 |
0.548 | 0.016 |
| 62 | Lignoceric acid | 3.32 |
3.27 |
2.87 |
N.D.a | 0.98 |
- | 0.841 | - |
| 63 | Cerotic acid | N.D.a | N.D.a | 3.16 |
1.41 |
- | 0.45 |
- | 0.008 |
| 64 | 5,6-Dihydrouridine | 0.015 |
0.018 |
0.022 |
0.028 |
1.63 |
1.23 |
0.095 | 0.095 |
| 65 | Pseudouridine | 0.036 |
0.06 |
0.08 |
0.08 |
1.14 |
0.98 |
0.016 | 0.690 |
| 66 | Cytidine | 0.019 |
0.021 |
1.20 |
1.08 |
0.83 |
0.89 |
0.008 | 0.222 |
| 67 | Uridine | 0.30 |
0.24 |
1.17 |
0.65 |
0.92 |
0.55 |
0.056 | 0.008 |
| 68 | Inosine | 1.09 |
1.00 |
1.28 |
1.16 |
1.07 |
0.90 |
0.222 | 0.222 |
| 69 | Guanosine | 0.11 |
0.12 |
0.58 |
0.45 |
1.29 |
0.79 |
0.310 | 0.095 |
| 70 | Xanthosine | 0.042 |
0.05 |
0.08 |
0.13 |
1.42 |
1.57 |
0.016 | 0.008 |
| 71 | 1-Methylguanosine | 0.0046 |
0.0065 |
0.014 |
0.014 |
1.10 |
0.95 |
0.008 | 0.548 |
| 72 | N2-Methylguanosine | 0.012 |
0.014 |
0.033 |
0.031 |
0.90 |
0.94 |
0.095 | 0.421 |
| 73 | Adenosine | 0.10 |
0.09 |
0.05 |
0.03 |
1.08 |
0.60 |
0.421 | 0.032 |
| 74 | N2,N2-Dimethylguanosine | 0.0050 |
0.0053 |
0.011 |
0.012 |
1.28 |
1.05 |
0.151 | 0.690 |
| 75 | 5′-Deoxy-5′methylthioadenosine | 0.03 |
0.04 |
0.55 |
0.97 |
1.63 |
1.76 |
0.421 | 0.151 |
| 76 | 5-Methylcytidine | N.D.a | N.D.a | 0.012 |
0.015 |
- | 1.17 |
- | 0.151 |
| 77 | Picolinic acid | 0.51 |
0.56 |
0.21 |
0.16 |
1.10 |
0.74 |
0.690 | 0.056 |
| 78 | 5-Hydroxytryptophan | 0.05 |
0.10 |
N.D.a | N.D.a | 1.91 |
- | 0.016 | - |
| 79 | Kynurenine | 0.18 |
0.72 |
0.25 |
0.25 |
4.07 |
0.99 |
0.095 | 1.000 |
| 80 | Xanthurenic acid | 0.40 |
0.47 |
0.77 |
0.84 |
1.18 |
1.10 |
0.310 | 0.310 |
| 81 | Kynurenic acid | 0.01 |
0.04 |
N.D.a | N.D.a | 4.08 |
- | 0.008 | - |
| 82 | Epinephrine | 0.0046 |
0.018 |
0.18 |
0.13 |
3.91 |
0.73 |
0.008 | 0.056 |
| 83 | Normetanephrine | 0.12 |
0.13 |
0.25 |
0.15 |
0.13 |
0.60 |
1.000 | 0.032 |
| 84 | DOPA | 0.10 |
0.22 |
0.20 |
0.12 |
0.22 |
0.63 |
0.548 | 0.056 |
| 85 | Serotonin | N.D.a | N.D.a | 0.03 |
0.03 |
- | 0.87 |
- | 1.000 |
| 86 | Anthranilic acid | N.D.a | N.D.a | N.D.a | N.D.a | - | - | - | - |
a N.D., Not determined.
b Values normalized to the corresponding control mean values and SD, standard deviation.
c Mann–Whitney U test.
A total of 72 metabolites were identified in the spleen tissues of both the
control and sepsis groups, comprising 25 AAs, 14 OAs, 13 FAs, 13 NSs, and 7 KP
metabolites. A quantitative comparison of the metabolite profiles between the two
groups is presented in Table 1. Normalized values for each metabolite were
visualized using star plots, which enabled intuitive monitoring of sepsis-induced
metabolic alterations (Table 1, Supplementary Fig. 2). The sepsis group
showed significantly higher levels of several metabolites in spleen tissue than
the control group, as determined using the Mann–Whitney U test. These metaboltes
included
A total of 70 metabolites were identified in the lung tissues of both the
control and sepsis groups, including 24 AAs, 15 OAs, 14 FAs, 12 NSs, and 5 KPs.
Quantitative comparisons of the metabolite profiles between the two groups are
presented in Table 2. Normalized metabolite levels were visualized using star
plots, which enabled intuitive monitoring of sepsis-associated metabolic
alterations (Table 2, Supplementary Fig. 3). According to the
Mann–Whitney U test, several metabolites in the lung tissue showed significant
alterations in the sepsis group compared to those in the control group. Notably,
alanine (p = 0.008),
| No. | Metabolite | Amount (ng/mg, mean |
Normalized value | p-valuec | |||||
| Lung | Liver | (mean |
|||||||
| Control | Sepsis | Control | Sepsis | Lung | Liver | Lung | Liver | ||
| 1 | Alanine | 132.73 |
191.32 |
914.25 |
979.10 |
1.44 |
1.07 |
0.008 | 1.000 |
| 2 | Glycine | 323.42 |
679.33 |
375.57 |
594.02 |
2.10 |
1.58 |
0.056 | 0.095 |
| 3 | 0.58 |
0.83 |
3.31 |
4.91 |
1.44 |
1.48 |
0.008 | 0.008 | |
| 4 | Valine | 45.31 |
44.12 |
257.84 |
302.86 |
0.97 |
1.17 |
0.841 | 0.222 |
| 5 | Leucine | 166.85 |
180.66 |
405.80 |
411.86 |
1.08 |
1.01 |
0.690 | 0.421 |
| 6 | Isoleucine | 60.68 |
65.48 |
286.33 |
238.59 |
1.08 |
0.83 |
0.548 | 1.000 |
| 7 | Proline | 37.82 |
42.85 |
743.74 |
640.90 |
1.13 |
0.86 |
0.690 | 0.310 |
| 8 | Pipecolic acid | N.D.a | N.D.a | 2.37 |
3.99 |
- | 1.68 |
- | 0.032 |
| 9 | Pyroglutamic acid | 77.31 |
67.10 |
580.12 |
293.39 |
0.87 |
0.51 |
0.151 | 0.095 |
| 10 | Methionine | 51.58 |
42.09 |
142.53 |
194.21 |
0.82 |
1.36 |
0.421 | 0.548 |
| 11 | Serine | 115.74 |
122.36 |
305.18 |
164.72 |
1.06 |
0.54 |
0.841 | 1.000 |
| 12 | Threonine | 87.45 |
99.93 |
1029.27 |
309.03 |
1.14 |
0.30 |
0.421 | 0.151 |
| 13 | 5.82 |
6.15 |
70.74 |
73.30 |
1.06 |
1.04 |
1.000 | 0.690 | |
| 14 | Phenylalanine | 100.67 |
113.45 |
401.45 |
497.41 |
1.13 |
1.24 |
0.310 | 0.222 |
| 15 | Cysteine | 253.68 |
280.91 |
12.00 |
26.48 |
1.11 |
2.21 |
0.151 | 0.222 |
| 16 | Aspartic acid | 233.89 |
277.53 |
373.52 |
471.90 |
1.19 |
1.26 |
0.310 | 0.095 |
| 17 | 4-Hydroxyproline | 2.62 |
1.94 |
24.03 |
3.53 |
0.74 |
0.15 |
0.151 | 0.032 |
| 18 | Glutamic_acid | 373.17 |
400.34 |
1464.92 |
1819.71 |
1.07 |
1.24 |
0.421 | 0.151 |
| 19 | Asparagine | N.D.a | N.D.a | 70.72 |
81.01 |
- | 1.15 |
- | 1.000 |
| 20 | Ornithine | 26.12 |
63.58 |
76.70 |
188.04 |
2.43 |
2.45 |
0.008 | 0.222 |
| 21 | 3.55 |
3.80 |
5.32 |
39.40 |
1.07 |
7.41 |
0.548 | 0.008 | |
| 22 | Glutamine | 429.11 |
520.18 |
1925.50 |
1514.16 |
1.21 |
0.79 |
0.548 | 0.222 |
| 23 | Lysine | 196.41 |
204.80 |
210.47 |
366.24 |
1.04 |
1.74 |
0.222 | 0.421 |
| 24 | Histidine | 144.23 |
185.13 |
948.99 |
1008.74 |
1.28 |
1.06 |
0.151 | 0.548 |
| 25 | Tyrosine | 16.62 |
11.51 |
868.17 |
1621.03 |
0.69 |
1.87 |
0.095 | 0.222 |
| 26 | Tryptophan | N.D.a | N.D.a | 14.45 |
51.02 |
- | 3.53 |
- | 0.548 |
| 27 | N-methyl-aspartic_acid | 1596.45 |
1591.55 |
N.D.a | N.D.a | 1.00 |
- | 0.548 | - |
| 28 | N.D.a | N.D.a | 1.54 |
2.54 |
- | 1.65 |
- | 0.008 | |
| 29 | Homocysteine | N.D.a | N.D.a | 24.03 |
3.53 |
- | 1.15 |
- | 0.690 |
| 30 | Pyruvic acid | 27.36 |
24.18 |
34.04 |
13.85 |
0.88 |
0.70 |
0.548 | 0.421 |
| 31 | Acetoacetic acid | N.D.a | N.D.a | 261.04 |
143.80 |
- | 0.41 |
- | 0.690 |
| 32 | Lactic acid | 2758.08 |
2255.58 |
630.12 |
193.51 |
0.82 |
0.55 |
0.032 | 0.095 |
| 33 | Glycolic acid | 39.24 |
35.50 |
418.06 |
75.33 |
0.90 |
0.31 |
0.151 | 0.032 |
| 34 | 2-Hydroxybutyric acid | N.D.a | N.D.a | 3.25 |
2.91 |
- | 0.18 |
- | 0.690 |
| 35 | 3-Hydroxybutyric acid | 2.90 |
4.96 |
17.63 |
12.36 |
1.71 |
0.90 |
0.548 | 0.841 |
| 36 | Malonic acid | 1.07 |
1.10 |
2.90 |
2.37 |
1.03 |
0.82 |
0.841 | 0.016 |
| 37 | Succinic acid | 3.44 |
2.77 |
548.38 |
629.37 |
0.81 |
1.15 |
0.016 | 0.548 |
| 38 | Fumaric acid | 5.67 |
7.04 |
6.69 |
6.28 |
1.24 |
0.94 |
0.151 | 0.841 |
| 39 | Oxaloacetic acid | 1.27 |
1.17 |
9.67 |
4.69 |
0.92 |
0.49 |
0.222 | 0.032 |
| 40 | 1.95 |
1.71 |
7.90 |
5.46 |
0.88 |
0.69 |
0.222 | 0.095 | |
| 41 | 4-Hydroxyphenylacetic acid | 0.56 |
0.56 |
0.26 |
0.28 |
1.00 |
1.10 |
0.841 | 0.151 |
| 42 | Malic acid | 39.26 |
46.72 |
36.10 |
56.35 |
1.19 |
1.56 |
0.548 | 0.310 |
| 43 | 2-Hydroxyglutaric acid | 3.31 |
3.61 |
10.86 |
6.93 |
1.09 |
0.64 |
0.222 | 0.151 |
| 44 | cis-Aconitic acid | 0.78 |
0.66 |
3.48 |
3.52 |
0.84 |
1.01 |
0.032 | 0.151 |
| 45 | 4-Hydroxyphenyllactic acid | 0.93 |
0.95 |
0.46 |
0.36 |
1.03 |
0.77 |
0.222 | 0.032 |
| 46 | Citric acid | 12.15 |
14.32 |
N.D.a | N.D.a | 1.18 |
- | 0.548 | - |
| 47 | Myristic acid | 2.60 |
2.24 |
1.35 |
1.65 |
0.86 |
1.23 |
0.222 | 0.690 |
| 48 | Palmitoleic acid | 6.04 |
7.99 |
7.73 |
6.94 |
1.32 |
0.90 |
0.095 | 0.310 |
| 49 | Palmitic acid | 89.70 |
110.95 |
185.45 |
163.86 |
1.24 |
0.88 |
0.151 | 0.222 |
| 50 | Linoleic acid | 50.65 |
53.97 |
186.83 |
159.88 |
1.07 |
0.86 |
0.841 | 0.421 |
| 51 | Oleic acid | 61.03 |
74.17 |
108.93 |
89.33 |
1.22 |
0.82 |
0.151 | 0.032 |
| 52 | a-Linolenic acid | N.D.a | N.D.a | 2.02 |
1.73 |
- | 0.86 |
- | 0.151 |
| 53 | Stearic acid | 26.76 |
33.49 |
73.06 |
71.46 |
1.25 |
0.98 |
0.222 | 0.421 |
| 54 | Arachidonic acid | 52.84 |
64.75 |
151.64 |
106.26 |
1.23 |
0.70 |
0.095 | 0.095 |
| 55 | Gondoic acid | 1.36 |
1.82 |
1.45 |
1.26 |
1.34 |
0.86 |
0.151 | 0.310 |
| 56 | Eicosadienoic acid | 3.36 |
4.64 |
5.70 |
4.47 |
1.38 |
0.78 |
0.016 | 0.032 |
| 57 | Arachidic acid | 0.67 |
0.63 |
N.D.a | N.D.a | 0.93 |
- | 0.841 | - |
| 58 | Docosahexaenoic acid | N.D.a | N.D.a | 29.16 |
29.11 |
- | 1.00 |
- | 1.000 |
| 59 | Adrenic acid | 111.70 |
186.49 |
47.71 |
42.67 |
1.67 |
0.89 |
0.016 | 0.548 |
| 60 | Behenic acid | 0.95 |
0.95 |
N.D.a | N.D.a | 1.00 |
- | 0.402 | - |
| 61 | Nervonic acid | 1.00 |
1.20 |
0.76 |
0.62 |
1.20 |
0.81 |
0.095 | 0.151 |
| 62 | Lignoceric acid | 3.55 |
3.17 |
N.D.a | N.D.a | 0.89 |
- | 0.690 | - |
| 63 | Cerotic acid | N.D.a | N.D.a | N.D.a | N.D.a | - | - | - | - |
| 64 | 5,6-Dihydrouridine | 0.0037 |
0.0056 |
0.0041 |
0.010 |
1.50 |
1.01 |
0.095 | 0.151 |
| 65 | Pseudouridine | 0.0071 |
0.01 |
0.07 |
0.07 |
1.94 |
1.41 |
0.151 | 0.310 |
| 66 | Cytidine | 0.22 |
0.20 |
0.041 |
0.06 |
0.91 |
0.33 |
0.310 | 0.690 |
| 67 | Uridine | 0.09 |
0.15 |
0.98 |
0.32 |
1.63 |
0.69 |
0.032 | 0.008 |
| 68 | Inosine | 0.53 |
0.61 |
1.70 |
1.17 |
1.15 |
1.55 |
1.000 | 0.016 |
| 69 | Guanosine | 0.13 |
0.19 |
0.18 |
0.28 |
1.41 |
0.52 |
0.151 | 0.151 |
| 70 | Xanthosine | 0.012 |
0.010 |
0.48 |
0.25 |
0.84 |
1.43 |
0.222 | 0.016 |
| 71 | 1-Methylguanosine | 0.0035 |
0.0028 |
0.0032 |
0.0045 |
0.80 |
1.35 |
0.310 | 0.151 |
| 72 | N2-Methylguanosine | 0.0040 |
0.0032 |
0.0064 |
0.0086 |
0.80 |
0.70 |
0.222 | 0.151 |
| 73 | Adenosine | 0.03 |
0.08 |
0.35 |
0.25 |
3.13 |
1.30 |
0.032 | 0.008 |
| 74 | N2,N2-Dimethylguanosine | 0.0029 |
0.0027 |
0.0028 |
0.0036 |
0.96 |
1.46 |
0.222 | 0.151 |
| 75 | 5′-Deoxy-5′methylthioadenosine | 0.24 |
0.43 |
0.09 |
0.13 |
1.82 |
1.01 |
0.032 | 0.095 |
| 76 | 5-Methylcytidine | N.D.a | N.D.a | N.D.a | N.D.a | - | - | - | - |
| 77 | Picolinic acid | 0.21 |
0.14 |
0.99 |
0.65 |
0.67 |
0.66 |
0.056 | 0.032 |
| 78 | 5-Hydroxytryptophan | N.D.a | N.D.a | 0.04 |
0.05 |
- | 1.19 |
- | 0.841 |
| 79 | Kynurenine | 0.20 |
0.37 |
0.64 |
0.66 |
1.89 |
1.03 |
0.008 | 1.000 |
| 80 | Xanthurenic acid | 0.13 |
0.12 |
0.58 |
0.60 |
0.93 |
1.03 |
0.690 | 0.690 |
| 81 | Kynurenic acid | N.D.a | N.D.a | 0.0069 |
0.0032 |
- | 0.46 |
- | 1.000 |
| 82 | Epinephrine | 0.02 |
0.012 |
0.07 |
0.04 |
0.71 |
0.66 |
0.222 | 0.310 |
| 83 | Normetanephrine | 0.13 |
0.10 |
0.20 |
0.12 |
0.74 |
0.62 |
0.548 | 1.000 |
| 84 | DOPA | N.D.a | N.D.a | 0.13 |
0.08 |
- | 0.65 |
- | 0.222 |
| 85 | Serotonin | N.D.a | N.D.a | N.D.a | N.D.a | - | - | - | - |
| 86 | Anthranilic acid | N.D.a | N.D.a | 0.01 |
0.02 |
- | 1.36 |
- | 0.016 |
a N.D., Not determined.
b Values normalized to the corresponding control mean values and SD, standard deviation.
c Mann–Whitney U test.
A total of 78 metabolites were identified in the liver tissues of both the
control and sepsis groups, including 28 AAs, 16 OAs, 13 FAs, 12 NSs, and 9 KPs.
Quantitative comparisons of the metabolite profiles between the two groups are
presented in Table 2. Normalized values for each metabolite were visualized using
star plots, allowing an intuitive assessment of sepsis-induced metabolic
alterations (Table 2, Supplementary Fig. 4). Based on the Mann–Whitney
U test, significant differences in metabolite levels were observed in the liver
tissue between the control and sepsis groups. Specifically, the sepsis group
exhibited significant increases in
PCA and PLS-DA were performed for each tissue, and the results are presented in Figs. 3,4. Although the overall metabolic profiles of the control and sepsis groups showed some degree of similarity in the PCA score plot, they were not distinctly separated (Fig. 3). The PCA score plot of kidney, spleen, lung, and liver explained 50.4, 57.7, 58.1, and 68.6% of total variance in PC1 and PC2 (Fig. 3). The corresponding PCA loading scores for all tissues are listed in Table 2. PLS-DA revealed a clear separation between the two groups (Fig. 4). The variable importance in projection (VIP) scores derived from the PLS-DA models are shown in Supplementary Table 1.
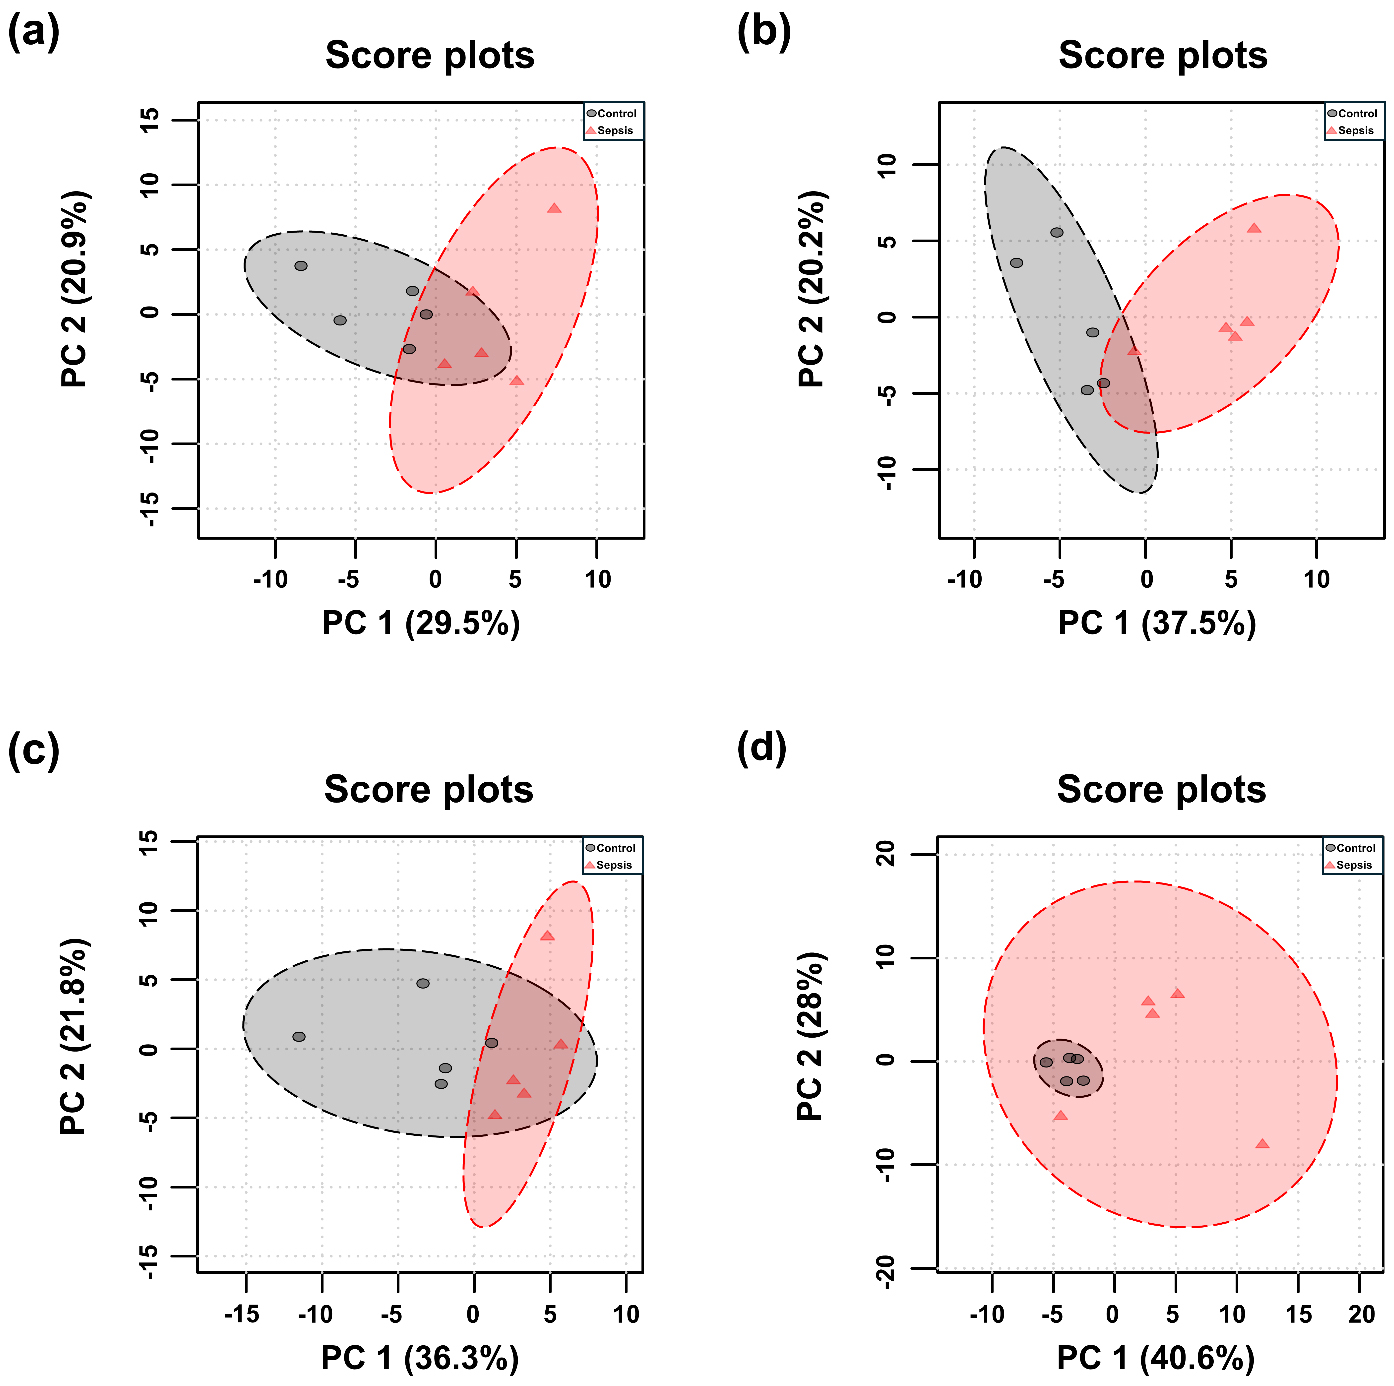 Fig. 3.
Principal component analysis (PCA) score plots of metabolites in tissues from control and sepsis mice. PCA score plots the (a) kidney, R2 = 0.38; p-value = 0.005, (b) spleen, R2 = 0.55; p-value = 0.007, (c) lung, R2 = 0.35; p-value = 0.018, and (d) liver R2 = 0.30; p-value = 0.054, based on the profiles of determined metabolites.
 Fig. 4.
Partial least squares discriminant analysis (PLS-DA) score plots of determined metabolites in tissues from control and sepsis mice. PLS-DA score plots are shown for the (a) kidney; R2 = 0.993, Q2 = 0.727, (b) spleen; R2 = 0.994, Q2 = 0.755, (c) lung; R2 = 0.983, Q2 = 0.609, and (d) liver; R2 = 0.951, Q2 = 0.454.
Metabolites with a VIP score greater than 1.0 were considered to have a strong
influence on group separation in PLS-DA. Key metabolites in the kidney included
leucine, proline, phenylalanine, 4-hydroxyproline, ornithine, lysine, tyrosine,
tryptophan, lactic acid, 2-hydroxybutyric acid, malonic acid, succinic acid,
4-hydroxyphenylacetic acid, malic acid, cis-aconitic acid,
5,6-dihydrouridine, pseudouridine, cytidine, uridine, xanthosine,
1-methylguanosine, N2-methylguanosine, N2,N2-dimethylguanosine,
5-hydroxytryptophan, kynurenic acid, and epinephrine (Supplementary Table
1). In the spleen, metabolites with VIP
In the univariate and multivariate analyses, no metabolites were commonly
identified across all four tissues (Fig. 5). However, several overlapped between
two or three tissues. Cis-aconitic acid was elevated in the kidney and spleen but
reduced in the lung, whereas xanthosine increased in the kidney and spleen but
decreased in the liver. Uridine and adenosine were upregulated in the lung but
downregulated in the spleen and liver. Additionally, eicosadienoic acid was
increased in both the spleen and lung but decreased in the liver. In the spleen
and liver,
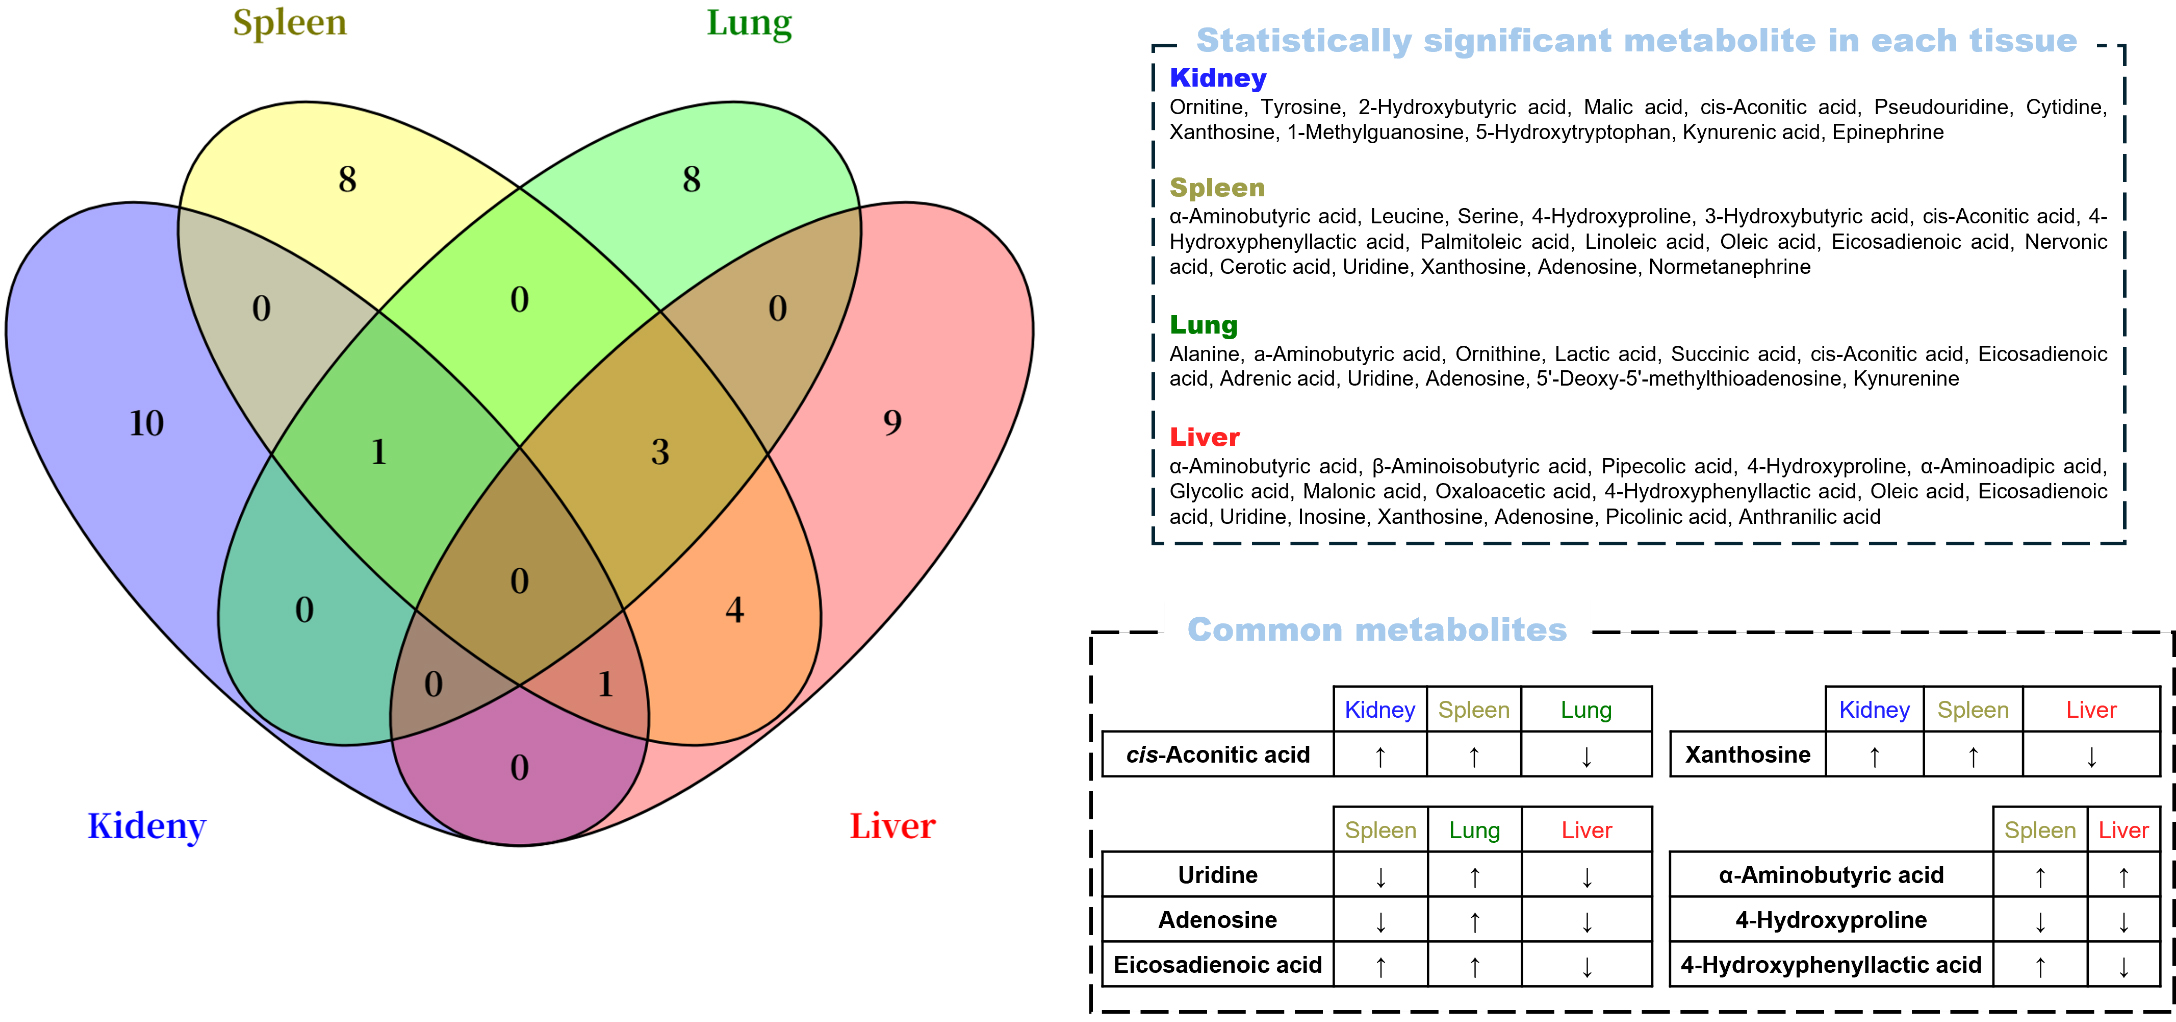 Fig. 5.
Venn diagram containing significant metabolites by the
univariate and multivariate analyses (p
Based on the Kyoto Encyclopedia of Genes and Genomes database, potential
discriminatory metabolic pathways were identified using a pathway impact value
threshold of
 Fig. 6.
Metabolic pathway analysis of determined metabolites in tissues from control and sepsis mice. Major metabolic pathways identified from determined metabolites in the (a) kidney, (b) spleen, (c) lung, and (d) liver.
Sepsis is a complex syndrome characterized by considerable clinical heterogeneity, in which organ dysfunction is the primary contributor to morbidity and mortality. The mechanisms underlying organ dysfunction in sepsis possibly involve impaired tissue oxygen delivery; diverse inflammatory responses, including endothelial and microvascular dysfunction; dysregulation of the immune and autonomic nervous systems; and alterations in cellular metabolism [20]. Organ dysfunction resulting from sepsis poses a critical clinical challenge, underscoring the need for biomarkers capable of early diagnosis. Therefore, in this study, we conducted targeted metabolomic analyses of kidney, spleen, lung, and liver tissues to identify potential biomarkers for sepsis and elucidate significantly altered metabolic pathways. For each tissue sample, metabolites showing significant changes in univariate and multivariate analyses were selected, and those involved in sepsis-altered pathways were designated as biomarkers.
In the kidneys, four metabolites (tyrosine, epinephrine, 5-hydroxytryptophan,
and kynurenic acid) were identified as potential biomarkers of sepsis-induced
injury. The elevated levels of tyrosine observed in the kidney tissue may
indicate enhanced activation of inflammatory responses induced by sepsis, as
tyrosine serves as a precursor for catecholamines and various intracellular
signaling molecules [21]. This accumulation of tyrosine may reflect the
progression of renal injury, potentially through its involvement in the
regulation of inflammation and activation of cellular signaling pathways. The
kynurenine pathway is the principal route through which the amino acid tryptophan
is metabolized; its first step is catalyzed by indoleamine 2,3-dioxygenase (IDO).
During sepsis, elevated levels of kynurenine and activation of IDO are reportedly
associated with infection-driven immune responses, particularly the release of
interferon-
In the spleen, 10 metabolites, including serine, 4-hydroxyproline, normetanephrine, xanthosine, uridine, adenosine, succinic acid, cis-aconitic acid, linoleic acid, and eicosadienoic acid, were identified as potential biomarkers indicative of sepsis-induced tissue injury. Serine is a nonessential amino acid that participates in fatty acid oxidation and muscle metabolism [25]. In sepsis, increased fatty acid oxidation for adenosine triphosphate (ATP) production may lead to serine depletion due to the metabolic demand. In addition, serine has been shown to play a role as an early tissue- and cell type-specific regulator of lipid and mitochondrial metabolic pathways in sepsis [26]. Similarly, 4-hydroxyproline, a marker of collagen breakdown [27], was unexpectedly reduced in septic spleens, likely due to decreased proline availability, limiting its synthesis. Normetanephrine, derived from catecholamine metabolism via catechol-O-methyltransferase, typically reflects sympathetic activity. Although catecholamine levels increase in sepsis [28], normetanephrine levels decrease in the spleen, potentially because of norepinephrine depletion from excessive sympathetic activation [29]. In sepsis, activation of the Xanthine oxidase-ROS axis and enhanced purine catabolism are consistent with the reported elevation of xanthosine under infection- and immune-activated conditions However, the increase in xanthosine itself in sepsis cohorts requires further confirmation [30, 31]. Adenosine, a key energy mediator, is generated from ATP degradation and modulates inflammation via A2A receptors [32, 33]. Uridine, the only pyrimidine nucleoside that was significantly altered in the spleen, showed a marked decrease, possibly due to RNA synthesis and immune cell proliferation. Its role in oxidative stress modulation via ferroptosis inhibition and Keap1–Nrf2 signaling is relevant to sepsis pathology [34, 35]. The increase in cis-aconitic acid levels observed in both the kidney and spleen implied TCA cycle dysfunction and impaired energy production during sepsis. Additionally, early sepsis is associated with enhanced lipolysis and insulin resistance [36, 37, 38], driving the use of fatty acids as energy sources. Elevated levels of monounsaturated FAs (palmitoleic and oleic acid), synthesized by Stearoyl-CoA desaturase 1 in the endoplasmic reticulum [39], align with increased lipid mobilization and may support immune activation and membrane remodeling. Similarly, higher levels of omega-6 polyunsaturated FAs and linoleic and eicosadienoic acids suggest enhanced synthesis of pro-inflammatory eicosanoids [40].
In the lung tissue, eight metabolites (alanine,
In liver tissue, seven metabolites (
Multi-omics investigations could mechanistically anchor our organ-specific signatures to energy pathways. In a sequential renal biopsy model of experimental sepsis, early and stepwise impairments in oxidative phosphorylation with increased uncoupling were documented prior to macro-hemodynamic alterations [24]. Recent reviews further emphasize that metabolic reprogramming particularly a shift toward glycolysis with suppression of fatty-acid oxidation drives injury and recovery trajectories in AKI [55]. Therefore, the metabolites identified in this study may serve as potential biomarkers for the early diagnosis of sepsis-induced organ-specific injuries. These findings are expected to provide an important foundation for prognosis prediction and the development of personalized therapeutic strategies for patients with sepsis.
In this study, targeted metabolomic analysis was conducted on kidney, spleen,
lung, and liver tissues of a mouse model of sepsis to characterize organ-specific
metabolic alterations and identify potential biomarkers indicative of
sepsis-induced organ injury. A total of 29 metabolites were selected through
statistical and pathway analyses that revealed distinct metabolic changes
specific to each organ. Notably, four metabolites in the kidney (tyrosine,
epinephrine, 5-hydroxytryptophan, and kynurenic acid), 10 metabolites in the
spleen (including serine, 4-hydroxyproline, normetanephrine, xanthosine, uridine,
adenosine, succinic acid, cis-aconitic acid, linoleic acid, and
eicosadienoic acid), 8 metabolites in the lung (such as alanine,
LC–MS/MS, Liquid chromatography-tandem mass spectrometry; GC–MS/MS, Gas chromatography-tandem mass spectrometry; PCA, Principal component analysis; PLS-DA, partial least squares discriminant analysis; MTA, 5′-deoxy-5′methylthioadenosine; AA, Amino acid; OA, Organic acid; FA, Fatty acid; NSs, Nucleosides; KPs, Kynurenine pathway metabolites; IS, Internal standard; EOC, Ethoxycarbonylation; TBDMS, Tert-butyldimethylsilylation; MO, Methoximation; ECF, Ethylchloroformate; MTBSTFA, N-Methyl-N-(tert-butyldimethylsilyl) trifluoroacetamide; PCA, Principal component analysis; PLS-DA, Partial least square discriminant analysis; VIP, Variable importance in projection; TCA, Tricarboxylic acid; IDO, 2,3-Dioxygenase; ATP, Adenosine triphosphate; ROS, Reactive oxygen species.
The data presented in this study are contained in this article/supplementary material or available upon request from the corresponding author.
MJP designed the study, wrote, edited the manuscript, and supervised the study. MJ and BC performed sample preparation and analysis and wrote the manuscript. CK and JL performed the sample collection and sample preparation. All authors contributed to editorial changes in the manuscript. All authors read and approved the final manuscript. All authors have participated sufficiently in the work and agreed to be accountable for all aspects of the work.
All animal experiments were conducted at Konkuk University in accordance with the ARRIVE guidelines as well as the institutional guidelines of the Institutional Animal Care and Use Committee (IACUC) of Konkuk University (approval number: KU17044-2).
We thank Dr. In Duk Jung of Konkuk University for providing search materials for this study.
This study was supported by a National Research Foundation of Korea (NRF) grant funded by the Ministry of Education, Science, and Technology (2023R1A2C1003696).
The authors declare no conflict of interest.
Supplementary material associated with this article can be found, in the online version, at https://doi.org/10.31083/FBL45558.
References
Publisher’s Note: IMR Press stays neutral with regard to jurisdictional claims in published maps and institutional affiliations.