
- Academic Editors
†These authors contributed equally.
Since its introduction in 2008, sorafenib has remained the standard first-line systemic treatment for advanced hepatocellular carcinoma (HCC). Nevertheless, its clinical benefits are often compromised by the rapid emergence of drug resistance. This study explores the molecular mechanisms underlying sorafenib resistance, with particular emphasis on the involvement of connective tissue growth factor (CCN2/CTGF) in the regulation of c-Met signaling pathways.
We began by evaluating CCN2 expression levels in HCC tissue samples via immunohistochemistry and analyzing their correlation with clinicopathological characteristics. To functionally characterize CCN2, we established stable HCC cell lines with either knockdown or overexpression of the gene using lentiviral transduction. The effects of CCN2 on cellular proliferation and drug resistance were evaluated using cell counting kit-8 (CCK-8) and colony formation assays. To elucidate the downstream signaling mechanisms, a tyrosine kinase PCR array was employed to identify expression changes within the tyrosine kinase superfamily after CCN2 knockdown. Further investigation into the molecular mechanism by which CCN2 promotes sorafenib resistance was conducted using real-time quantitative PCR (RT-qPCR), western blotting, and immunofluorescence. Finally, the therapeutic potential of co-targeting CCN2 and sorafenib was validated in a nude mouse xenograft tumor model.
Our results establish that CCN2 overexpression significantly enhances HCC proliferation, while also inducing resistance to sorafenib. Mechanistically, we identified that CCN2 binds to integrin αV, triggering focal adhesion kinase (FAK) phosphorylation, which in turn promotes yes-associated protein (YAP) nuclear translocation and leads to the transcriptional upregulation of c-Met. This proposed signaling axis was consistently supported by tyrosine kinase PCR array, co-immunoprecipitation, and western blot analyses. Ultimately, in vivo experiments confirmed that simultaneously targeting CCN2 and administering sorafenib produces a synergistic effect, markedly inhibiting tumor growth and restoring therapeutic sensitivity.
These results not only elucidate a novel CCN2/FAK/YAP/c-Met axis in sorafenib resistance but also provide a mechanistic rationale for dual-targeting strategies to improve outcomes in advanced HCC.
Hepatocellular carcinoma (HCC) presents a major global health challenge, being the sixth most commonly diagnosed cancer and the third leading cause of cancer-related deaths worldwide [1]. The burden of this disease is particularly acute in China, where it is the second deadliest malignancy, resulting in 316,500 annual fatalities and trailing only lung cancer [2, 3]. This disparity is largely driven by the dual challenges of late diagnosis and limited treatment options for advanced disease. Although surgical resection can achieve five-year survival rates of 50–60% in early-stage HCC, over 80% of Chinese patients are diagnosed at an advanced stage, often due to a high background prevalence of hepatitis B/C-induced cirrhosis. Consequently, more than 60% of patients are limited to palliative care options, primarily including transarterial chemoembolization (TACE) or tyrosine kinase inhibitors [4, 5, 6].
While the tumor microenvironment is increasingly recognized as a critical factor
in HCC pathogenesis—driving hepatic fibrogenesis, epithelial-mesenchymal
transition, and metastasis—current therapeutic strategies remain predominantly
focused on directly targeting tumor cells, leaving microenvironmental modulation
as a relatively unexplored avenue. This gap in focus likely contributes to the
persistently poor prognosis of advanced HCC [7, 8]. Within this specialized niche,
bidirectional tumor-stroma interactions facilitate tumor progression, with CCN
family proteins acting as key mediators. Among them, CCN2, a cysteine-rich
matricellular protein, plays multifunctional roles in regulating cell migration,
angiogenesis, and proliferation [9, 10]. Research has established that CCN2 plays
a significant role in multiple aspects of tumor progression—including growth,
migration, invasion, angiogenesis, and drug resistance—in cancers such as
breast cancer, osteosarcoma, prostate cancer, and hepatocellular carcinoma
[11, 12, 13, 14]. Its involvement in chemoresistance has become a key research focus. For
instance, CCN2 was reported to enhance doxorubicin resistance in osteosarcoma by
upregulating ATP-binding cassette subfamily G member 2 (ABCG2) expression [15],
while epigallocatechin-3-gallate was shown to reduce osimertinib resistance in
non-small cell lung cancer by targeting CCN2. In glioblastoma, CCN2 promotes
temozolomide resistance via TGF-
The c-Met tyrosine kinase receptor, encoded by the Mesenchymal Epithelial Transition Factor (MET) proto-oncogene, has emerged as a key therapeutic target in oncology. As the principal receptor for hepatocyte growth factor (HGF), it orchestrates critical oncogenic processes including cytoskeletal remodeling, tumor proliferation, and chemoresistance [18, 19]. Clinical observations correlate c-Met overexpression with aggressive tumor phenotypes and therapeutic resistance across multiple malignancies [20, 21]. Notably, while CCN2-c-Met interactions have been implicated in HCC drug resistance, their precise mechanistic contributions require further elucidation.
The Food and Drug Administration (FDA) approval of sorafenib in 2008 marked a milestone in the treatment of advanced HCC. However, the clinical benefits of this multi-kinase inhibitor are often curtailed by the rapid development of resistance [22]. Based on existing evidence of chemoresistance mechanisms, we propose that CCN2-mediated activation of the c-Met pathway may be a key driver of sorafenib resistance in CCN2-overexpressing HCC. Therefore, this study systematically examines the link between CCN2 expression and malignant progression, and evaluates its role in modulating sorafenib sensitivity. By combining CCN2 inhibition with sorafenib in experimental models, we delineate the molecular mechanism of this resistance via the CCN2/c-Met axis. Our integrated approach aims to provide a preclinical rationale for novel combination strategies that target CCN2 signaling to improve sorafenib efficacy in HCC.
This retrospective study utilized archived paraffin-embedded tissue specimens
and clinical records from 60 HCC patients who underwent surgical resection at the
General Hospital of Ningxia Medical University between 2019 and 2022. Patient
inclusion required: (1) postoperative pathological confirmation of HCC, (2) no
history of prior anticancer therapy, (3) availability of complete clinical data,
and (4) procurement of both tumor and adjacent normal tissue samples (located
Antibodies included CCN2 (ab6992, Abcam, Cambridge, Cambridgeshire, UK);
Paraffin-embedded tissue sections underwent sequential deparaffinization using
xylene gradients and rehydration through graded ethanol series. Antigen retrieval
was achieved through microwave irradiation in sodium citrate buffer (pH 6.0),
followed by natural cooling to room temperature. The staining protocol included
three cycles of PBS washing (5 min each), endogenous peroxidase inactivation with
3% H2O2 (10 min, room temperature), and non-specific binding blockage
using 5% BSA (30 min, RT). Primary antibody incubation was performed at 4
°C overnight, followed by HRP-conjugated secondary antibody (1:200)
treatment for 1 h at room temperature. Signal visualization employed
3,3′-Diaminobenzidine (DAB) chromogenic substrate with hematoxylin
counterstaining, culminating in ethanol dehydration, xylene clearing, and neutral
resin mounting. Two blinded pathologists independently evaluated staining
outcomes using a semi-quantitative scoring system: (1) Positive cell proportion:
1 (
Cell lines including MHCC97L, MHCC97H, HCCLM3, Hep3B, Huh-7, and LO2 were all kindly provided by the Liver Disease Research Institute affiliated with Fudan University in Shanghai. These cells were cultured in Dulbecco’s modified Eagle medium (DMEM, 2329225, VivaCell, Shanghai, China) supplemented with 10% fetal bovine serum (FSP500, ExCell Bio, Shanghai, China) and 1% penicillin-streptomycin (P1400, Solarbio, Beijing, China). All cells were maintained at 37 °C with 5% CO2. All cell lines used in this study were authenticated by short tandem repeat (STR) profiling and confirmed to be mycoplasma-negative. Lentiviruses for CCN2 overexpression and knockdown were purchased from Beijing Tsingke Biotech Co., Ltd. (China). Lentiviral transfections were conducted according to the manufacturer’s instructions, with Lipo3000 (L3000015, Invitrogen, Carlsbad, CA, USA) used as recommended. Screening was performed using puromycin (P8230, Solarbio, Beijing, China).
Total RNA was extracted from cells using the MolPure® Cell/Tissue Total RNA Kit (19221ES50, Yeasen Biotechnology, Shanghai, China), and cDNA was synthesized using the PrimeScript™ RT Master Mix (Perfect Real Time) (RR036A, Takara Bio, Kyoto, Japan). Subsequently, RT-qPCR reactions were performed using the TB Green® Premix Ex Taq™ RNaseH Plus kit (RR820A, Takara Bio, Kyoto, Japan). The primers (Table 1) used in this study were designed and synthesized by Tsingke Biotech Co., Ltd. (Beijing, China).
| Gene | Primer sequences (5′-3′) | |
| CCN2 | Forward | CTGTGGAGTATGTACCGACGGCC |
| Reverse | ATGGCAGGCACAGGTCTTGATGAAC | |
| MET | Forward | GTGAATTAGTTCGCTACGATGC |
| Reverse | GTCAGAGGATACTGCACTTGTCG | |
| GAPDH | Forward | GGCAAATTCCATGGCACCGTCAAGG |
| Reverse | GCCAGCATCGCCCCACTTGATTTTG |
RT-qPCR, real-time quantitative polymerase chain reaction; CCN2, Cellular Communication Network Factor 2; MET, Mesenchymal-Epithelial Transition Factor; GAPDH, Glyceraldehyde-3-Phosphate Dehydrogenase.
Protein extraction from hepatic carcinoma specimens and cultured cells was
performed using radioimmunoprecipitation (RIPA) lysis buffer (P0013B, Beyotime
Biotechnology, Shanghai, China) supplemented with protease/phosphatase
inhibitors. After 20-min ice incubation, lysates were clarified by centrifugation
(12,000
In the lower chamber of a Transwell insert (16122062, Corning, New York, NY,
USA), 500 µL of DMEM containing 10% fetal bovine serum was added, while
200 µL of DMEM containing 8
Hepatocellular carcinoma cells were plated in six-well plates and cultured to confluence, while wounds were inflicted using a 200 µL pipette tip. After removing cell debris with PBS, cells were cultured in serum-free medium. Wound closure was monitored using an inverted microscope (DMi8, Leica, Wetzlar, Hesse, Germany) every 0 and 24 h.
Cell proliferation was assessed using the Cell Counting Kit-8 (B34304, Biomake, Beijing, China). HCC cells were seeded in 96-well plates at a density of 2000 cells per well and cultured at 37 °C for 12, 24, 48, 72, and 96 h, respectively. Each well was subsequently treated with 10 µL of CCK-8 solution and 100 µL of DMEM. Upon incubation for 2 h, absorbance was measured at 450 nm using a microplate reader (Multiskan SkyHigh, Thermo Scientific, Waltham, MA, USA).
Hepatocellular carcinoma cells were seeded in 6-well plates at a density of 500 cells per well. After 14 d of culture, the cells were fixed with 4% paraformaldehyde for 15 min, washed three times with PBS, and stained with 0.1% crystal violet for 30 min. Afterwards, the number of colonies was counted using ImageJ software (version 1.8.0, National Institutes of Health, Bethesda, MD, USA).
Cells were seeded into 96-well plates at a density of 5000 cells per well and incubated. Once the cells adhered, varying concentrations of Sorafenib (0 µM, 1.25 µM, 2.5 µM, 5 µM, 10 µM, 20 µM, 40 µM, and 80 µM) were added according to the experimental groups. Upon further incubation for 24 h, CCK-8 solution was added, the absorbance at 450 nm was measured, and cell viability was calculated.
RNA-seq data for HCC were obtained from The Cancer Genome Atlas (TCGA) database (https://portal.gdc.cancer.gov/). Based on the median expression level of CCN2, HCC patients were categorized into high-expression (n = 187) and low-expression (n = 187) groups, and differentially expressed genes between these two groups were identified. The resulting CCN2-associated differentially expressed genes were subsequently analyzed and functionally enriched using the GSEA platform (https://www.gsea-msigdb.org/gsea/index.jsp). Transcription factors potentially regulating the c-Met gene were predicted via the humanTFDB database. Finally, Kyoto Encyclopedia of Genes and Genomes (KEGG) pathway enrichment analysis was conducted on these c-Met-related transcription factors using The Database for Annotation, Visualization and Integrated Discovery (DAVID) database (https://davidbioinformatics.nih.gov/summary.jsp). The correlation between Met and Yap expression was analyzed using the Gene Expression Profiling Interactive Analysis (GEPIA) database (http://gepia.cancer-pku.cn/).
Protein complexes were isolated using Protein A/G Magnetic Beads (88802, Thermo
Scientific, Carlsbad, CA, USA) according to manufacturer specifications. For
antibody conjugation, 20 µL bead suspension was incubated with either
control IgG (2729, Cell Signaling Technology, Danvers, MA, USA) or CCN2-specific antibody (50 µg/mL final concentration, ab6992, Abcam, Cambridge, Cambridgeshire, UK) under
rotary agitation (25 °C, 1 h). Following magnetic separation (800
Eluted proteins were denatured in 5
Cells were plated in 24-well plates with cover slips and cultured to 50%–70% confluence. The medium was removed, and cells were washed three times with PBS, fixed with 4% paraformaldehyde at room temperature for 20 min, and washed again three times with PBS. Cells were then permeabilized with 0.3% Triton X-100 for 20 min, blocked with 5% BSA for 1 h, and incubated with primary antibodies overnight at 4 °C. Following this, cells were incubated with fluorescent secondary antibodies for 1 h at room temperature, stained with DAPI for nuclear counterstaining, and mounted. Images were captured using a fluorescence inverted microscope (DMi8, Leica, Wetzlar, Hesse, Germany) .
Female BALB/c-nu nude mice (4–5 weeks old) were obtained from Beijing Vital
River Laboratory Animal Technology Co., Ltd. and housed under specific
pathogen-free (SPF) conditions. Subcutaneous xenograft models were established by
injecting 150 µL of a cell suspension containing 5
Statistical analysis and graphical presentation were conducted using SPSS
(version 26.0, IBM, Armonk, NY, USA) and GraphPad Prism (version 8.0, San Diego,
Boston, MA, USA). For quantitative data following a normal distribution,
comparisons between two groups were made using t-tests, and comparisons
among multiple groups were performed using analysis of variance (ANOVA). The
association between CCN2 and clinical pathological characteristics was further
assessed using t-tests, Wilcoxon rank-sum tests, chi-square tests, and
Fisher’s exact tests, with p
Clinical data and specimens from 60 HCC patients treated at the General Hospital
of Ningxia Medical University between 2019 and 2022 were analyzed in this study.
Immunohistochemical analysis localized CCN2 predominantly to the cytoplasm of HCC
cells (Fig. 1A). This study investigated the correlation between CCN2 expression
levels and the clinicopathological characteristics of HCC patients in a
real-world study (Table 2). The results revealed that CCN2 expression was
significantly associated with a history of hepatitis B, aspartate
aminotransferase (AST) levels, the severity of liver cirrhosis, and tumor size
(p
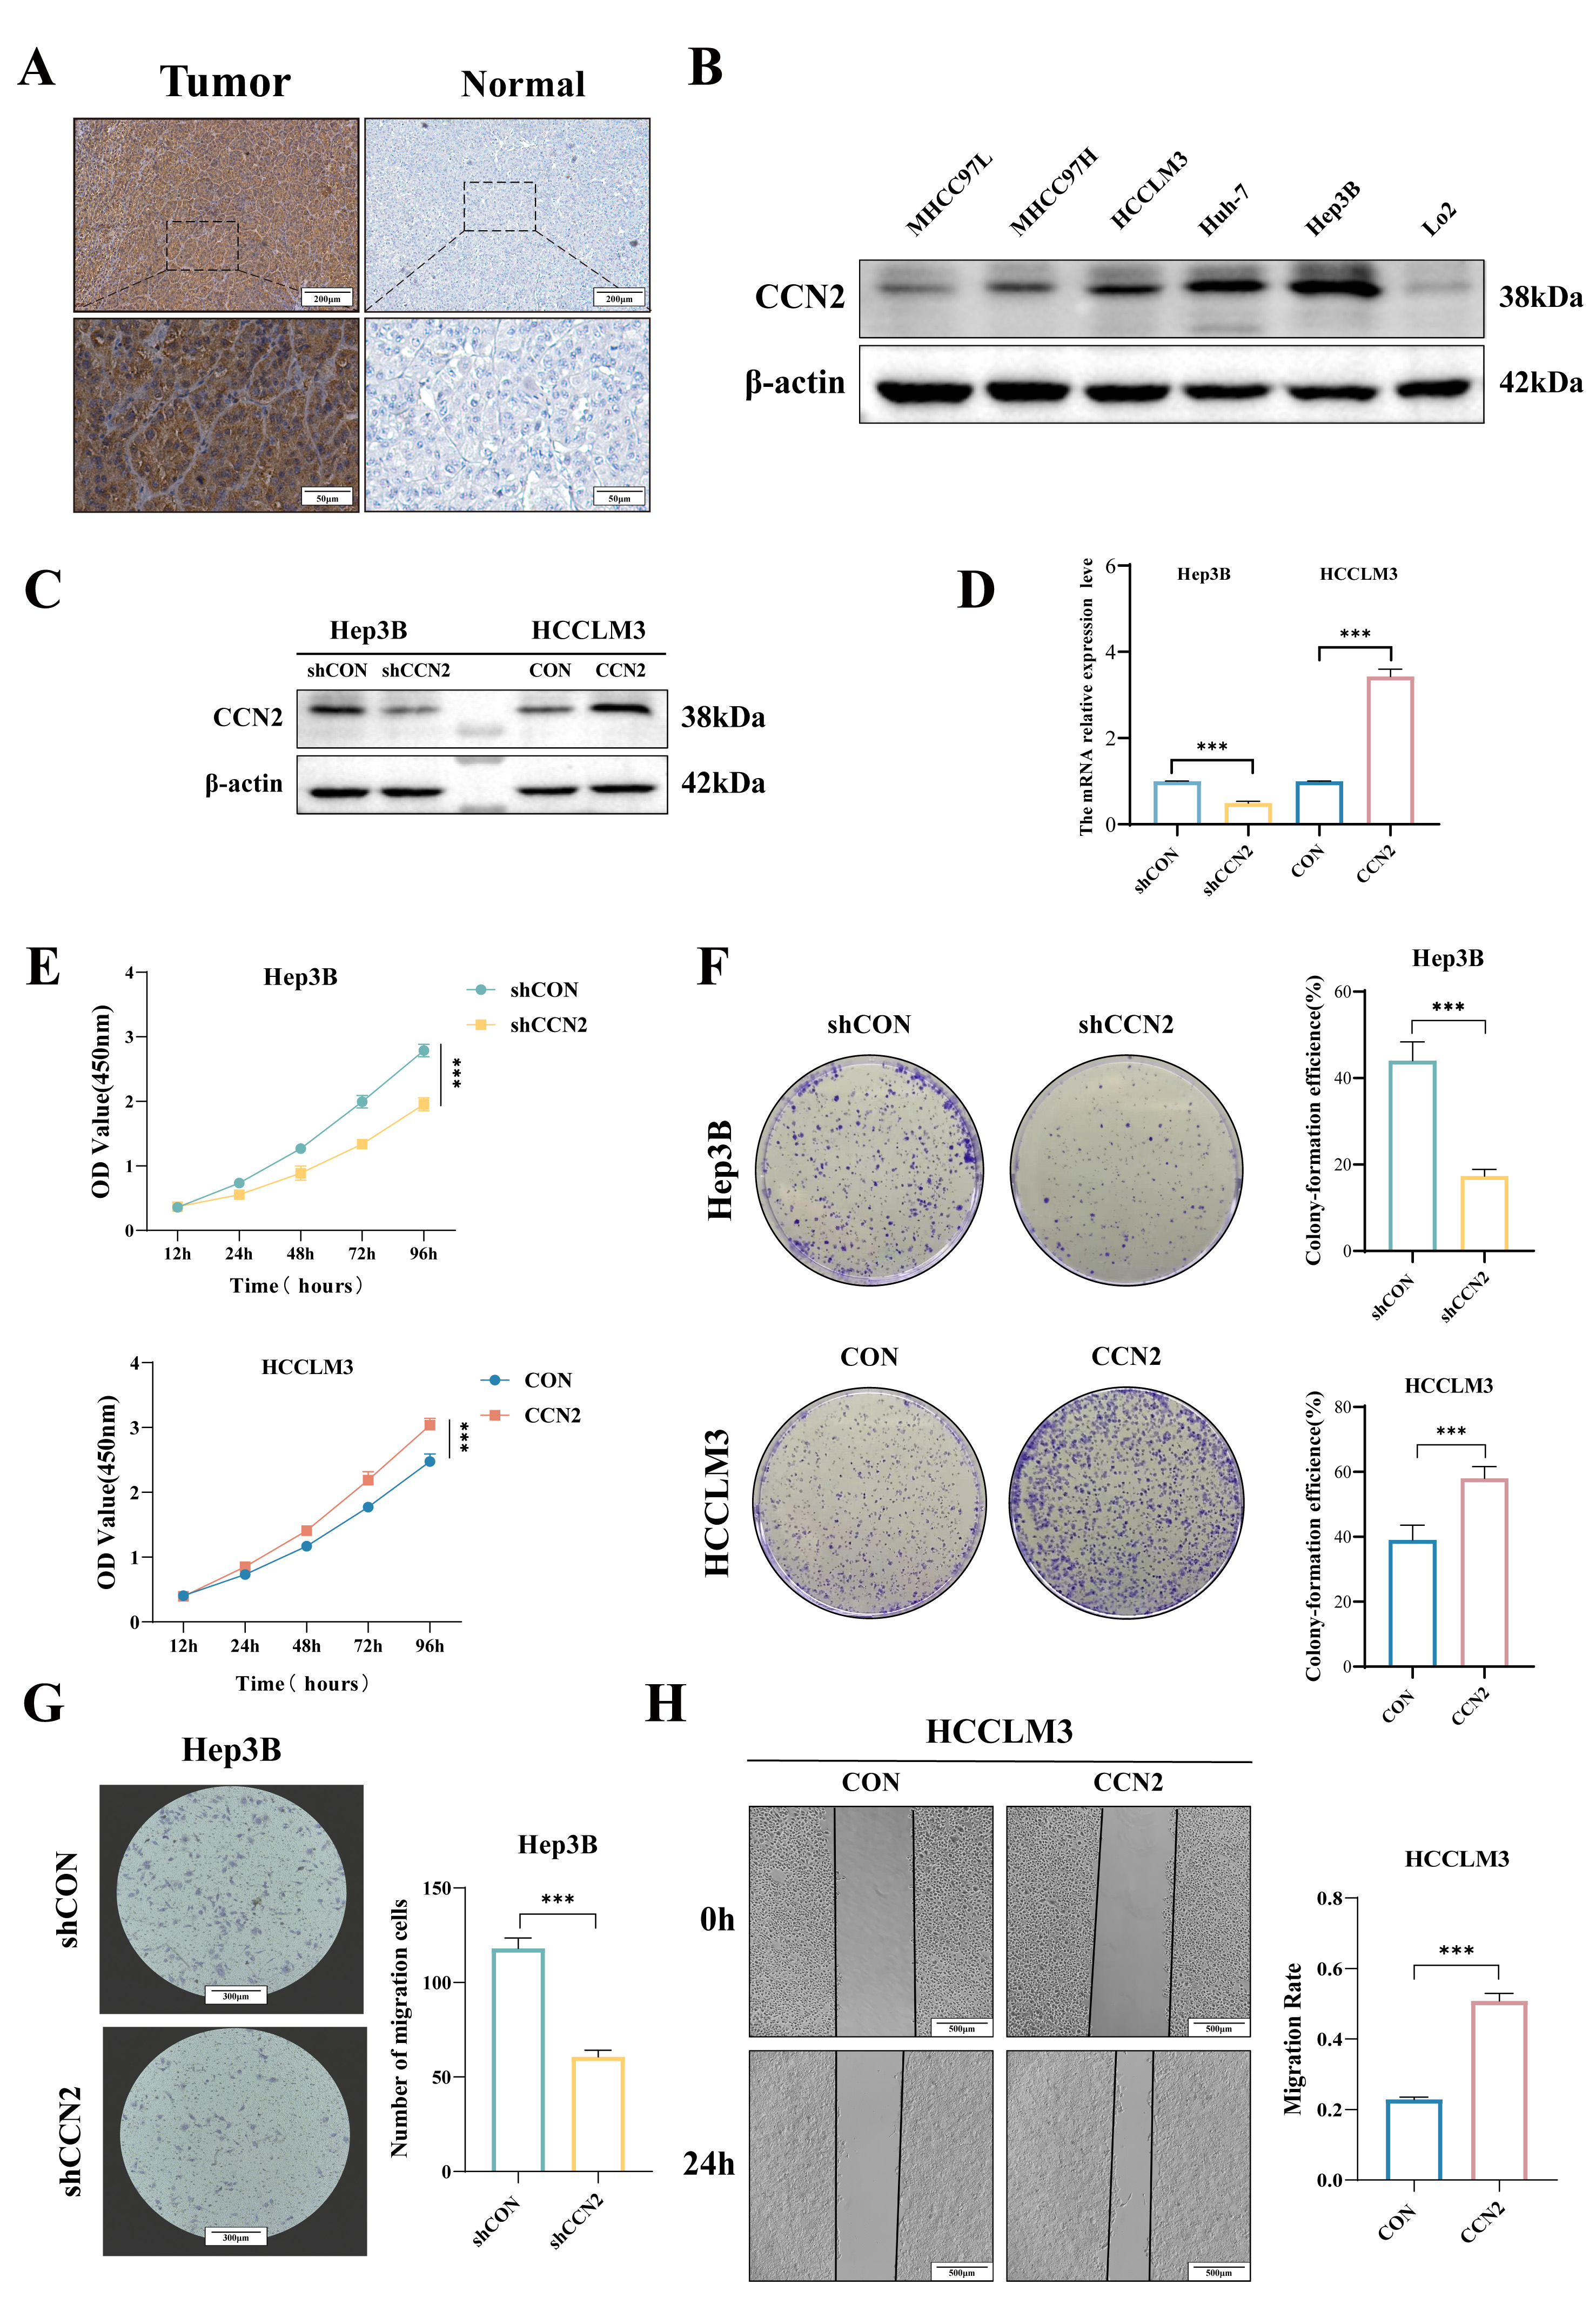 Fig. 1.
Expression and biological functions of CCN2 in HCC. (A)
Immunohistochemical assessment of CCN2 expression in hepatocellular carcinoma
tissues. Scale bar: 200 µm (upper) and 50 µm (lower). (B) Western
blot analysis of CCN2 expression levels in hepatocellular carcinoma cell lines.
(C,D) Establishment of stable hepatocellular carcinoma cell lines with CCN2
overexpression and knockdown. (E,F) CCK-8 and colony formation assays to evaluate
the effects of CCN2 on hepatocellular carcinoma cell proliferation and clonogenic
potential. (G,H) Transwell and wound-healing assay to assess the effects of CCN2
on hepatocellular carcinoma cell migration. Scale bar: 300 µm (G) and 500
µm (H). Per group n = 3, ***p
| Characteristics | Expression of CCN2 | Statistic | p-value | ||
| Low (n = 29) | High (n = 31) | ||||
| Age (years) | |||||
| 9 (50%) | 9 (50%) | 0.029 | 0.866 | ||
| 20 (47.6%) | 22 (52.4%) | ||||
| Gender | |||||
| Female | 8 (57.1%) | 6 (42.9%) | 0.568 | 0.451 | |
| Male | 21 (45.7%) | 25 (54.3%) | |||
| HBsAg, n (%) | |||||
| Positive | 23 (42.6%) | 31 (57.4%) | 5.013 | 0.025 | |
| Negative | 6 (100%) | 0 (0%) | |||
| AFP (ng/mL) | |||||
| 12 (66.7%) | 6 (33.3%) | 3.461 | 0.063 | ||
| 17 (40.5%) | 25 (59.5%) | ||||
| TB (µmol/L) | |||||
| 29 (49.2%) | 30 (50.8%) | 1.000 | |||
| 0 (0%) | 1 (100%) | ||||
| ALB (g/L) | |||||
| 17 (44.7%) | 21 (55.3%) | 0.537 | 0.464 | ||
| 12 (54.5%) | 10 (45.5%) | ||||
| AST (U/L) | |||||
| 26 (72.2%) | 10 (27.8%) | 19.665 | |||
| 3 (13%) | 20 (87%) | ||||
| ALT (U/L) | |||||
| 21 (58.3%) | 15 (41.7%) | 2.636 | 0.104 | ||
| 8 (36.4%) | 14 (63.6%) | ||||
| ALP (U/L) | |||||
| 26 (47.3%) | 29 (52.7%) | 0.006 | 0.938 | ||
| 3 (60%) | 2 (40%) | ||||
| Degree of cirrhosis | |||||
| Mild | 25 (73.5%) | 9 (26.5%) | 19.946 | ||
| Moderate & Severe | 4 (15.4%) | 22 (84.6%) | |||
| Tumor size (cm) | |||||
| 21 (60%) | 14 (40%) | 4.578 | 0.032 | ||
| 8 (32%) | 17 (68%) | ||||
| Microvascular tumor thrombus, n (%) | |||||
| No | 15 (60%) | 10 (40%) | 2.336 | 0.126 | |
| Yes | 14 (40%) | 21 (60%) | |||
| T stage, n (%) | |||||
| T1–T2 | 21 (55.3%) | 17 (44.7%) | 1.993 | 0.158 | |
| T3–T4 | 8 (36.4%) | 14 (63.6%) | |||
| Capsule of membrane | |||||
| No | 17 (53.1%) | 15 (46.9%) | 0.442 | 0.506 | |
| Yes | 12 (44.4%) | 15 (55.6%) | |||
| Vascular invasion | |||||
| No | 13 (43.3%) | 17 (56.7%) | 0.601 | 0.438 | |
| Yes | 16 (53.3%) | 14 (46.7%) | |||
HCC, hepatocellular carcinoma.
The in vitro sensitivity of various hepatocellular carcinoma cell lines
(MHCC97L, MHCC97H, HCCLM3, Huh-7, Hep3B) and the normal LO2 cell line to
sorafenib was assessed, yielding IC50 values of 16.92, 21.76, 17.42, 11.66,
10.48, and 14.84 µM, respectively (Fig. 2A). Subsequent experiments
demonstrated that CCN2 overexpression in HCCLM3 cells increased the sorafenib
IC50 (CON vs. OV: 16.95 vs. 23.29 µM, p
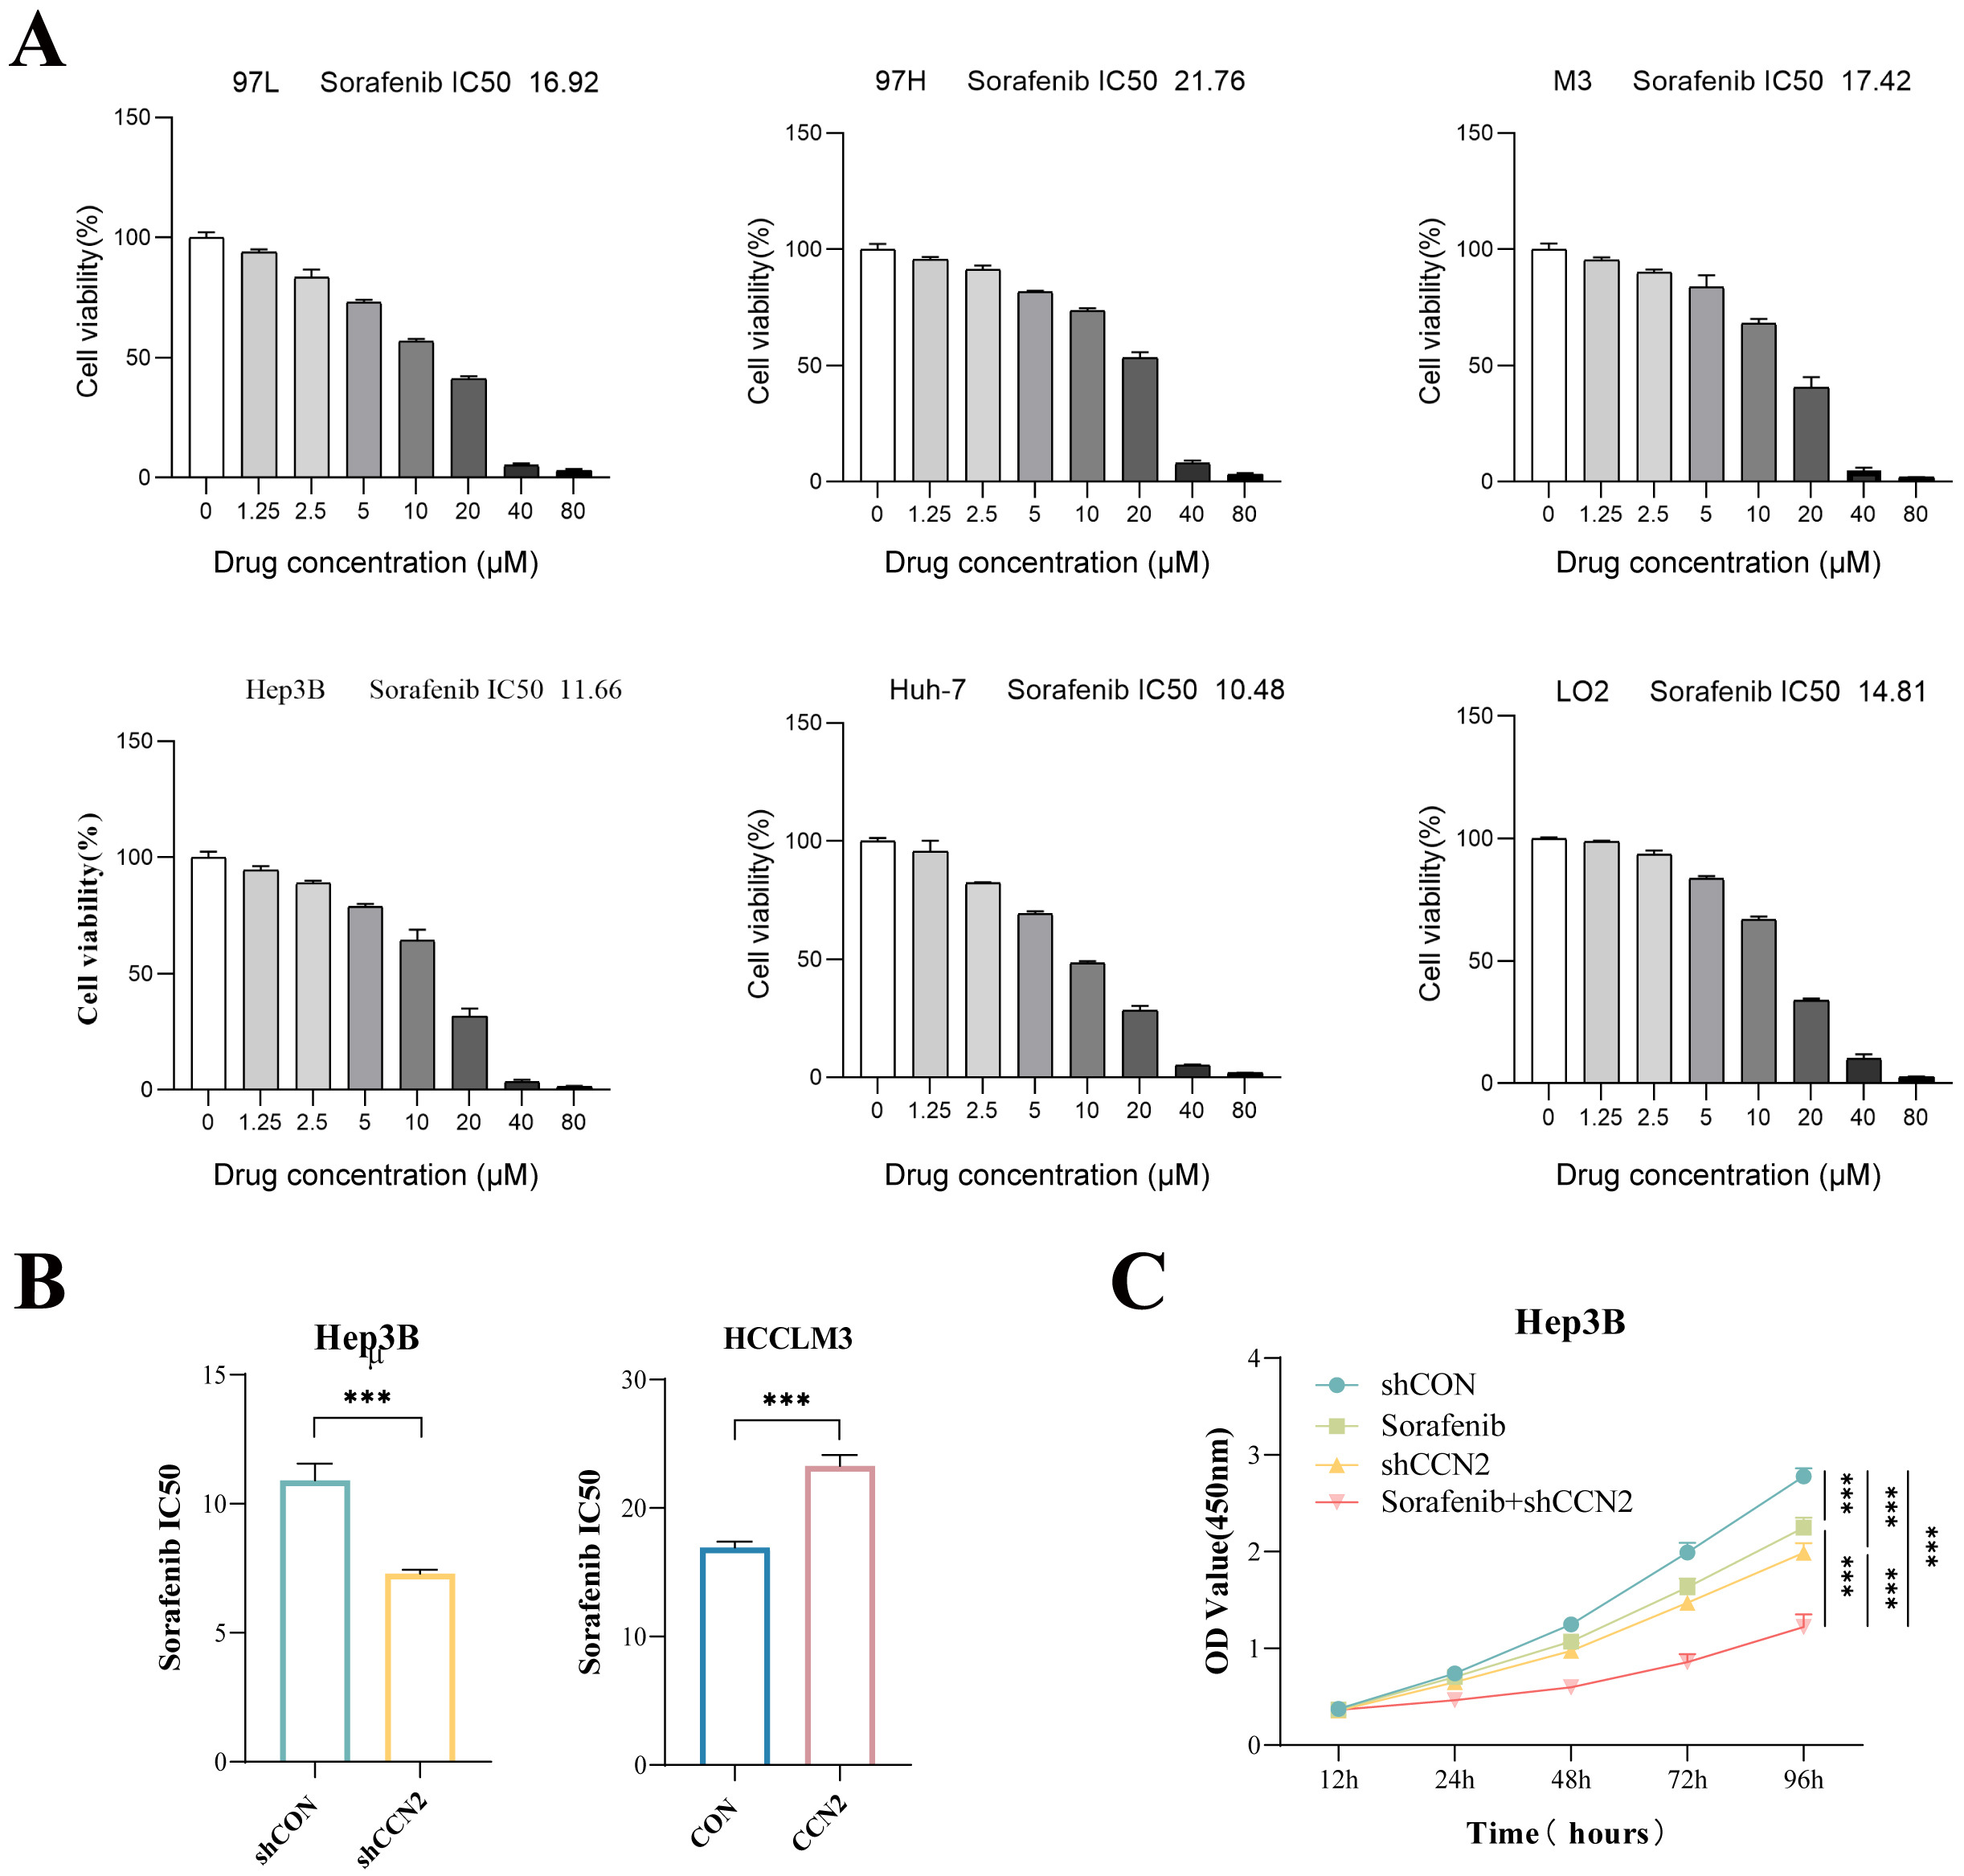 Fig. 2.
Impact of CCN2 expression changes on sorafenib resistance in
hepatocellular carcinoma cells in vitro. (A) Determination of sorafenib
IC50 values in hepatocellular carcinoma cell lines MHCC97L, MHCC97H, HCCLM3,
Huh-7, Hep3B, and the normal liver cell line LO2. (B) Assessment of sorafenib
IC50 values in hepatocellular carcinoma cell lines with CCN2 knockdown or
overexpression. (C) CCK-8 assay evaluating the effect of CCN2 knockdown combined
with sorafenib on the proliferation of hepatocellular carcinoma cells.
***p
Sorafenib, the first FDA-approved multi-targeted tyrosine kinase inhibitor for advanced hepatocellular carcinoma, inhibits tumor growth primarily by suppressing angiogenesis. To identify potential mediators of resistance, a tyrosine kinase PCR array profiling 90 tyrosine kinases (60 receptor and 30 non-receptor types) was used in CCN2-knockdown Hep3B cells. This screen revealed a broad downregulation of tyrosine kinase mRNAs, most notably c-Met (Fig. 3A). Subsequent validation by RT-qPCR and Western blot confirmed that CCN2 knockdown specifically reduces c-Met expression at both the mRNA and protein levels (Fig. 3B,C). These findings indicate that CCN2 promotes sorafenib resistance in HCC cells, at least in part, through the activation of c-Met.
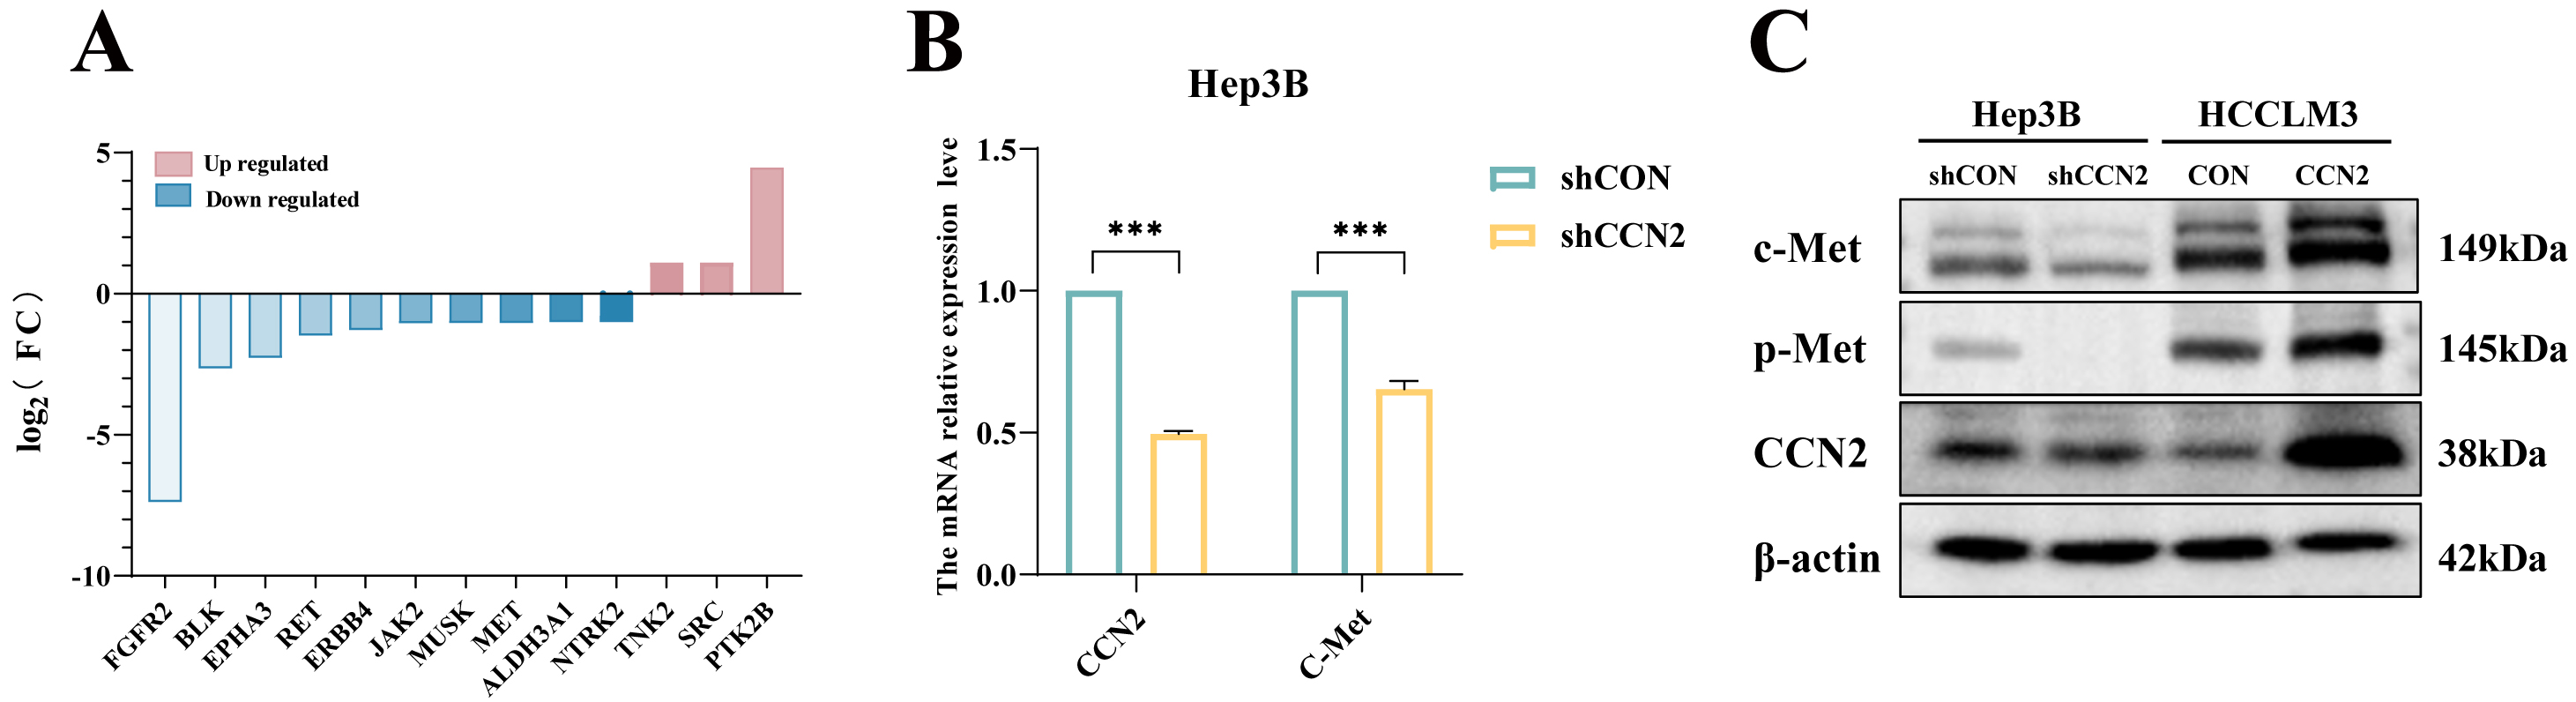 Fig. 3.
CCN2 enhancing sorafenib resistance in hepatocellular carcinoma
cells through activation of the c-Met signaling pathway. (A) Tyrosine kinase PCR
array analysis. (B) RT-qPCR detection of changes in CCN2 and c-Met expression
levels upon CCN2 knockdown. (C) Western blot analysis of changes in c-Met protein
expression levels upon CCN2 knockdown or overexpression. ***p
To further elucidate the specific mechanisms of CCN2 regulating c-Met transcription, the HumanTFDB was hereby used to predict transcription factors of the c-Met gene, and the DAVID database was employed for pathway enrichment analysis. The results indicated that the Hippo Signaling Pathway was involved in the transcriptional regulation of c-Met by CCN2 (Fig. 4A). Additionally, GSEA enrichment analysis showed significant enrichment of Hippo Signaling Regulation Pathways in populations with high CCN2 expression (Fig. 4B). The Hippo kinase pathway was identified as a carcinogenic resistance mechanism following many traditional small-molecule therapies, with YAP, a key transcriptional coactivator, translocating to the nucleus upon activation to regulate the transcription of downstream genes. The GEPIA database also demonstrated a positive correlation between YAP and c-Met expression (Fig. 4C). Additionally, subsequent immunofluorescence revealed that overexpression of CCN2 promoted YAP nuclear translocation, while CCN2 knockdown reduced YAP nuclear aggregation (Fig. 4D), demonstrating CCN2-mediated YAP nuclear translocation as a critical mechanism in regulating c-Met expression.
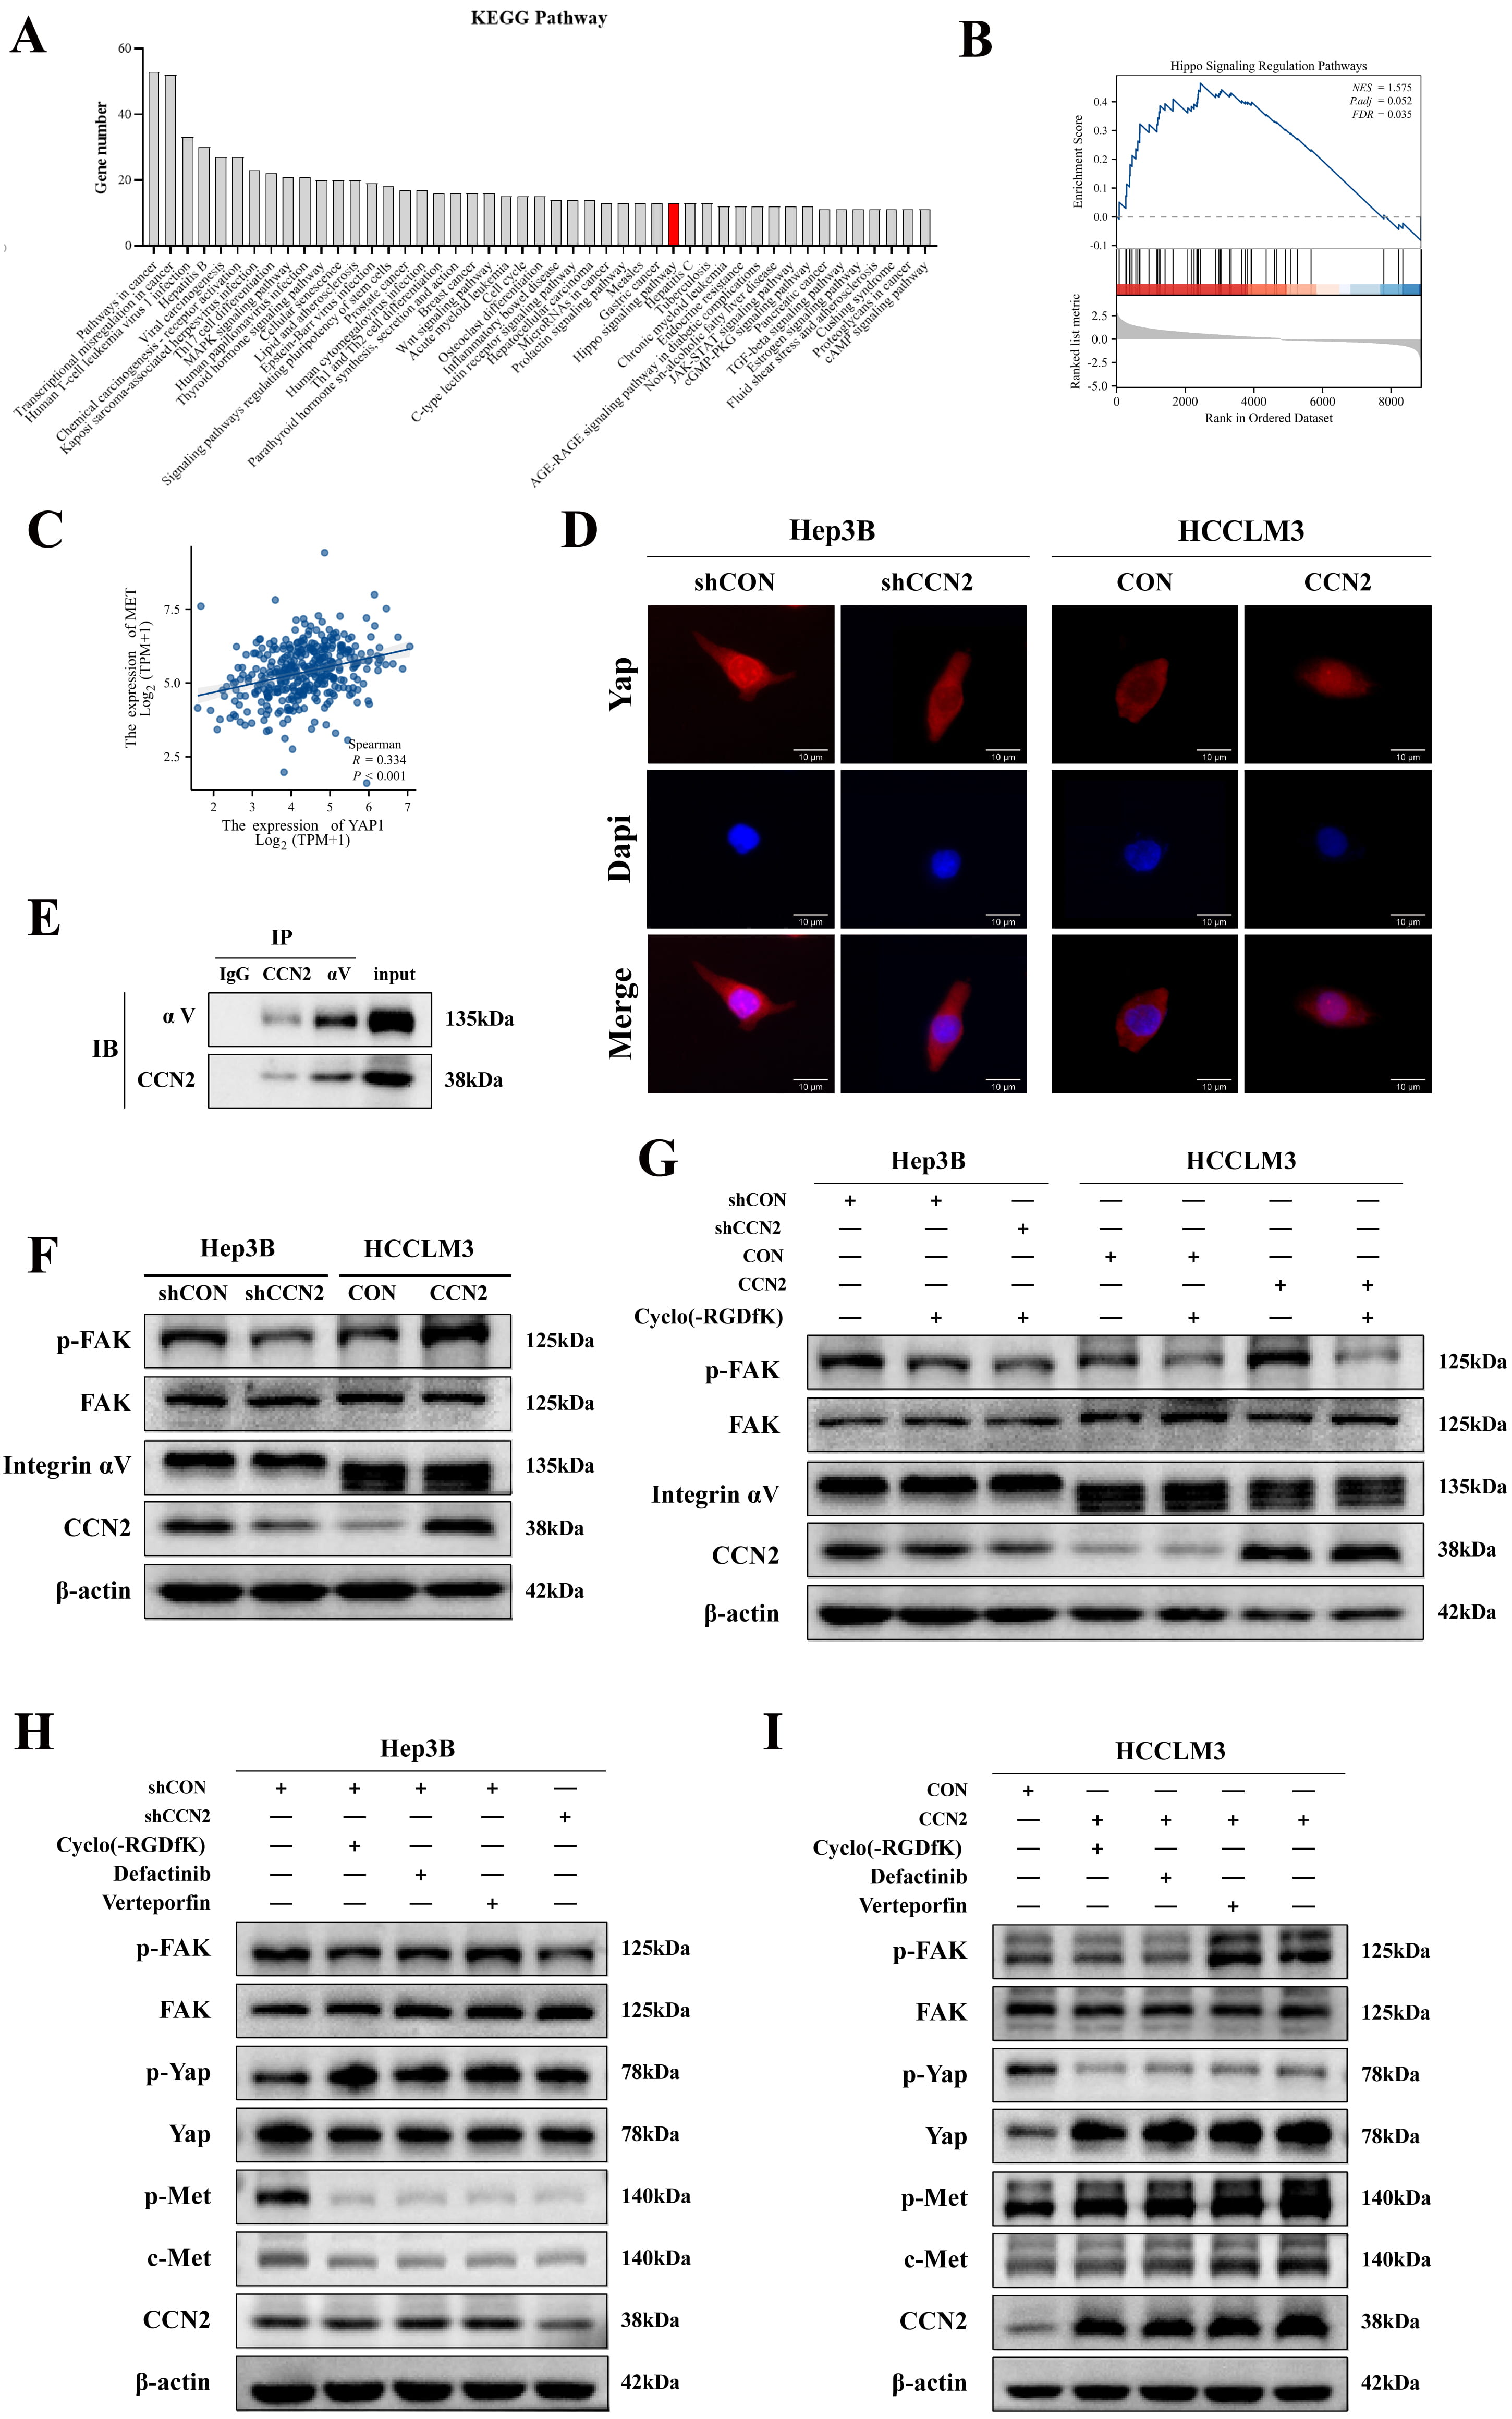 Fig. 4.
CCN2 upregulating c-Met expression in hepatocellular carcinoma
cells via integrin-mediated FAK/YAP activation. (A) Enrichment of c-Met
transcription factor signaling pathways. (B) GSEA enrichment analysis indicating
an association between CCN2 and Hippo Signaling Regulation Pathways. (C) Positive
correlation between YAP and c-Met. (D) Immunofluorescence detection of YAP
changes following CCN2 overexpression or knockdown. Scale bar: 10 µm. (E)
Co-immunoprecipitation (Co-IP) analysis of the interaction between CCN2 and
integrin
Following that, the mechanisms of CCN2 regulating YAP were investigated.
Integrin subunit
To investigate the dependence of CCN2’s regulation of c-Met on the Integrin
To investigate the role of CCN2 in promoting tumor growth in vivo and conferring resistance to sorafenib, Huh-7 cells with either control or CCN2 knockdown (assigned to shCON, shCCN2, shCON + Sorafenib, and shCCN2 + Sorafenib groups), as well as HCCLM3 cells with control or CCN2 overexpression (designated as control and CCN2 groups), were subcutaneously injected into the left anterior axilla of female BALB/c nude mice to generate xenograft tumor models (n = 6 per group). Mice in the Sorafenib and shCCN2 + Sorafenib groups were administered 25 mg/kg sorafenib via intraperitoneal injection every three days, while control groups received an equivalent volume of saline. Tumor growth was monitored tri-weekly. Following a 30-day period, the mice were euthanized, and the tumors were excised for volume and weight measurement (Fig. 5A–C). The results showed that tumors in the CCN2-overexpressing group were significantly larger than those in the control group (806.87 mm3 vs. 502.49 mm3). Critically, the shCCN2 + Sorafenib combination group exhibited the smallest tumor volume (135.10 mm3), which was substantially reduced compared to the shCON (649.33 mm3), Sorafenib-alone (353.59 mm3), and shCCN2-alone (315.29 mm3) groups (Fig. 5A,B). Corroborating this functional data, immunohistochemical analysis confirmed the involvement of the c-Met pathway: c-Met expression was significantly lower in the shCCN2 group than in the shCON group, and higher in the CCN2-overexpressing group compared to its control (Fig. 5D). Collectively, these findings indicate that CCN2 interference alleviates c-Met-mediated sorafenib resistance, and that combining sorafenib with CCN2 targeting enhances its antitumor efficacy.
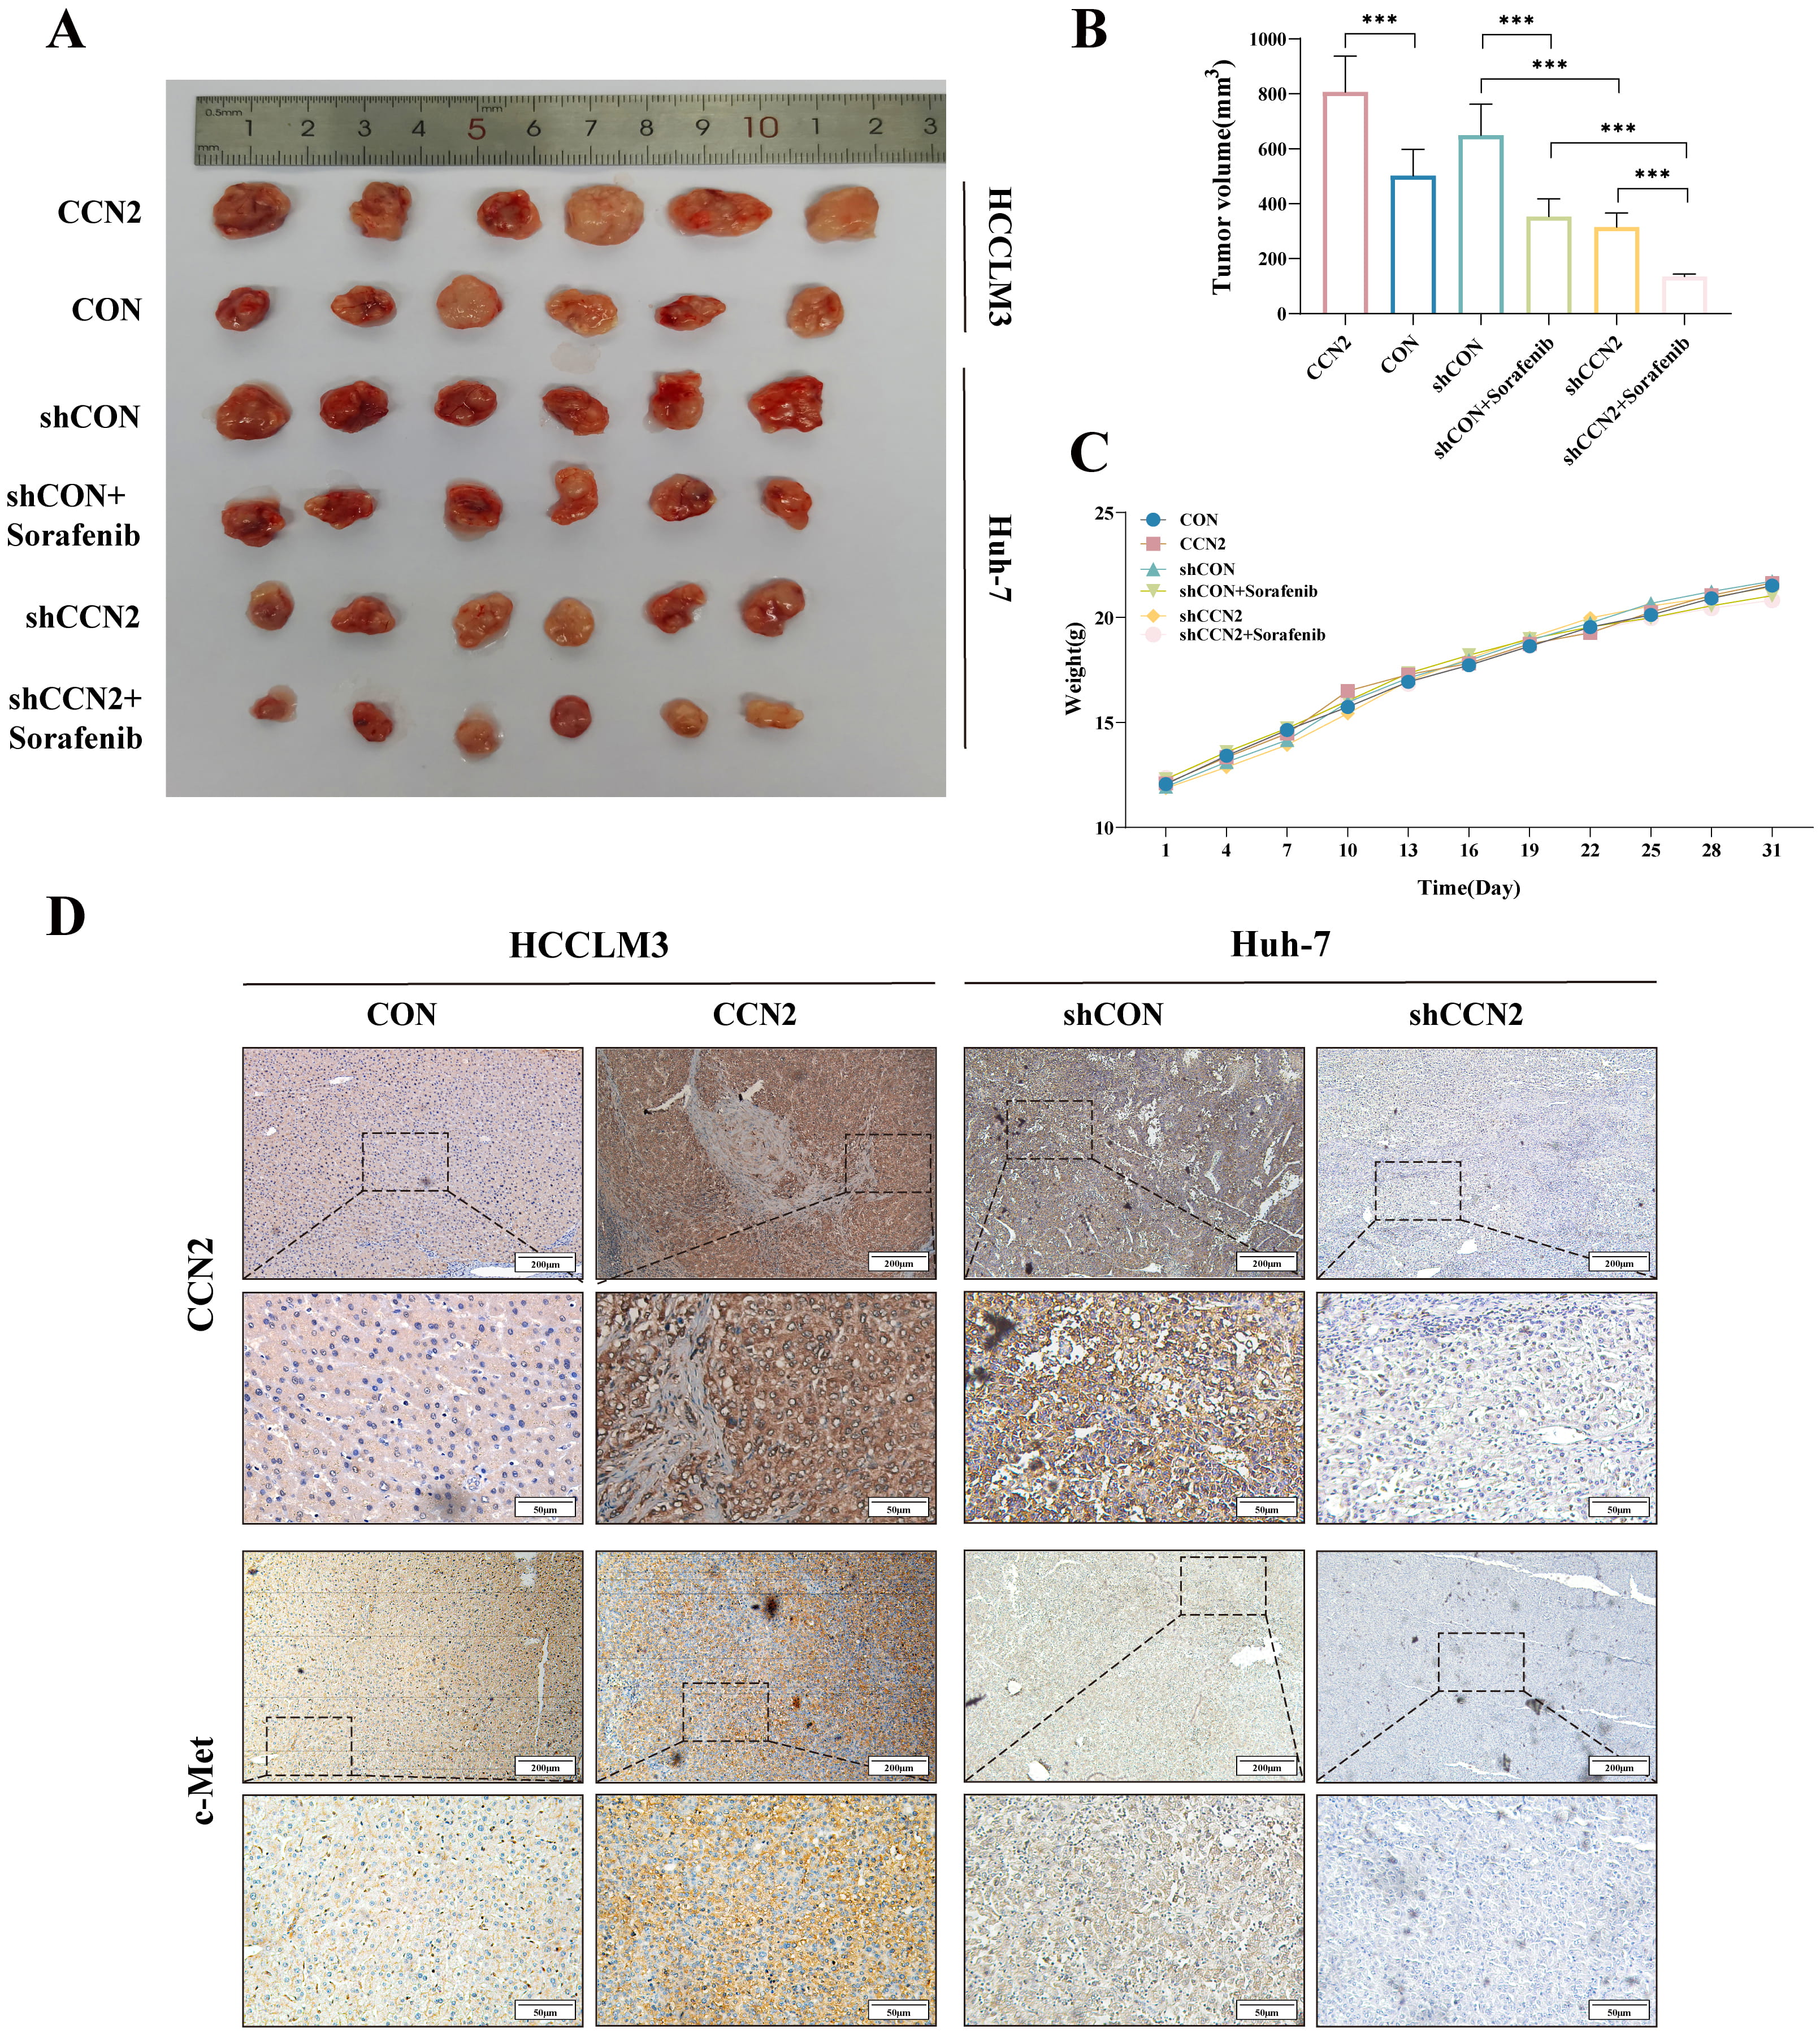 Fig. 5.
In vivo xenograft tumor study. (A) Representative
images of xenograft tumors after excision from each group (n = 6). (B) Changes in
tumor volume across groups. (C) Trends in body weight of nude mice across groups.
(D) Immunohistochemical detection of CCN2 and c-Met expression levels. Scale bar:
200 µm (upper) and 50 µm (lower). ***p
HCC remains one of the most prevalent and prognostically poor malignancies globally. With the evolving disease spectrum of HCC, identifying novel therapeutic targets and sensitive biomarkers for early diagnosis and improved treatment is increasingly urgent. Hepatocarcinogenesis involves a complex interplay of multiple oncogenes, tumor suppressor genes, and growth factors, where precise gene expression control is crucial for normal cellular function [23]. Against this backdrop, the CCN family matricellular protein CCN2 has garnered attention. Initially recognized for its roles in inflammation, injury response, and wound healing, aberrant CCN2 expression is an established biomarker for fibrotic diseases [9]. Notably, its dysregulation is also implicated in the development and progression of various malignancies, highlighting its significant clinical potential as a diagnostic and prognostic biomarker, as well as a promising therapeutic target.
CCN2 is one of six structurally related proteins defined by conserved domains
and sequence homology. Structurally, it is a 349-amino acid protein comprising
four modular domains: IGFBP (Module I), VWC (Module II), TSP1 (Module III), and
CT (Module IV) [24, 25]. Functionally, recent studies have elucidated several key
biological roles of CCN2 [9, 26, 27, 28]: namely, it (1) initiates signal transduction
by binding receptors such as integrins, HSPGs, LRP, and tyrosine kinases; (2)
modulates the availability and activity of cytokines; (3) interacts with ECM
components like fibronectin, tenascin, and hyaluronan—interactions that are
crucial for promoting cell adhesion, motility, and mediating ECM turnover during
tissue remodeling; and (4) regulates crosstalk between signaling pathways while
modulating the activity of various cytokines and growth factors. Transforming
growth factor-beta (TGF-
Sorafenib, a multi-kinase inhibitor, suppresses tumor growth primarily by targeting the RAF/MEK/ERK and PI3K/AKT/mTOR pathways to inhibit proliferation and angiogenesis. While effective in some patients, its clinical utility is often compromised by both intrinsic and acquired resistance. Phase III trials revealed that sorafenib extends overall survival by only 2–3 months in about 30% of HCC patients, with most developing resistance within six months and experiencing significant side effects [32, 33]. Although multiple mechanisms—including dysregulated apoptosis, autophagy, epithelial-mesenchymal transition (EMT), cancer stem cells, the tumor microenvironment, and key signaling pathways—have been linked to this resistance, the underlying causes remain poorly defined. Given its ability to interact with various membrane receptors such as Met and integrins, CCN2 has emerged as a participant in tumor chemoresistance. Previous studies from our group have associated CCN2 overexpression with poor prognosis and oxaliplatin resistance in HCC, suggesting its potential role as a molecular marker of chemoresistance in HCC cells [17]. To investigate the functional role of CCN2, we performed sorafenib sensitivity assays, which demonstrated that CCN2 silencing enhanced the susceptibility of hepatocellular carcinoma cells to this targeted agent. The combination of CCN2 knockdown and sorafenib treatment resulted in significantly suppressed tumor cell proliferation. Subsequent PCR array analysis of protein tyrosine kinases in CCN2-interfered cell lines revealed a pronounced reduction in mRNA expression, most notably in c-Met. This finding confirms that CCN2 abnormally activates the c-Met signaling pathway, which cooperatively drives HCC malignancy and confers sorafenib resistance. These results imply that in clinical practice, the aggressive behavior and poor sorafenib response observed in patients with high CCN2 expression may be mediated through CCN2-induced hyperactivation of the c-Met pathway.
The c-Met proto-oncogene, located on chromosome 7q21-31, encodes the receptor tyrosine kinase c-Met [34]. This protein regulates a network of downstream pathways—including Ras/Raf/MEK/MAPK, PI3K/AKT/mTOR, and JAK/STAT—thereby influencing key cellular processes such as proliferation, survival, migration, and angiogenesis [35]. Dysregulation of c-Met is frequently observed in multiple cancers, where its overexpression drives tumorigenesis and confers resistance to targeted therapies [36], notably in HCC, gastric cancer, and non-small cell lung cancer [37]. In HCC specifically, c-Met expression is significantly higher in tumor tissues compared to adjacent normal liver, underscoring its activation as a key contributor to sorafenib resistance. Furthermore, CCN2 overexpression has been shown to upregulate c-Met expression, and the MET/HGF pathway is known to promote proliferation and invasion in HCC cells. Consequently, our findings identify the tyrosine kinase c-Met as a critical effector molecule in CCN2-mediated sorafenib resistance.
Integrins, which are heterodimeric receptors composed of
In conclusion, while the secreted protein CCN2 is typically considered an
indirect ligand facilitating tumor progression, this study demonstrates that
combining CCN2 interference with sorafenib produces significant anti-tumor
effects in liver cancer. Both in vitro and in vivo experiments
established that CCN2 binds integrin
This study acknowledges several limitations that should be considered when
interpreting the findings. First, the analysis of the association between CCN2
expression and the clinical characteristics of HCC patients was based solely on a
retrospective design. Prospective studies are warranted to validate these
observations and to incorporate longer-term patient follow-up data to clarify the
relationship between CCN2 and HCC prognosis. Second, while this research offers
preliminary insights into the role and mechanism of CCN2 in sorafenib resistance
in HCC, the precise molecular interactions between CCN2 and the downstream
integrin
Drawing from both the current findings and prior research, the following
conclusions could be reached: (1) CCN2 correlates with the proliferation and
migration of hepatocellular carcinoma cells; (2) c-Met, a tyrosine kinase, acts
as an effector in the CCN2-mediated resistance to sorafenib; (3) CCN2’s binding
to integrin
The data used to support the findings of this study are available from the corresponding author upon reasonable request.
LC and JL conceived and designed the experiments, performed the experiments, prepared figures and tables, authored or reviewed drafts of the paper, and approved the final draft. YL and BC analyzed the data, prepared figures and tables, and approved the final draft. YB and KL conceived and designed the experiments, authored or reviewed drafts of the paper, and approved the final draft. All authors contributed to editorial changes in the manuscript. All authors read and approved the final manuscript. All authors have participated sufficiently in the work and agreed to be accountable for all aspects of the work.
This study followed the ethical standards of the Declaration of Helsinki. All experimental procedures involving animals were performed in strict accordance with the National Institutes of Health guidelines for the care and use of laboratory animals and were approved by the Medical Research Ethics Review Committee of the General Hospital of Ningxia Medical University (No. KLYY-2019-080). A written consent was signed by the patients or their families/legal guardians for the publication of anonymized clinical data and any potentially identifiable images included in this study. Consent documentation confirms understanding that: Clinical details and images will be used solely for scientific purposes. No financial compensation will be provided for data/image usage.
Not applicable.
This study was funded by the National Natural Science Foundation (No. 81960533), Natural Science Foundation of Ningxia Hui Autonomous Region (No. 2023AAC03507), Natural Science Foundation of Ningxia Hui Autonomous Region (No. 2023AAC03606), and Key R&D Program of Ningxia Hui Autonomous Region for High-level Talents Introduction (No. 2024BEH04154).
The authors declare no conflict of interest.
During the preparation of this manuscript, the authors used ChatGPT to assist with spelling and grammar checks in both the Introduction and Discussion sections. Following this, the authors carefully reviewed, edited, and refined the content as necessary. The authors take full responsibility for the accuracy and integrity of the published work.
Supplementary material associated with this article can be found, in the online version, at https://doi.org/10.31083/FBL45454.
Publisher’s Note: IMR Press stays neutral with regard to jurisdictional claims in published maps and institutional affiliations.