
- Academic Editor
†These authors contributed equally.
Primary liver cancer (PLC) exhibits a high incidence and mortality rate. Early diagnosis and effective treatment are crucial for improving patient survival rates. This study aims to identify biomarkers of hepatitis B-related liver cancer and establish a new method for molecular subtype classification based on differential metabolite-related regulatory gene expression profiles.
This study collected sterile midstream urine samples from patients with hepatitis B-related liver cancer who had not received standardized systematic antiviral therapy or anticancer therapy, as well as from healthy controls. Potential biomarkers were identified through liquid chromatography-tandem mass spectrometry (LC-MS/MS)-based metabolomics, followed by Kyoto Encyclopedia of Genes and Genomes (KEGG) enrichment analysis performed on the differential metabolites. Gene expression data of 371 hepatocellular carcinoma (HCC) samples in The Cancer Genome Atlas-Liver Hepatocellular Carcinoma (TCGA-LIHC) database were clustered using gene annotations for differential metabolites derived from the Human Metabolome Database (HMDB). The Kaplan-Meier (KM) survival curve was employed to assess the prognosis of different HCC molecular subtypes. Expression differences of subtype-specific genes and their enrichment in Hallmark, KEGG and Gene Ontology (GO) pathways were analyzed. The Tumor Immune Dysfunction and Exclusion (TIDE) scoring tool was used to evaluate the subtypes’ response to immunotherapy. Sensitivity to sorafenib was also compared across the different subtypes.
A total of 53 differential metabolites were identified (p < 0.01), which were significantly enriched in seven metabolic pathways (p < 0.05). Three potential biomarkers were discovered: Suberic acid, 2′-O-methylcytidine, and 3′-Sialyllactose. Regulatory genes associated with these differential metabolites clustered HCC samples from the TCGA-LIHC database into two molecular subtypes (C1 and C2). KM survival analysis indicated that patients in the C2 subtype exhibited higher overall survival compared to those in C1. Differential genes between the two subtypes were significantly enriched in Hallmark, KEGG and GO pathways. The TIDE scoring tool revealed a higher likelihood of immune escape in C1 subtype patients. Molecular targeted drug analysis suggested that sorafenib may be more effective in patients with the C1 subtype.
Suberic acid, 2′-O-methylcytidine, and 3′-Sialyllactose hold promise as metabolic biomarkers for hepatitis B-related liver cancer. Understanding the diversity of the human liver cancer gene expression profile from a metabolomic perspective has potential applications for developing novel clinical treatment strategies.
Primary liver cancer (PLC) is a common type of cancer, with hepatocellular carcinoma (HCC) being the most prevalent. This condition is marked by high malignancy, subtle onset, and the absence of accurate early diagnosis and treatment indicators [1, 2]. The mortality of HCC is high and the 5-year survival rate needs to be improved [3]. Metabolic reprogramming is frequently observed in tumor cells, where significant alterations in metabolic pathways occur to support their rapid growth, survival, and proliferation. HCC is characterized by metabolic reprogramming [4], particularly glucose metabolic reprogramming, which is fundamental to HCC progression [1]. Hepatitis B virus (HBV) is still the main pathogenic factor of liver cancer in China [5]. Effective and timely screening, diagnosis, and treatment of hepatitis B-related liver cancer are critical components of liver cancer management in China.
Current diagnostic methods for HCC have limitations, and blood samples are commonly used for the detection and exploration of disease biomarkers. Pathology remains the most trusted diagnostic tool for identifying early-stage HCC and its precancerous lesions [6]. Urine, as a non-invasive diagnostic modality, provides greater potential for the investigation of HCC biomarkers [7]. Urine serves as a source of early biomarkers sensitive to physiological changes, reflecting subtle and early-stage alterations in body function [8]. Currently, the study of urine metabolites for hepatitis B-related liver cancer remains in the exploratory stage. Studying the changes of its metabolites can understand the metabolic abnormalities of the liver, which is helpful for early diagnosis, screening, monitoring, and prognosis evaluation of the disease. Analyzing the characteristic metabolites in patients’ urine provides new insights into the identification of metabolic biomarkers for liver cancer and potential therapeutic targets [9].
This study aims to investigate diagnostic biomarkers and perform subtype analysis of PLC. Using liquid chromatography-tandem mass spectrometry (LC-MS/MS)-based untargeted metabolomics, we analyzed the metabolic profiles of urine metabolites in patients with hepatitis B-related liver cancer and healthy controls. Our objective is to identify potential metabolic biomarkers with high sensitivity and specificity for hepatitis B-related liver cancer, as well as to explore the characteristics of different HCC subtypes from the perspective of urinary metabolites. This study hopes to bring new insights into the non-invasive diagnosis and molecular characteristics of PLC.
This study collected urine samples from 10 patients with hepatitis B-related liver cancer and 8 healthy controls. The inclusion criteria for patients were as follows: (1) patients with a clinical diagnosis of PLC, with a confirmed history of HBV infection. Currently, both Hepatitis B Surface Antigen (HBsAg) and HBV DNA are positive, with HBsAg and/or HBV DNA positivity persisting for more than 6 months. (2) These patients have not received standardized and systematic antiviral therapy for HBV, nor have they undergone antitumor treatments such as surgery, radiotherapy, chemotherapy, or immunotherapy. The inclusion criteria of the healthy control group are as follows: (1) subjects had no history of HBV infection, hypertension, diabetes, or other relevant conditions; (2) liver function and alpha-fetoprotein (AFP) results were within normal limits; (3) ultrasound examination confirmed no significant abnormalities in the liver, kidneys, and pancreas. Exclusion criteria are as follows: (1) subjects with chronic liver diseases of other etiologies, including drug-induced liver disease, alcoholic liver disease, non-alcoholic fatty liver disease, autoimmune liver disease, and metabolic liver disease; (2) subjects with secondary liver cancer, other malignancies or severe kidney disease. Two sets of routine test results were collected, with AFP measured using the Abbott ARCHITECT i2000SR system (Abbott Laboratories, Chicago, IL, USA) and routine biochemical assays conducted using the Abbott ARCHITECT c16000 system (Abbott Laboratories, Chicago, IL, USA).
Midstream urine samples were aseptically collected from all participants, followed by centrifugation at 3000 rpm for 10 min at 4 °C. The resulting supernatant was aliquoted into cryovials and stored at –80 °C until analysis. For quality control, a pooled sample was created by combining equal volumes of urine from each individual.
Following collection, the urine samples were thawed at 4 °C. An aliquot of each sample was then transferred into a pre-cooled solution of methanol (catalog number A456-4, Fisher Scientific, Waltham, MA, USA)/acetonitrile (catalog number 1499230-935, Merck KGaA, Darmstadt, Hesse, Germany)/water (catalog number W6-4, Fisher Scientific, Waltham, MA, USA) (2:2:1, v/v). After thorough vortexing, the mixtures were sonicated at low temperature for 30 min. The sample was kept under frozen conditions (–20 °C) for 10 min, followed by low-temperature high-speed centrifugation at 14,000 g for 20 min at 4 °C. The supernatant was then vacuum-dried.
The vacuum-dried samples were reconstituted in 100 µL acetonitrile/water (1:1, v/v) solvent. The mixtures were then centrifuged at 14,000 g for 15 min at 4 °C. Finally, the supernatant was analyzed by mass spectrometry.
Throughout the analytical process, all samples were maintained at 4 °C in the autosampler for continuous analysis in a random order. Analysis was performed using a UHPLC (Agilent 1290 Infinity LC, Agilent Technologies, Santa Clara, CA, USA) equipped with a HILIC column (ACQUITY UPLC BEH Amide, Waters Corporation, Milford, MA, USA) and coupled to a quadrupole time-of-flight (AB Sciex TripleTOF 6600, AB Sciex Pte. Ltd., Framingham, MA, USA). The column temperature was maintained at 25 °C. The mobile phase consisted of A = 25 mM ammonium acetate (catalog number 73594, Sigma-Aldrich, St. Louis, MO, USA) and 25 mM ammonium hydroxide (catalog number A470-500, Fisher Scientific, Waltham, MA, USA) in water, and B = acetonitrile. A constant flow rate of 0.5 mL/min was applied, and the injection volume was 2 µL.
Raw data files were converted into MzML format using ProteoWizard (version 3.0.6428, https://proteowizard.sourceforge.io/), and then processed using the XCMS online (version 3.7.1, https://xcmsonline.scripps.edu/) program for peak alignment, retention time correction, and peak area extraction. The molecular feature peaks of the samples were annotated with metabolites by referencing public databases such as Mass Bank (https://massbank.eu/MassBank/), Metlin (https://metlin.scripps.edu/), and MoNA (https://mona.fiehnlab.ucdavis.edu/), in conjunction with a secondary mass spectrometry database. To establish gene-metabolite associations, we queried the Human Metabolome Database (HMDB, https://hmdb.ca) and restricted the analysis to high-confidence pairs with explicit experimental evidence (e.g., enzyme- or transporter-related), supported by in vitro, clinical, or validated bioinformatic studies.
Clinical data were analyzed using SPSS26.0 (IBM Corp., Armonk, NY, USA). For categorical variables, intergroup comparisons were conducted using Fisher’s exact test. The quantitative variables were first assessed for normality, and then analyzed using parametric or non-parametric tests, as appropriate. Metabolomics data were analyzed using R packages, such as pheatmap (version 1.0.12, https://cran.r-project.org/web/packages/pheatmap/index.html), gmodels (version 2.18.1, https://cran.r-project.org/web/packages/gmodels/index.html), ropls (version 1.7.2, https://bioconductor.org/packages/release/bioc/html/ropls.html), and pROC (version 1.15.3, https://cran.r-project.org/web/packages/pROC/), among others. Molecular subtyping analysis was performed using R software (version 4.0.3, https://www.r-project.org/).
Table 1 presents the basic clinical data of the healthy population and patients
with hepatitis B-related liver cancer. The results indicate that there were no
statistically significant differences in age and gender between the two groups
(p
| Variables | Healthy controls (n = 8) | Ca (n = 10) | p-value |
| Age (years) | 51.00 |
55.50 |
0.271 |
| Male/female | 4/4 | 7/3 | 0.630* |
| AFP (ng/mL) | 3.13 (2.09~3.57) | 607.49 (14.94~1200.00) | 0.002 |
| TP (g/L) | 71.30 |
66.78 |
0.031 |
| ALB (g/L) | 44.66 |
35.58 |
0.001 |
| TBIL (µmol/L) | 15.70 (11.85~19.58) | 17.55 (12.70~21.60) | 0.307 |
| DBIL (µmol/L) | 4.30 (3.38~4.50) | 6.10 (4.08~7.40) | 0.029 |
| ALT (U/L) | 7.50 (5.25~13.00) | 53.50 (47.75~88.00) | 0.001 |
| AST (U/L) | 16.50 |
75.70 |
0.001 |
| GGT (U/L) | 15.50 (12.00~23.25) | 172.50 (72.50~310.00) | 0.001 |
*, Categorical variables were analyzed using Fisher’s exact test. Quantitative
variables were first assessed for normality; if normally distributed, the data
were expressed as mean
On the principal component analysis (PCA) plot, the quality control samples were densely distributed, with significant differences between the two groups and good repeatability within each group (Fig. 1A,B). The orthogonal partial least square discriminant analysis (OPLS-DA) score plot indicated R2X = 0.213, R2Y = 0.962, and Q2Y = 0.556, demonstrating that the established model has a good predictive ability (Fig. 1C). The permutation test plot confirmed the reliability of the OPLS-DA model (Fig. 1D).
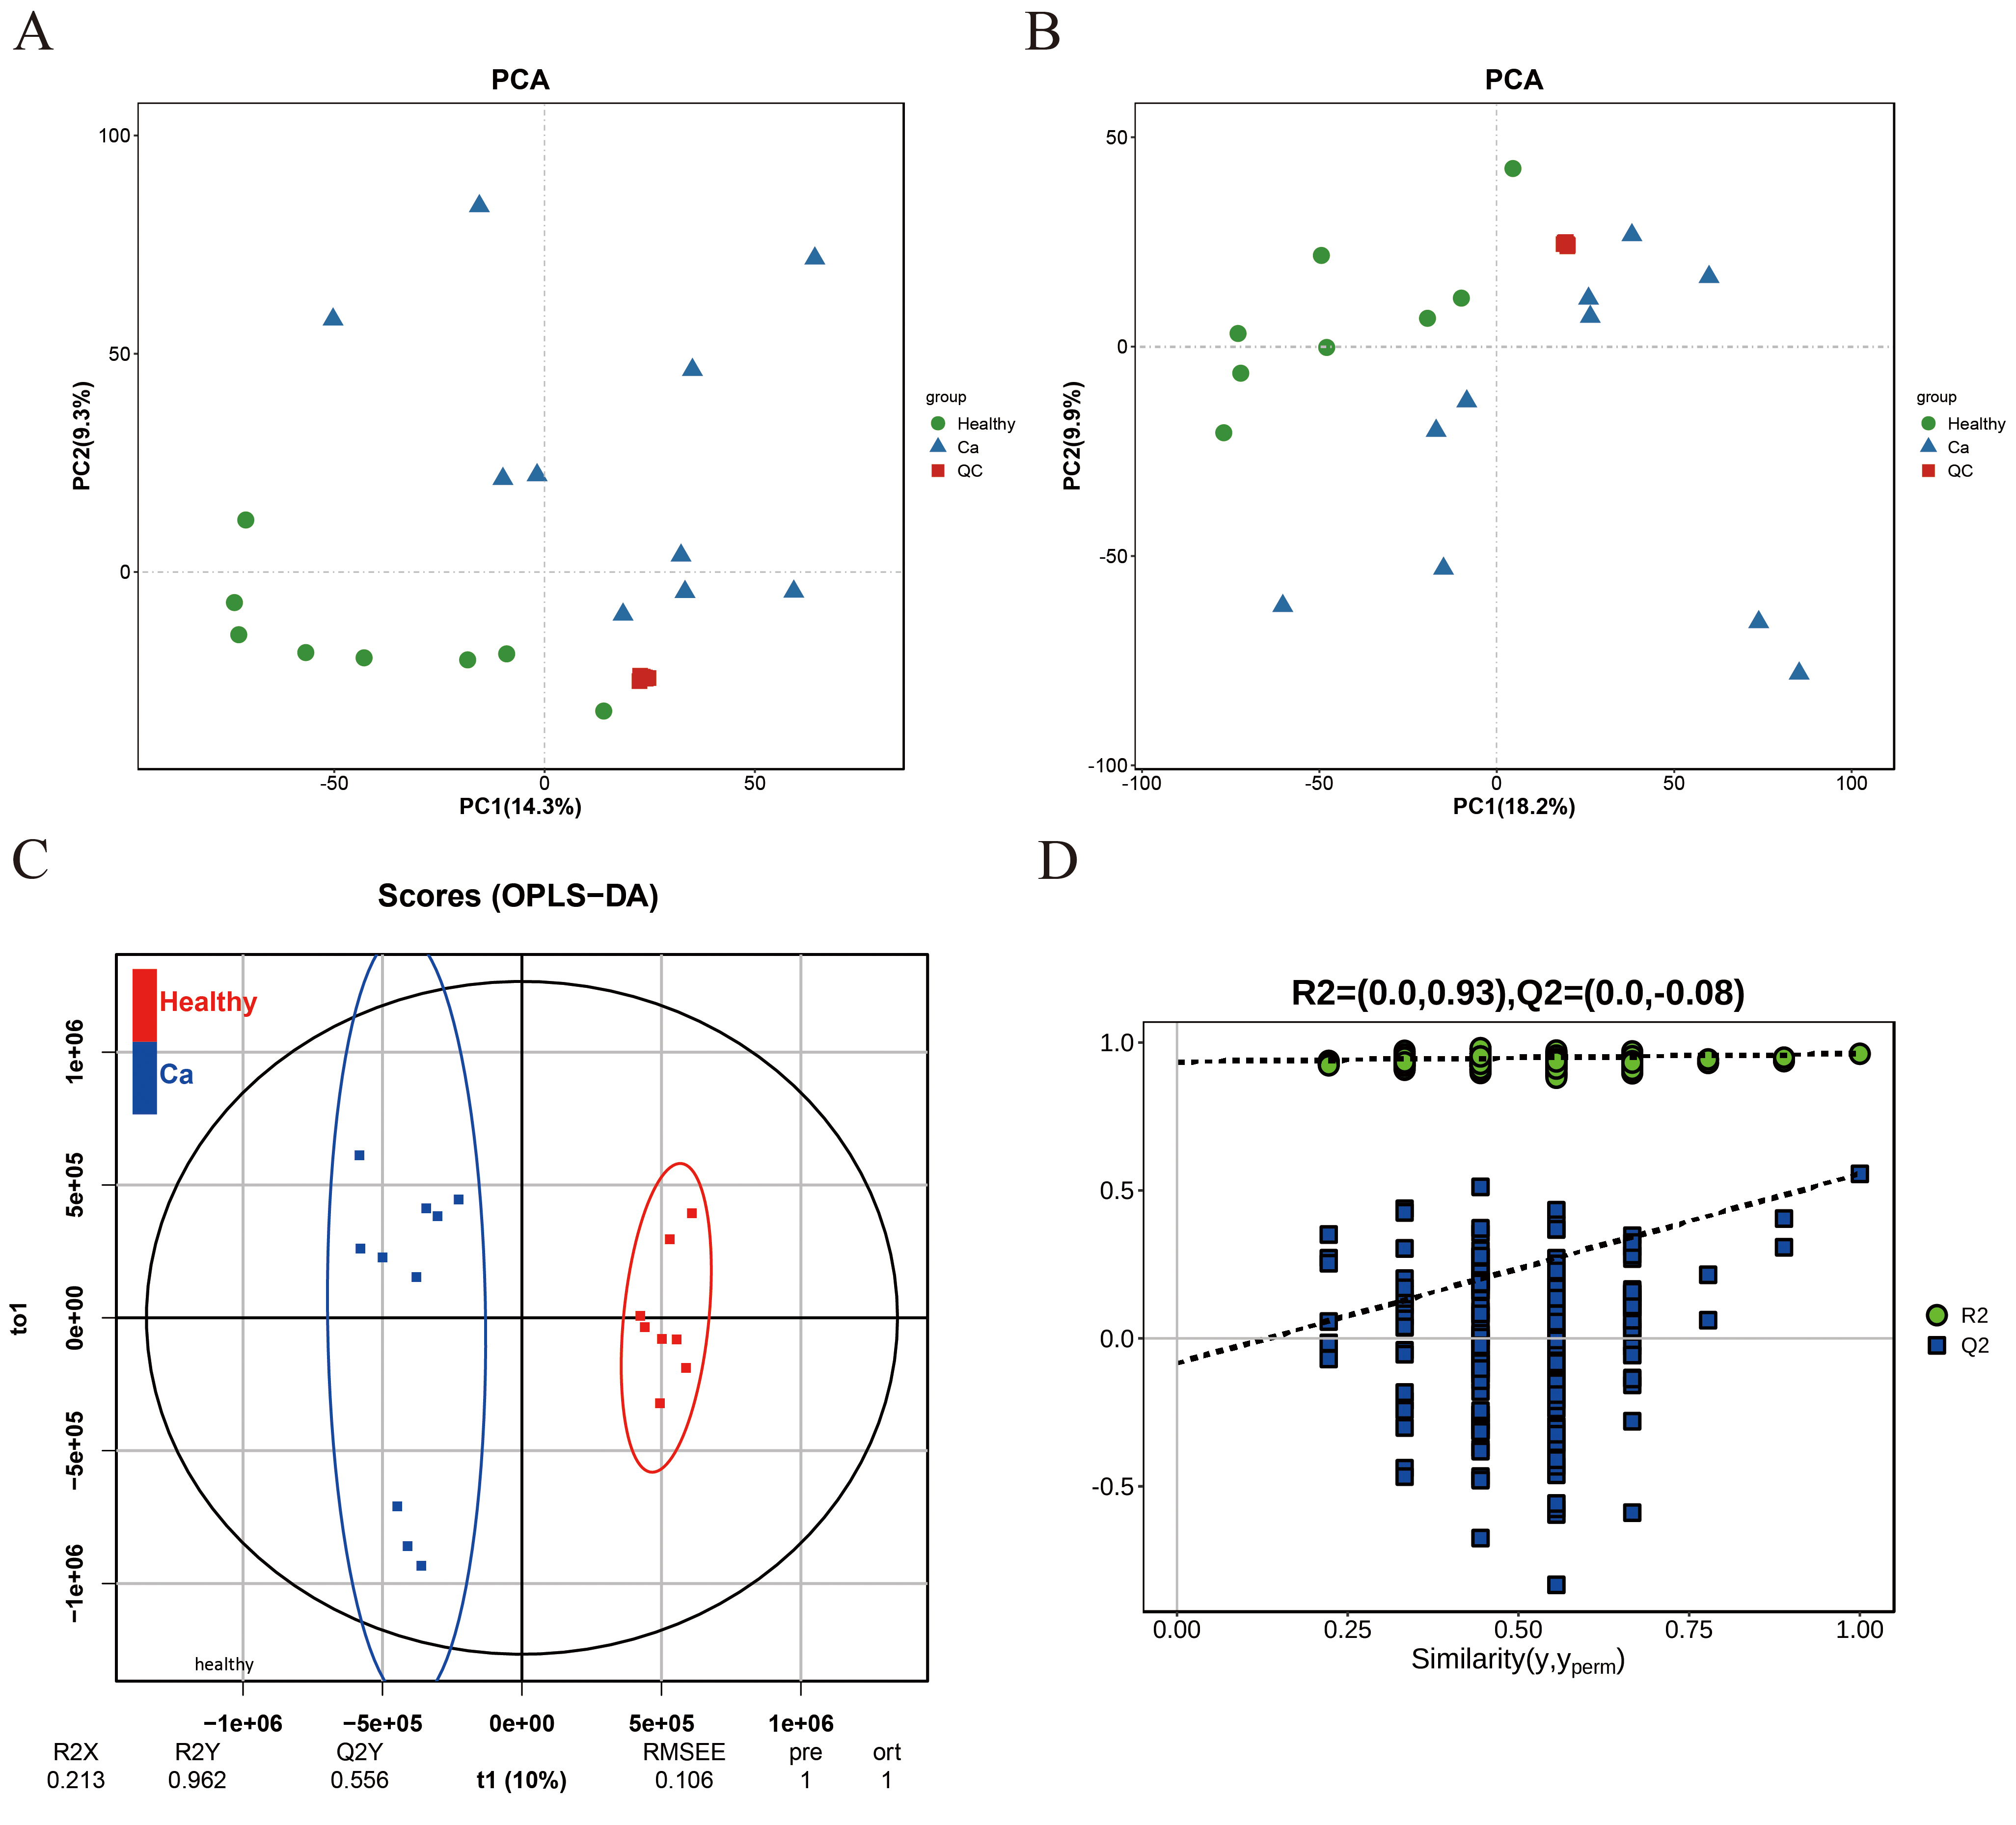 Fig. 1.
PCA and OPLS-DA urinary models distinguish populations between the comparison groups. (A,B) PCA model plot in positive and negative ion mode. (C) OPLS-DA model score plot. (D) OPLS-DA model permutation test plot. PCA, principal component analysis; OPLS-DA, orthogonal partial least square discriminant analysis.
The criteria for screening differential metabolites in this study were as
follows: variable importance in the projection (VIP)
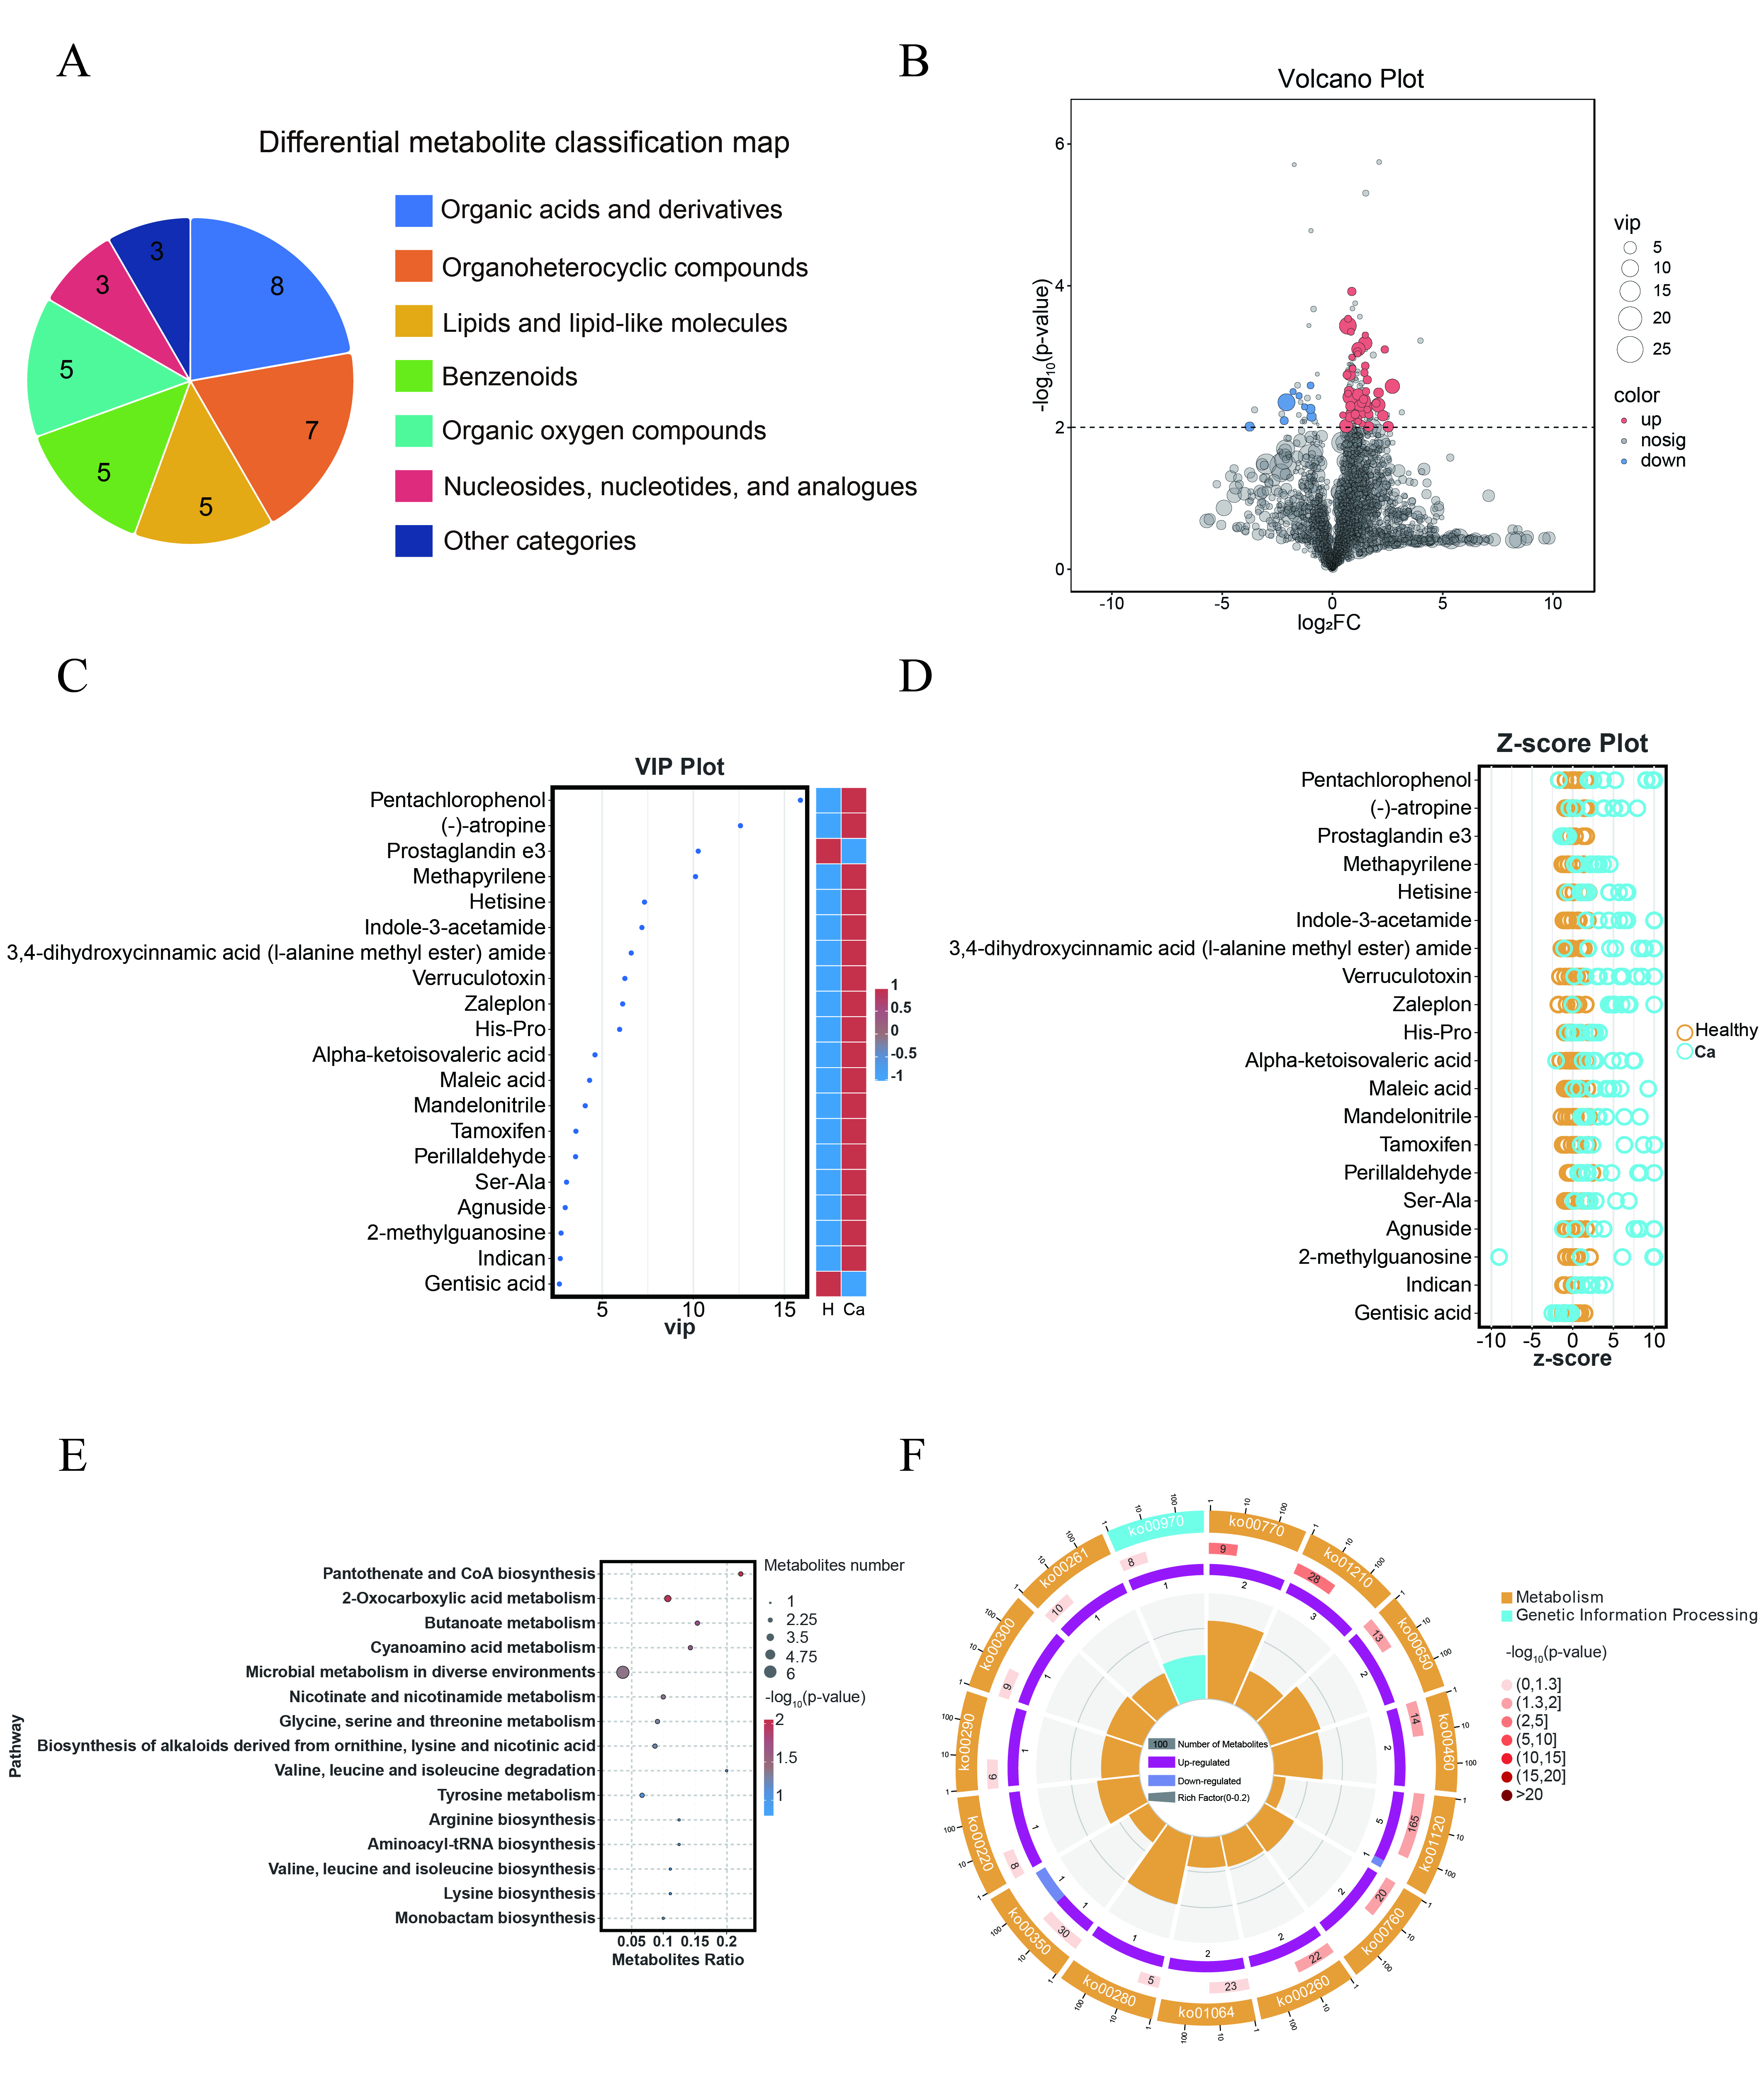 Fig. 2.
Differential metabolites in urine between different groups exhibit distinct characteristics. (A) Classification map of differential metabolites. (B) Volcano plot of differential metabolites. (C) VIP plot of differential metabolites. (D) Z-score plot of differential metabolites. (E) KEGG enrichment bubble plot of differential metabolites. The size of the circle represents the number of differential metabolites enriched in each pathway. (F) Metabolic pathway circle plot. VIP, variable importance in the projection; KEGG, Kyoto Encyclopedia of Genes and Genomes.
| Metabolite | log2FC | p-value | VIP | RT | m/z |
| Pentachlorophenol | 1.319670893 | 0.005193234 | 15.87797916 | 0.753 | 263.02308 |
| (-)-atropine | 1.300709850 | 0.004324274 | 12.58696117 | 6.976 | 290.15969 |
| Prostaglandin e3 | –2.085074706 | 0.004407285 | 10.26758020 | 3.643 | 331.17628 |
| Methapyrilene | 0.697147177 | 0.000366731 | 10.11932463 | 7.049 | 262.12846 |
| Hetisine | 0.805211339 | 0.003716509 | 7.318897691 | 4.097 | 330.22736 |
| Indole-3-acetamide | 2.716237334 | 0.002617423 | 7.177248219 | 7.002 | 175.07133 |
| 3,4-dihydroxycinnamic acid (l-alanine methyl ester) amide | 2.072153586 | 0.004808742 | 6.590770361 | 0.888 | 232.05928 |
| Verruculotoxin | 1.486965976 | 0.000645205 | 6.241679989 | 4.050 | 243.13503 |
| Zaleplon | 1.178122656 | 0.000781359 | 6.119466205 | 7.008 | 264.11886 |
| His-Pro | 0.620611090 | 0.009466142 | 5.952839278 | 2.584 | 235.11890 |
| Alpha-ketoisovaleric acid | 0.860165726 | 0.006610992 | 4.601905686 | 2.242 | 115.04007 |
| Maleic acid | 0.778322529 | 0.001799395 | 4.303796919 | 0.871 | 115.00370 |
| Mandelonitrile | 1.160697155 | 0.003412904 | 4.065987293 | 1.053 | 134.08119 |
| Tamoxifen | 2.527436553 | 0.009707497 | 3.553467422 | 5.745 | 372.23808 |
| Perillaldehyde | 2.289121455 | 0.006801001 | 3.534889206 | 3.409 | 169.13351 |
| Ser-Ala | 1.640677069 | 0.009690771 | 3.039145470 | 2.988 | 177.06581 |
| Agnuside | 2.091059830 | 0.003236282 | 2.967104677 | 0.882 | 465.12568 |
| 2-methylguanosine | 1.123081135 | 0.007675389 | 2.739367426 | 3.601 | 296.10004 |
| Indican | 0.811175486 | 0.004991964 | 2.694630637 | 1.207 | 296.13521 |
| Gentisic acid | –0.945866373 | 0.007011832 | 2.647569997 | 1.771 | 153.01932 |
RT, retention time; VIP, variable importance in the projection.
A Kyoto Encyclopedia of Genes and Genomes (KEGG) enrichment analysis was
performed on the 53 differential metabolites between the comparison groups,
identifying 35 enriched metabolic pathways. A bubble plot of the top 15
significantly enriched pathways was generated based on the p-values
(Fig. 2E). Additionally, an enrichment circle plot was generated to illustrate
the significance of the top 15 metabolic pathways based on p-values, as
well as the number of upregulated and downregulated metabolites, and the
metabolites ratio (Fig. 2F). Seven metabolic pathways exhibited significant
differences (p
In this study, receiver operating characteristic (ROC) curve analysis was employed to assess the performance of the selected differential metabolites by calculating their area under the curve (AUC) values (Fig. 3). A ten-fold cross-validation was conducted, and the mean AUC values were computed to reduce the risk of model overfitting. The results revealed that the AUC mean values of three differential metabolites were greater than 0.9, namely Suberic acid, 2′-O-methylcytidine, and 3′-Sialyllactose. Specifically, Suberic acid AUC = 1 (healthy controls, n = 8; liver cancer, n = 10; 95% CI: 1.000~1.000). 2′-O-methylcytidine AUC = 0.975 (95% CI: 0.930~0.945). 3′-Sialyllactose AUC = 0.938 (95% CI: 0.942~0.956). Table 3 provides detailed information on these three potential metabolic markers.
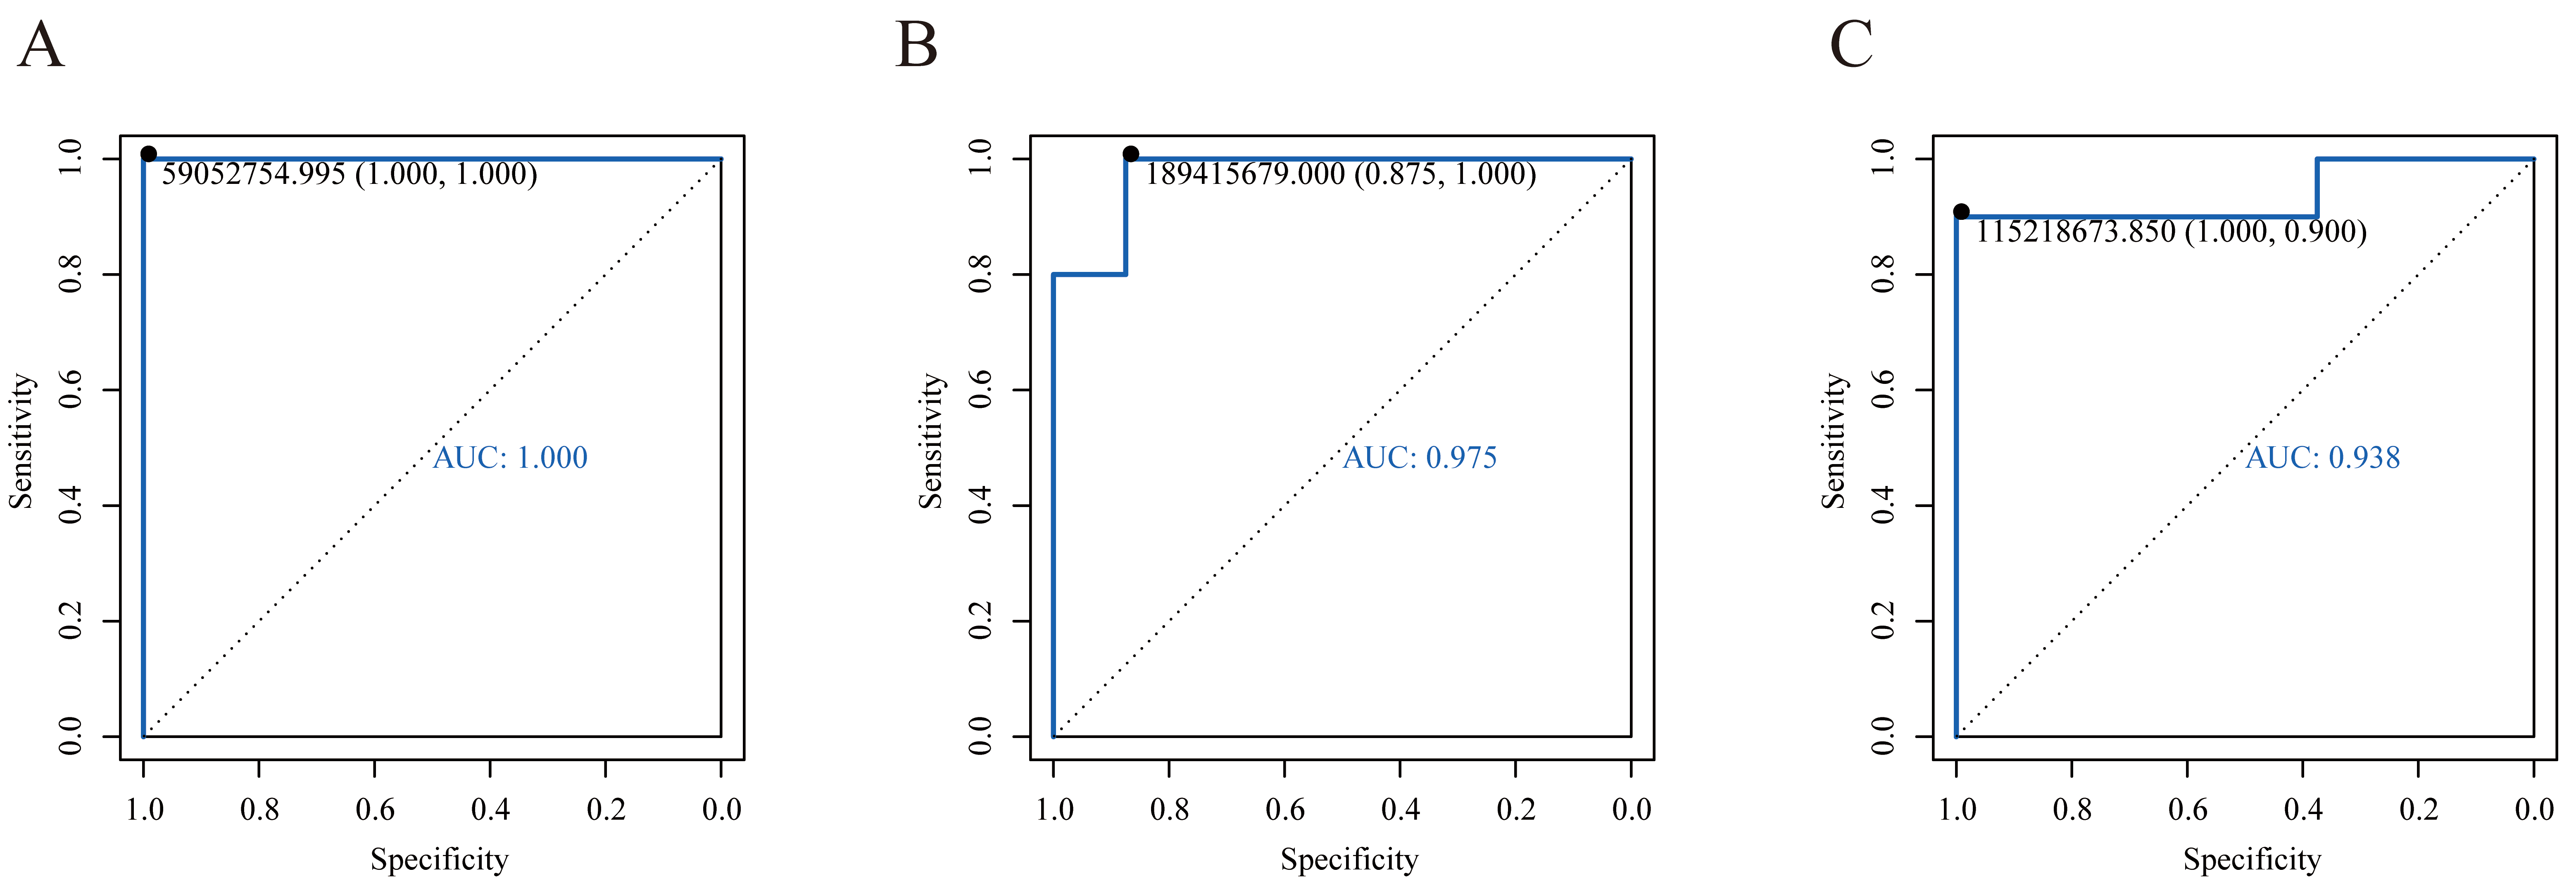 Fig. 3.
ROC curves of potential biomarkers. (A) ROC curve of Suberic acid. (B) ROC curve of 2′-O-methylcytidine. (C) ROC curve of 3′-Sialyllactose. ROC, receiver operating characteristic.
| Metabolite | AUC | AUC Mean |
Specificity | Sensitivity | Class | HMDB | p-value |
| Suberic acid | 1 | 1 |
1 | 1 | Fatty Acyls | HMDB0000893 | 0.004540413 |
| 2′-O-methylcytidine | 0.975 | 0.938 |
0.875 | 1 | Pyrimidine nucleosides | HMDB0242132 | 0.000120391 |
| 3′-Sialyllactose | 0.938 | 0.949 |
1 | 0.900 | Organooxygen compounds | HMDB0000825 | 0.000445886 |
AUC, area under the curve; HMDB, Human Metabolome Database.
By querying the HMDB database, we identified 53 differentially expressed
metabolites and retrieved their annotated gene information. This resulted in a
final set of 98 metabolite-related regulatory genes, including enzymes and
proteins. The metabolic regulatory genes were then subjected to
consistent clustering with gene expression data from 371 HCC samples in The
Cancer Genome Atlas-Liver Hepatocellular Carcinoma (TCGA-LIHC) database. When K =
2, two stable clusters were generated, and the matrix heatmap divided HCC into
two molecular subtypes, C1 and C2 (Fig. 4A). The results revealed significant
differences in the expression of metabolic regulatory genes between the two
molecular subtypes. Kaplan-Meier (KM) analysis indicated a statistically
significant difference in overall survival between the subtypes (Fig. 4B,
p
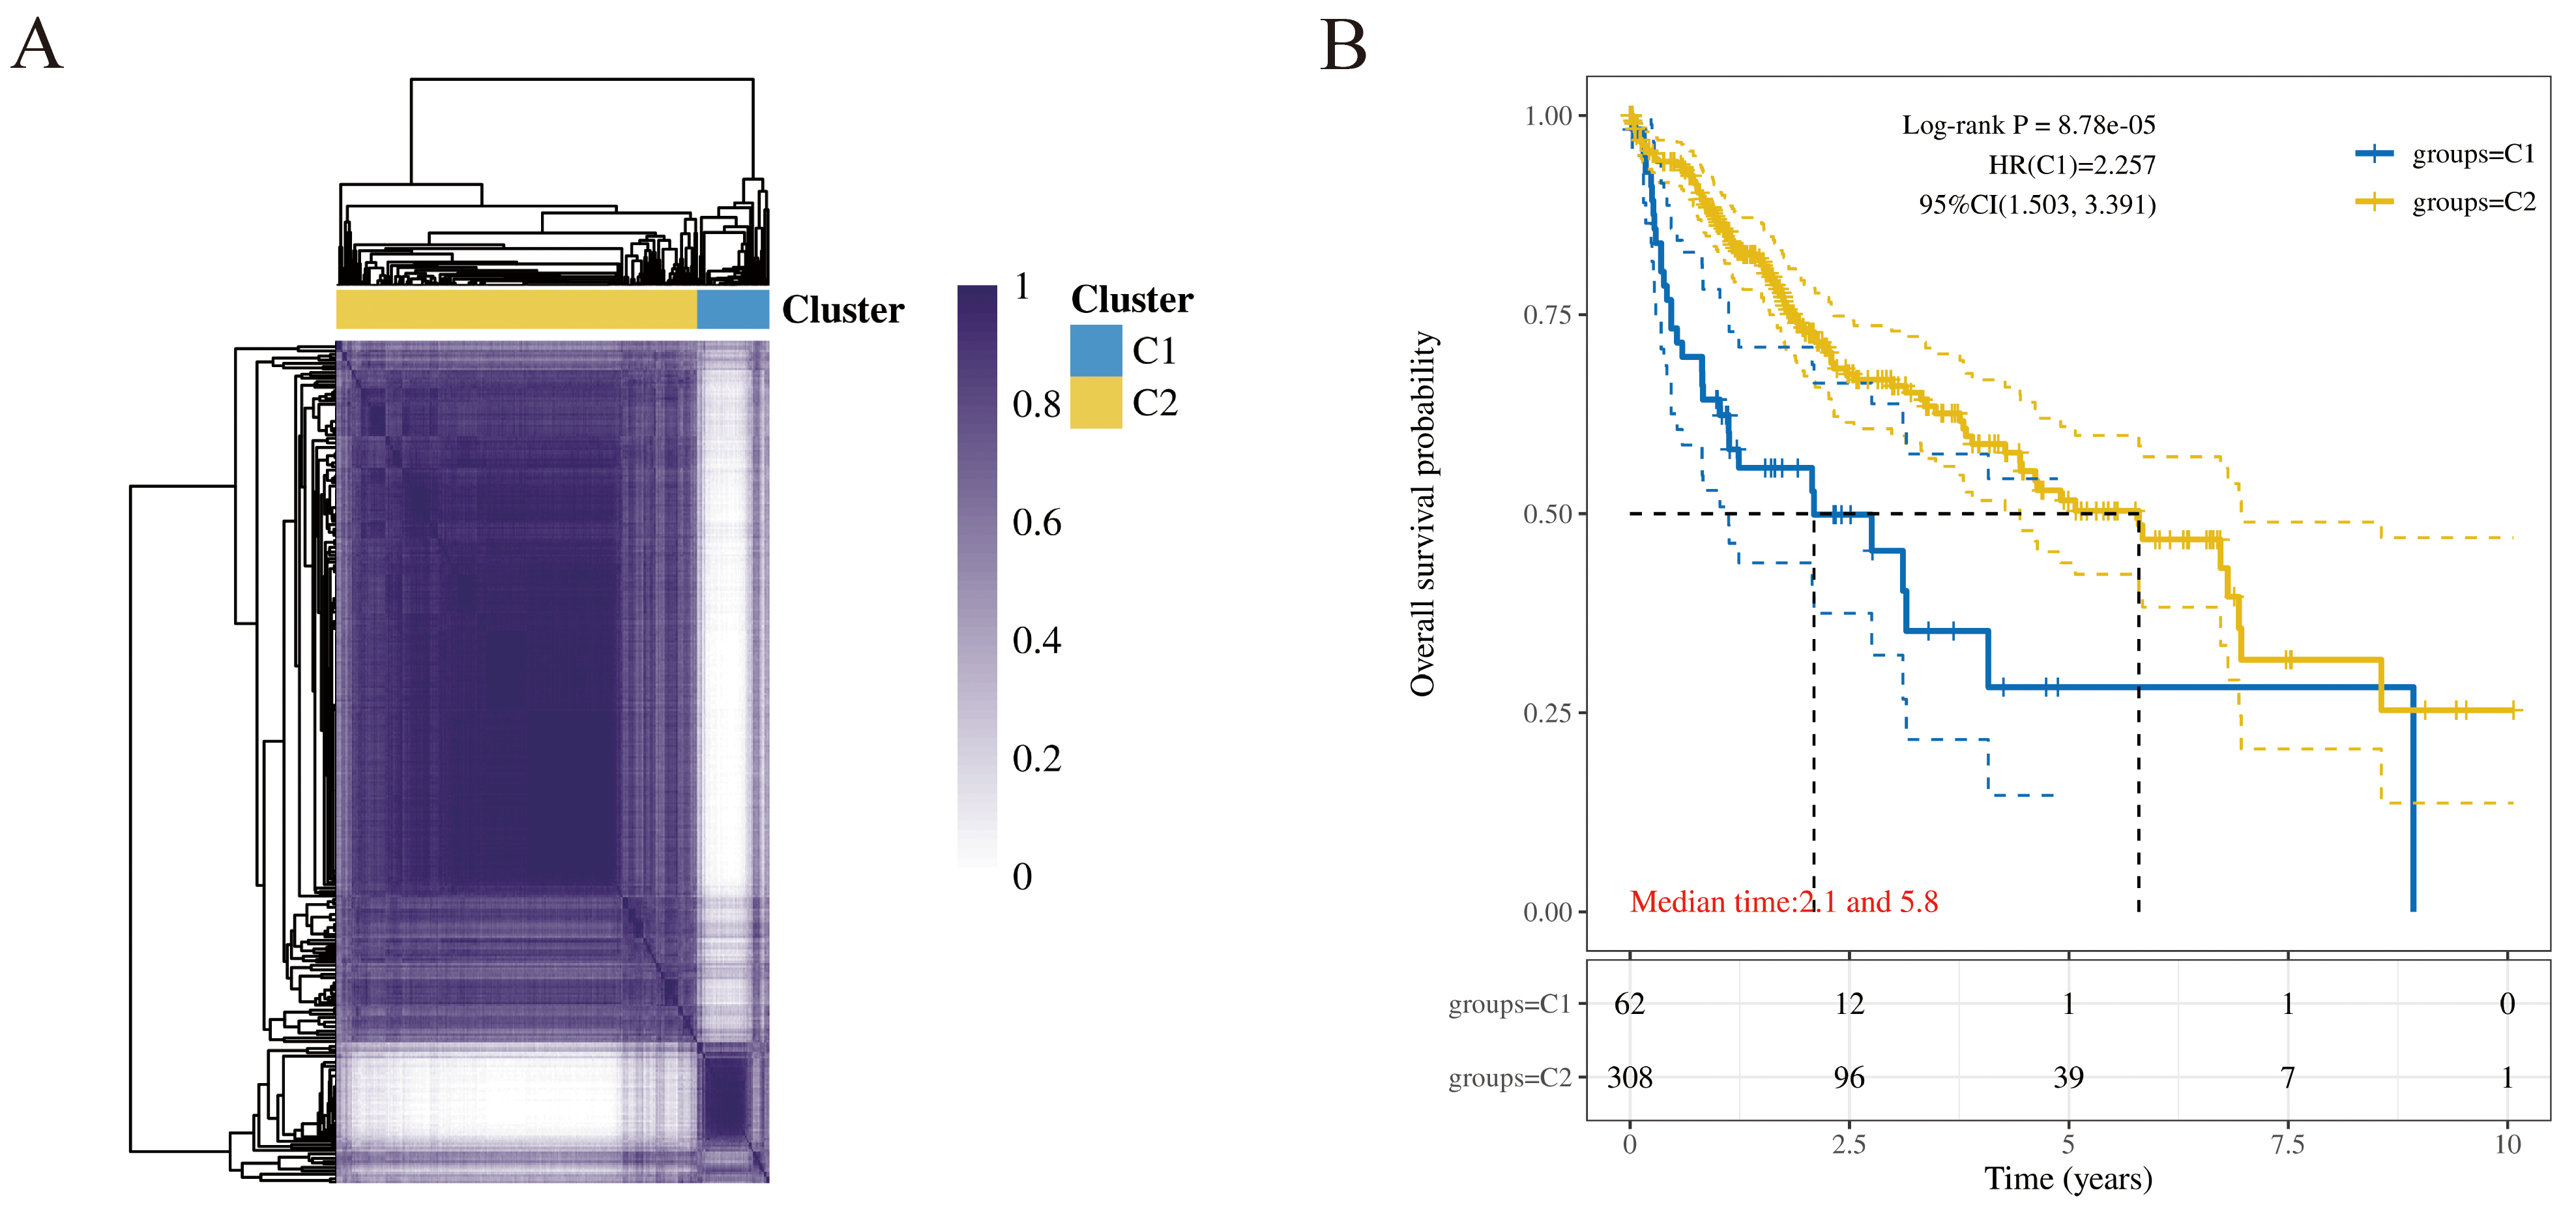 Fig. 4.
Construction and prognosis analysis of molecular subtypes in
HCC. (A) Consensus matrix heatmap of molecular subtypes. When K = 2 is the
optimal number of clusters. (B) KM survival curve of molecular subtype. Patients
in the C1 subtype had significantly shorter overall survival than those in the C2
subtype (log-rank test, p
As shown in Table 4, significant differences in clinicopathological
characteristics were observed between the C1 and C2 subtypes. Specifically, the
C1 subtype demonstrated more aggressive features, including a significantly
higher proportion of high-grade (G3/G4) tumors (p
| Item | Characteristics | C1 | C2 | p-value |
| Living conditions | Alive | 31 | 210 | 0.010 |
| Dead | 31 | 99 | ||
| Age | Mean |
59.1 |
59.5 |
0.820 |
| Gender | Female | 26 | 95 | 0.117 |
| Male | 36 | 214 | ||
| Race | American Indian | 1 | 1 | 0.266 |
| Asian | 31 | 127 | ||
| Black | 1 | 16 | ||
| White | 29 | 155 | ||
| T stage | T1 | 16 | 165 | 0.005 |
| T2 | 20 | 72 | ||
| T2a | 1 | – | ||
| T2b | 1 | – | ||
| T3 | 13 | 32 | ||
| T3a | 6 | 23 | ||
| T3b | 2 | 4 | ||
| T4 | 3 | 10 | ||
| TX | – | 1 | ||
| N stage | N0 | 43 | 209 | 0.148 |
| N1 | 2 | 2 | ||
| NX | 16 | 98 | ||
| M stage | M0 | 49 | 217 | 0.266 |
| MX | 13 | 88 | ||
| M1 | – | 4 | ||
| Clinical stage | I | 15 | 156 | 0.001 |
| II | 19 | 67 | ||
| III | – | 3 | ||
| IIIA | 17 | 48 | ||
| IIIB | 2 | 6 | ||
| IIIC | 4 | 5 | ||
| IV | – | 2 | ||
| IVA | – | 1 | ||
| IVB | – | 2 | ||
| Tumor grade | G1 | 2 | 53 | |
| G2 | 23 | 154 | ||
| G3 | 33 | 89 | ||
| G4 | 3 | 9 |
Differentially expressed genes between the two subtypes were selected based on
 Fig. 5.
Analysis of gene expression differences between molecular subtypes. (A) Volcano plot of differentially expressed genes between C1 and C2 subtypes. (B) Clustering heatmap of differential metabolites. (C–G) Hallmark, KEGG, GO gene enrichment dotplot. KEGG, Kyoto Encyclopedia of Genes and Genomes; GO, Gene Ontology.
The Tumor Immune Dysfunction and Exclusion (TIDE, http://tide.dfci.harvard.edu/) scoring tool was utilized to evaluate the potential for immune evasion in the two HCC molecular subtypes, derived from signatures of T-cell dysfunction and T-cell exclusion scores. Compared to the C2 subtype, the C1 subtype demonstrated significantly higher TIDE, Exclusion, and myeloid-derived suppressor cell (MDSC) scores, alongside a lower microsatellite instability (MSI) score (Fig. 6A–E). These results indicate that the C1 subtype is associated with a higher risk of immune evasion, potentially due to the presence of a greater number of immunosuppressive cells. Conversely, the C2 subtype, characterized by higher MSI, showed increased sensitivity to immunotherapy, suggesting a higher likelihood of clinical benefit. Consequently, the C2 subtype is associated with a more favorable prognosis, a conclusion supported by our KM survival analysis.
 Fig. 6.
Treatment prediction of molecular subtypes. (A) TIDE, Tumor
Immune Dysfunction and Exclusion. (B) Exclusion. (C) Dysfunction. (D) MDSC,
myeloid-derived suppressor cell. (E) MSI, microsatellite instability. (F) Drug
sensitivity analysis of sorafenib. The scatter points represent individual
patients from different subtypes. G1 represents the C1 subtype, and G2 represents
the C2 subtype, p = 0.019. * p
This study analyzed the transcriptomic data of HCC samples from different
molecular subtypes using the Genomics of Drug Sensitivity in Cancer (GDSC,
https://www.cancerrxgene.org/) database (Fig. 6F, p
The global mortality rate of hepatitis B-related liver disease is high, and the burden of PLC remains heavy. The early diagnosis and effective treatment of HCC are critical areas of focus, but they remain challenging. Traditional treatments often result in resistance and/or a high rate of recurrence [10, 11], as well as other challenges, including tumor heterogeneity, the immunosuppressive tumor microenvironment, and the lack of effective biomarkers. HCC is the only solid tumor that can be diagnosed based on imaging and epidemiological data without the need for pathological confirmation [12]. Accurate diagnosis and personalized treatment of PLC are crucial, as they facilitate early intervention. This approach is key to improving therapeutic efficacy, optimizing treatment regimens, and ultimately enhancing patient survival rates.
This study revealed significant differences in urinary metabolites between healthy individuals and patients with hepatitis B-related liver cancer. Understanding the patterns of these urinary metabolite changes could facilitate disease identification and diagnosis. The non-invasive diagnosis using urinary biomarkers holds significant application value in evaluating and determining an individual’s metabolic functional status [13]. Our research indicates that Suberic acid, 2′-O-methylcytidine, and 3′-Sialyllactose in urine potential as non-invasive urinary biomarkers for hepatitis B-related liver cancer. However, the study based on a relatively small size has inherent limitations and may be subject to optimism bias. We performed ten-fold cross-validation with k = 10 and times = 200, which aims to minimize this bias, although this constitutes internal validation only. In future studies, we plan to incorporate an external validation cohort to further verify these findings by expanding the sample size, refining disease classifications, and conducting stratified analyses, while also assessing the stability of these biomarkers.
Suberic acid is not only synthesized by plants but also generated endogenously within the human body [14]. During the development of HCC, alterations in the levels of suberic acid may be closely associated with mitochondrial dysfunction and disturbances in fatty acid metabolism. Cancer cells exhibit aberrant fatty acid metabolism, which may lead to altered accumulation of certain metabolic intermediates, such as suberic acid. Tumor-derived extracellular vesicles and particle-associated fatty acid cargo promote liver inflammation and the development of fatty liver [15]. Dysregulation of lipid metabolism, a central feature of liver cancer, promotes tumor growth and survival, while pro-protein convertase subtilisin/kexin type 9 (PCSK9) inhibition induces excessive lipid accumulation, thereby enhancing cancer cell susceptibility to ferroptosis [16]. 2′-O-methylcytidine, as a modified nucleotide, plays a crucial role as an epigenetic marker, particularly in the development of tumors and cancer. Extensive dysregulation of intracellular RNA modifications may influence the translation efficiency of oncogenes or tumor suppressor genes, thereby contributing to the pathogenesis of liver cancer. In hepatitis B-related liver cancer, the replication of the virus and the expression of its genes may be regulated by RNA modification mechanisms. 2′-O-methylcytidine is an effective inhibitor of hepatitis C virus (HCV) RNA replication [17]. Its levels are significantly reduced in the serum [18] and early urine samples [19] of breast cancer patients, while they are elevated in colorectal cancer organoids, particularly in response to 5-fluorouracil treatment [20]. Research has revealed notable differences in the levels of 2′-O-methylcytidine between cancerous and non-cancerous tissues [21]. 3′-Sialyllactose is an important human milk oligosaccharide with significant immunomodulatory effects [22], and it exhibits specific physiological and biochemical functions across various tissues. It has been shown to alleviate inflammation and reduce the development of atherosclerosis [23], as well as provide protective effects against lipopolysaccharide (LPS)-induced lung injury [24]. The liver is a major site for 3′-Sialyllactose distribution and metabolism [25]. 3′-Sialyllactose, in synergy with B. infantis, promotes the biosynthesis of short-chain fatty acids, enhancing intestinal barrier function and suppressing local inflammation [26]. 3′-Sialyllactose may ameliorate liver diseases via mechanisms mediated by the gut-liver axis. An increase in sialylation modification is closely associated with the metastatic potential of HCC cells and the establishment of an immunosuppressive microenvironment.
This study found that compared with healthy people, patients with hepatitis B-related liver cancer had significant changes in metabolic pathways such as cofactors and vitamins, carbohydrates, and amino acids. The seven metabolic pathways enriched in this study encompass several hallmark features of metabolic reprogramming in liver cancer, collectively reflecting the adaptive alterations in energy supply, biosynthesis, and redox balance in liver cancer cells. HBV infection is a major risk factor for liver cirrhosis and HCC [27], significantly altering the metabolic state of hepatocytes. Pantothenate and CoA biosynthesis represent the most significantly altered metabolic pathways in this study. Pantothenate is a precursor for CoA synthesis, and its deficiency can impair CoA production, disrupting the formation of acetyl-CoA and its mediation of various core metabolic processes. Acetyl-CoA can regulate the expression of HCC tumor-initiating cells associated genes through epigenetic mechanisms, such as enhanced acetylation of Histone H3 Lysine 27 (H3K27), thereby promoting the initiation and progression of HCC [28]. Its metabolic accumulation further accelerates HCC metastasis [29]. The significant enrichment of this pathway not only reflects severe metabolic dysregulation in hepatitis B-related liver disease but also underscores its critical pathological role in the malignant transformation of hepatocytes and the development of liver cancer.
This study indicates that urinary metabolic profiles can effectively classify HCC patients. The identification of cancer subtypes is a fundamental cornerstone for achieving personalized diagnosis and treatment in cancer patients [30]. The use of metabolism-related genes expression profiles has defined a new classification system for HCC, providing a framework to understand its genetic diversity [31]. Based on Hallmark and KEGG pathways enrichment analyses, two distinct molecular subtypes exhibit significant differences in pathways related to the cell cycle, metabolism, and tumor microenvironment. Our analysis revealed that the C1 subtype was associated with more aggressive clinicopathological features, including higher tumor grade and more advanced T stage, which likely contributed to its significantly poorer survival outcomes compared to the C2 subtype. These findings highlight the crucial prognostic significance of subtyping in HCC and suggest that patients with the C1 subtype may necessitate more intensive management and individualized therapeutic strategies. These findings provide important insights into liver cancer heterogeneity and form an important foundation for developing precision therapeutic strategies.
This study aimed to explore the relationship between the liver cancer immune microenvironment and tumor immune evasion based on urinary metabolic characteristics. This review has shown that HCC tumors exhibit complex interactions within the immune microenvironment [32], as abnormal glucose metabolism enables cancer cells to adapt to microenvironmental changes and evade immune surveillance [33]. Nutrient deficiency and metabolic dysregulation not only accelerate tumor progression but also compromise the functional capacity of immune cells [34]. The metabolism of MDSC can regulate their immunosuppressive functions [35], and the increase in these cells promotes the immune-tolerant tumor microenvironment [36]. The metabolic reprogramming within the tumor immune microenvironment, characterized by nutrient competition between tumor and immune cells, generates immunomodulatory metabolites. These molecules enter circulation and may be renally filtered into urine, offering a rational basis for using urinary metabolites as non-invasive biomarkers of systemic and tumor immune microenvironment-specific metabolic alterations. The metabolic profile of urinary metabolites holds the potential to reflect the immune microenvironment of liver cancer, tumor dynamics, and therapeutic responses, offering new possibilities for the study of disease progression and therapeutic interventions in liver cancer.
Although the metabolic biomarkers and associated regulatory genes identified in this study were initially derived from a hepatitis B-related liver cancer context, their significant prognostic value in the general TCGA-LIHC cohort suggests that their relevance may extend beyond HBV-driven hepatocarcinogenesis, likely reflecting a broader biological mechanism prevalent across HCC populations with diverse etiologies. HBV drives carcinogenesis by disrupting the hepatic immune microenvironment, leading to chronic inflammation and malignant transformation [37]. This is further exemplified by the specific finding that Solute Carrier Family 16 Member 3 (SLC16A3), a marker for immunosuppressive Kupffer cells, is highly expressed in HBV-positive HCC and linked to poor prognosis [38]. Thereby highlighting the significant impact of the distinctive immune microenvironment in HBV-associated HCC on tumor progression and patient outcomes. The presence of HBV DNA is not merely a biomarker of infection but a central driver that shapes the immunosuppressive HCC microenvironment. DNA sensors play a pivotal role in anti-tumor immunity, and alterations in their expression significantly influence the HCC tumor microenvironment, thereby shaping disease progression and patient prognosis [39]. While we recognize that the tumor microenvironment undoubtedly differs between HBV-infected and non-infected individuals, our findings offer only a foundational insight. Therefore, these results must be considered preliminary and require future validation in larger, etiology-stratified cohorts to confirm their generalizability and specificity.
Our study indicates that Suberic acid, 2′-O-methylcytidine, and 3′-Sialyllactose in urine demonstrate good accuracy in distinguishing between hepatitis B-related liver cancer and healthy individuals. Based on the regulatory genes associated with differential metabolites, our research identifies two distinct molecular subtypes of HCC, aiming to advance the development of precision and personalized diagnosis and treatment for PLC. However, this study still has some limitations. Firstly, the sample size is relatively small, and it is necessary to increase the sample size to validate and explore the association between metabolites and PLC, as well as potential biomarkers. Secondly, further validation and optimization of the stability and reliability of the prognostic model are required.
The dataset that used, analyzed, or generated in this research is available from the corresponding author upon reasonable request.
HW and HL were responsible for experimental design and manuscript writing. MFL and XZ provided guidance on experimental design and manuscript revisions. FL, RZ, MPL participated in the collection of clinical samples and data. YW, FS, YZ conducted the analysis of results and data interpretation. All authors contributed to editorial changes in the manuscript. All authors read and approved the final manuscript. All authors have participated sufficiently in the work and agreed to be accountable for all aspects of the work.
This study was approved and authorized by the Ethics Committee of the First Affiliated Hospital of Guangxi University of Chinese Medicine (approval No. Z-A 2023-013-01), and was conducted in accordance with the principles of the Declaration of Helsinki. Informed consent was obtained from either the participants or their family members prior to specimen collection.
We sincerely thank the patients for their involvement in this study. We are grateful to Gene Denovo Biotechnology Co., Ltd. (Guangzhou, China) for assisting in the metabolite and bioinformatics analyses.
This research was funded by Natural Science Foundation of Guangxi, grant number 2025GXNSFDA069035, 2025GXNSFAA069372; Self-funded Scientific Research Project in Western Medicine by the Guangxi Health Commission, grant number Z-A20230917.
The authors declare no conflict of interest. Although we received technical assistance from Gene Denovo Biotechnology Co., Ltd., the judgments in data interpretation and writing were not influenced by this relationship.
Publisher’s Note: IMR Press stays neutral with regard to jurisdictional claims in published maps and institutional affiliations.