


 , Jiao Peng 2,†, Xiaoyu Pan 3, Yuefeng Kong 3, Haisong Lin 4,5, Suchun Wei 4,5, Yi Zhan 1,*
 , Siping Zeng 1,*
1 Department of Urology, The Fourth Affiliated Hospital of Guangxi Medical University, 545005 Liuzhou, Guangxi, China
2 Department of Radiology, The Fourth Affiliated Hospital of Guangxi Medical University, 545005 Liuzhou, Guangxi, China
3 Department of Radiology, The First Affiliated Hospital of Guangxi Medical University, 530021 Nanning, Guangxi, China
4 Institute of Urology and Nephrology, The First Affiliated Hospital of Guangxi Medical University, Guangxi Medical University, 530021 Nanning, Guangxi, China
5 Center for Genomic and Personalized Medicine, Guangxi Key Laboratory for Genomic and Personalized Medicine, Guangxi Collaborative Innovation Center for Genomic and Personalized Medicine, Guangxi Medical University, 530021 Nanning, Guangxi, China
†These authors contributed equally.
Abstract
Resistance to anoikis is a critical mechanism that enables metastatic dissemination. Abrogation of this cellular safeguard is therefore a hallmark of aggressive cancer progression. Despite the importance of anoikis, there are still few biomarkers among anoikis-related genes (ARGs) that could aid in the prognostication of bladder cancer (BC) patients and potentially serve as drug targets.
This study leveraged bioinformatics analyses of publicly available BC datasets to evaluate the association between differentially expressed ARGs and patient prognosis. Least Absolute Shrinkage and Selection Operator (LASSO) regression analysis was employed to build a novel prognostic signature model for BC based on ARGs. This model was also used to predict the response of BC to anticancer drugs. Additionally, immunohistochemistry was used to assess expression of the key gene, MYC, in BC samples obtained from patients undergoing surgery and from those receiving immune checkpoint inhibitor (ICI) therapy.
The ARG-based signature, developed and validated through the analysis of public databases, was an independent predictor of patient outcomes. Furthermore, it effectively stratified patients into two cohorts (high- and low-risk), allowing investigation of differential drug sensitivities. The risk stratification model identified 10 ARGs (IGF1, CALR, E2F1, MYC, PLK1, SATB1, FASN, ID2, RAC3, and GKN1) as potential therapeutic vulnerabilities. Notably, MYC was identified as a central hub gene within the ARG signature. Elevated MYC expression was strongly associated with worse prognosis in muscle-invasive bladder cancer (MIBC), and with a diminished response to immunotherapy.
This work demonstrated significant prognostic value for the ARG-based model. Specific ARGs could function as crucial biomarkers for patient outcome, while simultaneously offering new avenues for therapeutic intervention.
Keywords
- bladder cancer
- anoikis
- MYC
- immunohistochemistry
- immunotherapy
Bladder cancer (BC) ranks as the fourth most common malignancy globally in males and the ninth in females [1]. As the most prevalent neoplasm of the urinary tract, it constitutes approximately 4% of all adult malignancies and presents a growing health problem due to its rising incidence worldwide [2]. While immune checkpoint inhibitor (ICI) therapy has revolutionized the treatment of advanced BC, its efficacy is limited to a subset of patients. Current biomarkers, such as Programmed Cell Death Ligand 1 (PD-L1) expression, tumor mutational burden (TMB), and Fibroblast Growth Factor Receptor (FGFR) alterations, have shown inconsistent predictive power and/or low incidence, leaving a critical unmet need for robust biomarkers to guide patient selection and improve outcomes [3, 4]. For instance, PD-L1 expression does not reliably predict response in all patients, and high TMB is found in only a fraction of cases. This highlights the need to explore novel biological pathways that drive malignancy and treatment resistance in BC.
A fundamental process co-opted by cancer cells for metastatic dissemination is the evasion of anoikis, which is a form of programmed cell death initiated upon detachment from the extracellular matrix (ECM) [5, 6]. This cellular safeguard is orchestrated by a complex network of molecular regulators, including integrin signaling, the Phosphoinositide 3-kinase (PI3K)/AKT and Focal Adhesion Kinase (FAK) pathways, and BCL-2 family proteins [7]. Resistance to anoikis, a recognized hallmark of cancer, allows tumor cells to survive in circulation and colonize distant organs. Anoikis has been strongly implicated in the progression of numerous cancer types, including breast and prostate cancer [8, 9]. Despite its fundamental importance, the possibility of leveraging anoikis-related genes (ARGs) to create prognostic tools for BC patients has been largely overlooked. While ARG-based signatures have shown promise in other malignancies [10, 11], their application to BC, especially for predicting response to immunotherapy, remains unknown.
The aim of this study was therefore to develop and validate a novel ARG-based prognostic signature for BC, and to evaluate its predictive value for clinical outcomes and response to ICI therapy. We sought to identify key regulatory genes, with a particular focus on MYC as a potential biomarker and therapeutic target. Moreover, we leveraged clinical and pathological data from local BC cohorts (The First Affiliated Hospital of Guangxi Medical University, GXMU; and The Fourth Affiliated Hospital of Guangxi Medical University, FAH) and recent immunotherapy recipients. Our analysis confirmed that expression of the hub gene MYC in BC was significantly associated with advanced T stage, poor prognosis, and the efficacy of ICI therapy.
Transcriptomic (RNA-seq) and corresponding clinical data for BC was extracted from The Cancer Genome Atlas (TCGA-BLCA cohort, comprising 412 tumor and 19 normal samples) and the Gene Expression Omnibus (GEO accession: GSE13507). A comprehensive list of ARGs was curated from the Harmonizome and GeneCards databases, retaining genes with a relevance score exceeding 0.4. To investigate the tumor immune microenvironment, immune cell infiltration data were retrieved from the Tumor Immune Estimation Resource (TIMER) [12]. Furthermore, to evaluate the predictive utility of our model for immunotherapy outcomes, we incorporated the IMvigor210 trial cohort, a real-world dataset of urothelial cancer patients treated with Atezolizumab post-chemotherapy [13].
Differential expression analysis was performed to identify ARGs with altered
expression in BC compared to normal tissues. This utilized the TCGA-BLCA dataset
and the “limma” R package (version 3.54.2; Bioconductor, www.bioconductor.org),
with a false discovery rate (FDR)
To stratify BC patients into distinct molecular subtypes, we performed consensus clustering based on the expression profiles of the prognostic ARGs and the “ConsensusClusterPlus” package (version 1.54.0; Bioconductor, www.bioconductor.org; settings: 1000 reps, 80% item resampling, Pearson distance, and Ward’s linkage algorithm). Differences in overall survival (OS) among the identified subtypes were assessed using the Kaplan-Meier (KM) method. Techniques including Principal Component Analysis (PCA), Uniform Manifold Approximation and Projection (UMAP), and t-distributed Stochastic Neighbor Embedding (tSNE) were used to evaluate the clustering accuracy. Expression patterns and clinicopathological correlations were depicted in heatmaps and box plots. We also examined immune infiltration patterns and pathway enrichment differences among clusters by Gene Set Variation Analysis (GSVA) and Gene Set Enrichment Analysis (GSEA) analyses using MSigDB’s Kyoto Encyclopedia of Genes and Genomes (KEGG) and Hallmark gene sets, respectively.
Initially, univariate Cox regression analysis (“survival” R package) was used
to screen for ARGs with prognostic significance. These were further refined using
the “glmnet” package to build a LASSO-Cox model (10-fold cross-validation to
select the optimal lambda value), creating a prognostic signature for predicting
outcomes in BC patients. This signature was expressed as a risk score equation:
ARG-based risk score =
To enhance clinical utility, a nomogram was developed by integrating the ARG-based risk score with clinicopathological variables. The nomogram was constructed and internally validated using the entire TCGA cohort. Its performance was rigorously assessed via the concordance index (C-index) and calibration plots, which compare predicted probabilities against observed survival rates. The LASSO model construction inherently mitigates overfitting by taking into account the number of included variables. The net clinical benefit of this predictive model was further evaluated through decision curve analysis (DCA) [14].
The tumor immune landscape was characterized by estimating immune cell infiltration levels with the CIBERSORT and single-cell gene expression clustering analysis (ssGSEA) algorithms [15], and subsequently compared between distinct risk groups. To gain deeper insights into immune heterogeneity at a higher resolution, single-cell RNA sequencing data was leveraged from the Tumor Immune Single-Cell Hub (TISCH) [16]. Potential sensitivity to various anticancer agents was inferred by querying the Genomics of Drug Sensitivity in Cancer (GDSC) database [17], with all analyses executed in the R environment. Additionally, we performed correlation analysis between MYC and CD274 (the gene encoding PD-L1) expression using the TCGA-BLCA cohort.
To visualize the relationships among differentially expressed ARGs, a
protein-protein interaction (PPI) network was generated using the STRING database
(confidence score
We retrospectively enrolled a primary cohort of 81 BC patients who underwent either radical cystectomy (RC) or transurethral resection of bladder tumor (TURBT) at The First Affiliated Hospital of Guangxi Medical University (GXMU) between October 2012 and December 2021. These patients had not been treated with any form of adjuvant therapy prior to their surgery. This study received ethical approval from the institutional review board of The First Affiliated Hospital of Guangxi Medical University (Approval No. 2024-K054-01). The study was carried out in accordance with the guidelines of the Declaration of Helsinki. Clinical data was collected from each participant following the acquisition of written informed consent. The clinical information for these patients is presented in Table 1.
| Clinical variables | Total: 81 (%) | MYC expression | p-value* | ||
| Negative | Positive | ||||
| Age (years) | 23 (28.40%) | 9 | 14 | ||
| 58 (71.60%) | 12 | 46 | 0.0999 | ||
| Gender | Male | 57 (70.37%) | 13 | 44 | |
| Female | 24 (29.63%) | 8 | 16 | 0.4065 | |
| T | T1 | 23 (28.40%) | 11 | 12 | |
| T2–T4 | 58 (71.60%) | 10 | 48 | 0.0098 | |
| N | N0–N1 | 60 (74.07%) | 18 | 42 | |
| N2–N3 | 21 (25.93%) | 3 | 18 | 0.2472 | |
| M | M0 | 62 (76.54%) | 17 | 45 | |
| M1 | 19 (23.46%) | 4 | 15 | 0.7669 | |
*Fisher’s exact test. BC, bladder cancer.
Furthermore, to assess the predictive value for immunotherapy, two separate validation cohorts were established, comprising 43 and 38 BC patients treated at our institution between November 2019 and August 2021. The cohort of patients received treatment regimens centered on ICIs, which were administered either as stand-alone therapy or combined with platinum-based chemotherapy. The effectiveness of treatment was assessed according to the immune Response Evaluation Criteria in Solid Tumors (iRECIST). This classifies patient outcomes into four categories: complete response (CR), partial response (PR), stable disease (SD), and progressive disease (PD). Key clinical information and treatment outcomes for these cohorts are summarized in Tables 2,3.
| Clinical variables | Total: 43 (%) | MYC expression | p-value* | ||
| Low | High | ||||
| Age (years) | 11 (25.58%) | 6 | 5 | ||
| 32 (74.42%) | 7 | 25 | - | ||
| Gender | Male | 24 (55.81%) | 5 | 19 | |
| Female | 19 (44.19%) | 8 | 11 | - | |
| T | T1 | 11 (25.58%) | 3 | 8 | |
| T2 | 9 (20.93%) | 2 | 7 | ||
| T3 | 17 (39.53%) | 6 | 11 | ||
| T4 | 5 (11.63%) | 2 | 3 | ||
| Tx | 1 (2.33%) | 0 | 1 | - | |
| N | N0 | 10 (23.26%) | 2 | 8 | |
| N1 | 10 (23.26%) | 5 | 5 | ||
| N2 | 12 (27.91%) | 5 | 7 | ||
| N3 | 4 (9.30%) | 1 | 3 | ||
| Nx | 7 (16.28%) | 0 | 7 | - | |
| M | M0 | 18 (41.86%) | 8 | 10 | |
| M1 | 20 (46.51%) | 4 | 16 | ||
| Mx | 5 (11.63%) | 1 | 4 | - | |
| Efficacy | CR | 2 (4.65%) | 1 | 1 | |
| PR | 8 (18.60%) | 5 | 3 | ||
| SD | 20 (46.51%) | 3 | 17 | ||
| PD | 13 (30.23%) | 4 | 9 | 0.044 (PD + SD vs. CR + PR) | |
*Fisher’s exact test. PD, progressive disease; SD, stable disease; CR, complete response; PR, partial response.
| Clinical variables | Total: 38 (%) | MYC expression | p-value* | ||
| Low | High | ||||
| Age (years) | 10 (26.32%) | 5 | 5 | ||
| 28 (73.68%) | 5 | 23 | - | ||
| Gender | Male | 21 (55.26%) | 6 | 15 | |
| Female | 17 (44.74%) | 4 | 13 | - | |
| T | T1 | 8 (21.05%) | 2 | 6 | |
| T2 | 9 (23.68%) | 2 | 7 | ||
| T3 | 14 (36.84%) | 4 | 10 | ||
| T4 | 6 (15.79%) | 2 | 4 | ||
| Tx | 1 (2.63%) | 0 | 1 | - | |
| N | N0 | 9 (23.68%) | 2 | 7 | |
| N1 | 9 (23.68%) | 3 | 6 | ||
| N2 | 8 (21.05%) | 3 | 5 | ||
| N3 | 6 (15.79%) | 2 | 4 | ||
| Nx | 6 (15.79%) | 0 | 6 | - | |
| M | M0 | 15 (39.47%) | 6 | 9 | |
| M1 | 19 (50.00%) | 3 | 16 | ||
| Mx | 4 (10.53%) | 1 | 3 | - | |
| Efficacy | CR | 2 (5.26%) | 1 | 1 | |
| PR | 7 (18.42%) | 4 | 3 | ||
| SD | 18 (47.37%) | 2 | 16 | ||
| PD | 11 (28.95%) | 3 | 8 | 0.036 (PD + SD vs. CR + PR) | |
*Fisher’s exact test.
For the immunohistochemical analysis, tissue samples were prepared and stained
using a c-MYC monoclonal antibody (Proteintech, Cat ID: 67447-1-Ig), followed by
a standardized staining procedure. Human colorectal cancer tissues served as
controls. Staining intensity and coverage were quantified, and these metrics were
combined into a composite score to determine positivity using the H-score method:
H-score =
The overall analytical workflow for this study is depicted in Fig. 1. A total of 516 ARGs were retrieved from the Genecards and Harmonizome databases (Supplementary Table 1). Subsequent differential expression analysis identified 136 ARGs that were significantly dysregulated between BC and normal tissues (Supplementary Table 2). A heatmap illustrates the expression patterns of the top 50 up- and down-regulated genes (Fig. 2A), while a volcano plot visualizes the complete set of differentially expressed ARGs (Fig. 2B). Genes that were significantly upregulated included IGF1, a potent survival factor, and FASN (Fatty Acid Synthase), which is crucial for metabolic reprogramming. This is consistent with their known roles in promoting cancer cell survival and resistance to anoikis [18, 19]. Conversely, genes like GKN1, a putative tumor suppressor, were downregulated.
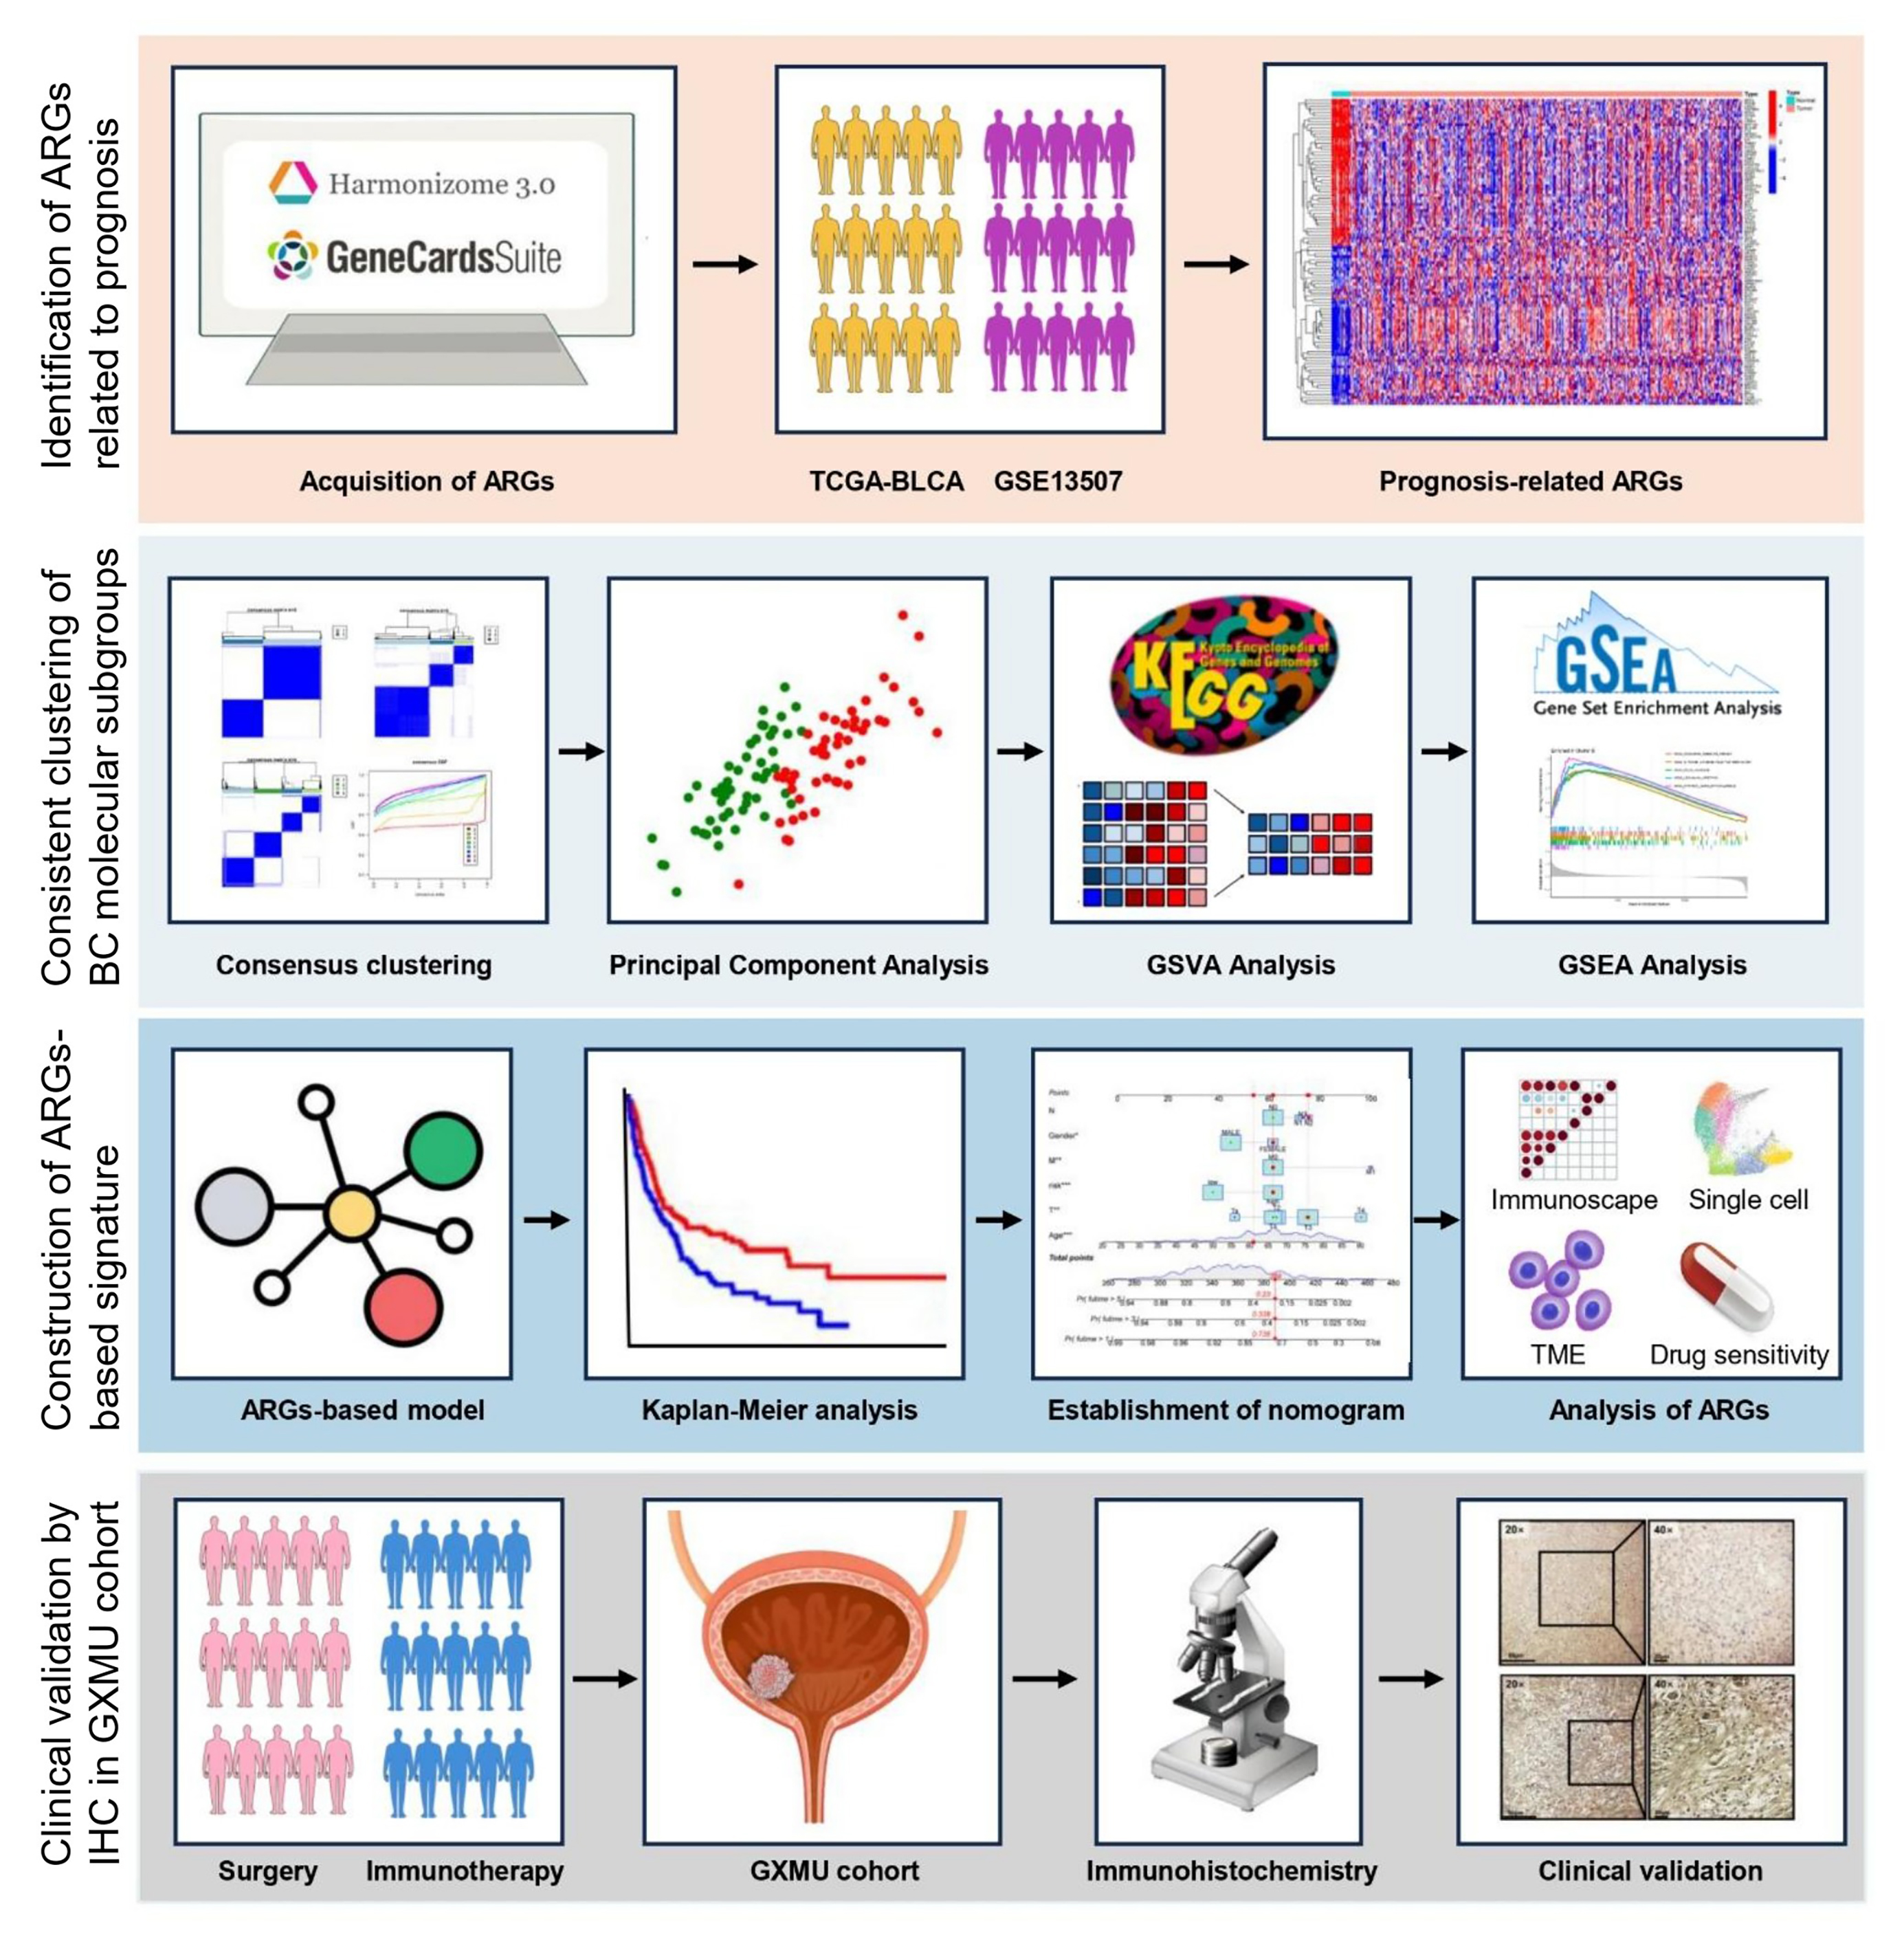 Fig. 1.
Schematic representation of the overall design and step-by-step workflow of this investigation.
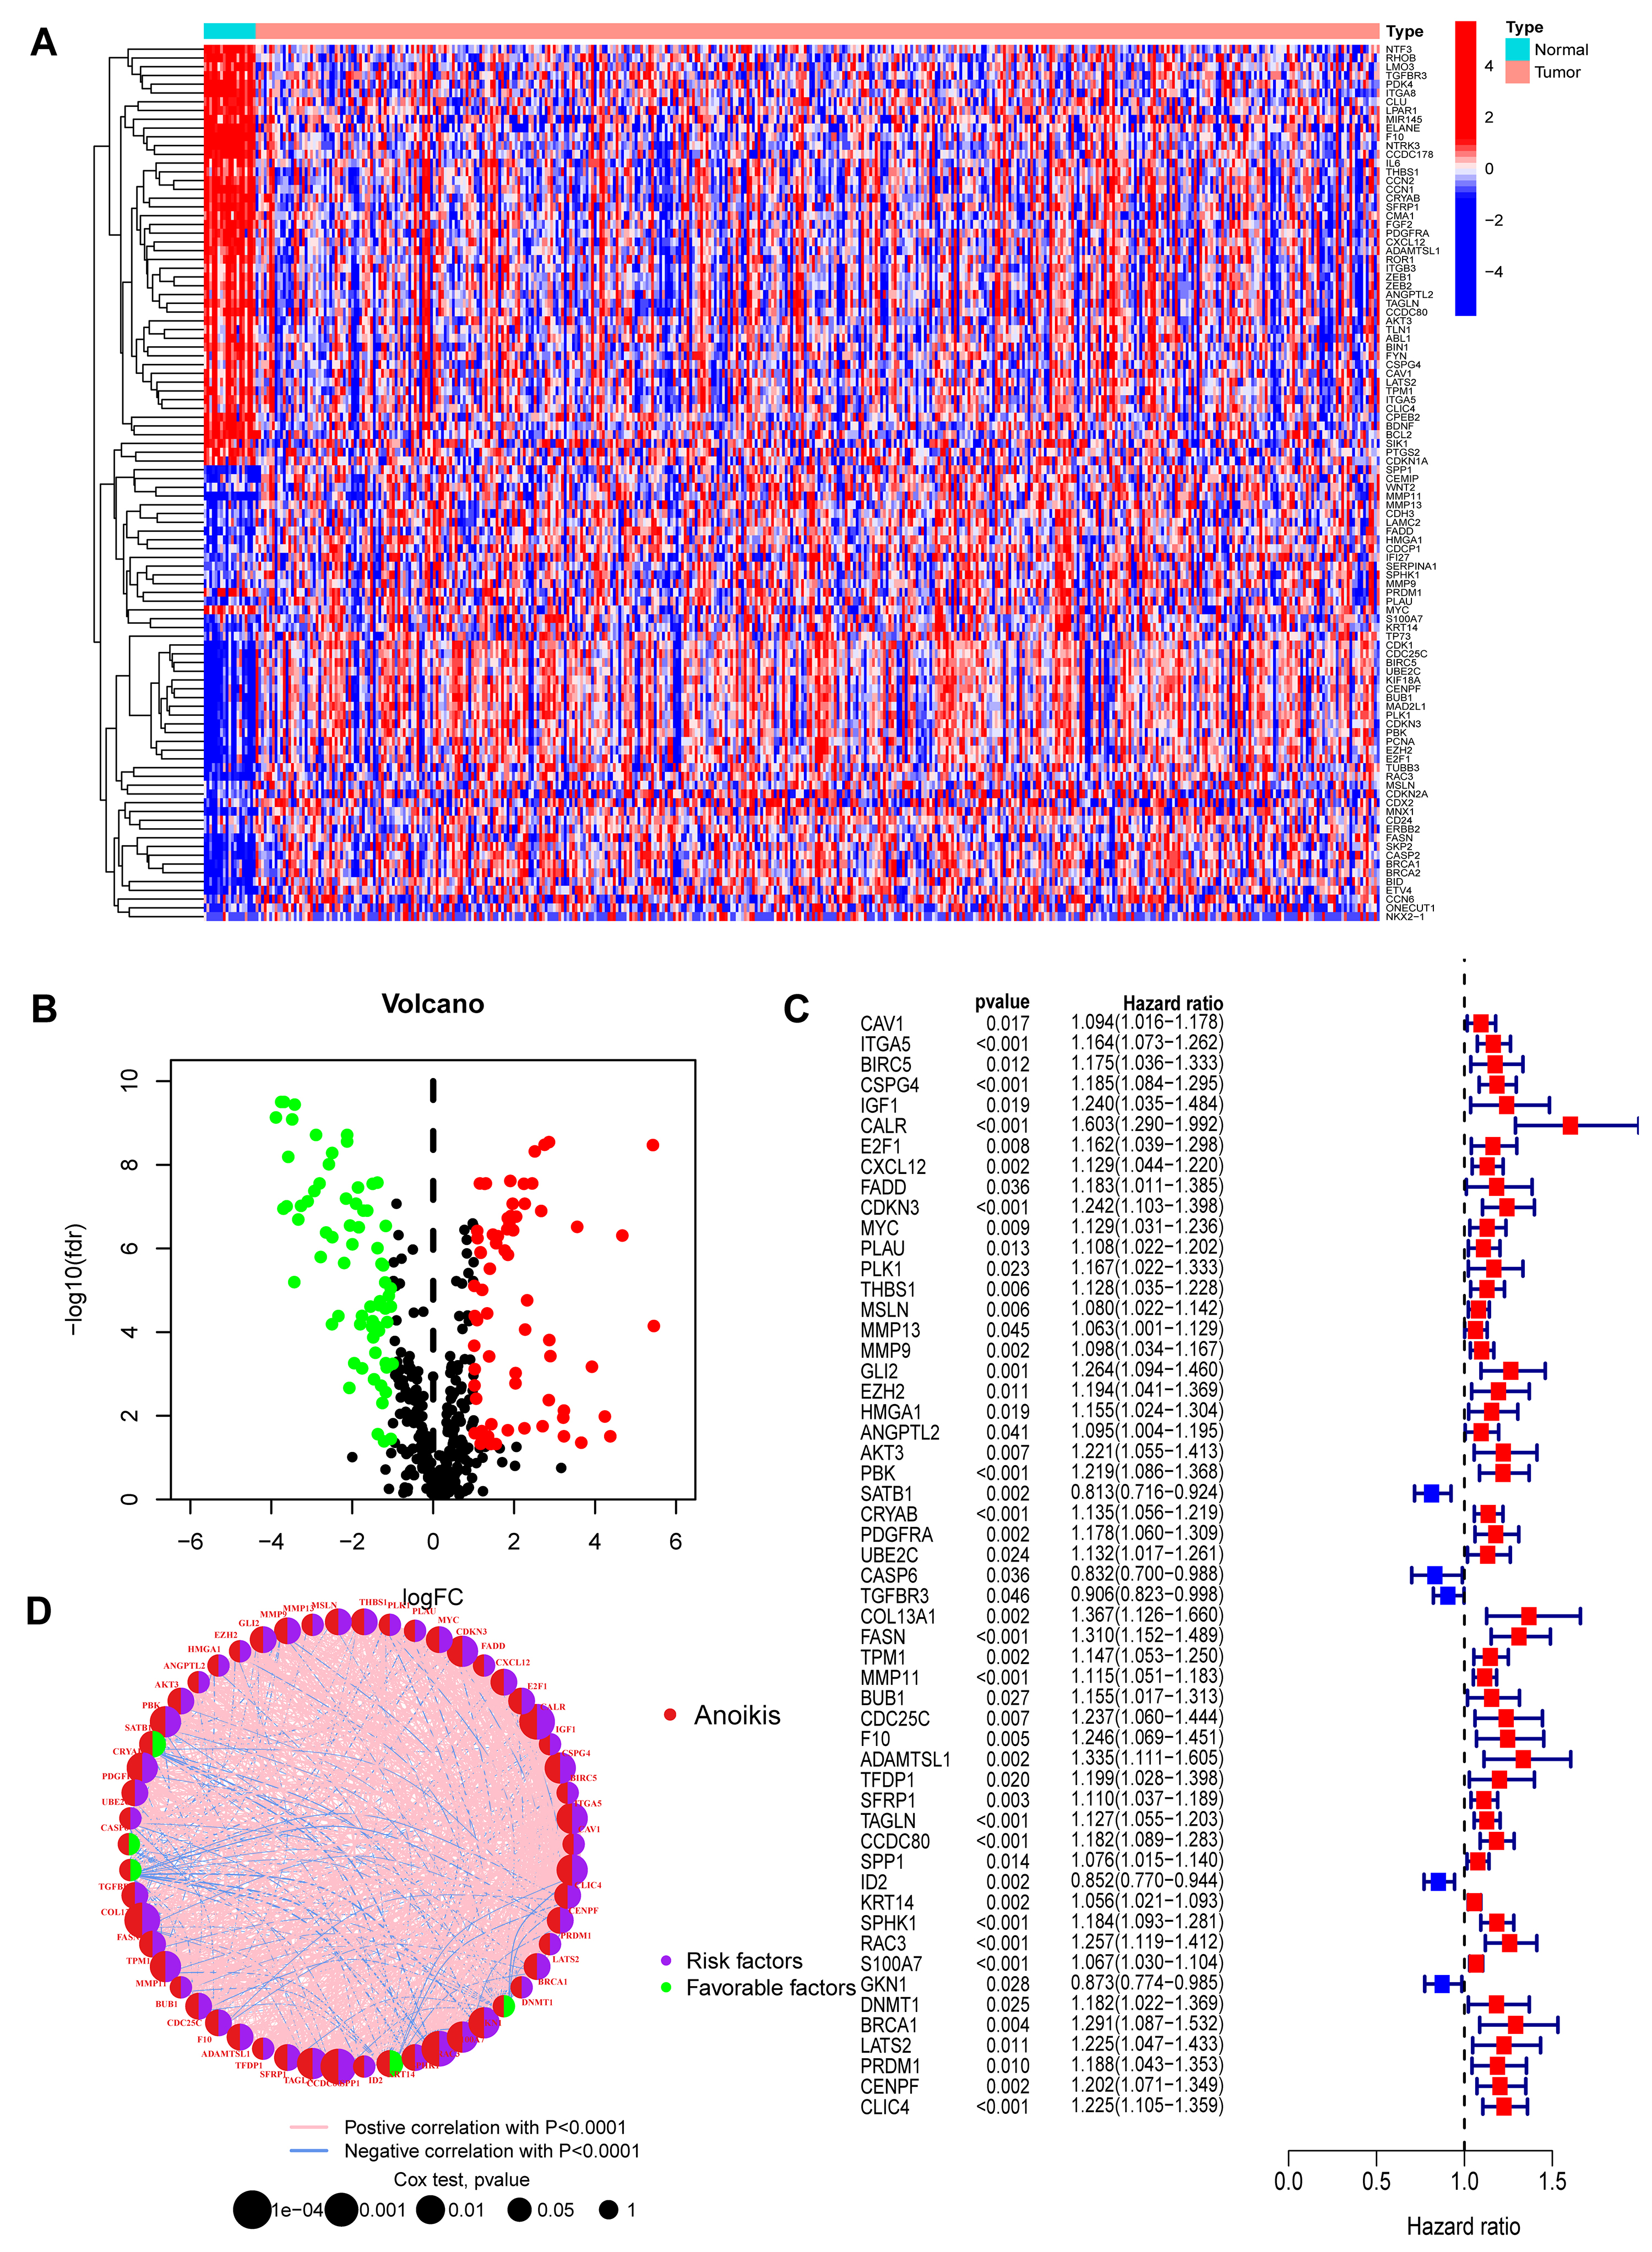 Fig. 2.
Identification and characterization of prognostic
anoikis-related genes (ARGs) in bladder cancer. (A) Heatmap displaying the
expression patterns of the top 50 differentially expressed ARGs (25 up-regulated,
25 down-regulated) between BC and normal tissues. The selection criteria were FDR
Univariate Cox regression analysis was performed on the 136 ARGs to evaluate
their prognostic significance. This identified 54 genes that were significantly
correlated with survival outcomes in the BC cohort (p
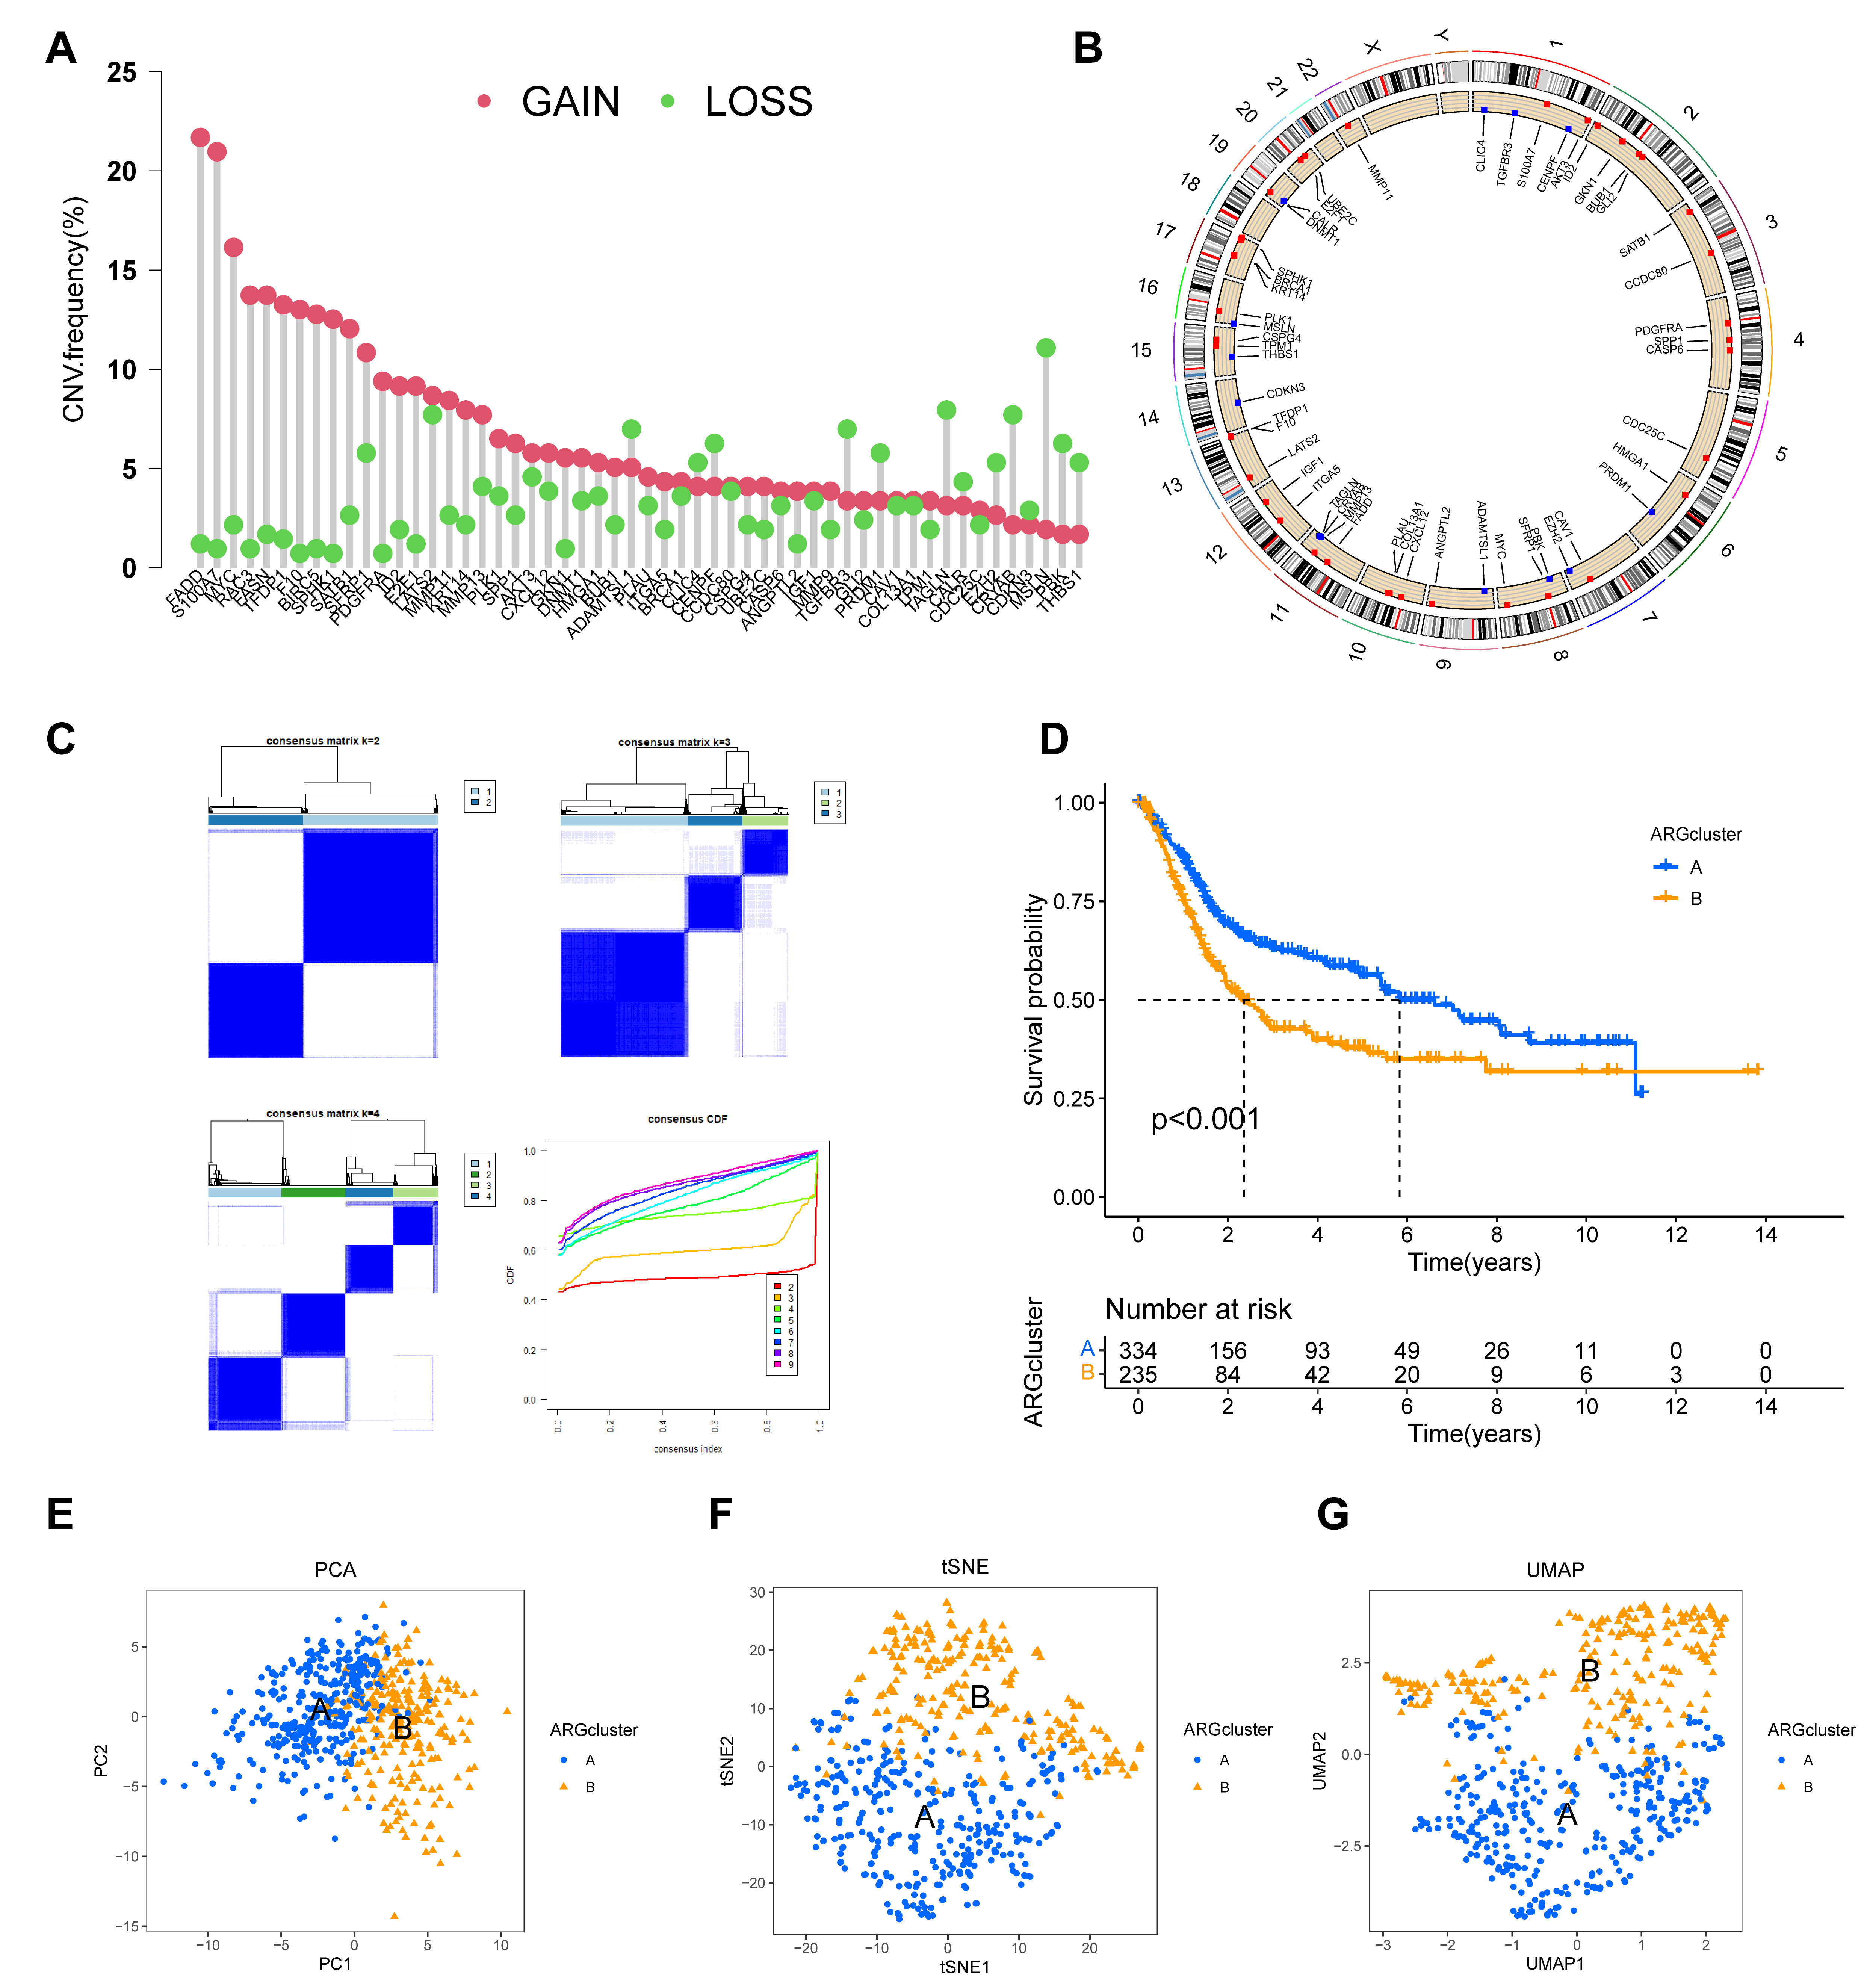 Fig. 3.
Construction and validation of two distinct molecular subtypes
based on prognostic ARG expression. (A,B) Genomic landscape of the 54 prognostic
ARGs, showing their copy number variation (CNV) frequency (A) and chromosomal
locations (B). (C) Consensus clustering matrix for the prognostic ARGs,
indicating that k = 2 is the optimal number for classifying the cohort into two
distinct subtypes. (D) Kaplan-Meier survival curves comparing the overall
survival between the two ARG-defined subtypes (ARGcluster A and B), demonstrating
a significant difference in patient survival (p
To stratify patients based on the expression profiles of the 54 prognostic ARGs,
consensus clustering was performed using the “ConsensusClusterPlus” R package.
This analysis optimally partitioned the BC cohort into two distinct molecular
subtypes (k = 2), hereafter referred to as ARGcluster A and B (Fig. 3C;
Supplementary Table 4). Kaplan-Meier analysis revealed a significant
difference in OS between these groups (p
We next explored the clinicopathological and molecular characteristics of these ARG-defined subtypes. A heatmap illustrates the differential expression of the 54 ARGs across the two clusters, alongside associated clinical features (Fig. 4A). Boxplots further visualize these expression differences (Fig. 4B). Moreover, analysis of the tumor microenvironment indicated different immune infiltration patterns between the subtypes (Fig. 4C).
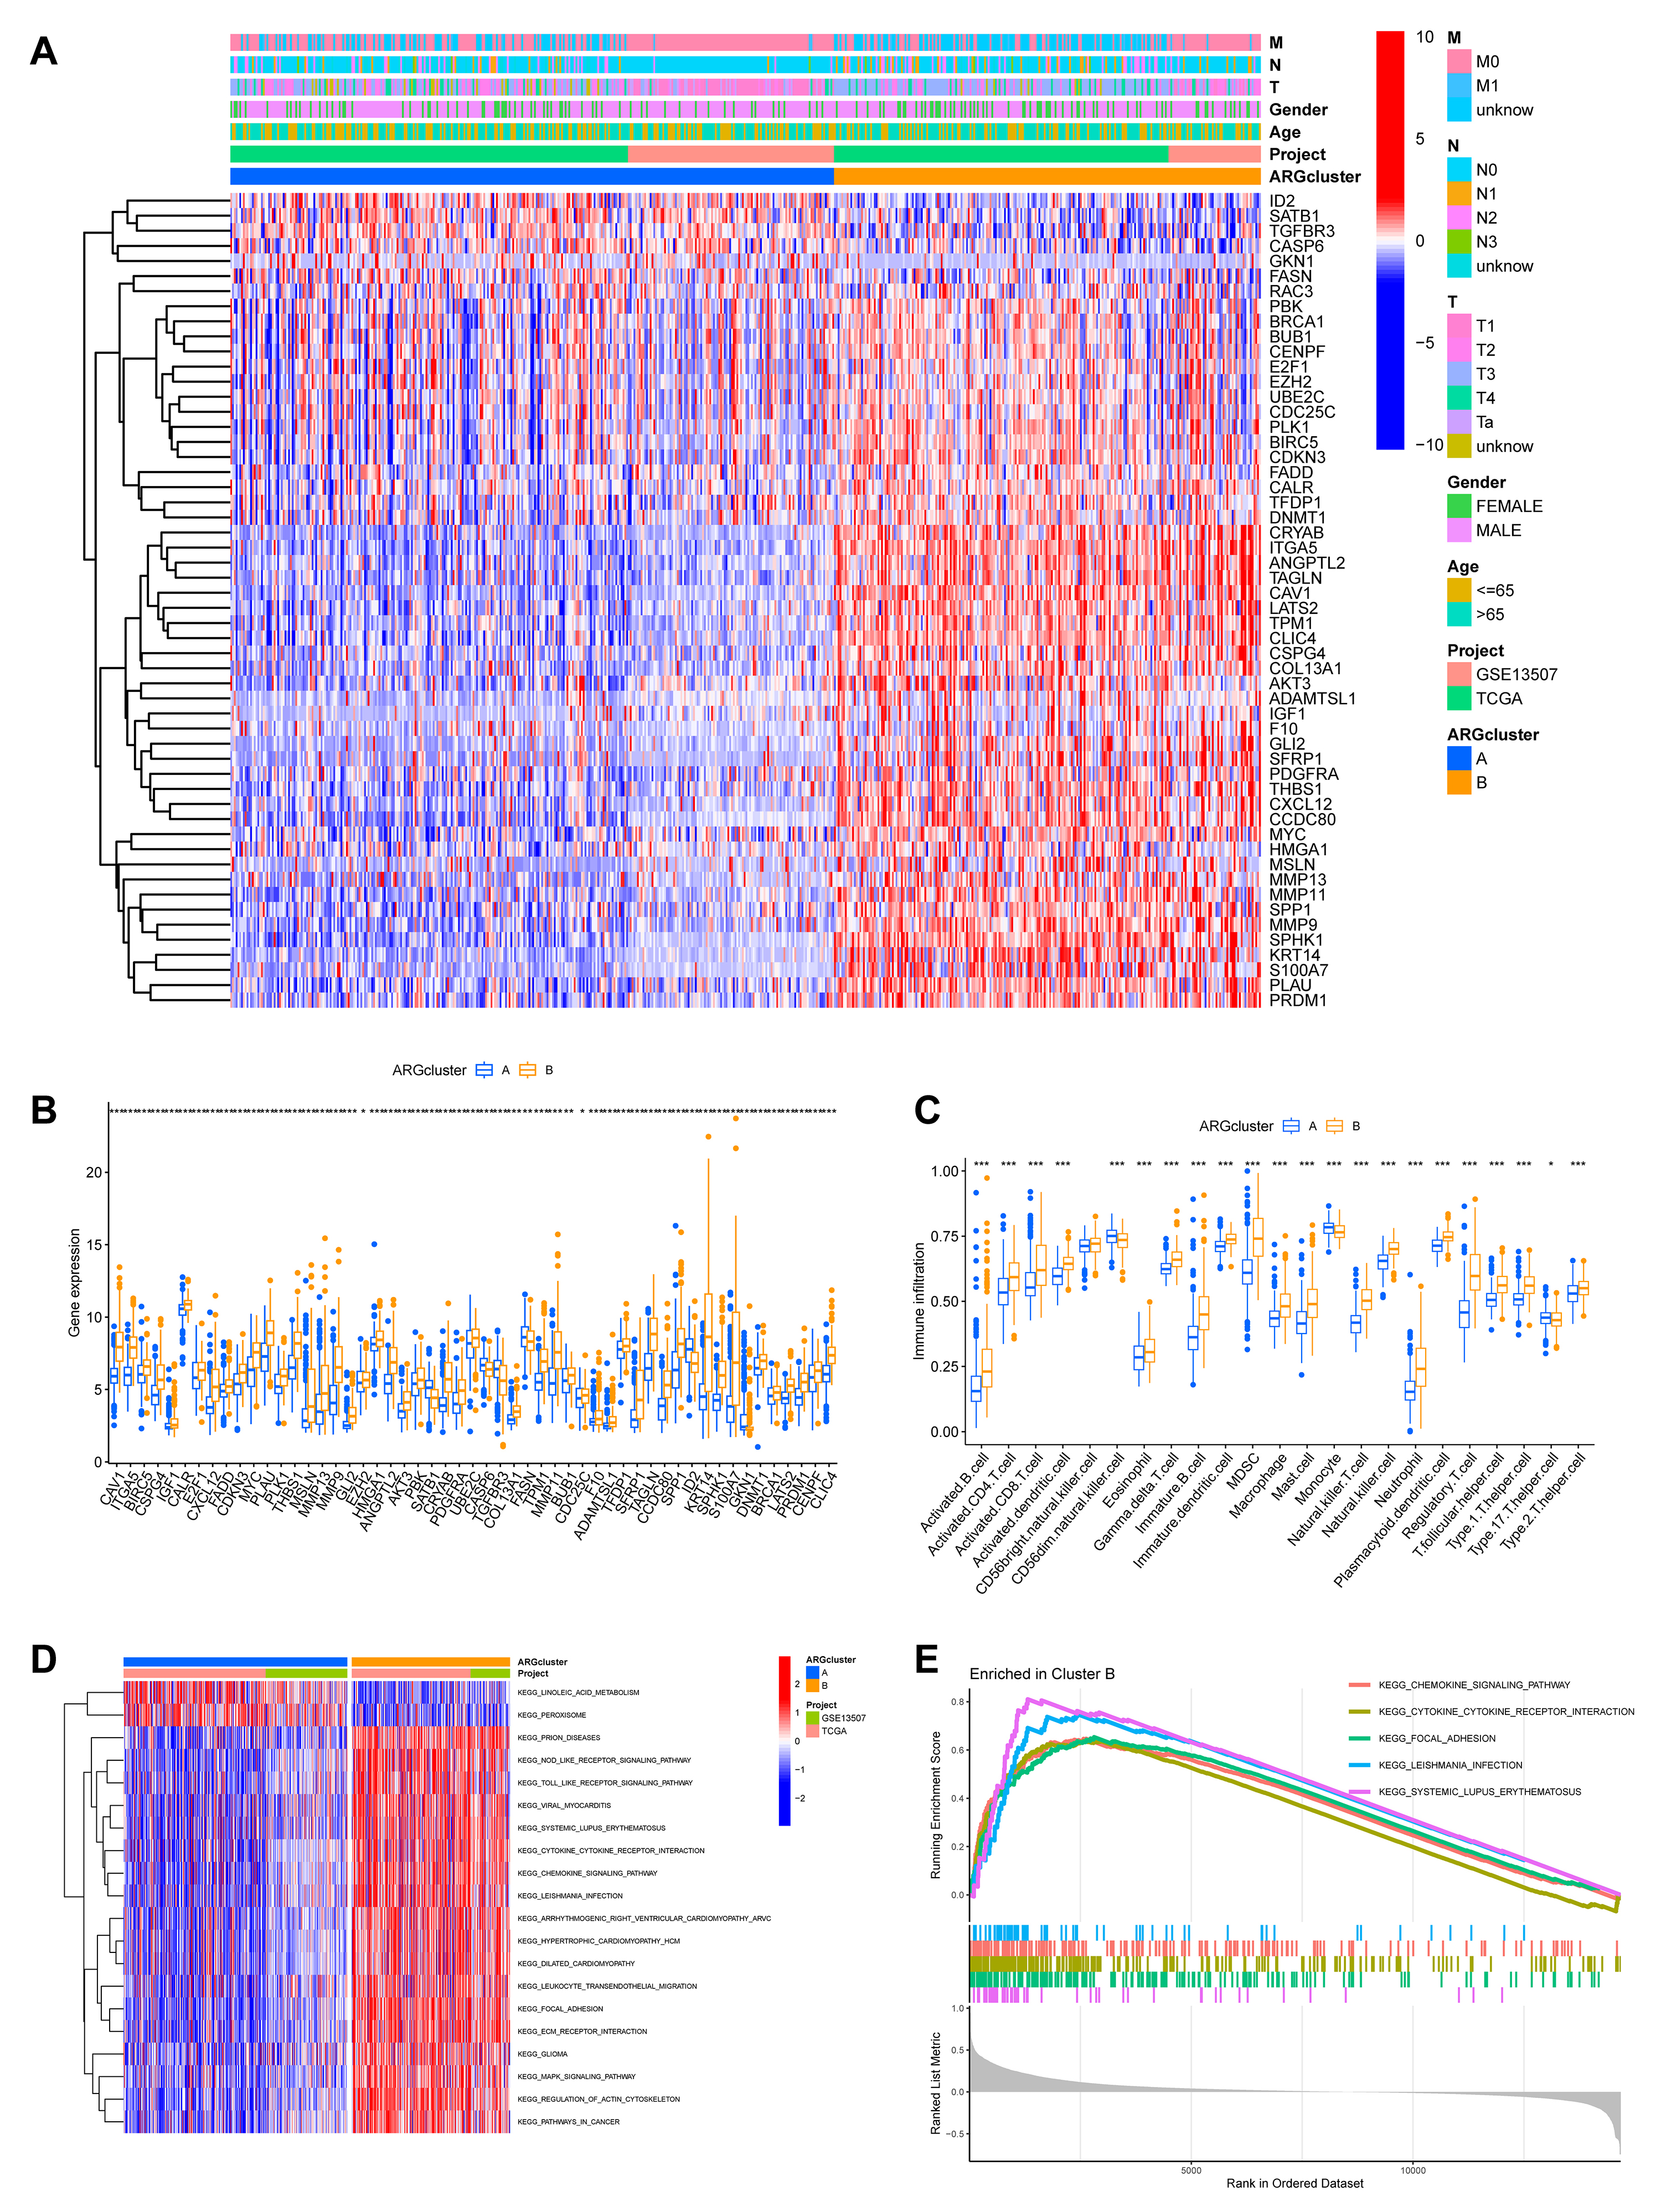 Fig. 4.
Functional and immunological characterization of the ARG-defined
molecular subtypes. (A) A heatmap was generated to visualize the differential
expression patterns of the 54 ARGs across the two identified molecular subtypes,
annotated with corresponding clinicopathological characteristics. (B) Boxplots comparing the expression levels of the prognostic ARGs
between the two molecular subtypes. (C) Comparison of the relative abundance of
infiltrating immune cell populations in the two subtype clusters. (D) Results of
GSVA showing significantly enriched KEGG pathways in ARGcluster B, including
“focal adhesion”, “regulation of actin cytoskeleton”, and “ECM receptor
interaction”. (E) GSEA plot depicting the top five most significantly enriched
pathways associated with ARGcluster B (*p
To elucidate the underlying biological functions driving these differences, we conducted Gene Set Variation Analysis (GSVA) for KEGG pathways. This revealed that ARGcluster B, the group with worse outcome, was significantly enriched in pathways critical for tumor invasion and metastasis, such as “focal adhesion”, “regulation of actin cytoskeleton”, and “ECM receptor interaction” (Fig. 4D). These pathways are central to cell-matrix adhesion and migration, and their upregulation strongly suggests that cells in this subtype have enhanced capabilities for resisting anoikis and invading surrounding tissues. GSEA further corroborated these findings, identifying “CHEMOKINE_SIGNALING_PATHWAY” and “CYTOKINE_CYTOKINE_RECEPTOR_INTERACTION” among the top five enriched pathways in ARGcluster B (Fig. 4E; Supplementary Table 5). This molecular profile provides a strong mechanistic rationale for the poor prognosis observed in this patient subgroup.
To construct a robust prognostic model, the entire patient cohort was randomly partitioned into a training set and a test set. LASSO Cox regression analysis of the training dataset identified the most effective prognostic genes. This process yielded a 10-gene signature, which we named the ARGmodel, consisting of IGF1, CALR, E2F1, MYC, PLK1, SATB1, FASN, ID2, RAC3, and GKN1 (Fig. 5A,B). For each patient, a risk score was computed using the expression levels of these signature genes weighted by their corresponding coefficients (Supplementary Table 6).
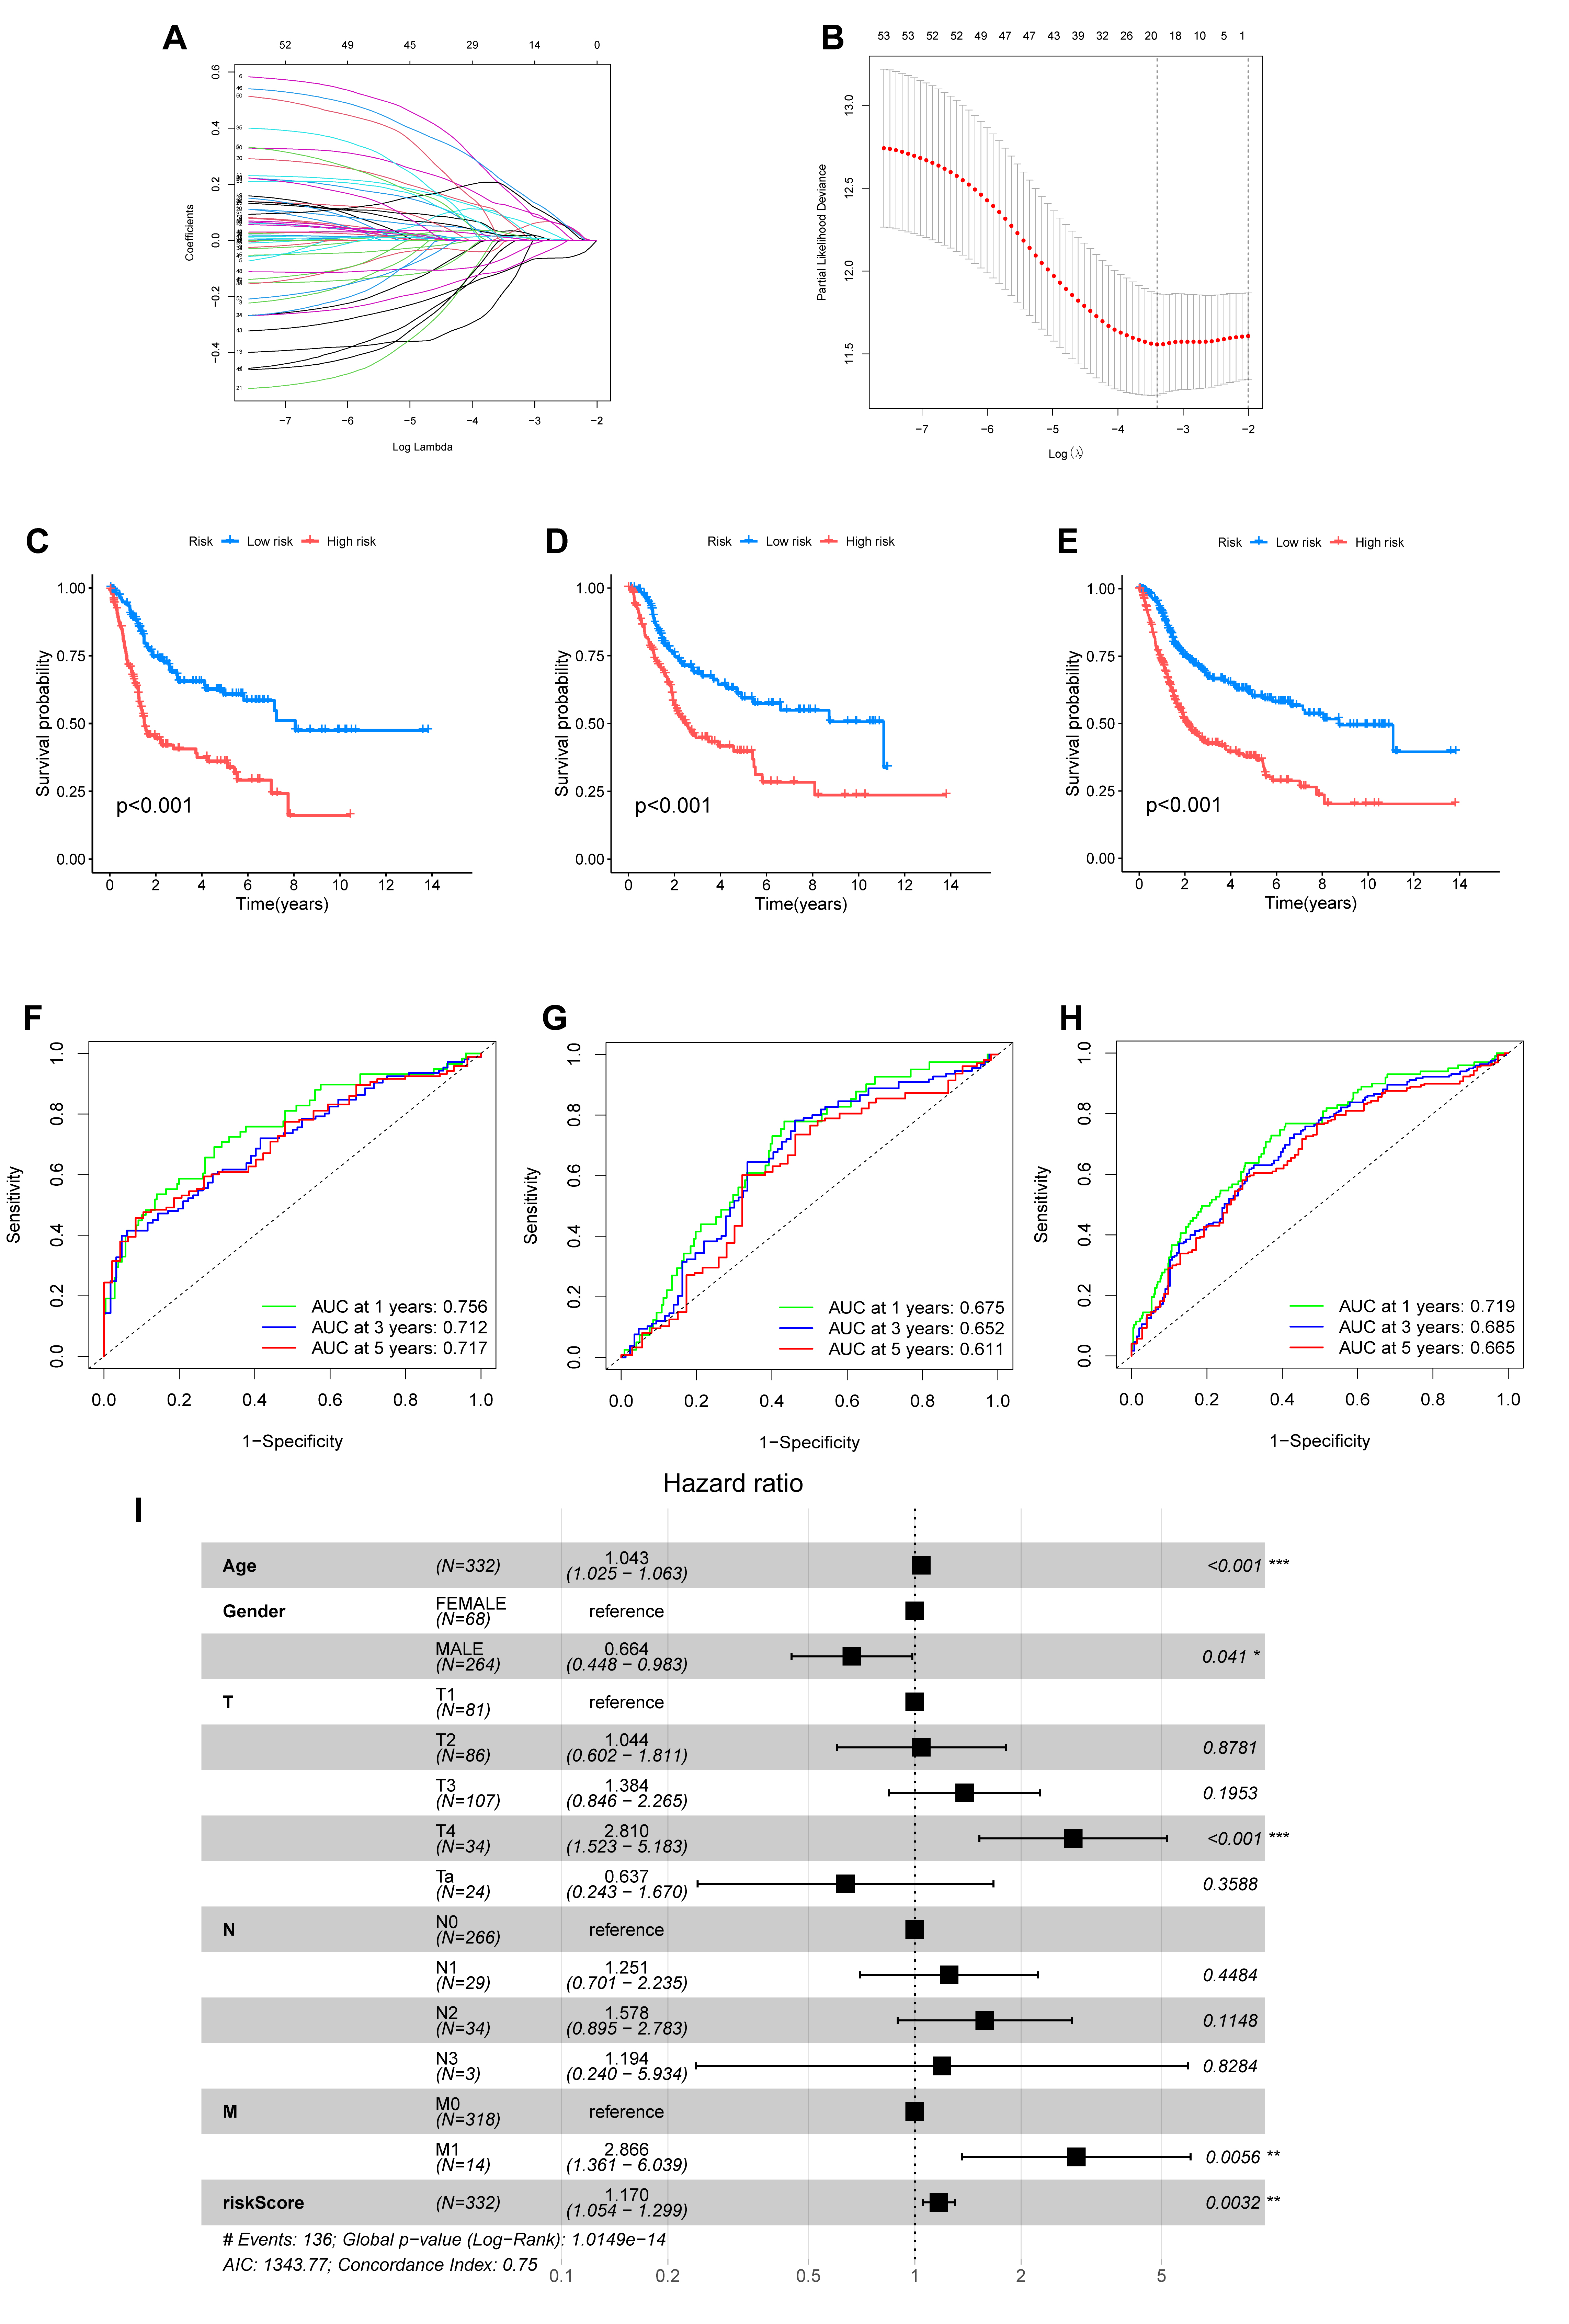 Fig. 5.
Development and validation of a prognostic signature based on
anoikis-related genes (ARGmodel). (A,B) LASSO regression analysis for the
selection of optimal prognostic genes. (A) Tuning parameter (lambda) selection
via cross-validation. (B) LASSO coefficient profiles of the selected ARGs. (C–E)
Kaplan-Meier survival curves comparing overall survival between two groups
stratified by the ARGmodel in the training set (C), test set (D), and entire
cohort (E). (F–H) Time-dependent Receiver Operating Characteristic (ROC) curves
assessing the predictive accuracy of the ARGmodel for 1-, 3-, and 5-year overall
survival in the training set (F), test set (G), and entire cohort (H). AUC values
are indicated in the plots. (I) Forest plot of results from multivariate Cox
regression analysis evaluating the independent prognostic value of the ARGmodel
risk score. *p
We then rigorously validated the prognostic performance of the ARGmodel.
Kaplan-Meier analysis revealed the model successfully stratified patients into
high- and low-risk categories with markedly different OS. This significant
stratification was observed in the training set (p
We then visualized the characteristics of this signature. A heatmap illustrates the expression profiles of the 10 hub ARGs across patients sorted by risk score (Fig. 6A). The risk scores were also significantly different between the previously identified molecular subtypes (Fig. 6B). Finally, an alluvial diagram was generated to visualize the dynamic relationships between the molecular clusters, the ARGmodel risk stratification, and patient survival status (Fig. 6C).
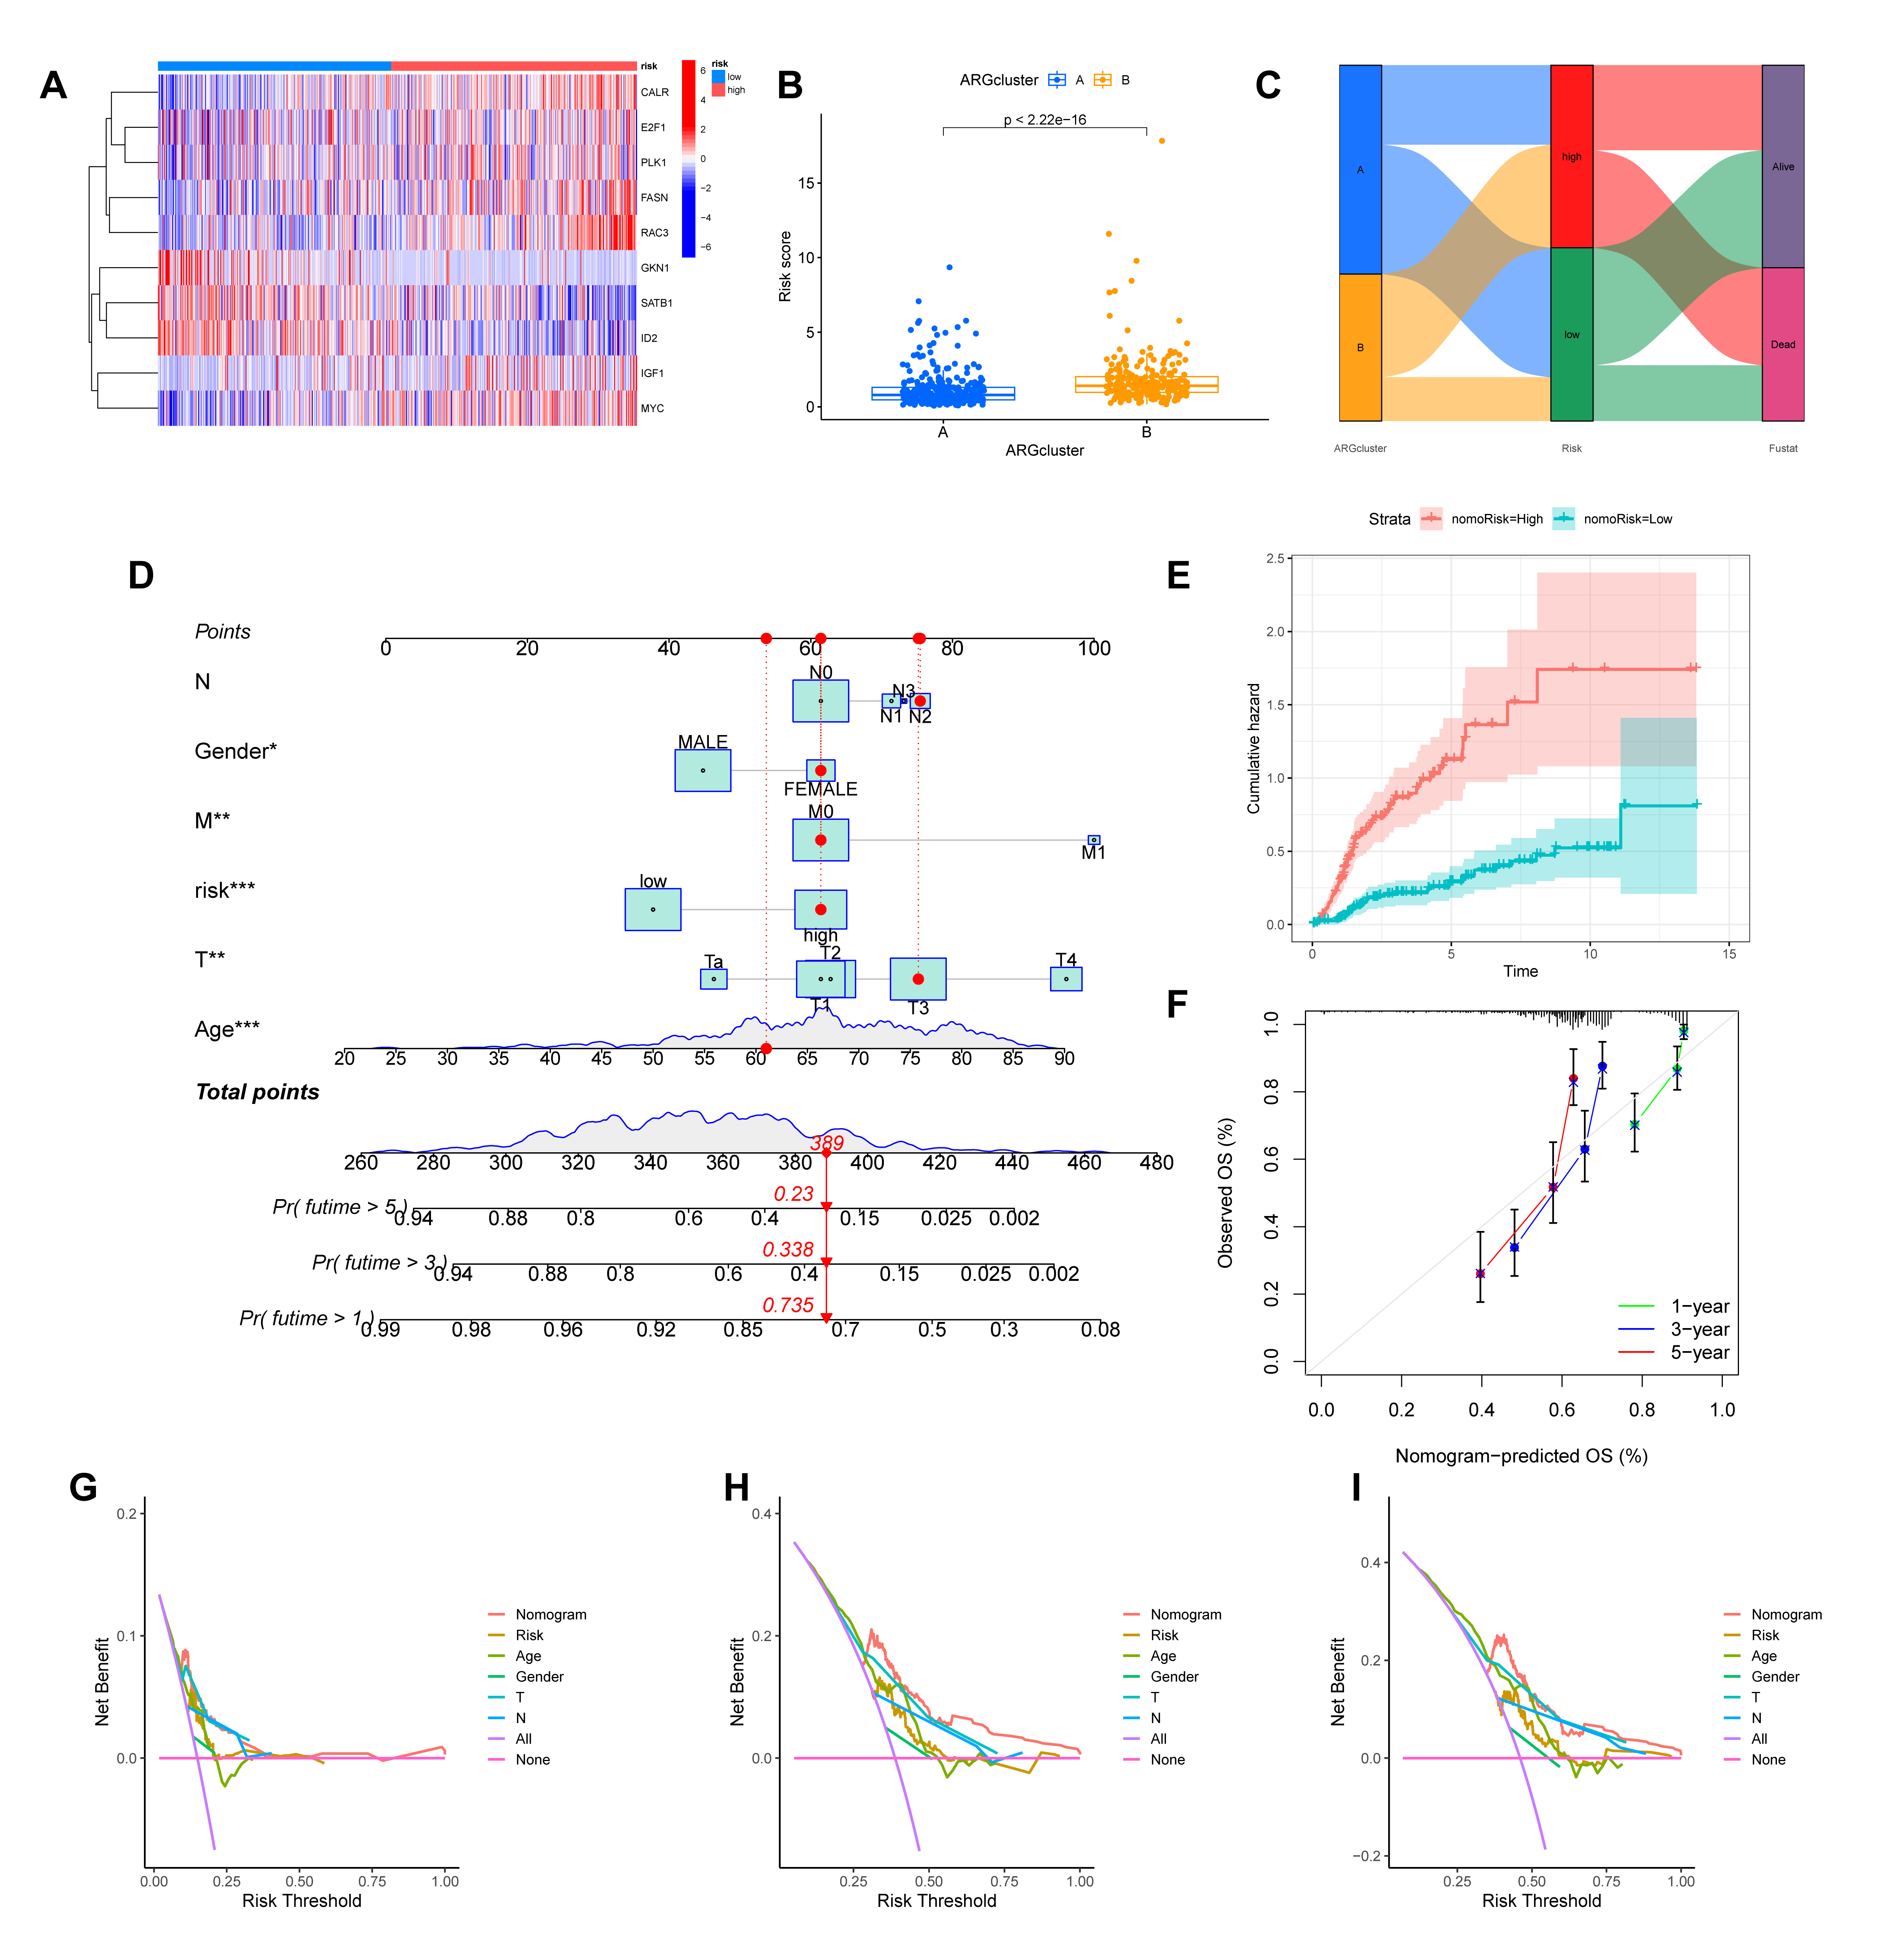 Fig. 6.
Evaluation of the ARGmodel and construction of a clinically
applicable prognostic nomogram. (A) Heatmap illustrating the expression profiles
of the 10 model ARGs in patients stratified by risk score. (B)
Comparison of risk scores between the two previously identified molecular
subtypes (ARGcluster A and B). (C) Alluvial diagram visualizing the relationship
between molecular subtypes, ARGmodel risk groups, and patient survival
status. (D) A prognostic nomogram developed by integrating the ARGmodel
risk score with clinicopathological features. (E) Cumulative hazard curves for
patients stratified by the nomogram-derived risk (nomoRisk). (F) Calibration plot
assessing concordance between the nomogram’s predicted survival probabilities and
actual observations. (G–I) Decision Curve Analysis (DCA) evaluating the clinical
net benefit of the nomogram for predicting 1- (G), 3- (H), and 5-year (I)
survival. *p
We constructed a nomogram that incorporates the ARGmodel risk score, along with significant clinicopathological factors, to improve the clinical applicability of our prognostic signature (Fig. 6D). Patients stratified by the nomogram-derived risk score (nomoRisk) showed distinct outcomes, with the high-risk group exhibiting a significantly higher cumulative hazard (Fig. 6E). The performance of the nomogram was rigorously evaluated. Calibration plots for 1-, 3-, and 5-year survival demonstrated excellent agreement between the nomogram-predicted probabilities and the actual observed outcomes, indicating high predictive accuracy (Fig. 6F). Furthermore, we performed Decision Curve Analysis (DCA) to assess its clinical value. For the prediction of 1-, 3-, and 5-year survival, the nomogram provided a greater net benefit across a wide range of threshold probabilities compared to treating all or no patients, confirming its potential as a valuable tool for clinical decision-making (Fig. 6G–I).
To elucidate the biological mechanisms underlying the prognostic significance of
our ARG-based signature, we investigated the tumor immune microenvironment (TME).
Deconvolution of immune cell fractions revealed significant differences between
the high- and low-risk groups. Notably, the high-risk group exhibited
significantly lower infiltration of CD8+ T cells (p = 0.043), alongside
higher infiltration of M0 macrophages (p = 0.011) and neutrophils
(p = 0.039) (Supplementary Fig. 1A). The depletion of cytotoxic
CD8+ T cells in high-risk patients suggests a suppressed anti-tumor immune
status, potentially leading to poorer response to immunotherapy. Direct
correlation analysis further confirmed that the riskScore was positively
associated with abundance of M0 macrophages (p = 0.0017) and neutrophils
(p = 0.036) (Supplementary Fig. 1D,E). Notably, the high-risk
group, which corresponds to high MYC expression, exhibited a distinct
immune profile. Significant positive correlations were observed with
pro-inflammatory cells such as neutrophils, activated memory CD4+ T cells, and
activated mast cells (Supplementary Fig. 1B,C). This suggests the
presence of an active, yet potentially ineffective, inflammatory response.
Intriguingly, the high-risk group showed significant negative correlations with
regulatory T cells (Tregs) and naive B cells (Supplementary Fig. 1B,C).
The reduction in Tregs is counterintuitive to typical immunosuppressive models,
but may indicate a state of immune chaos or exhaustion where standard regulatory
feedback loops are disrupted. Differences in ESTIMATE scores also supported these
findings (Supplementary Fig. 1F). A correlation analysis between
MYC and CD274 (the gene encoding PD-L1) expression in the
TCGA-BLCA cohort revealed a significant positive correlation
(Supplementary Fig. 1G) (Pearson correlation, R = 0.3, p = 8.5
To pinpoint the cellular origins of the signature ARGs, we leveraged the public single-cell RNA-sequencing dataset BLCA_GSE145281 from the TISCH database. This dataset comprises 17 distinct cell clusters within the BC TME (Supplementary Fig. 2A). At single-cell resolution, the expression levels of 7 of the 10 signature genes were successfully mapped. This analysis revealed highly specific expression patterns. For instance, CALR was predominantly expressed in B cells and NK cells, while MYC expression was concentrated in B cells and CD4+ T cells (Supplementary Fig. 2B,C). These findings provide granular detail on which cell types contribute to the ARG signature. The expression of MYC within CD4+ T cells is particularly intriguing, as it may drive their differentiation towards pro-tumorigenic subsets like Tregs or Th17 cells, further contributing to the immunosuppressive microenvironment [20].
Finally, we explored the potential of the ARGmodel to predict therapeutic response in BC. By estimating the sensitivity to a panel of clinical drugs, distinct response patterns were observed between the high- and low-risk groups (Fig. 7). This analysis indicates the risk stratification system based on our 10-ARG signature (IGF1, CALR, E2F1, MYC, PLK1, SATB1, FASN, ID2, RAC3, and GKN1) could potentially guide treatment selection. The pathways regulated by these genes appear to be linked to differential drug sensitivity, marking them as promising targets for the development of personalized therapeutic strategies in BC. We posit that a subset of ARGs may act as valuable biomarkers for OS in BC, and as actionable targets for therapeutic intervention.
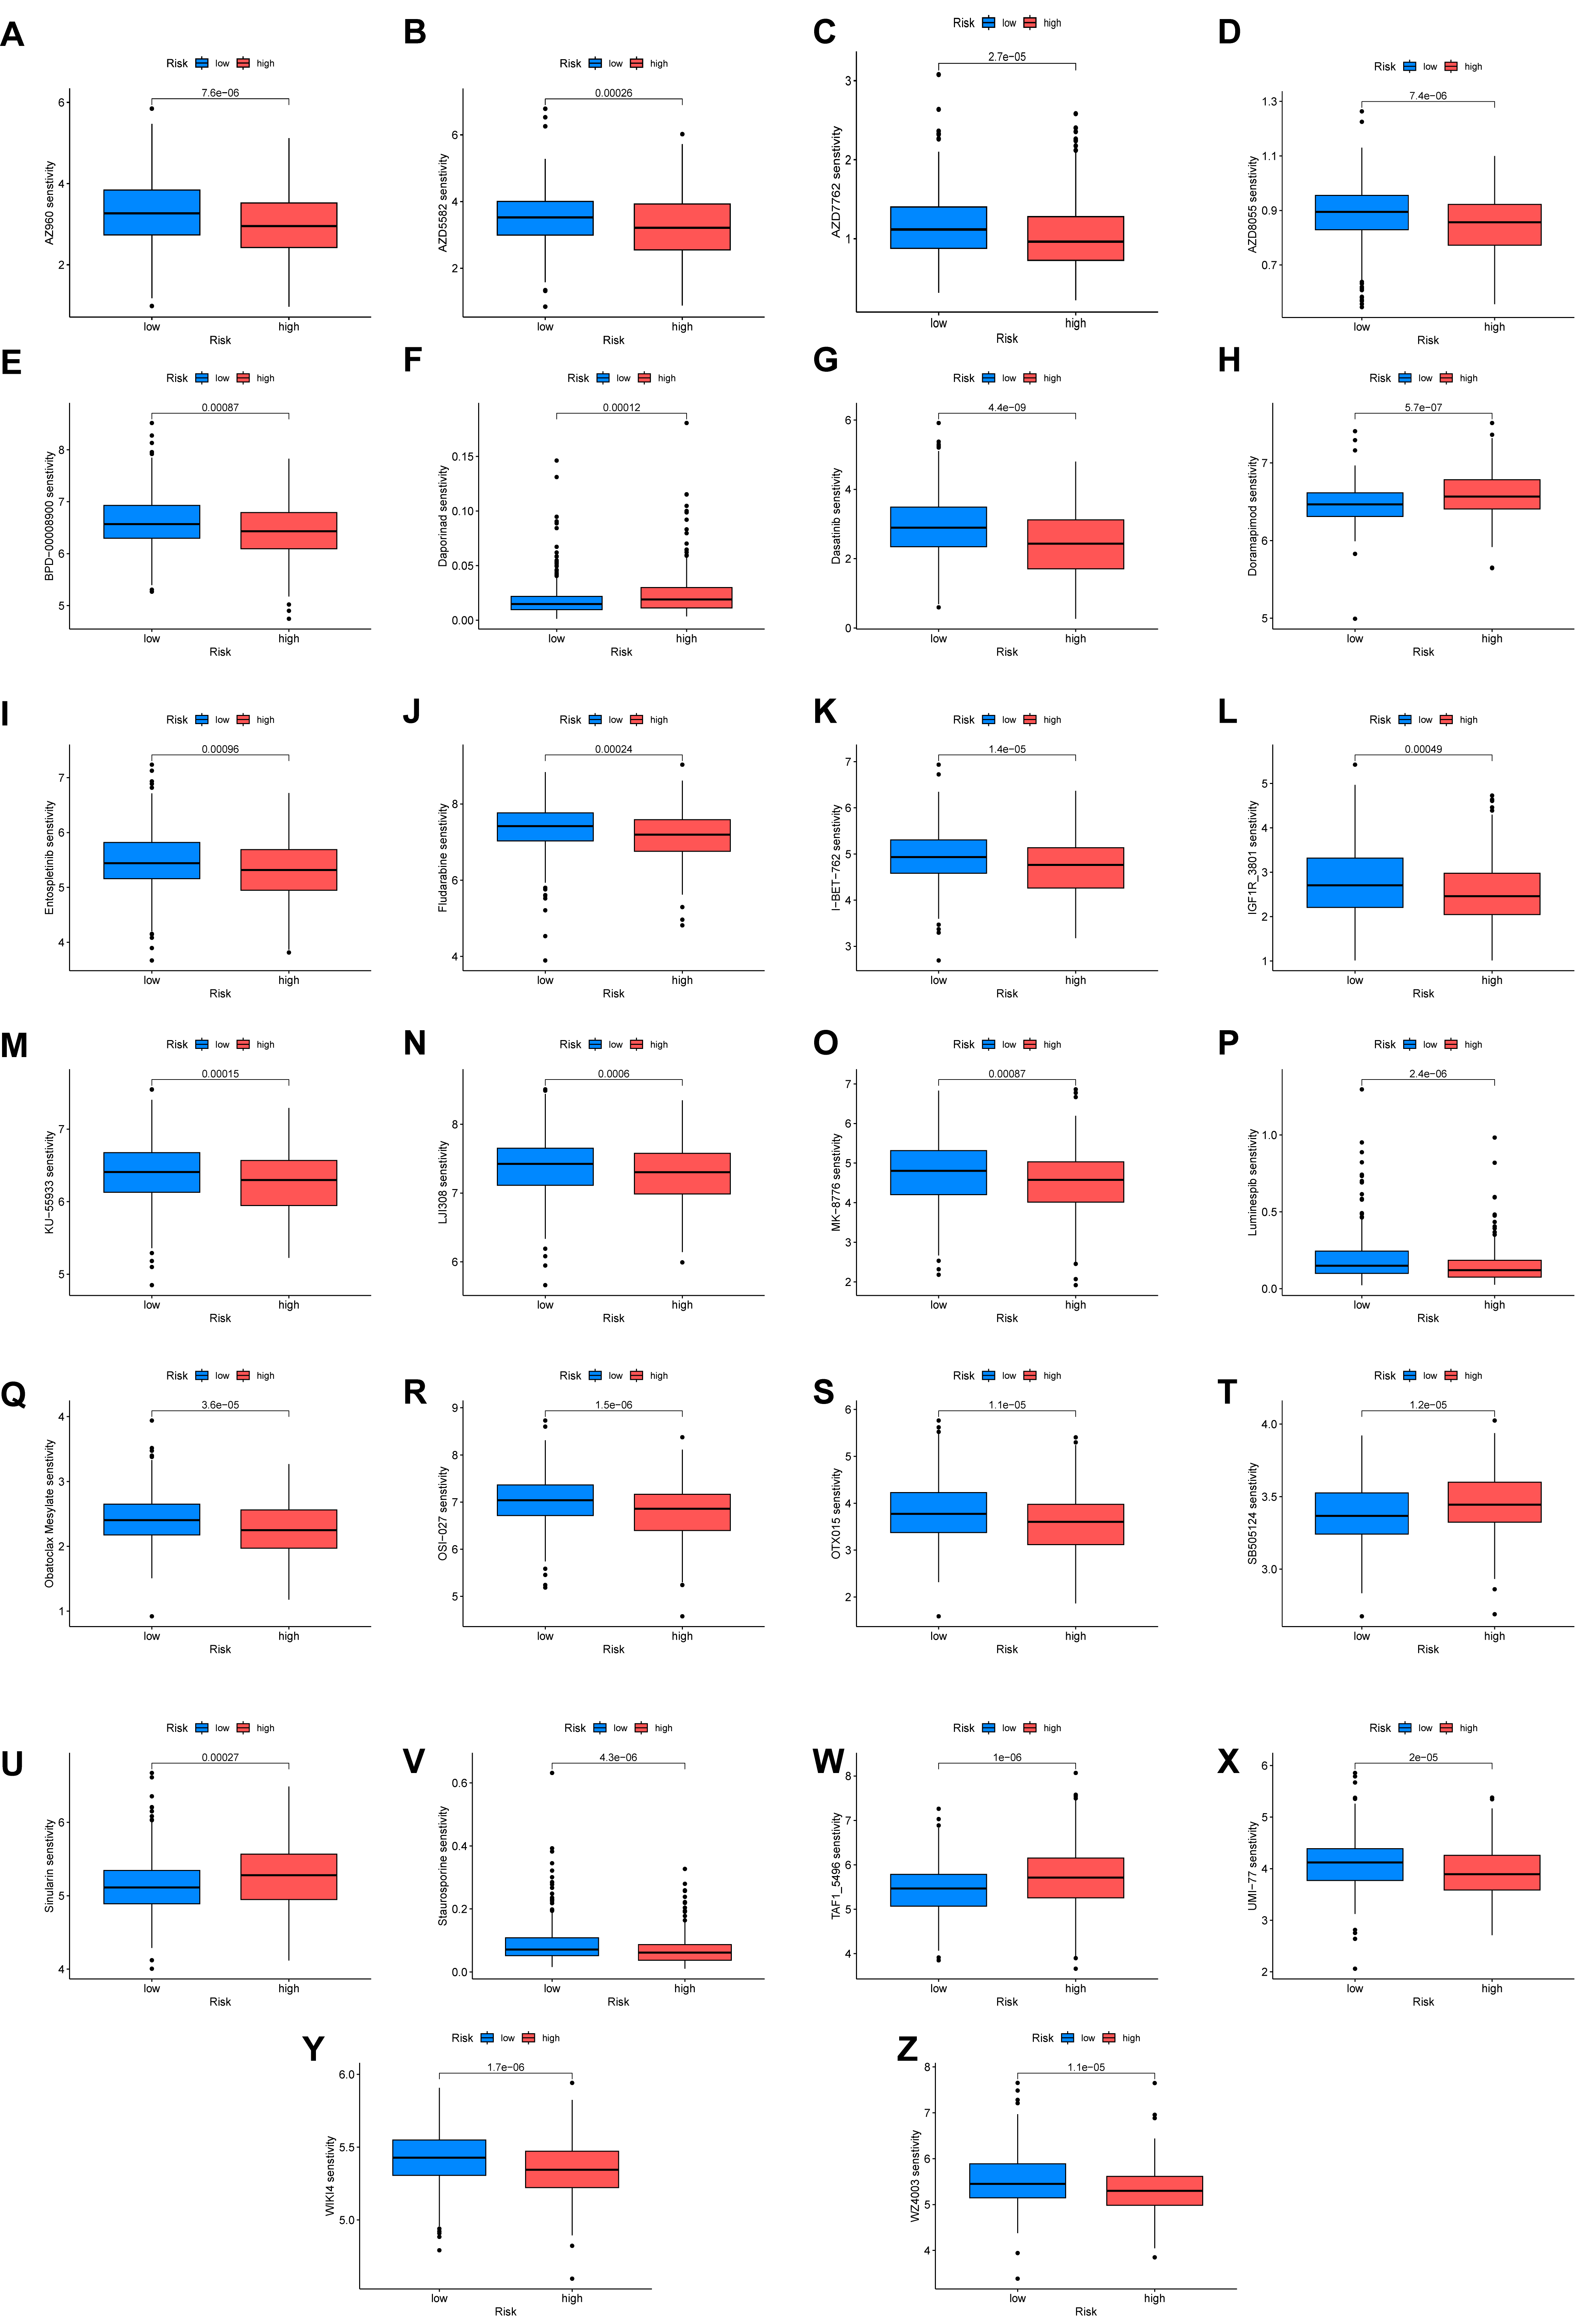 Fig. 7.
Differential drug sensitivity analysis between high- and low-risk groups. (A–Z) Response patterns to different clinical drugs between high-risk and low-risk groups.
We next employed a multi-step approach to identify a key driver in our prognostic signature. First, a PPI network was constructed using the STRING database to investigate functional connections among the 54 differentially expressed ARGs with prognostic significance. Subsequent analysis with Cytoscape identified MYC as the principal hub gene within this network based on its high degree of connectivity (Fig. 8A). This network centrality suggests a pivotal regulatory role for MYC. The top 10 hub genes ranked by score are detailed in Supplementary Table 7.
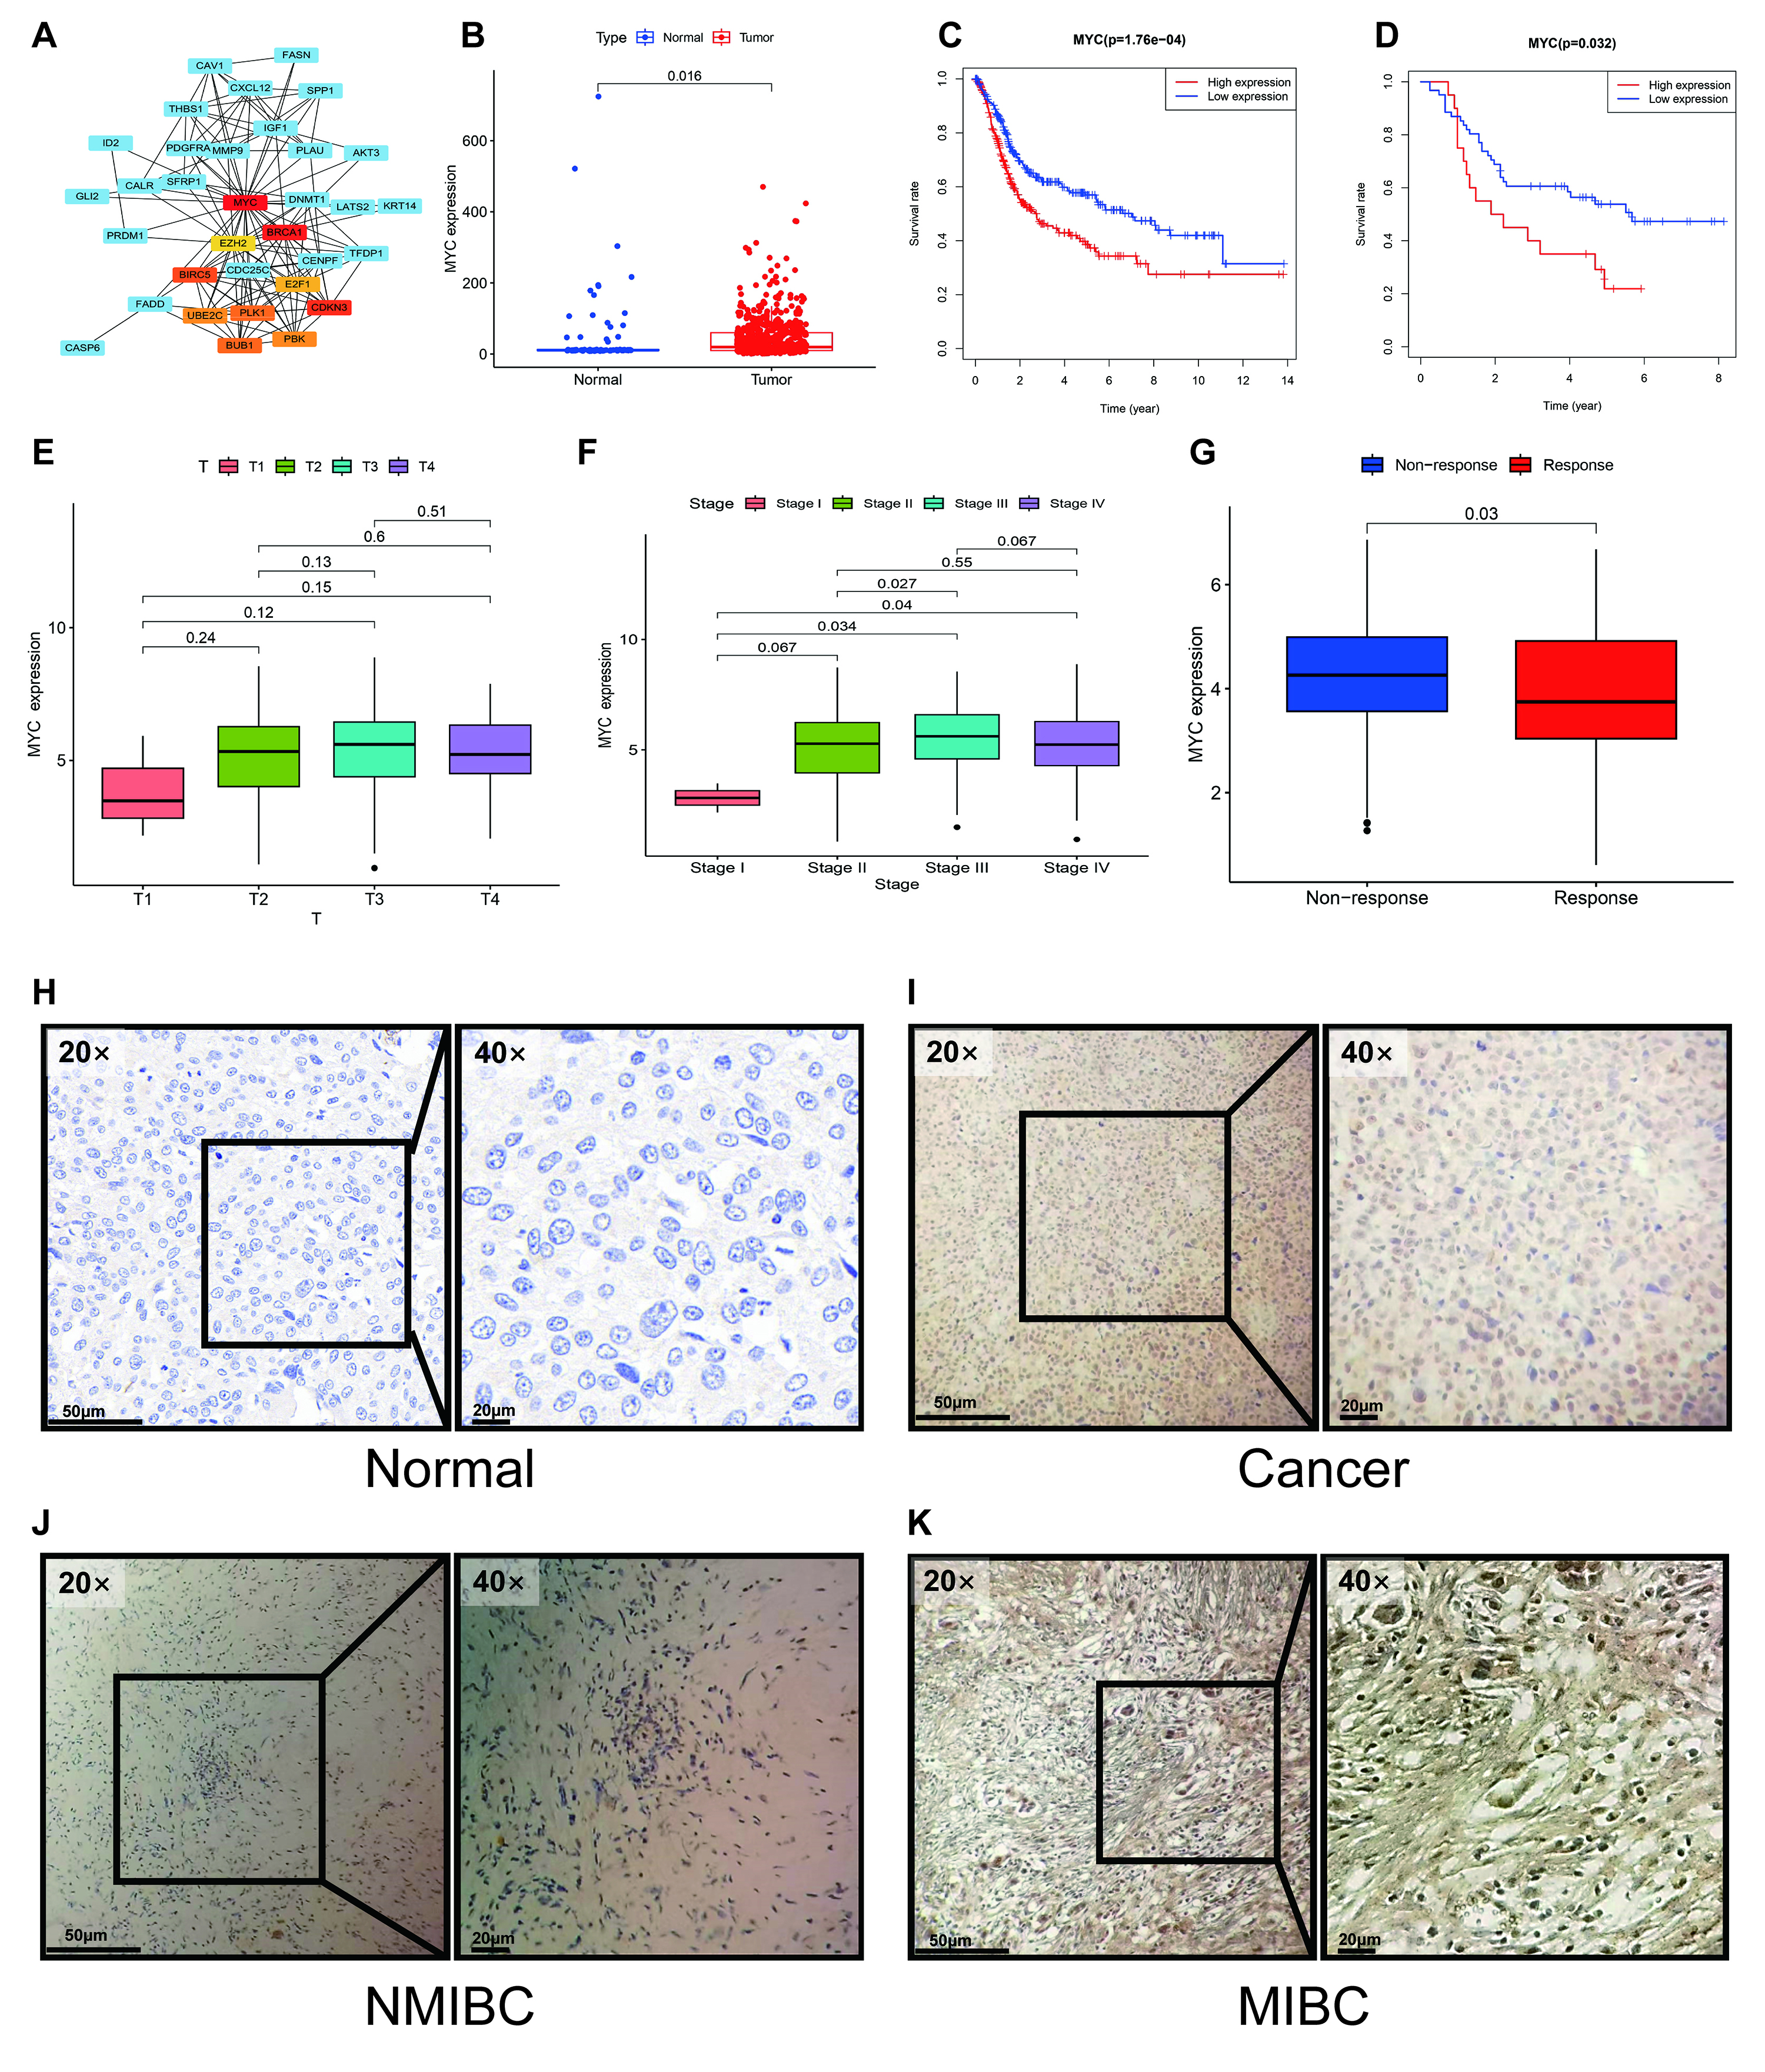 Fig. 8.
Identification of MYC as a key hub gene and validation
of its prognostic and clinical significance. (A) PPI network analysis identified
MYC as a central hub gene. (B) MYC expression was significantly elevated
in tumor tissues compared to normal tissues in both the TCGA-BLCA and GSE13507
cohorts. (C,D) Kaplan-Meier analysis demonstrated that high MYC expression was
consistently correlated with poorer overall survival in public cohorts (C). This
was confirmed in our independent GXMU-BC cohort (D). (E,F,J,K) MYC expression was
significantly higher in MIBC than in non-MIBC, a finding observed at both the
transcriptomic (E,F) and protein (J,K) levels. (G) In the IMvigor210 cohort, high
MYC expression was associated with a diminished response to
immunotherapy (Response: CR/PR; Non-response: SD/PD). (H,I) Representative
immunohistochemistry images confirm upregulation of MYC protein expression in
GXMU-BC tumor tissues. Scale bars: 50 µm (20
We proceeded to validate the clinical and prognostic relevance of MYC
using the TCGA-BLCA and GSE13507 cohorts, confirming its unique position among
the signature genes. MYC emerged as a pivotal factor among the
identified hub genes. In the TCGA cohort, MYC was significantly
upregulated in BC tissue compared to normal controls (p = 0.016, Fig. 8B), and its elevated expression was strongly predictive of unfavorable OS
(p = 1.76
Crucially, MYC was linked to key features of clinical aggressiveness, with high MYC expression being associated with advanced tumor stage and MIBC (Fig. 8E,F). Furthermore, analysis of the IMvigor210 immunotherapy cohort revealed that high MYC expression correlated with a significantly poorer response to immune checkpoint blockade (p = 0.03), suggesting a role in immunotherapy resistance (Fig. 8G). This combination of network centrality, robust prognostic power, and strong association with both tumor invasion and immunotherapy failure provided a compelling rationale for focusing on MYC as a key regulator.
At the protein level, IHC analysis of our 81 GXMU-BC patient samples confirmed aberrant MYC expression in 74% (60/81) of BC tissues (Fig. 8H–K). To further assess MYC as a predictive biomarker, we investigated its association with outcomes from ICI therapy. In two separate cohorts of 43 and 38 ICI-treated BC patients, a significant link was observed between MYC expression and clinical response. Specifically, patients with high MYC expression were significantly less likely to achieve a clinical response (Complete/Partial Response) compared to those with low MYC expression (p = 0.044 and p = 0.036 for the two cohorts, Fisher’s exact test). This finding indicates that MYC may be a potential biomarker for identifying patients who are resistant to ICI therapy (Tables 2,3).
Therapies targeting the PD-1/PD-L1 axis have become a pivotal treatment modality for advanced BC, addressing the historically poor prognosis and high recurrence rates associated with this disease [21, 22, 23, 24]. Immunotherapies offer significant survival advantages, potentially transforming the therapeutic landscape for patients with advanced or metastatic BC. However, immunotherapy for BC still has shortcomings such as low treatment response rate and a lack of relevant biomarkers [25]. Therefore, it is very important to find relevant biomarkers in BC that could help to diagnose this tumor type and predict metastasis, recurrence, and response to immunotherapy.
The ECM constitutes a dynamic microenvironment whose components provide crucial signals that regulate tumor growth and metastasis [26, 27]. A key homeostatic mechanism, anoikis, is a form of programmed cell death that is triggered when cells lose their anchorage to the ECM, thereby preventing the survival and colonization of aberrant cells [28, 29]. Consequently, the acquisition of resistance to anoikis is a hallmark of metastatic cancer cells, permitting their survival during transit in the circulatory system [30]. To achieve this, detached tumor cells employ survival strategies, such as autocrine and paracrine signaling, which sustain them until they can re-establish adhesion and invade distant tissues [31, 32]. While anoikis has been associated with gastric cancer, prostate cancer, and hepatocellular carcinoma [33, 34, 35], its role in BC has not yet been evaluated. In the current research, we constructed a novel ARG-based prognostic prediction signature for BC patients. Our findings underscore the prognostic relevance of our ARG-based model in BC, which effectively captures anoikis resistance patterns across diverse patient profiles.
The strong correlation between the risk score from our model and clinical outcomes indicates these ARGs are strongly implicated in the pathogenesis of BC [36, 37]. A PPI network was constructed to elucidate the functional interplay among the prognostic set of ARGs. This analysis identified MYC, an established oncogene, as a key regulatory hub. Our rationale for highlighting MYC is multifaceted. Not only was it the top-ranked hub gene in the network analysis, it was also a core component of our validated 10-gene signature, with its expression consistently correlated with poor prognosis, advanced tumor stage, and immunotherapy resistance across multiple cohorts. This convergence of evidence strongly suggests that MYC is a central driver of the malignant phenotype captured by our model.
A critical question is how MYC functionally mediates the anoikis-resistant and aggressive phenotype observed in high-risk BC. While MYC is a well-established oncogene, its specific role in the anoikis-BC axis is still an emerging area. MYC is a master transcriptional regulator that can orchestrate cellular programs conducive to the evasion of anoikis. For instance, MYC is known to drive metabolic reprogramming, particularly by increasing glutaminolysis, which provides detached cancer cells with the necessary energy and biosynthetic precursors to survive in anchorage-independent conditions [38, 39]. Furthermore, our GSVA results highlighted the enrichment of pathways like “focal adhesion” and “ECM receptor interaction” in the high-risk group. MYC can directly influence these pathways by regulating the expression of integrins and other adhesion molecules, thereby altering the cell’s interaction with its matrix and lowering the threshold for triggering anoikis [40, 41, 42]. Therefore, we hypothesize that MYC overexpression in BC rewires cellular metabolism and adhesion properties, conferring a potent survival advantage upon cell detachment and facilitating metastasis.
Beyond its role in anoikis, our findings linking high MYC expression to immunotherapy resistance warrant further investigation. MYC can profoundly shape the tumor immune microenvironment, often fostering an immunosuppressive, or “cold,” tumor landscape [43]. Overexpression of MYC has been shown to directly upregulate the expression of immune checkpoint ligands such as PD-L1 and the signal CD47, which help tumor cells evade T-cell and macrophage-mediated killing, respectively [44]. Moreover, MYC can orchestrate the secretion of cytokines like IL-23 and CCL2, which promote the polarization of tumor-associated macrophages towards an immunosuppressive M2 phenotype [45]. This aligns with our observation of higher M0 macrophage infiltration in the high-risk group, which may represent a precursor pool for M2 differentiation. Thus, MYC likely contributes to immunotherapy resistance in BC through a dual mechanism involving the direct arming of tumor cells with immune-evasive molecules, and the promotion of a non-permissive immune microenvironment.
Several limitations of the present study merit consideration. The retrospective nature of our analysis introduces the possibility of inherent selection bias and confounding variables. Furthermore, the cohort size was modest, particularly the patient subgroup that received immunotherapy, thus limiting the statistical power and generalizability of our findings regarding ICI response. Finally, our investigation was primarily focused on the expression and prognostic significance of MYC. The underlying molecular mechanisms by which MYC contributes to BC progression, metastasis, and the modulation of ICI response—initially suggested by our bioinformatics analysis—necessitate validation through future functional experiments.
In conclusion, our findings demonstrate the robust prognostic value and clinical utility of the novel ARG-based signature in BC. We posit that a subset of ARGs may be valuable biomarkers for predicting overall survival, as well as actionable targets for therapeutic intervention.
The TCGA-BLCA cohort dataset is available at The Cancer Genome Atlas (TCGA) website (https://xena.ucsc.edu/). The GSE13507 cohort dataset for this study is available at Gene Expression Omnibus (GEO) with accession number: GSE13507 (https://www.ncbi.nlm.nih.gov/geo/query/acc.cgi?acc=GSE13507). The datasets used and analyzed during the current study are available from the corresponding author on reasonable request.
Conceptualization, YZ and SPZ; Data curation, ZT and JP; Funding acquisition, SPZ; Project administration, SPZ; Resources, JP; Software, XYP and YFK; Supervision, YZ and SPZ; Validation, YZ and SPZ; Visualization, HSL and SCW; Writing — original draft, ZT and JP; Writing — review & editing, YZ and SPZ. All authors contributed to editorial changes in the manuscript. All authors read and approved the final manuscript. All authors have participated sufficiently in the work and agreed to be accountable for all aspects of the work.
Informed consent was acquired from all patients and the study was approved by the institutional review board of The First Affiliated Hospital of Guangxi Medical University (Approval No. 2024-K054-01) and conducted in accordance with Good Clinical Practice and the Declaration of Helsinki and its latest amendments.
We extend our sincere gratitude to all individuals who contributed to the preparation of this paper, including reviewers, and any individuals or institutions that provided support for this research.
This study was supported by Guangxi Zhuang Autonomous Region Health Commission scientific research project (No. Z20210478).
The authors declare no conflict of interest.
Supplementary material associated with this article can be found, in the online version, at https://doi.org/10.31083/FBL45386.
References
Publisher’s Note: IMR Press stays neutral with regard to jurisdictional claims in published maps and institutional affiliations.